Vehicular Air Pollution in Houston, Texas: An Intra-Categorical Analysis of Environmental Injustice

Abstract
:1. Introduction
2. Materials and Methods
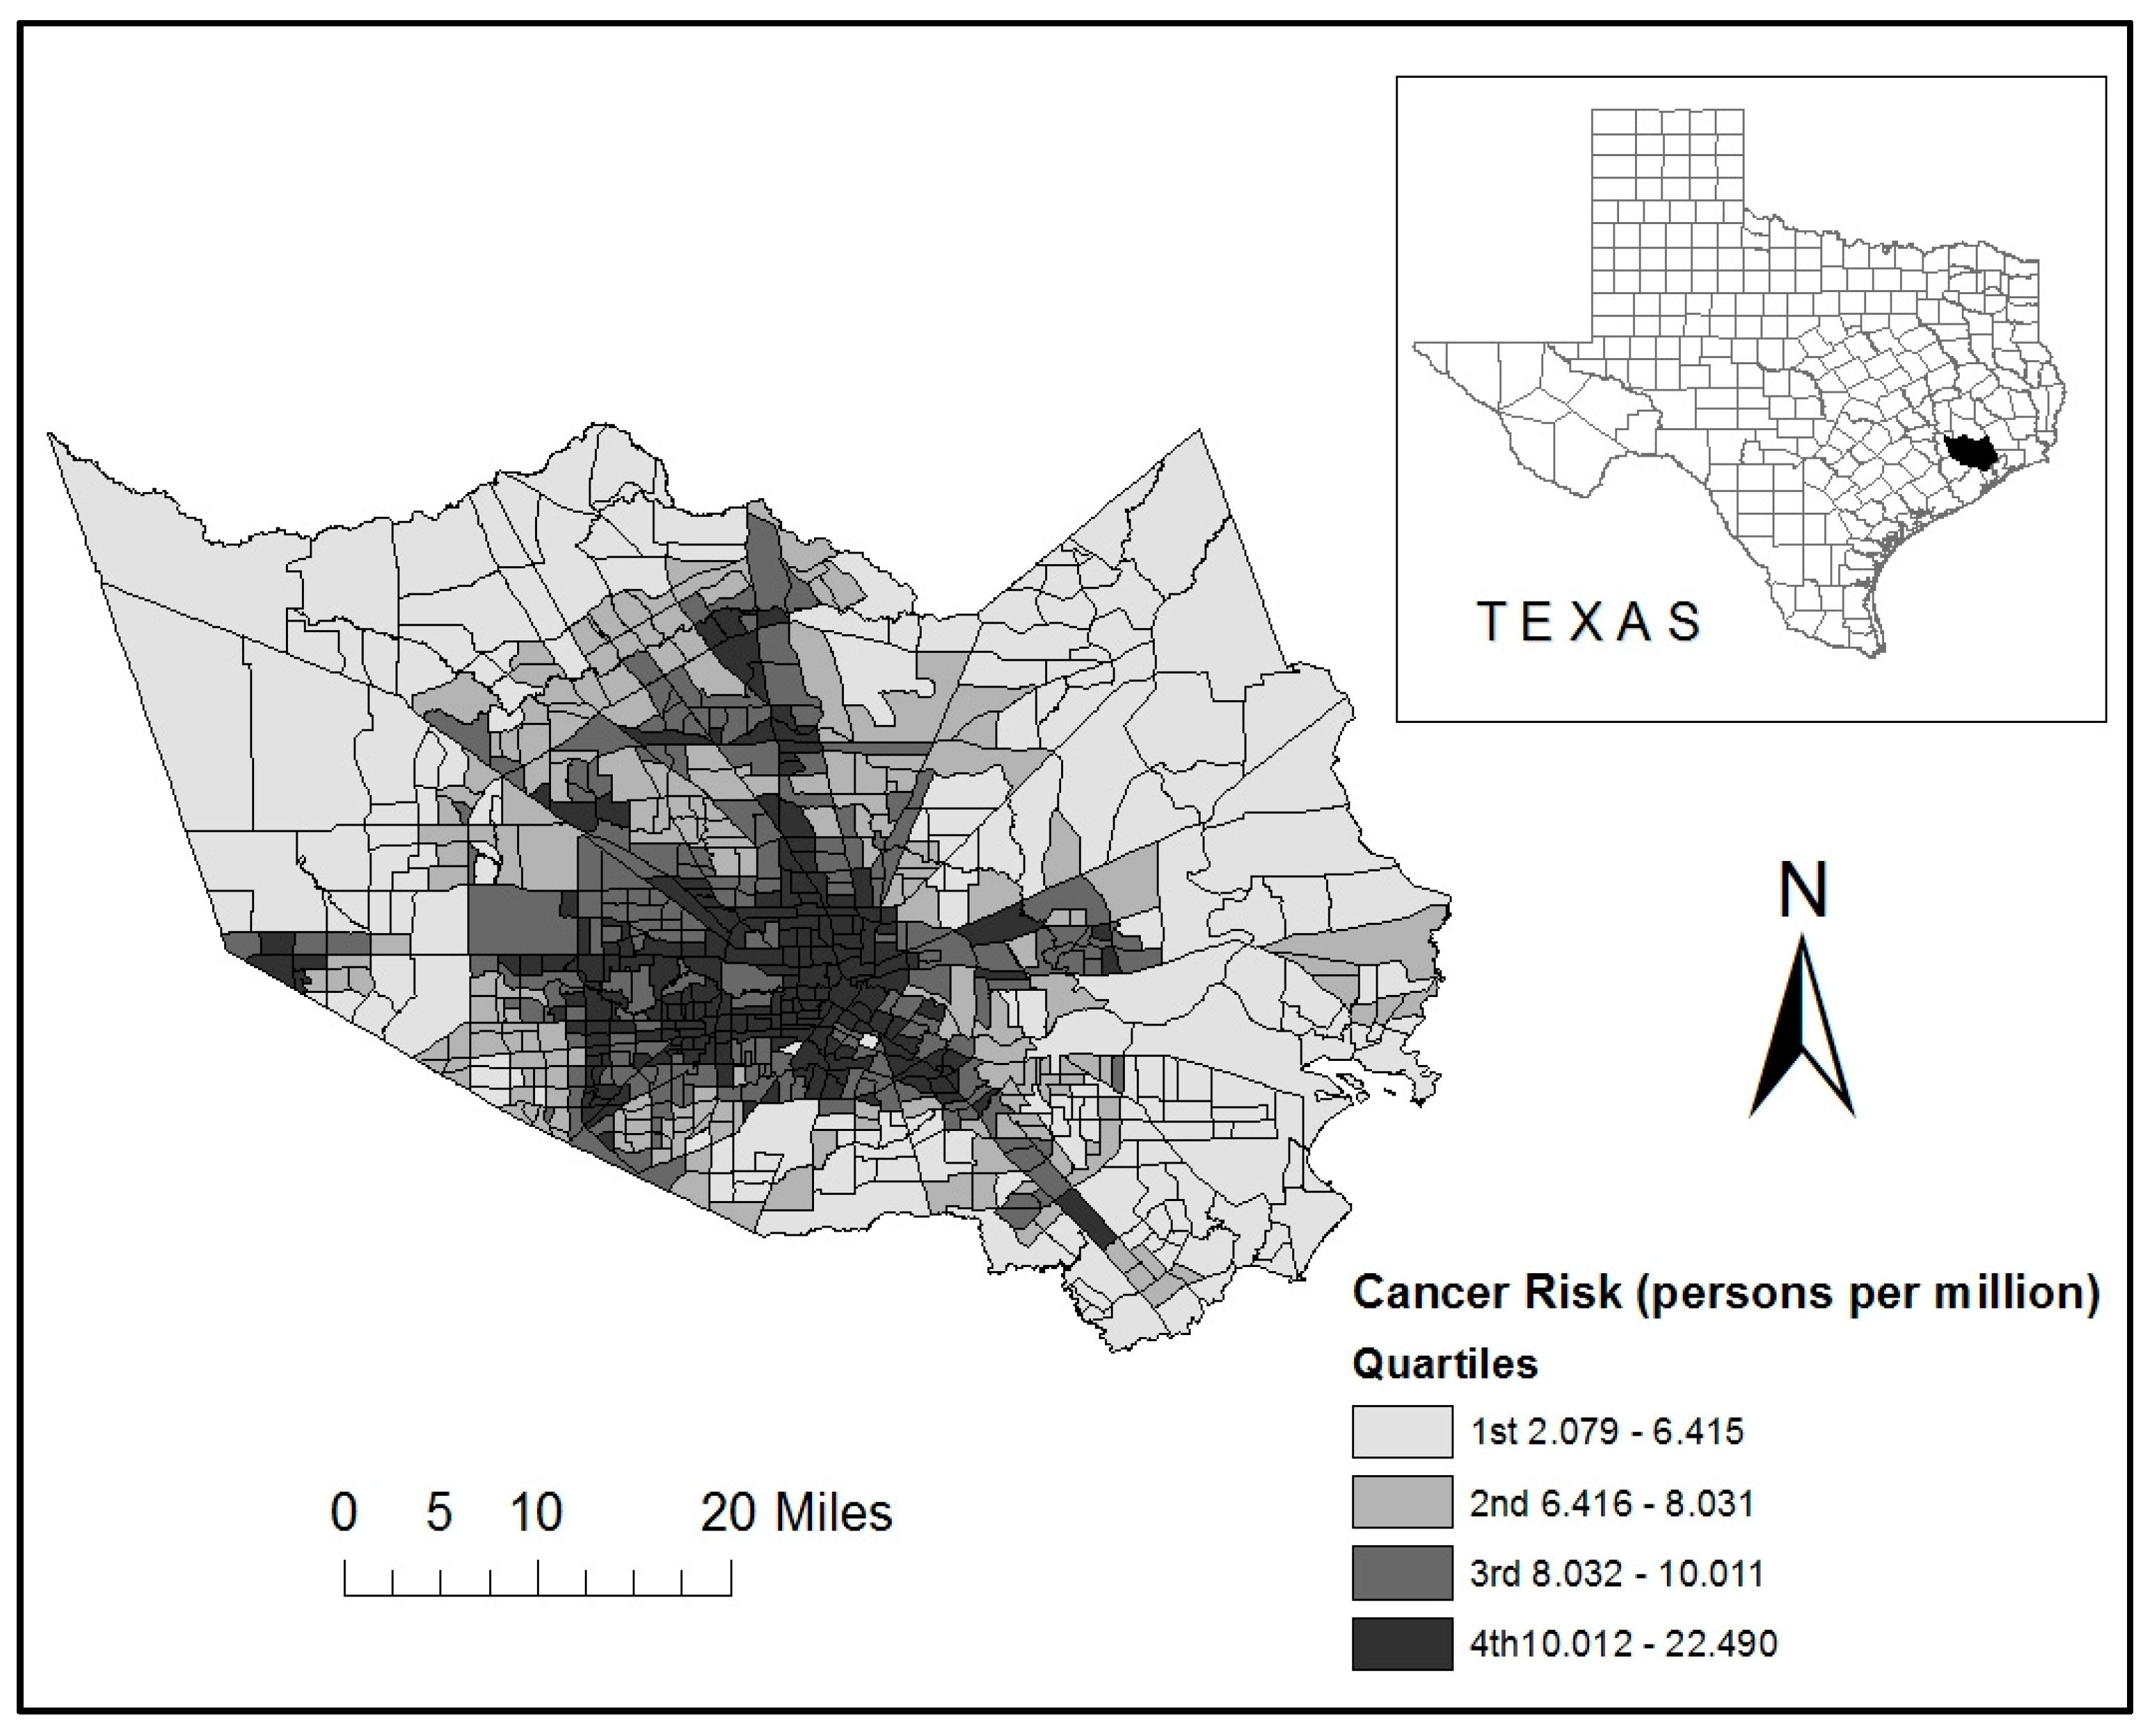
2.1. Study Area
2.2. Dependent Variable: Cancer Risks from On-Road Sources of Hazardous Air Pollutants
2.3. Independent Variables
2.4. Statistical Methodology
3. Results
3.1. Traditional EJ Analysis
3.2. Intra-Categorical EJ Analysis
4. Discussion
5. Conclusions
Author Contributions
Funding
Acknowledgments
Conflicts of Interest
References
- Mohai, P.; Bryant, B. Environmental racism: Reviewing the evidence. In Race and the Incidence of Environmental Hazards: A time for Discourse; Westview Press: Boulder, CO, USA, 1992; pp. 163–175. [Google Scholar]
- Liu, F. Equity analysis of air pollution. In Environmental Justice Analysis: Theories, Methods, and Practice; Lewis Publishers: New York, NY, USA, 2001; pp. 195–234. [Google Scholar]
- Chakraborty, J. Automobiles, air toxics, and adverse health risks: Environmental inequities in Tampa Bay, Florida. Ann. Assoc. Am. Geogr. 2009, 99, 674–697. [Google Scholar] [CrossRef]
- Walker, G. Breathing unequally: Air quality and inequality. In Environmental Justice: Concepts, Evidence, and Politics; Routledge: New York, NY, USA, 2012; pp. 104–126. [Google Scholar]
- Clark, L.; Millet, D.; Marshall, J. National patterns in environmental injustice and inequality: Outdoor NO2 air pollution in the United States. PLoS ONE 2014, 9, e94431. [Google Scholar] [CrossRef] [PubMed]
- Hackbarth, A.; Romley, J.; Goldman, D. Racial and ethnic disparities in hospital care resulting from air pollution in excess of federal standards. Soc. Sci. Med. 2011, 73, 1163–1168. [Google Scholar] [CrossRef] [PubMed]
- Hajat, A.; Hsia, C.; O’Neill, M.S. Socioeconomic disparities and air pollution exposure: A global review. Curr. Env. Health Rep. 2015, 2, 440–450. [Google Scholar] [CrossRef] [PubMed]
- Holifield, R.B.; Chakraborty, J.; Walker, G.P. The Routledge Handbook of Environmental Justice; Routledge, Taylor & Francis Group: London, UK, 2018. [Google Scholar]
- O’Neill, M.S.; Jerrett, M.; Kawachi, L.; Levy, J.L.; Cohen, A.J.; Gouveia, N.; Wilkinson, P.; Fletcher, T.; Cifuentes, L.; Schwartz, J. Health, wealth, and air pollution: Advancing theory and methods. Env. Health Perspect. 2003, 111, 1861–1870. [Google Scholar] [CrossRef] [PubMed]
- Pearce, J.; Richardson, E.A.; Mitchell, R.J.; Shortt, N.K. Environmental justice and health: The implications of the socio-spatial distribution of multiple environmental deprivation for health inequalities in the United Kingdom. Trans. Inst. Br. Geogr. 2010, 35, 522–539. [Google Scholar] [CrossRef]
- Verbeek, T. Unequal residential exposure to air pollution and noise: A geospatial environmental justice analysis for Ghent, Belgium. Soc. Sci. Med. Pop Health 2018, 7, 100340. [Google Scholar] [CrossRef] [PubMed]
- Air Quality Life. How does Outdoor Air Pollution Affect My Indoor Air Quality? Available online: https://www.iqair.com/blog/air-quality/outdoor-air-pollution-effects-on-indoor-air (accessed on 10 August 2019).
- Collins, T.; Grineski, S.; Chakraborty, J.; McDonald, Y. Understanding environmental health inequalities through comparative intracategorical analysis: Racial/ethnic disparities in cancer risks from air toxics in El Paso County, Texas. Health Place 2011, 17, 335–344. [Google Scholar] [CrossRef] [PubMed]
- Grineski, S.E.; Collins, T.W.; Chakraborty, J. Hispanic heterogeneity and environmental injustice: Intra-ethnic patterns of exposure to cancer risks from vehicular air pollution in Miami. Popul. Environ. 2013, 35, 26–44. [Google Scholar] [CrossRef] [PubMed]
- Chakraborty, J.; Collins, T.W.; Grineski, S.E. Cancer risks from exposure to vehicular air pollution: A household level analysis of intra-ethnic heterogeneity in Miami, Florida. Urban Geogr. 2016, 112–136. [Google Scholar] [CrossRef]
- Grineski, S.E.; Collins, T.W.; Morales, D.X. Asian Americans and disproportionate exposure to carcinogenic hazardous air pollutants: A national study. Soc. Sci. Med. 2017, 185, 71–80. [Google Scholar] [CrossRef] [PubMed]
- Liévanos, R.S. Retooling CalEnviroScreen: Cumulative pollution burden and race-based environmental health vulnerabilities in California. Int. J. Environ. Res. Public Health. 2018, 15, 762. [Google Scholar] [CrossRef] [PubMed]
- Bullard, R.D. Solid waste sites and the Black Houston community. Sociol. Inq. 1983, 53, 273–288. [Google Scholar] [CrossRef] [PubMed]
- Bullard, R.D. Dumping in Dixie: Race, Class, and Environmental Quality; Westview: Boulder, CO, USA, 1990. [Google Scholar]
- Linder, S.H.; Marko, D.; Sexton, K. Cumulative cancer risk from air pollution in Houston: Disparities in risk burden and social disadvantage. Environ. Sci. Technol. 2008, 42, 4312–4322. [Google Scholar] [CrossRef] [PubMed]
- Chakraborty, J.; Collins, T.W.; Grineski, S.E.; Montgomery, M.C.; Hernandez, M. Comparing disproportionate exposure to acute and chronic pollution risks: A case study in Houston, Texas. Risk Anal. 2014, 34, 2005–2020. [Google Scholar] [CrossRef] [PubMed]
- Collins, T.W.; Grineski, S.E.; Chakraborty, J.; Montgomery, M.C.; Hernandez, M. Downscaling environmental justice analysis: Determinants of household-level hazardous air pollutant exposure in Greater Houston. Ann. Assoc. Am. Geogr. 2015, 105, 685–703. [Google Scholar] [CrossRef]
- Grineski, S.; Collins, T.W.; Chakraborty, J.; Montgomery, M. Hazardous air pollutants and flooding: A comparative interurban study of environmental injustice. GeoJournal 2015, 80, 145–158. [Google Scholar] [CrossRef]
- Sexton, K.; Abramson, S.; Bondy, M.; Delclos, G.; Fraser, M.; Stock, T.; Ward, J. A Closer Look at Air Pollution in Houston: Identifying Priority Health Risks; Report of the Mayor’s Task Force on the Health Effects of Air Pollution, Institute for Health Policy Report, ES-001-006; The Institute for Health Policy, University of Texas School of Public Health, Health Science Center at Houston: Houston, TX, USA, 2006. [Google Scholar]
- Chakraborty, J.; Collins, T.; Grineski, S.; Maldonado, A. Racial differences in perceptions of air pollution health risk: Does environmental exposure matter? Int. J. Environ. Res. Public Health 2017, 14, 116. [Google Scholar] [CrossRef] [PubMed]
- U.S. Environmental Protection Agency. Hazardous Air Pollutants. Available online: https://www.epa.gov/haps (accessed on 15 June 2017).
- Morello-Frosch, R.; Jesdale, B.M. Separate and unequal: Residential segregation and estimated cancer risks associated with ambient air toxics in U.S. metropolitan areas. Environ. Health Perspect. 2006, 114, 386–393. [Google Scholar] [CrossRef]
- McCarthy, M.C.; O’Brien, T.E.; Charrier, J.E.; Hafner, H.R. Characterization of the chronic risk and hazard of hazardous air pollutants in the United States using ambient monitoring data. Env. Health Perspect. 2009, 117, 790–796. [Google Scholar] [CrossRef]
- Marshall, J.D.; Swor, K.R.; Nguyen, N.P. Prioritizing environmental justice and equality: Diesel emissions in Southern California. Environ. Sci. Technol. 2014, 48, 4063–4068. [Google Scholar] [CrossRef] [PubMed]
- U.S. Environmental Protection Agency. National Air Toxics Assessment. Available online: https://www.epa.gov/national-air-toxics-assessment/nata-overview (accessed on 18 June 2017).
- Chakraborty, J.; Collins, T.W.; Grineski, S.E. Exploring the environmental justice implications of Hurricane Harvey flooding in Greater Houston, Texas. Am. J. Public Health 2019, 109, 244–250. [Google Scholar] [CrossRef] [PubMed]
- Pastor, M.; Morello-Frosch, R.; Sadd, J. The air is always cleaner on the other side: Race, space, and ambient air toxics exposures in California. J. Urban Aff. 2005, 27, 127–148. [Google Scholar] [CrossRef]
- Mohai, P.; Pellow, D.; Roberts, J.T. Environmental justice. Annu. Rev. Environ. Resour. 2009, 34, 405–430. [Google Scholar] [CrossRef]
- Duncan, B.; Hotz, V.J.; Trejo, S.J. Hispanics in the U.S. Labor Market; National Academies Press: Washington, DC, USA, 2006. [Google Scholar]
- Montgomery, M.; Chakraborty, J. Assessing the environmental justice consequences of flood risk: A case study in Miami, Florida. Env. Res. Lett. 2015, 10, 095010. [Google Scholar] [CrossRef]
- Zeger, S.; Liang, K. Longitudinal data analysis for discrete and continuous outcomes. Biometrics 1986, 42, 121–130. [Google Scholar] [CrossRef] [PubMed]
- Nelder, J.; Wedderburn, R. Generalized linear models. J. R. Stat. Soc. Ser. 1972, 135, 370–384. [Google Scholar] [CrossRef]
- Pulido, L. Rethinking environmental racism: White Privilege and urban development in southern California. Ann. Assoc. Am. Geogr. 2000, 90, 12–40. [Google Scholar] [CrossRef]
- Maldonado, A.; Collins, T.W.; Grineski, S.E.; Chakraborty, J. Exposure to flood hazards in Miami and Houston: Are Hispanic immigrants at greater risk than other social groups? Int. J. Env. Res. Public Health 2016, 13, 775. [Google Scholar] [CrossRef]
- Durden, T.E.; Dean, L.G. Health insurance coverage of Hispanic adults: An assessment of subgroup difference and the impact of immigration. Soc. Sci. 2013, 50, 658–664. [Google Scholar] [CrossRef]
- Monnat, S.M. The new destination disadvantage: Disparities in Hispanic health insurance coverage rates in metropolitan and nonmetropolitan new and established destinations. Rural Soc. 2017, 82, 3–43. [Google Scholar] [CrossRef]
- The Kinder Institute for Human Research. Neighborhood Gentrification across Harris County: 1990–2016. Available online: https://kinder.rice.edu/research/neighborhood-gentrification-across-harris-county-1990-2016 (accessed on 10 August 2019).
- Grineski, S.; Morales, D.X.; Collins, T.; Hernandez, E.; Fuentes, A. The burden of carcinogenic air toxics among Asian Americans in four US metro areas. Popul. Environ. 2019, 40, 257–282. [Google Scholar] [CrossRef]

| Variables | Min | Max | Mean | Std. Dev. |
|---|---|---|---|---|
| On-road cancer risk (persons per million) | 2.078 | 22.490 | 8.368 | 2.862 |
| Proportion Hispanic | 0.001 | 0.973 | 0.407 | 0.256 |
| Proportion non-Hispanic Black | 0.000 | 0.953 | 0.191 | 0.218 |
| Proportion non-Hispanic White | 0.000 | 0.940 | 0.326 | 0.267 |
| Proportion non-Hispanic Asian | 0.000 | 0.461 | 0.060 | 0.071 |
| Proportion non-Hispanic other race | 0.000 | 0.055 | 0.001 | 0.005 |
| Population density | 52 | 67,718 | 5123 | 4159 |
| Median household income ($) | 12,272 | 250,000 | 58,586 | 34,736 |
| Variables | Min | Max | Mean | Std. Dev. |
|---|---|---|---|---|
| Hispanic: | ||||
| Proportion above poverty | 0.044 | 1.000 | 0.571 | 0.249 |
| Proportion below poverty | 0.000 | 0.955 | 0.428 | 0.249 |
| Proportion U.S. born | 0.000 | 1.000 | 0.604 | 0.138 |
| Proportion foreign born | 0.000 | 1.000 | 0.395 | 0.138 |
| Proportion homeowners | 0.000 | 1.000 | 0.522 | 0.295 |
| Proportion renters | 0.000 | 1.000 | 0.477 | 0.295 |
| Proportion high school or higher | 0.000 | 1.000 | 0.623 | 0.217 |
| Proportion less than high school | 0.000 | 1.000 | 0.376 | 0.217 |
| Proportion English proficient | 0.166 | 1.000 | 0.636 | 0.178 |
| Proportion limited English proficient | 0.000 | 0.833 | 0.363 | 0.178 |
| Proportion age below 65 years | 0.676 | 1.000 | 0.954 | 0.045 |
| Proportion age of 65 or more years | 0.000 | 0.478 | 0.050 | 0.057 |
| Non-Hispanic Black: | ||||
| Proportion above poverty | 0.000 | 1.000 | 0.762 | 0.242 |
| Proportion below poverty | 0.000 | 1.000 | 0.237 | 0.242 |
| Proportion U.S. born | 0.000 | 1.000 | 0.921 | 0.127 |
| Proportion foreign born | 0.000 | 1.000 | 0.078 | 0.127 |
| Proportion homeowners | 0.000 | 1.000 | 0.410 | 0.337 |
| Proportion renters | 0.000 | 1.000 | 0.589 | 0.337 |
| Proportion high school or higher | 0.000 | 1.000 | 0.877 | 0.163 |
| Proportion less than high school | 0.000 | 1.000 | 0.122 | 0.163 |
| Proportion English proficient | 0.000 | 1.000 | 0.974 | 0.082 |
| Proportion limited English proficient | 0.000 | 1.000 | 0.025 | 0.082 |
| Proportion age below 65 years | 0.000 | 1.000 | 0.916 | 0.137 |
| Proportion age of 65 or more years | 0.000 | 1.000 | 0.083 | 0.137 |
| Non-Hispanic White: | ||||
| Proportion above poverty | 0.000 | 1.000 | 0.809 | 0.157 |
| Proportion below poverty | 0.000 | 1.000 | 0.190 | 0.157 |
| Proportion U.S. born | 0.000 | 1.000 | 0.929 | 0.094 |
| Proportion foreign born | 0.000 | 1.000 | 0.070 | 0.094 |
| Proportion homeowners | 0.000 | 1.000 | 0.649 | 0.265 |
| Proportion renters | 0.000 | 1.000 | 0.350 | 0.265 |
| Proportion high school or higher | 0.000 | 1.000 | 0.896 | 0.135 |
| Proportion less than high school | 0.000 | 1.000 | 0.103 | 0.135 |
| Proportion English proficient | 0.160 | 1.000 | 0.763 | 0.192 |
| Proportion limited English proficient | 0.000 | 0.839 | 0.236 | 0.192 |
| Proportion age below 65 years | 0.000 | 1.000 | 0.813 | 0.141 |
| Proportion age of 65 or more years | 0.000 | 1.000 | 0.186 | 0.141 |
| Variables | Model 1 | Model 2 | Model 3 |
|---|---|---|---|
| Population density | 0.254 ** | 0.253 ** | 0.250 ** |
| Median household income | 0.046 * | 0.046 * | 0.048 * |
| Proportion Hispanic | Ref | 0.035 ** | 0.153 ** |
| Proportion non-Hispanic Black | −0.027 * | Ref | 0.103 ** |
| Proportion non-Hispanic White | −0.158 ** | −0.122 ** | Ref |
| Proportion non-Hispanic Asian | 0.103 ** | 0.113 ** | 0.148 ** |
| Proportion non-Hispanic other race | −0.017 | −0.016 | −0.014 * |
| Intercept | 2.129 ** | 2.128 ** | 2.126 ** |
| Scale | 0.017 | 0.017 | 0.017 |
| Model fit (QIC) | 24.953 | 24.965 | 24.699 |
| Variables | Model 1 | Model 2 | Model 3 | Model 4 | Model 5 | Model 6 |
|---|---|---|---|---|---|---|
| Population density | 0.268 ** | 0.235 ** | 0.210 ** | 0.265 ** | 0.248 ** | 0.258 ** |
| Median household income | 0.061 ** | 0.029 | 0.087 ** | 0.051 * | 0.046 * | 0.030 * |
| Proportion Non-Hispanic Black | −0.004 | −0.027 * | −0.045 ** | −0.022 * | −0.018 * | −0.021 * |
| Proportion Non-Hispanic White | −0.116 ** | −0.125 ** | −0.164 ** | −0.116 ** | −0.112 ** | −0.148 ** |
| Proportion Non-Hispanic Asian | 0.108 ** | 0.106 ** | 0.062 ** | 0.119 ** | 0.128 ** | 0.096 ** |
| Proportion Non-Hispanic other | −0.013 * | −0.021 * | −0.013 * | −0.015 * | −0.015 * | −0.016 * |
| Proportion Hispanic: above poverty | Ref | |||||
| Proportion Hispanic: below poverty | 0.065 ** | |||||
| Proportion Hispanic: U.S. born | Ref | |||||
| Proportion Hispanic: foreign born | 0.058 ** | |||||
| Proportion Hispanic: homeowners | Ref | |||||
| Proportion Hispanic: renters | 0.134 ** | |||||
| Proportion Hispanic: high school or higher | Ref | |||||
| Proportion Hispanic: less than high school | 0.061 ** | |||||
| Proportion Hispanic: English proficient | Ref | |||||
| Proportion Hispanic: not English proficient | 0.068 ** | |||||
| Proportion Hispanic: age below 65 years | Ref | |||||
| Proportion Hispanic: age of 65 or more years | 0.042 ** | |||||
| Intercept | 2.140 ** | 2.123 ** | 2.143 ** | 2.136 ** | 2.136 ** | 2.124 ** |
| Scale | 0.016 | 0.016 | 0.013 | 0.016 | 0.016 | 0.016 |
| Model fit (QIC) | 26.181 | 24.976 | 27.257 | 24.395 | 26.042 | 22.354 |
| Variables | Model 1 | Model 2 | Model 3 | Model 4 | Model 5 | Model 6 |
|---|---|---|---|---|---|---|
| Population density | 0.215 ** | 0.256 ** | 0.186 ** | 0.260 ** | 0.252 ** | 0.249 ** |
| Median household income | 0.047 ** | 0.037 * | 0.082 ** | 0.037 * | 0.041 * | 0.038 * |
| Proportion Hispanic | 0.023 * | 0.032 * | 0.040 * | 0.025 | 0.027 | 0.024 |
| Proportion non-Hispanic White | −0.430 ** | −0.454 ** | −0.482 ** | −0.431 ** | −0.470 ** | −0.451 ** |
| Proportion non-Hispanic Asian | 1.950 ** | 1.687 ** | 2.184 ** | 1.650 ** | 1.599 ** | 1.562 ** |
| Proportion non-Hispanic other | −3.970 * | −2.208 | −2.690 * | −4.216 * | −2.766 * | −2.873 * |
| Proportion non-Hispanic Black: above poverty | Ref | |||||
| Proportion non-Hispanic Black: below poverty | 0.266 ** | |||||
| Proportion non-Hispanic Black: U.S. born | Ref | |||||
| Proportion non-Hispanic Black: foreign born | −0.192 * | |||||
| Proportion non-Hispanic Black: homeowners | Ref | |||||
| Proportion non-Hispanic Black: renters | 0.232 ** | |||||
| Proportion non-Hispanic Black: high school or higher | Ref | |||||
| Proportion non-Hispanic Black: less than high school | 0.202 ** | |||||
| Proportion non-Hispanic Black: English proficient | Ref | |||||
| Proportion non-Hispanic Black: not English proficient | −0.154 * | |||||
| Proportion non-Hispanic Black: age below 65 years | Ref | |||||
| Proportion non-Hispanic Black: age of 65 or more years | 0.132 * | |||||
| Intercept | 2.068 ** | 2.187 ** | 1.997 ** | 2.144 ** | 2.187 ** | 2.166 ** |
| Scale | 0.017 | 0.017 | 0.017 | 0.017 | 0.017 | 0.017 |
| Model fit (QIC) | 24.486 | 27.348 | 31.967 | 25.683 | 26.161 | 25.202 |
| Variables | Model 1 | Model 2 | Model 3 | Model 4 | Model 5 | Model 6 |
|---|---|---|---|---|---|---|
| Population density | 0.244 ** | 0.221 ** | 0.254 ** | 0.238 ** | 0.213 ** | 0.237 ** |
| Median household income | 0.058 ** | 0.047 ** | 0.072 ** | 0.048 ** | 0.042 ** | 0.048 ** |
| Proportion Hispanic | 0.137 ** | 0.132 ** | 0.119 ** | 0.149 ** | 0.060 * | 0.138 ** |
| Proportion non-Hispanic Black | 0.085 ** | 0.099 ** | 0.072 ** | 0.116 ** | 0.052 ** | 0.112 ** |
| Proportion non-Hispanic Asian | 0.150 ** | 0.086 ** | 0.056 ** | 0.137 ** | 0.166 ** | 0.143 ** |
| Proportion non-Hispanic other | −0.014 * | −0.017 * | −0.023 ** | −0.016 * | −0.012 | −0.016 * |
| Proportion non-Hispanic White: above poverty | Ref | |||||
| Proportion non-Hispanic White: below poverty | 0.042 ** | |||||
| Proportion non-Hispanic White: U.S. born | Ref | |||||
| Proportion non-Hispanic White: foreign born | 0.119 ** | |||||
| Proportion non-Hispanic White: homeowners | Ref | |||||
| Proportion non-Hispanic White: renters | 0.097 ** | |||||
| Proportion non-Hispanic White: high school or higher | Ref | |||||
| Proportion non-Hispanic White: less than high school | −0.015 | |||||
| Proportion non-Hispanic White: English proficient | Ref | |||||
| Proportion non-Hispanic White: not English proficient | 0.120 ** | |||||
| Proportion non-Hispanic White: age below 65 years | Ref | |||||
| Proportion non-Hispanic White: age of 65 or more years | 0.016 * | |||||
| Intercept | 2.120 ** | 2.137 ** | 2.141 ** | 2.125 ** | 2.120 ** | 2.122 ** |
| Scale | 0.017 | 0.015 | 0.013 | 0.016 | 0.017 | 0.017 |
| Model fit (QIC) | 24.274 | 23.168 | 21.535 | 24.470 | 25.348 | 23.834 |
© 2019 by the authors. Licensee MDPI, Basel, Switzerland. This article is an open access article distributed under the terms and conditions of the Creative Commons Attribution (CC BY) license (http://creativecommons.org/licenses/by/4.0/).
Share and Cite
Loustaunau, M.G.; Chakraborty, J. Vehicular Air Pollution in Houston, Texas: An Intra-Categorical Analysis of Environmental Injustice. Int. J. Environ. Res. Public Health 2019, 16, 2968. https://doi.org/10.3390/ijerph16162968
Loustaunau MG, Chakraborty J. Vehicular Air Pollution in Houston, Texas: An Intra-Categorical Analysis of Environmental Injustice. International Journal of Environmental Research and Public Health. 2019; 16(16):2968. https://doi.org/10.3390/ijerph16162968
Chicago/Turabian StyleLoustaunau, Michel G., and Jayajit Chakraborty. 2019. "Vehicular Air Pollution in Houston, Texas: An Intra-Categorical Analysis of Environmental Injustice" International Journal of Environmental Research and Public Health 16, no. 16: 2968. https://doi.org/10.3390/ijerph16162968
APA StyleLoustaunau, M. G., & Chakraborty, J. (2019). Vehicular Air Pollution in Houston, Texas: An Intra-Categorical Analysis of Environmental Injustice. International Journal of Environmental Research and Public Health, 16(16), 2968. https://doi.org/10.3390/ijerph16162968