Investigation on the Injury Severity of Drivers in Rear-End Collisions Between Cars Using a Random Parameters Bivariate Ordered Probit Model


Abstract
1. Introduction
2. Methodology
3. Data Description
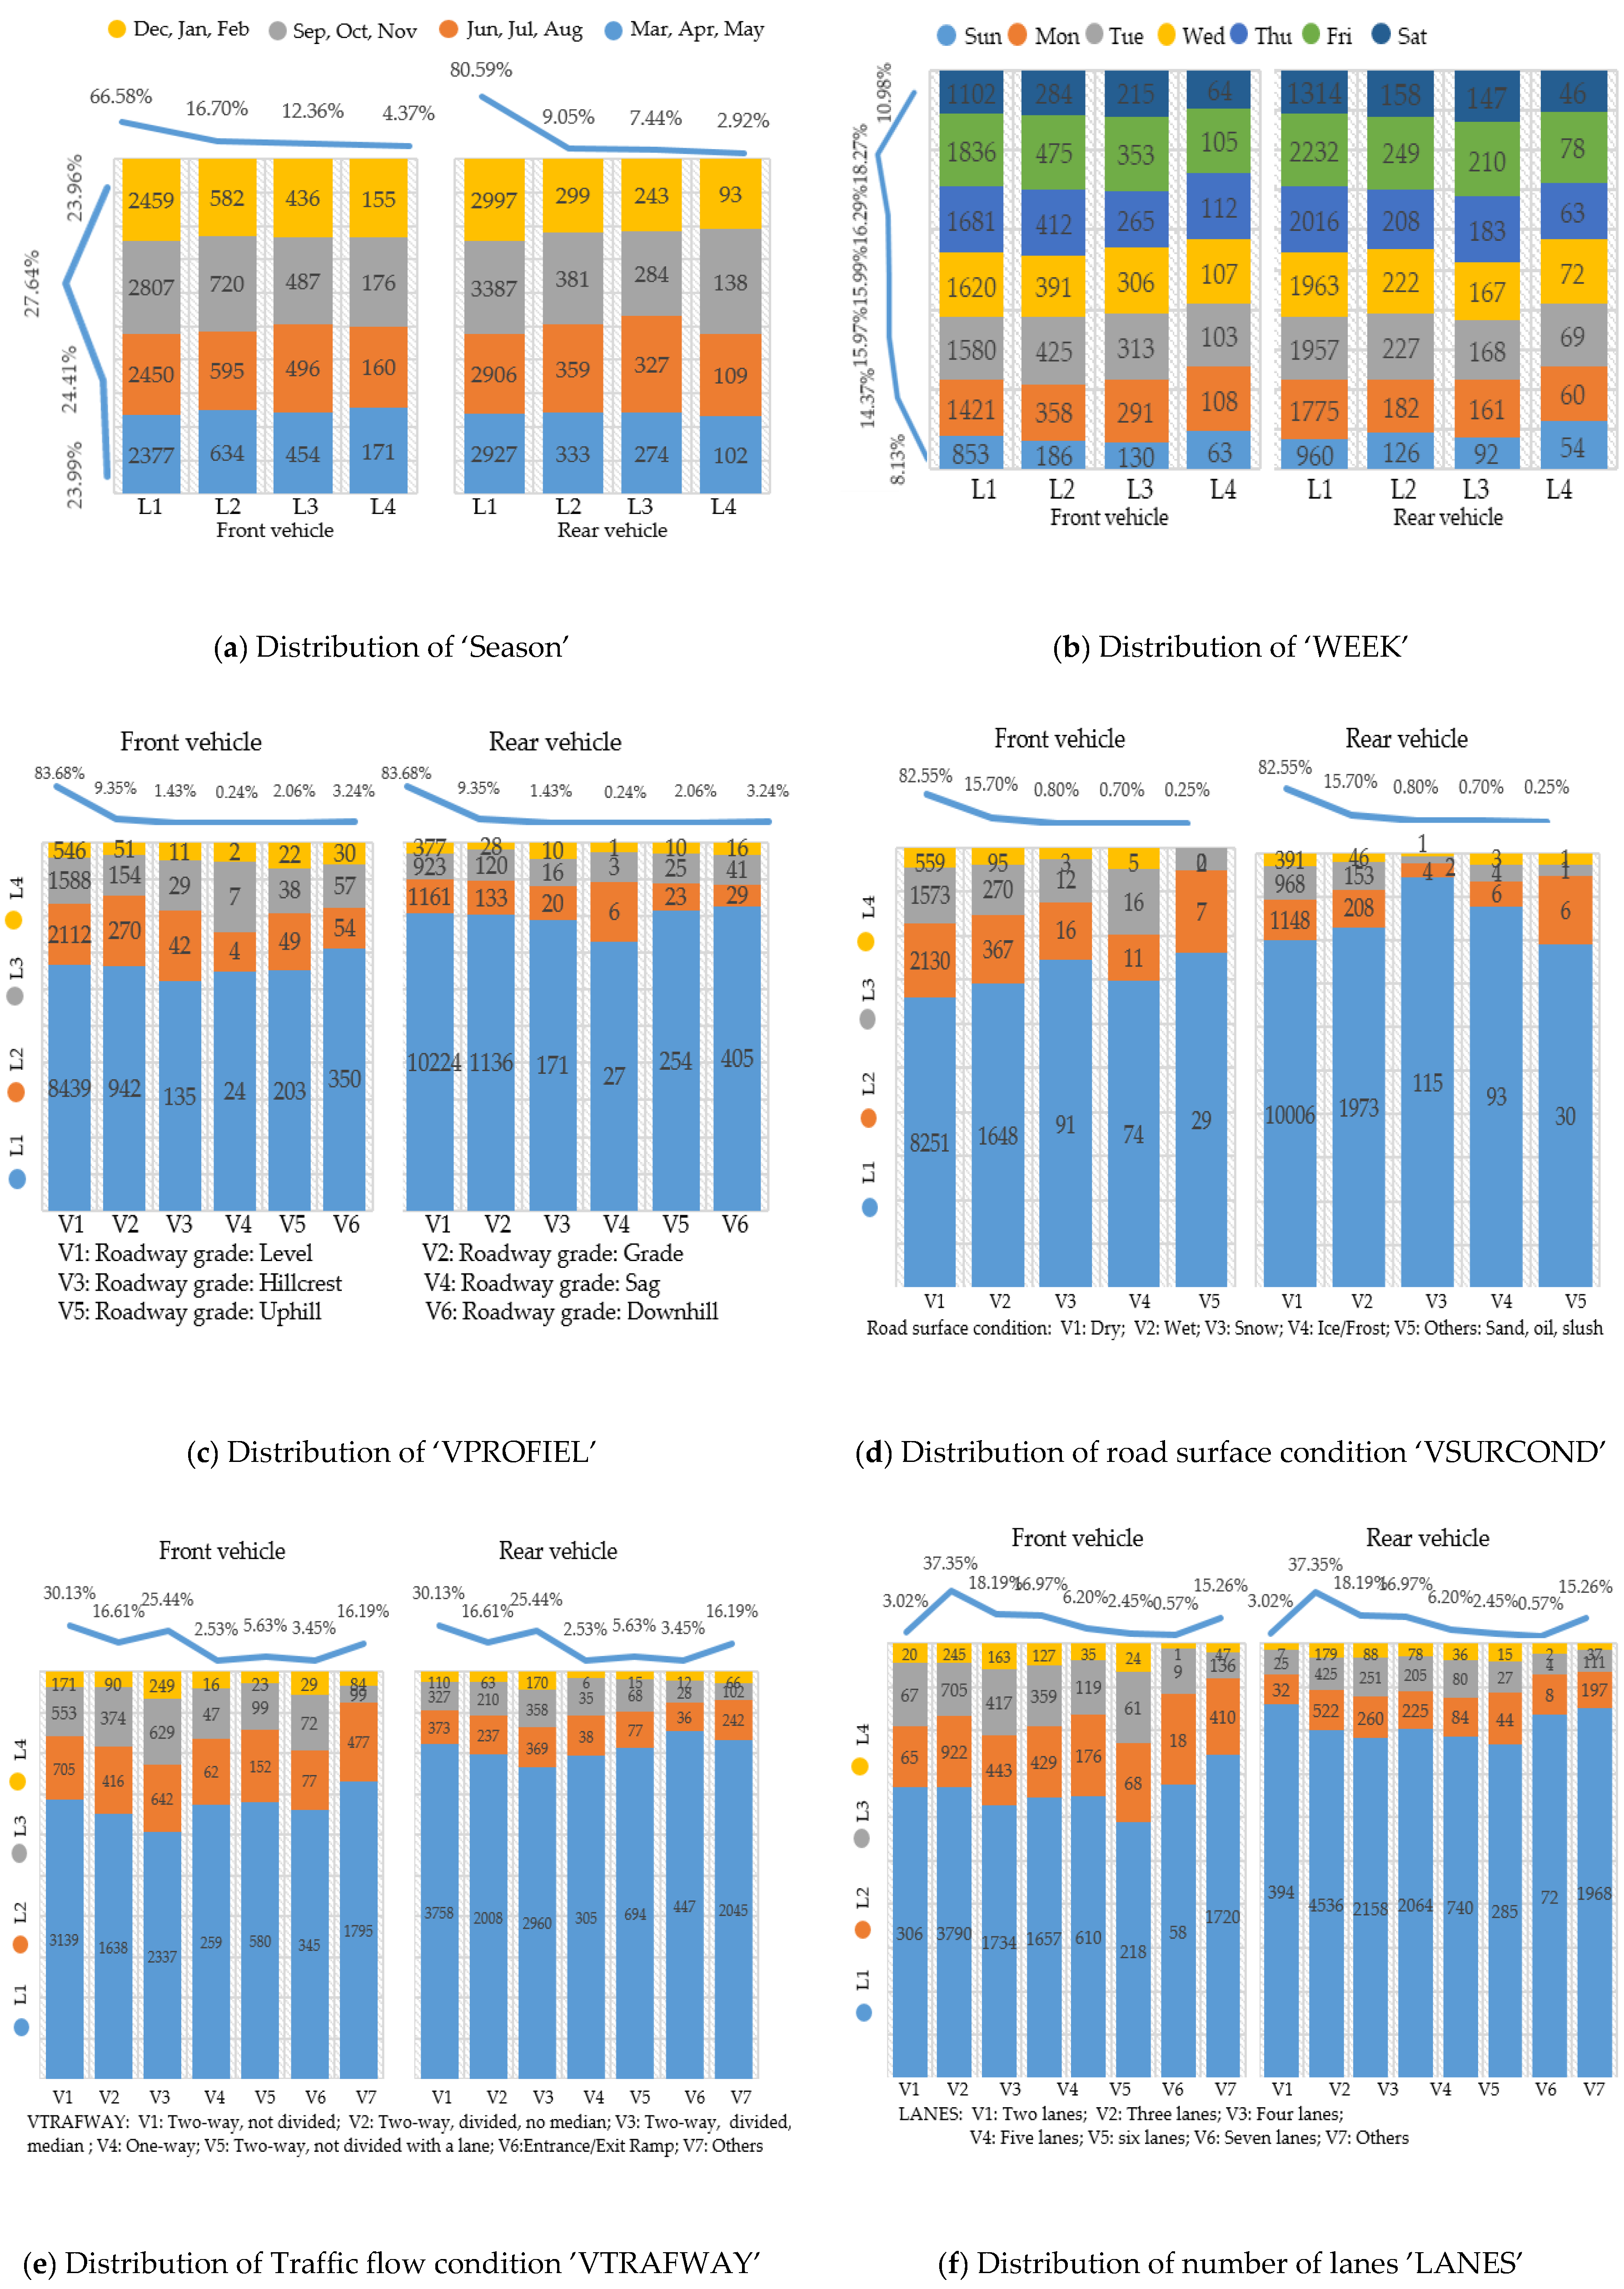
- L1: No injury (O) and no apparent injury (O);
- L2: Possible injury (C);
- L3: Non-incapacitating evident injury (B), suspected minor injury (B);
- L4: Incapacitating injury (A), suspected serious injury (A), fatal injury (K).
4. Model Estimation and Discussion of Results
5. Conclusions
Author Contributions
Funding
Conflicts of Interest
References
- World Health Organization. Global status report on road safety 2015. Inj. Prev. 2015, 15, 286. [Google Scholar]
- Dong, C.; Clarke, D.B.; Nambisan, S.S.; Huang, B. Analyzing injury crashes using random-parameter bivariate regression models. Transp. A Transp. Sci. 2016, 12, 794–810. [Google Scholar] [CrossRef]
- Chen, C.; Zhang, G.; Tarefder, R.; Ma, J.; Wei, H.; Guan, H. A multinomial logit model-Bayesian network hybrid approach for driver injury severity analyses in rear-end crashes. Accid. Anal. Prev. 2015, 80, 76–88. [Google Scholar] [CrossRef] [PubMed]
- Singh, S. Driver attributes and rear-end crash involvement propensity; DOT HS 809 540; National Technical Information Service: Springfield, Virginia, VA, USA, March 2003.
- Zhang, K.; Hassan, M. Identifying the Factors Contributing to Injury Severity in Work Zone Rear-End Crashes. J. Adv. Transport. 2019, 2019, 9. [Google Scholar] [CrossRef]
- Faller, R.K.; Magdaleno, J.A.; Post, E.R. Full-Scale Vehicle Crash Tests on the Iowa Retrofit Concrete Barrier Rail; Transportation Research Report TRP-03-015-88; University of Nebraska-Lincoln: Nebraska, NE, USA, January 1989. [Google Scholar]
- Xu, J.; Li, Y.; Lu, G.; Zhou, W. Reconstruction model of vehicle impact speed in pedestrian–vehicle accident. Int. J. Impact Eng. 2009, 36, 783–788. [Google Scholar] [CrossRef]
- Xu, J.; Shang, S.; Qi, H.; Yu, G.; Wang, Y.; Chen, P. Simulative investigation on head injuries of electric self-balancing scooter riders subject to ground impact. Accid. Anal. Prev. 2016, 89, 128–141. [Google Scholar] [CrossRef]
- Chen, F.; Chen, S.; Ma, X. Analysis of hourly crash likelihood using unbalanced panel data mixed logit model and real-time driving environmental big data. J. Saf. Res. 2018, 65, 153. [Google Scholar] [CrossRef]
- Wang, L.; Abdel-Atym, M.; Ma, W.; Hu, J.; Zhong, H. Quasi-vehicle-trajectory-based real-time safety analysis for expressways. Transport. Res. C-Emer. 2019, 103, 30–38. [Google Scholar] [CrossRef]
- Russo, B.J.; Savolainen, P.T.; Iv, W.H.S.; Anastasopoulos, P.C. Comparison of factors affecting injury severity in angle collisions by fault status using a random parameters bivariate ordered probit model. Anal. Methods Accid. Res. 2014, 2, 21–29. [Google Scholar] [CrossRef]
- Li, Z.; Liu, P.; Wang, W.; Xu, C. Using support vector machine models for crash injury severity analysis. Accid. Anal. Prev. 2012, 45, 478–486. [Google Scholar] [CrossRef]
- Ma, C.; Hao, W.; Xiang, W.; Yan, W. The Impact of Aggressive Driving Behavior on Driver-Injury Severity at Highway-Rail Grade Crossings Accidents. J. Adv. Transport. 2018, 58, 1–10. [Google Scholar] [CrossRef]
- Yuan, Q.; Lu, M.; Theofilatos, A.; Li, Y.-B. Investigation on occupant injury severity in rear-end crashes involving trucks as the front vehicle in Beijing area, China. Chin. J. Traumatol. 2017, 20, 20–26. [Google Scholar] [CrossRef] [PubMed]
- Konstantina, G.; Kinzenbaw, C.R.; Shauna, H.; Neal, H. An empirical analysis of farm vehicle crash injury severities on Iowa’s public road system. Accid. Anal. Prev. 2010, 42, 1392–1397. [Google Scholar]
- Manner, H.; Wünsch-Ziegler, L. Analyzing the severity of accidents on the German Autobahn. Accid. Anal. Prev. 2013, 57, 40–48. [Google Scholar] [CrossRef] [PubMed]
- Chen, F.; Chen, S. Injury severities of truck drivers in single- and multi-vehicle accidents on rural highways. Accid. Anal. Prev. 2011, 43, 1677–1688. [Google Scholar] [CrossRef] [PubMed]
- Kunt, M.M.; Aghayan, I.; Noii, N. Prediction for traffic accident severity: Comparing the artificial neural network, genetic algorithm, combined genetic algorithm and pattern search methods. Transport 2011, 26, 353–366. [Google Scholar] [CrossRef]
- Yan, X.; Radwan, E. Analyses of Rear-End Crashes Based on Classification Tree Models. Traffic Inj. Prev. 2006, 7, 276–282. [Google Scholar] [CrossRef]
- Das, A.; Abdel-Aty, M.A. A combined frequency–severity approach for the analysis of rear-end crashes on urban arterials. Saf. Sci. 2011, 49, 1156–1163. [Google Scholar] [CrossRef]
- Wang, W.; Liu, C.; Chen, D. Predicting driver injury severity in freeway rear-end crashes by support vector machine. In International Conference on Transportation, Changchun, China 16–18 December 2011; IEEE: Piscataway, NJ, USA, 2011. [Google Scholar]
- Savolainen, P.T.; Manneringm, F.L.; Lord, D.; Quddus, M.A. The statistical analysis of highway crash-injury severities: A review and assessment of methodological alternatives. Accid. Anal. Prev. 2011, 43, 1666–1676. [Google Scholar] [CrossRef]
- Wu, Y.; Abdel-Aty, M.; Cai, Q.; Lee, J.; Park, J. Developing an algorithm to assess the rear-end collision risk under fog conditions using real-time data. Transport. Res. C-Emer. 2018, 87, 11–25. [Google Scholar] [CrossRef]
- Zhao, P.; Lee, C. Assessing rear-end collision risk of cars and heavy vehicles on freeways using a surrogate safety measure. Accid. Anal. Prev. 2018, 113, 149. [Google Scholar] [CrossRef] [PubMed]
- Xie, Y.; Zhao, K.; Huynh, N. Analysis of driver injury severity in rural single-vehicle crashes. Accid. Anal. Prev. 2012, 47, 36–44. [Google Scholar] [CrossRef] [PubMed]
- Ma, X.; Chen, S.; Chen, F. Multivariate space-time modeling of crash frequencies by injury severity levels. Anal. Methods Accid. Res. 2017, 15, 29–40. [Google Scholar] [CrossRef]
- Zeng, Q.; Gu, W.; Zhang, X.; Wen, H.; Lee, J.; Hao, W. Analyzing freeway crash severity using a Bayesian spatial generalized ordered logit model with conditional autoregressive priors. Accid. Anal. Prev. 2019, 127, 87–95. [Google Scholar] [CrossRef] [PubMed]
- Chandler, S.; Duncan, A.J.K.; Forrest, M.; Khattak, A.J.; Council, F.M. Applying the ordered probit model to injury severity in truck-passenger car rear-end collisions. Transport. Res. Rec. 1998, 1635, 63–71. [Google Scholar]
- Abdel-Aty, M. Analysis of driver injury severity levels at multiple locations using ordered probit models. J. Saf. Res. 2003, 34, 597–603. [Google Scholar] [CrossRef]
- Jalayer, M.; Shabanpour, R.; Pour-Rouholamin, M.; Golshani, N.; Zhou, H. Wrong-way driving crashes: A random-parameters ordered probit analysis of injury severity. Accid. Anal. Prev. 2018, 117, 128–135. [Google Scholar] [CrossRef]
- Mannering, F.L.; Bhat, C.R. Analytic methods in accident research: Methodological frontier and future directions. Anal. Methods Accid. Res. 2014, 1, 1–22. [Google Scholar] [CrossRef]
- Abay, K.A.; Paleti, R.; Bhat, C.R. The joint analysis of injury severity of drivers in two-vehicle crashes accommodating seat belt use endogeneity. Transport. Res. B-Meth. 2013, 50, 74–89. [Google Scholar] [CrossRef]
- Chiou, Y.-C.; Hwang, C.-C.; Chang, C.-C.; Fu, C. Reprint of “Modeling two-vehicle crash severity by a bivariate generalized ordered probit approach”. Accid. Anal. Prev. 2013, 61, 97–106. [Google Scholar] [CrossRef]
- Chen, H.; Cao, L.; Logan, D.B. Analysis of risk factors affecting the severity of intersection crashes by logistic regression. J. Crash Prev. Inj. Control 2012, 13, 300–307. [Google Scholar] [CrossRef] [PubMed]
- Blows, S.; Ivers, R.Q.; Woodward, M.; Connor, J.; Ameratunga, S.; Norton, R. Vehicle year and the risk of car crash injury. Inj. Prev. 2003, 9, 353. [Google Scholar] [CrossRef] [PubMed]


| Injury Severity of Driver in the Front Vehicle | Injury Severity of Driver in the Rear Vehicle | Total | |||
|---|---|---|---|---|---|
| L1 | L2 | L3 | L4 | ||
| No injury (L1) | 8723 | 576 | 585 | 209 | 10,093 (66.6%) |
| Possible injury (L2) | 1683 | 548 | 220 | 80 | 2531 (16.7%) |
| Non-incapacitating injury (L3) | 1374 | 188 | 264 | 47 | 1873 (12.3%) |
| Incapacitating or fatal injury(L4) | 437 | 60 | 59 | 106 | 662 (4.4%) |
| Total | 12,217 (80.6%) | 1372 (9.0%) | 1128 (7.4%) | 442 (2.9%) | 15,159 (100%) |
| Variables | Description and Classification | Driver in the Front Vehicle | Driver in the Rear Vehicle | Total | ||||||
|---|---|---|---|---|---|---|---|---|---|---|
| L1 | L2 | L3 | L4 | L1 | L2 | L3 | L4 | |||
| HOUR | Day: 7:00~18:00 | 8437 | 2098 | 1533 | 472 | 10,193 | 1130 | 890 | 327 | 25,080 |
| Night: else | 1656 | 433 | 340 | 190 | 2024 | 242 | 238 | 115 | 5238 | |
| AGE | Age 24 and below | 2303 | 433 | 310 | 87 | 4632 | 438 | 366 | 131 | 8700 |
| Age between 25 and 63 | 6770 | 1851 | 1395 | 499 | 6673 | 790 | 631 | 258 | 18,867 | |
| Age 64 and above | 1020 | 247 | 168 | 76 | 912 | 144 | 131 | 53 | 2751 | |
| SEX | Male | 4827 | 952 | 637 | 267 | 6312 | 574 | 454 | 188 | 14,211 |
| Female | 5266 | 1579 | 1236 | 395 | 5905 | 798 | 674 | 254 | 16,107 | |
| ALCOHOL | Alcohol involved | 22 | 8 | 4 | 8 | 275 | 50 | 48 | 37 | 452 |
| Alcohol not involved | 10,071 | 2523 | 1869 | 654 | 11,942 | 1322 | 1080 | 405 | 29,866 | |
| DRUGS | Drugs use | 7 | 1 | 2 | 4 | 70 | 20 | 26 | 23 | 153 |
| No drugs use | 10,086 | 2530 | 1871 | 658 | 12,147 | 1352 | 1102 | 419 | 30,165 | |
| AIR_BAG | Airbag not deployed | 260 | 157 | 165 | 124 | 1896 | 588 | 527 | 174 | 3891 |
| Airbag deployed | 9833 | 2374 | 1708 | 538 | 10,321 | 784 | 601 | 268 | 26,427 | |
| REST_USE | Seat belt equipment not in use | 62 | 35 | 24 | 17 | 104 | 30 | 52 | 51 | 375 |
| Seat belt equipment in use | 10,031 | 2496 | 1849 | 645 | 12,113 | 1342 | 1076 | 391 | 29,943 | |
| VALIGN | Roadway alignment: Straight | 9539 | 2440 | 1787 | 620 | 11,547 | 1326 | 1092 | 421 | 28,772 |
| Curve | 554 | 91 | 86 | 42 | 670 | 46 | 36 | 21 | 1546 | |
| REGION | Northeast | 2164 | 642 | 90 | 142 | 2473 | 357 | 104 | 104 | 6076 |
| Midwest | 1797 | 313 | 512 | 139 | 2306 | 142 | 225 | 88 | 5522 | |
| South | 4971 | 1155 | 1122 | 339 | 6074 | 682 | 625 | 206 | 15,174 | |
| West | 1161 | 421 | 149 | 42 | 1364 | 191 | 174 | 44 | 3546 | |
| SPEEDREL | Driver’s speed related | 109 | 17 | 11 | 10 | 2492 | 334 | 281 | 115 | 3369 |
| Driver’s speed not related | 9984 | 2514 | 1862 | 652 | 9725 | 1038 | 847 | 327 | 26,949 | |
| LGTCON | Daylight | 7785 | 1944 | 1444 | 443 | 9373 | 1067 | 863 | 313 | 23,232 |
| Dark | 1954 | 514 | 377 | 191 | 2431 | 256 | 231 | 118 | 6072 | |
| Dawn or Dusk | 354 | 73 | 52 | 28 | 413 | 49 | 34 | 11 | 1014 | |
| WEATHER | Clear | 7164 | 1836 | 1271 | 482 | 8627 | 970 | 822 | 334 | 21,506 |
| Rain | 1154 | 254 | 193 | 68 | 1396 | 146 | 95 | 32 | 3338 | |
| Snow, Freezing Rain or Drizzle | 135 | 33 | 24 | 9 | 174 | 11 | 10 | 6 | 402 | |
| Fog, Smog, Smoke and so on | 25 | 8 | 3 | 0 | 30 | 3 | 3 | 0 | 72 | |
| Cloudy | 1615 | 400 | 382 | 103 | 1990 | 242 | 198 | 70 | 5000 | |
| INT_HWY | Crash occurred on an interstate way | 1442 | 360 | 299 | 169 | 1765 | 198 | 192 | 115 | 4540 |
| Crash not occurred on an interstate way | 8651 | 2171 | 1574 | 493 | 10,452 | 1174 | 936 | 327 | 25,778 | |
| MDLYR | Manufacturer’s model year: before 1995 | 365 | 125 | 103 | 39 | 873 | 100 | 119 | 30 | 1754 |
| 1996–2000 | 1113 | 361 | 322 | 87 | 2303 | 299 | 208 | 85 | 4778 | |
| 2001–2005 | 2400 | 669 | 494 | 205 | 3662 | 406 | 339 | 123 | 8298 | |
| 2006–2010 | 3726 | 818 | 594 | 193 | 3579 | 380 | 296 | 137 | 9723 | |
| 2011–2015 | 2489 | 558 | 360 | 138 | 1800 | 187 | 166 | 67 | 5765 | |
| BDYTYP | The car has four doors | 7152 | 1857 | 1373 | 491 | 8834 | 1013 | 787 | 129 | 21,636 |
| The number of car’s doors is not four | 2941 | 674 | 500 | 171 | 3383 | 359 | 341 | 313 | 8682 | |
| WRKZONE | Within the boundaries of a work zone | 191 | 40 | 46 | 12 | 228 | 19 | 28 | 14 | 578 |
| Not within the boundaries of a work zone | 9902 | 2491 | 1827 | 650 | 11,989 | 1353 | 1100 | 428 | 29,740 | |
| Variables | Coefficient | Standard Error | Z Value | Percent Observations | |
|---|---|---|---|---|---|
| Above 0 | Below 0 | ||||
| Driver in the Front Vehicle | |||||
| Constant | −0.2028 *** | 0.0677 | −3.0 | — | — |
| ▲ AGE: ≤24 | −0.3182 *** | 0.0269 | −11.8 | 2.74% | 97.26% |
| Standard deviation | 0.1657 *** | 0.0238 | 7.0 | — | — |
| ▲ SEX: Male | −0.4426 *** | 0.0223 | −19.9 | 20.05% | 79.95% |
| Standard deviation | 0.5292 *** | 0.0177 | 29.8 | — | — |
| ▲ AIRBAG: Not deployed | 0.8767 *** | 0.0449 | 19.5 | 99.95% | 0.05% |
| Standard deviation | 0.2692 *** | 0.0432 | 6.2 | — | — |
| ▲ SEAT BELT: Not in use | 0.5594 *** | 0.1025 | 5.5 | — | — |
| SPEEDREL: Speed related | −0.3872 *** | 0.1163 | −3.3 | — | — |
| ▲ MDLYR: 2001–2005 | −0.1392 *** | 0.0320 | −4.3 | 7.08% | 92.92% |
| Standard deviation | 0.0945 *** | 0.0203 | 4.7 | — | — |
| ▲ MDLYR: 2006–2010 | −0.3648 *** | 0.0307 | −11.9 | 0.96% | 99.04% |
| Standard deviation | 0.1559 *** | 0.0178 | 8.8 | — | — |
| ▲ MDLYR: 2011–2015 | −0.3569 *** | 0.0331 | −10.8 | 0.23% | 99.77% |
| Standard deviation | 0.1255 *** | 0.0216 | 5.8 | — | — |
| BDYTYP: Four doors | 0.0839 *** | 0.0232 | 3.6 | 76.42% | 23.58% |
| Standard deviation | 0.1164 *** | 0.0121 | 9.6 | — | — |
| WEEK: Monday | 0.0592 ** | 0.0291 | 2.0 | — | — |
| ▲ HOUR: 7:00~18:00 | −0.1753 *** | 0.0370 | −4.7 | 0.69% | 99.31% |
| Standard deviation | 0.0713 *** | 0.0114 | 6.3 | — | — |
| ▲ VTRAFWAY: Two-way, divided no median | 0.1414 *** | 0.0292 | 4.9 | 68.44% | 31.56% |
| Standard deviation | 0.2967 *** | 0.0242 | 12.3 | — | — |
| VTRAFWAY: Entrance/Exit Ramp | 0.0971 * | 0.0588 | 1.7 | 57.53% | 42.47% |
| Standard deviation | 0.4995 *** | 0.0598 | 8.4 | — | — |
| REGION: Midwest | 0.0876 *** | 0.0273 | 3.2 | 56.75% | 43.25% |
| Standard deviation | 0.5032 *** | 0.0257 | 19.6 | — | — |
| ▲ Light Condition: Daylight | 0.1237 ** | 0.0577 | 2.2 | 100% | 0 |
| Standard deviation | 0.0306*** | 0.0118 | 2.6 | — | — |
| Light Condition: Dark | 0.1215 ** | 0.0608 | 2.0 | — | — |
| 0.6191 *** | 0.0113 | 54.8 | — | — | |
| 1.4814 *** | 0.0202 | 73.3 | — | — | |
| Driver in the rear vehicle | |||||
| Constant| | −0.7899 *** | 0.0921 | −8.58 | 0 | 100% |
| Standard deviation | 0.2067 *** | 0.0123 | 16.78 | — | — |
| ▲ AGE: ≤24 | −0.4894 *** | 0.0454 | −10.79 | 8.85% | 91.15% |
| Standard deviation | 0.3615 *** | 0.0221 | 16.36 | — | — |
| AGE: 25–63 | −0.2780 *** | 0.0426 | −6.53 | 0 | 100% |
| Standard deviation | 0.0754 *** | 0.0166 | 4.54 | — | — |
| ▲ SEX: Male | −0.3822 *** | 0.0261 | −14.67 | 14.01% | 85.99% |
| Standard deviation | 0.3554 *** | 0.0192 | 18.49 | — | — |
| ALCOHOL: Involved | 0.2452 *** | 0.0688 | 3.56 | — | — |
| DRUGS: Involved | 0.5898 *** | 0.1110 | 5.31 | 81.06% | 18.94% |
| Standard deviation | 0.6645 *** | 0.1128 | 5.89 | — | — |
| ▲ AIRBAG: Not deployed | 1.0486 *** | 0.0267 | 39.3 | — | — |
| ▲ SEAT BELT: Not in use | 1.1682 *** | 0.0818 | 14.28 | 91.77% | 8.23% |
| Standard deviation | 0.8390 *** | 0.0906 | 9.27 | — | — |
| MDLYR: 1995–2000 | −0.1192 ** | 0.0531 | −2.25 | 6.18% | 93.82% |
| Standard deviation | 0.0774 *** | 0.0281 | 2.75 | — | — |
| ▲ MDLYR: 2001–2005 | −0.1669 *** | 0.0506 | −3.3 | 17.36% | 82.64% |
| Standard deviation | 0.1782 *** | 0.0226 | 7.88 | — | — |
| ▲ MDLYR: 2006–2010 | −0.2833 *** | 0.0517 | −5.48 | 25.78% | 74.22% |
| Standard deviation | 0.4353 *** | 0.0244 | 17.81 | — | — |
| ▲ MDLYR: 2011–2015 | −0.2049 *** | 0.0554 | −3.70 | — | — |
| SEASON: Jun, Jul, Aug | 0.0933 *** | 0.0291 | 3.20 | 94.74% | 5.26% |
| Standard deviation | 0.0575 ** | 0.0246 | 2.34 | — | — |
| ▲ HOUR: 7:00~18:00 | −0.2304 *** | 0.0451 | −5.11 | — | — |
| VSURCOND: Snow | −0.6991 *** | 0.2430 | −2.88 | — | — |
| Standard deviation | 0.5531 ** | 0.2344 | 2.36 | — | — |
| ▲ VTRAFWAY: Two-way, divided no median | 0.1426 *** | 0.036- | 3.97 | 98.98% | 1.02% |
| Standard deviation | 0.0613 ** | 0.0296 | 2.07 | — | — |
| VTRAFWAY: Two-way, divided, median | 0.2466 *** | 0.0303 | 8.14 | — | — |
| VTRAFWAY: One-way | 0.2140 *** | 0.0815 | 2.62 | — | — |
| VALIGN: Straight | 0.1703 *** | 0.0609 | 2.8 | — | — |
| REGION: Midwest | −0.1221 *** | 0.0375 | −3.25 | — | — |
| REGION: South | −0.0916 *** | 0.0302 | −3.04 | — | — |
| ▲ Light Condition: Daylight | 0.1929 *** | 0.0415 | 4.65 | — | — |
| 0.5090 *** | 0.0129 | 39.56 | — | — | |
| 1.3173 *** | 0.0243 | 54.17 | — | — | |
| (correlation parameter) | 0.2440 *** | 0.0143 | 17.06 | — | — |
| Final log-likelihood | −23,365 | ||||
© 2019 by the authors. Licensee MDPI, Basel, Switzerland. This article is an open access article distributed under the terms and conditions of the Creative Commons Attribution (CC BY) license (http://creativecommons.org/licenses/by/4.0/).
Share and Cite
Chen, F.; Song, M.; Ma, X. Investigation on the Injury Severity of Drivers in Rear-End Collisions Between Cars Using a Random Parameters Bivariate Ordered Probit Model. Int. J. Environ. Res. Public Health 2019, 16, 2632. https://doi.org/10.3390/ijerph16142632
Chen F, Song M, Ma X. Investigation on the Injury Severity of Drivers in Rear-End Collisions Between Cars Using a Random Parameters Bivariate Ordered Probit Model. International Journal of Environmental Research and Public Health. 2019; 16(14):2632. https://doi.org/10.3390/ijerph16142632
Chicago/Turabian StyleChen, Feng, Mingtao Song, and Xiaoxiang Ma. 2019. "Investigation on the Injury Severity of Drivers in Rear-End Collisions Between Cars Using a Random Parameters Bivariate Ordered Probit Model" International Journal of Environmental Research and Public Health 16, no. 14: 2632. https://doi.org/10.3390/ijerph16142632
APA StyleChen, F., Song, M., & Ma, X. (2019). Investigation on the Injury Severity of Drivers in Rear-End Collisions Between Cars Using a Random Parameters Bivariate Ordered Probit Model. International Journal of Environmental Research and Public Health, 16(14), 2632. https://doi.org/10.3390/ijerph16142632