Hydrogeochemical Characteristics and Water Quality Evaluation of Carboniferous Taiyuan Formation Limestone Water in Sulin Mining Area in Northern Anhui, China

Abstract
:1. Introduction
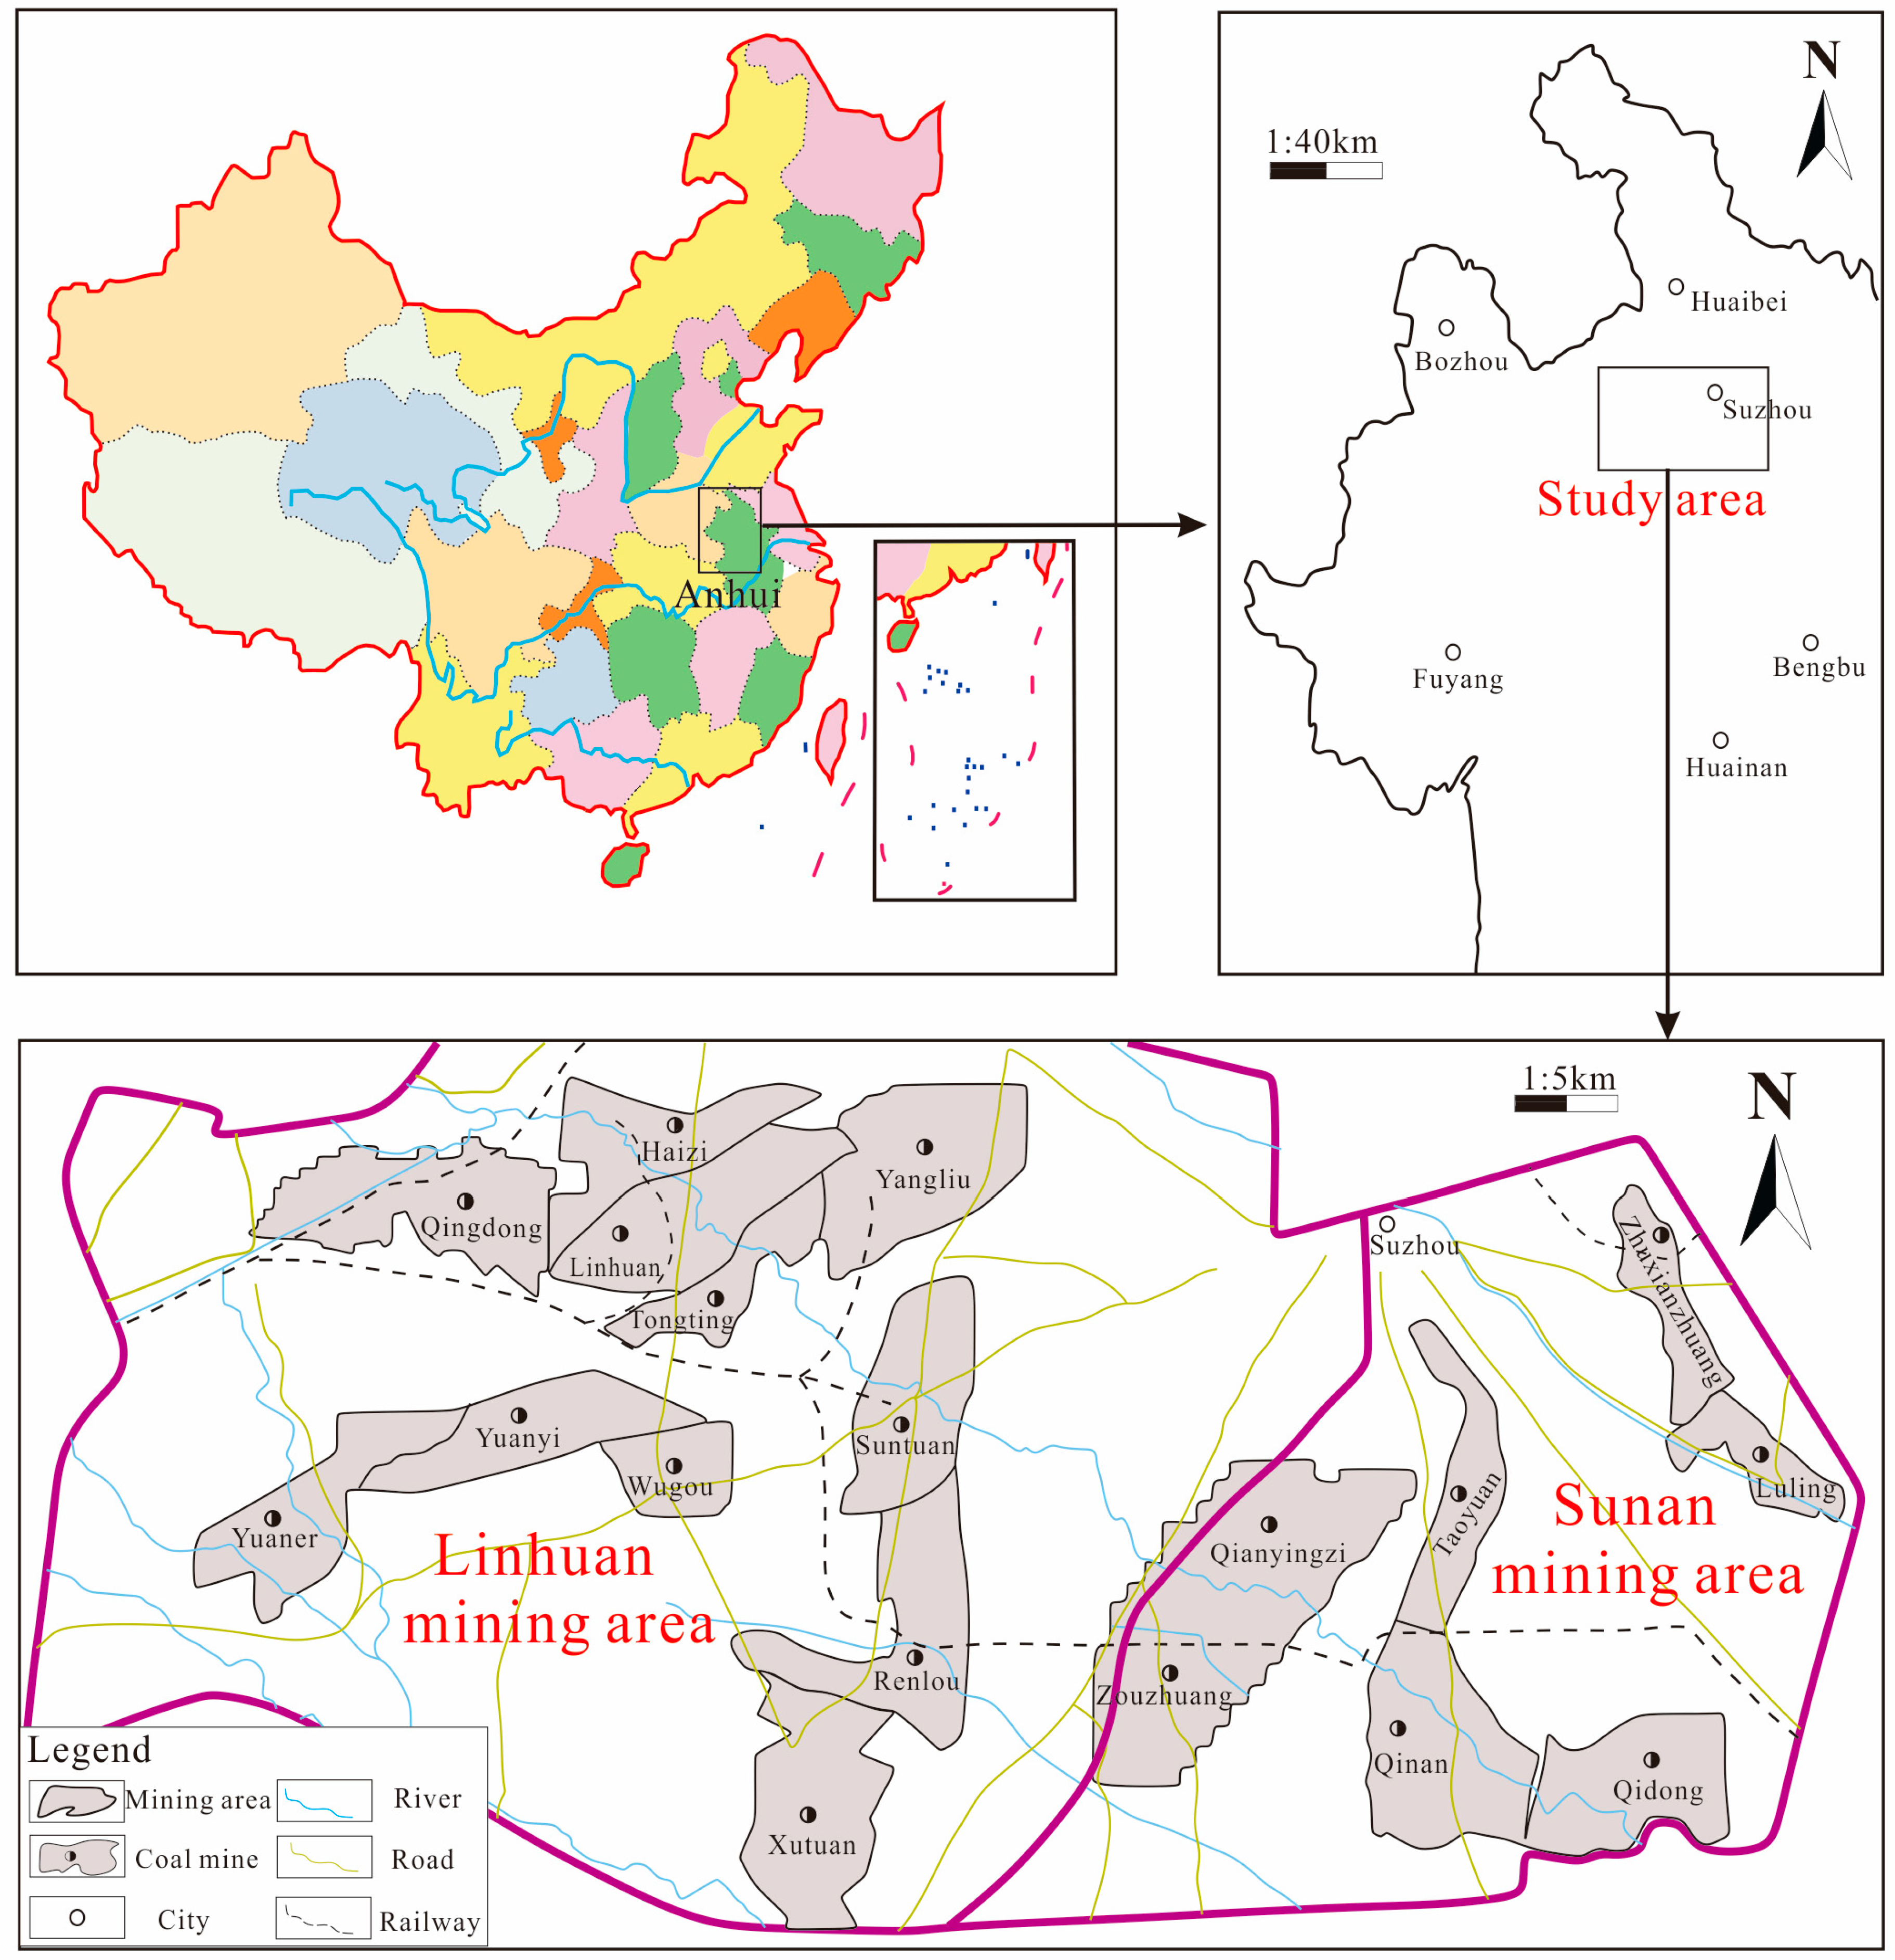
2. Study Area
3. Sampling Test and Research Method
3.1. Sampling and Testing
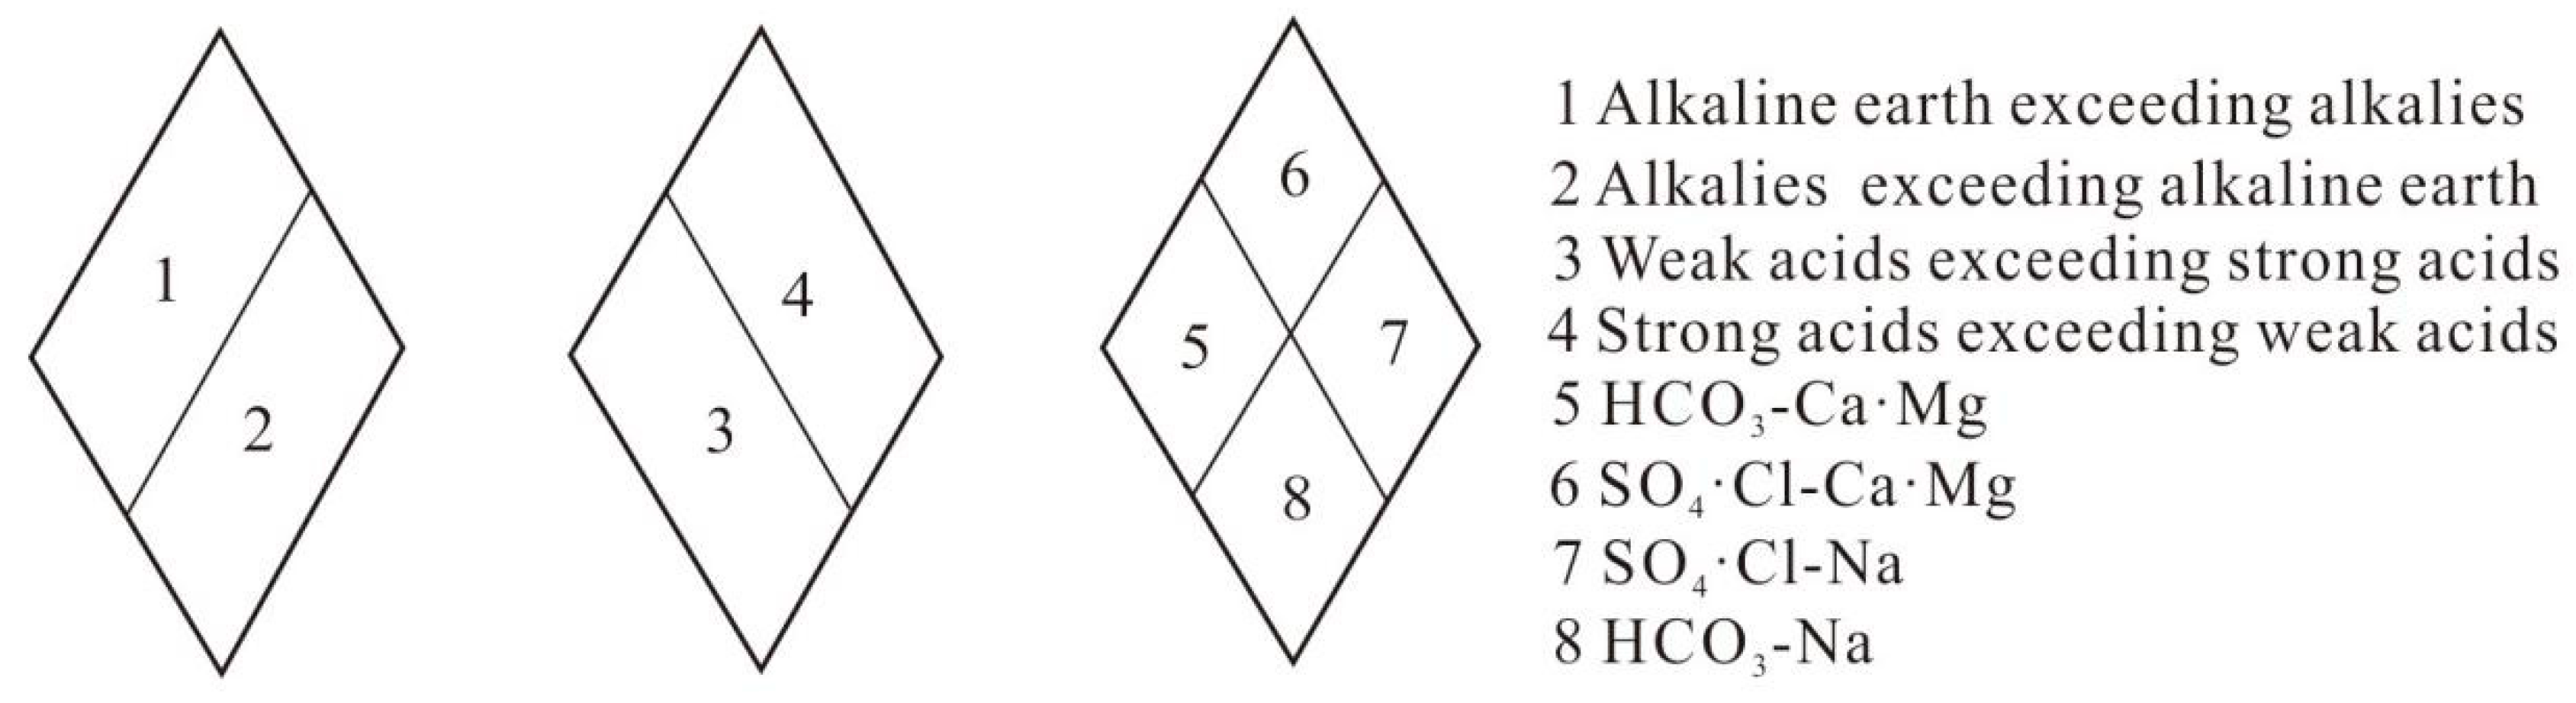
3.2. Research Methods
4. Results and Discussion
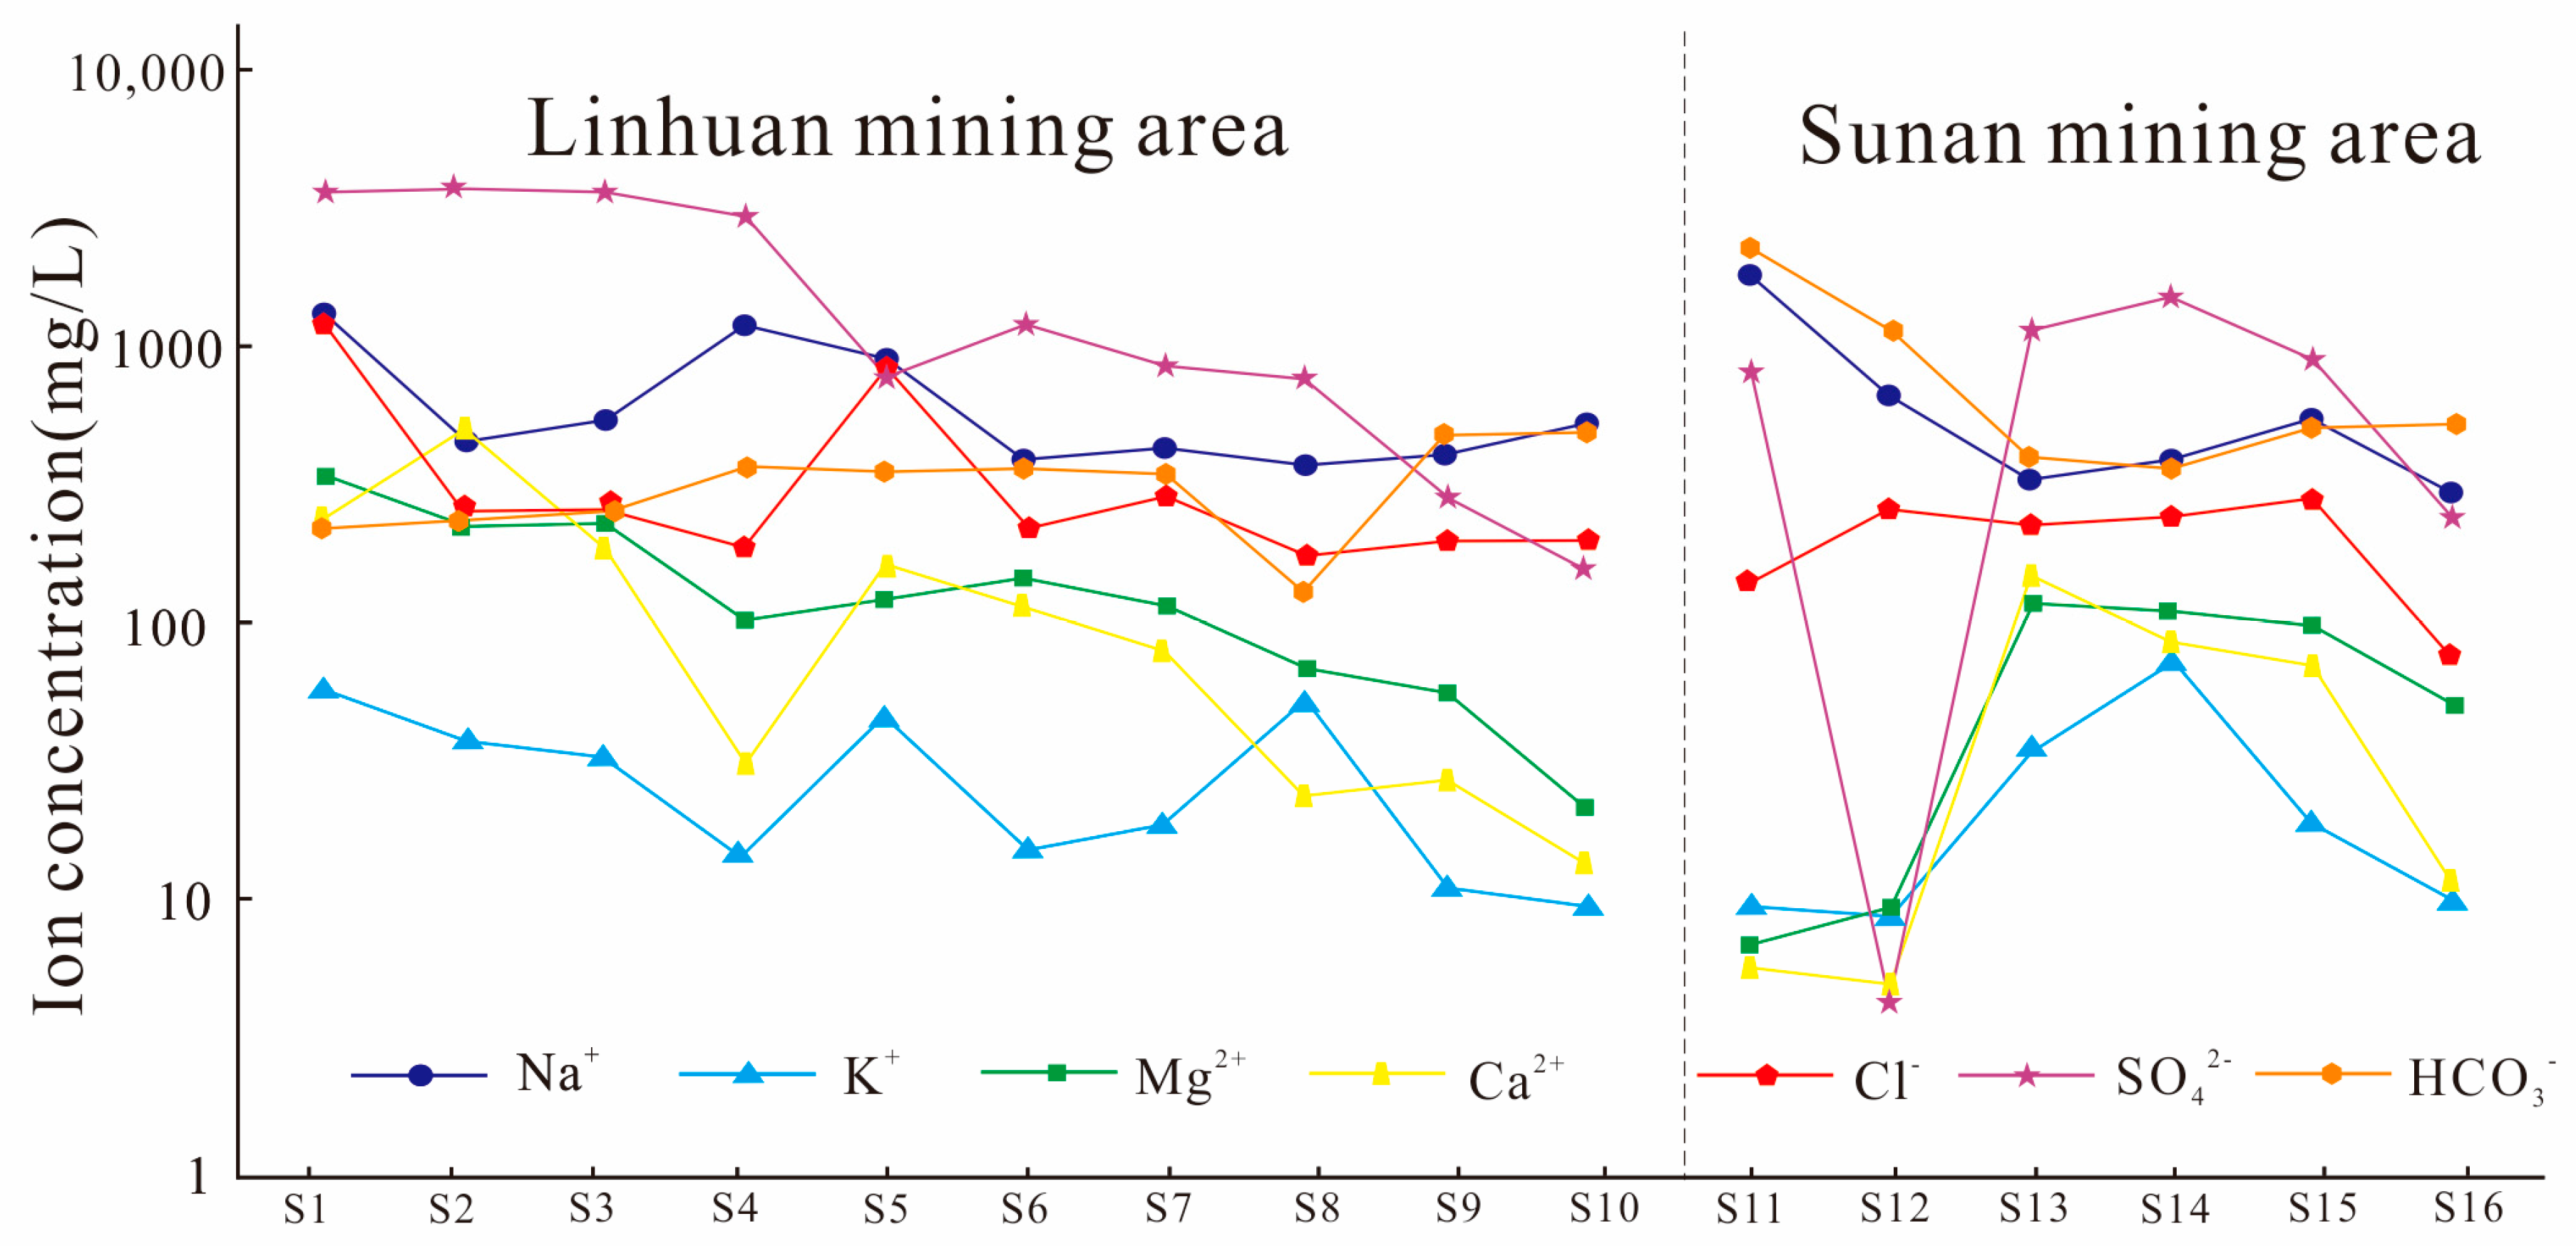
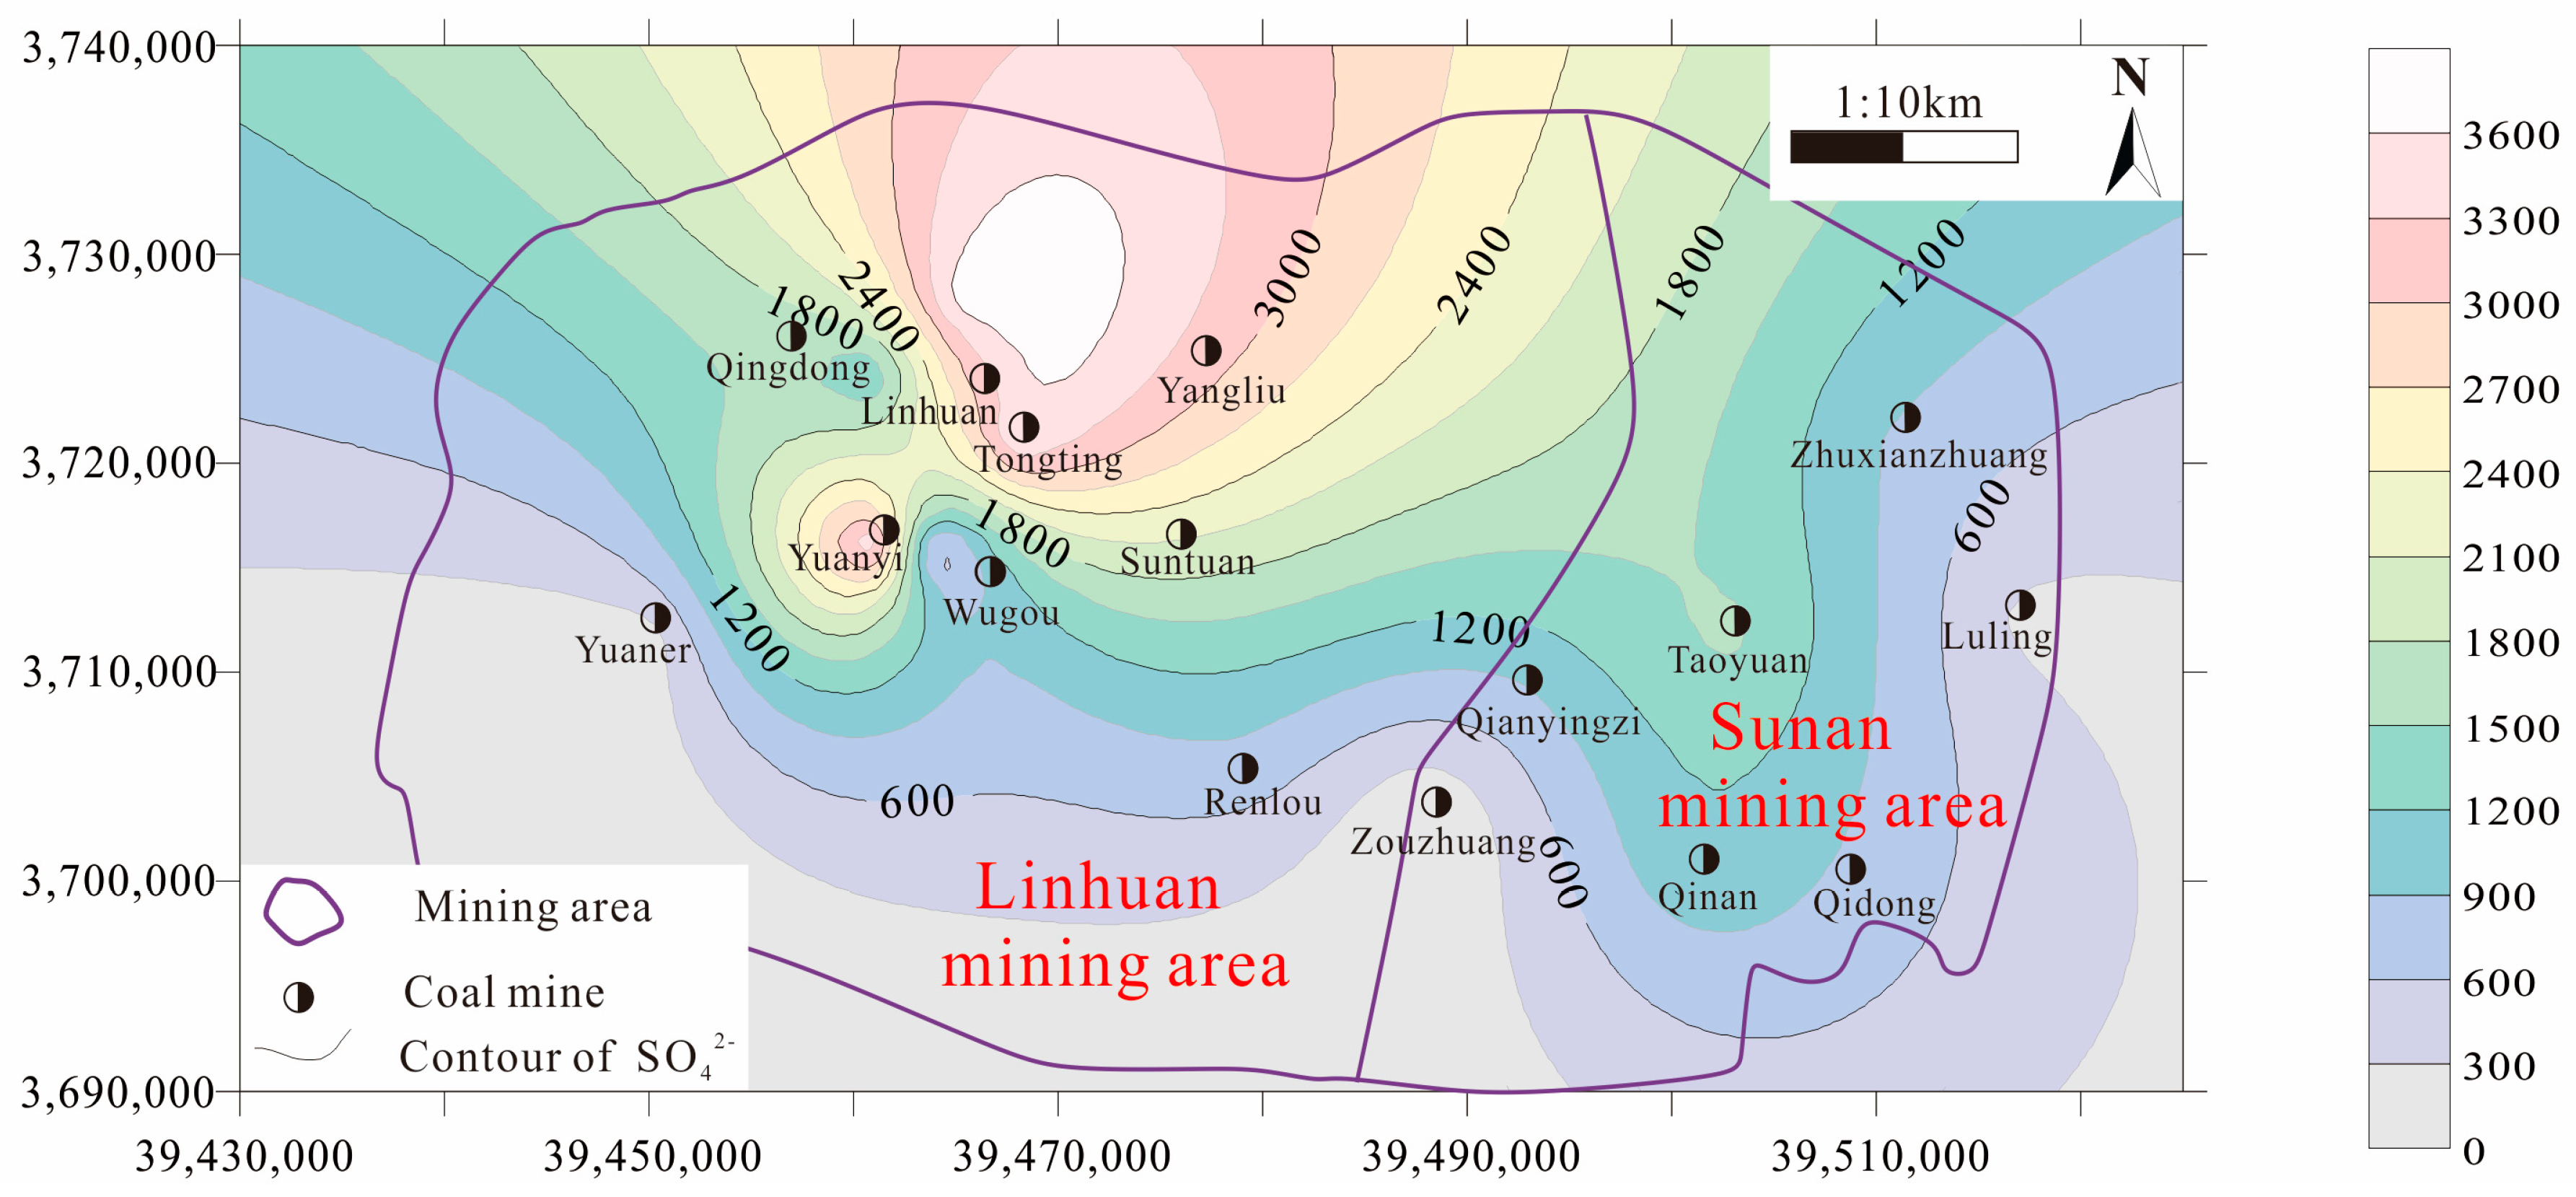
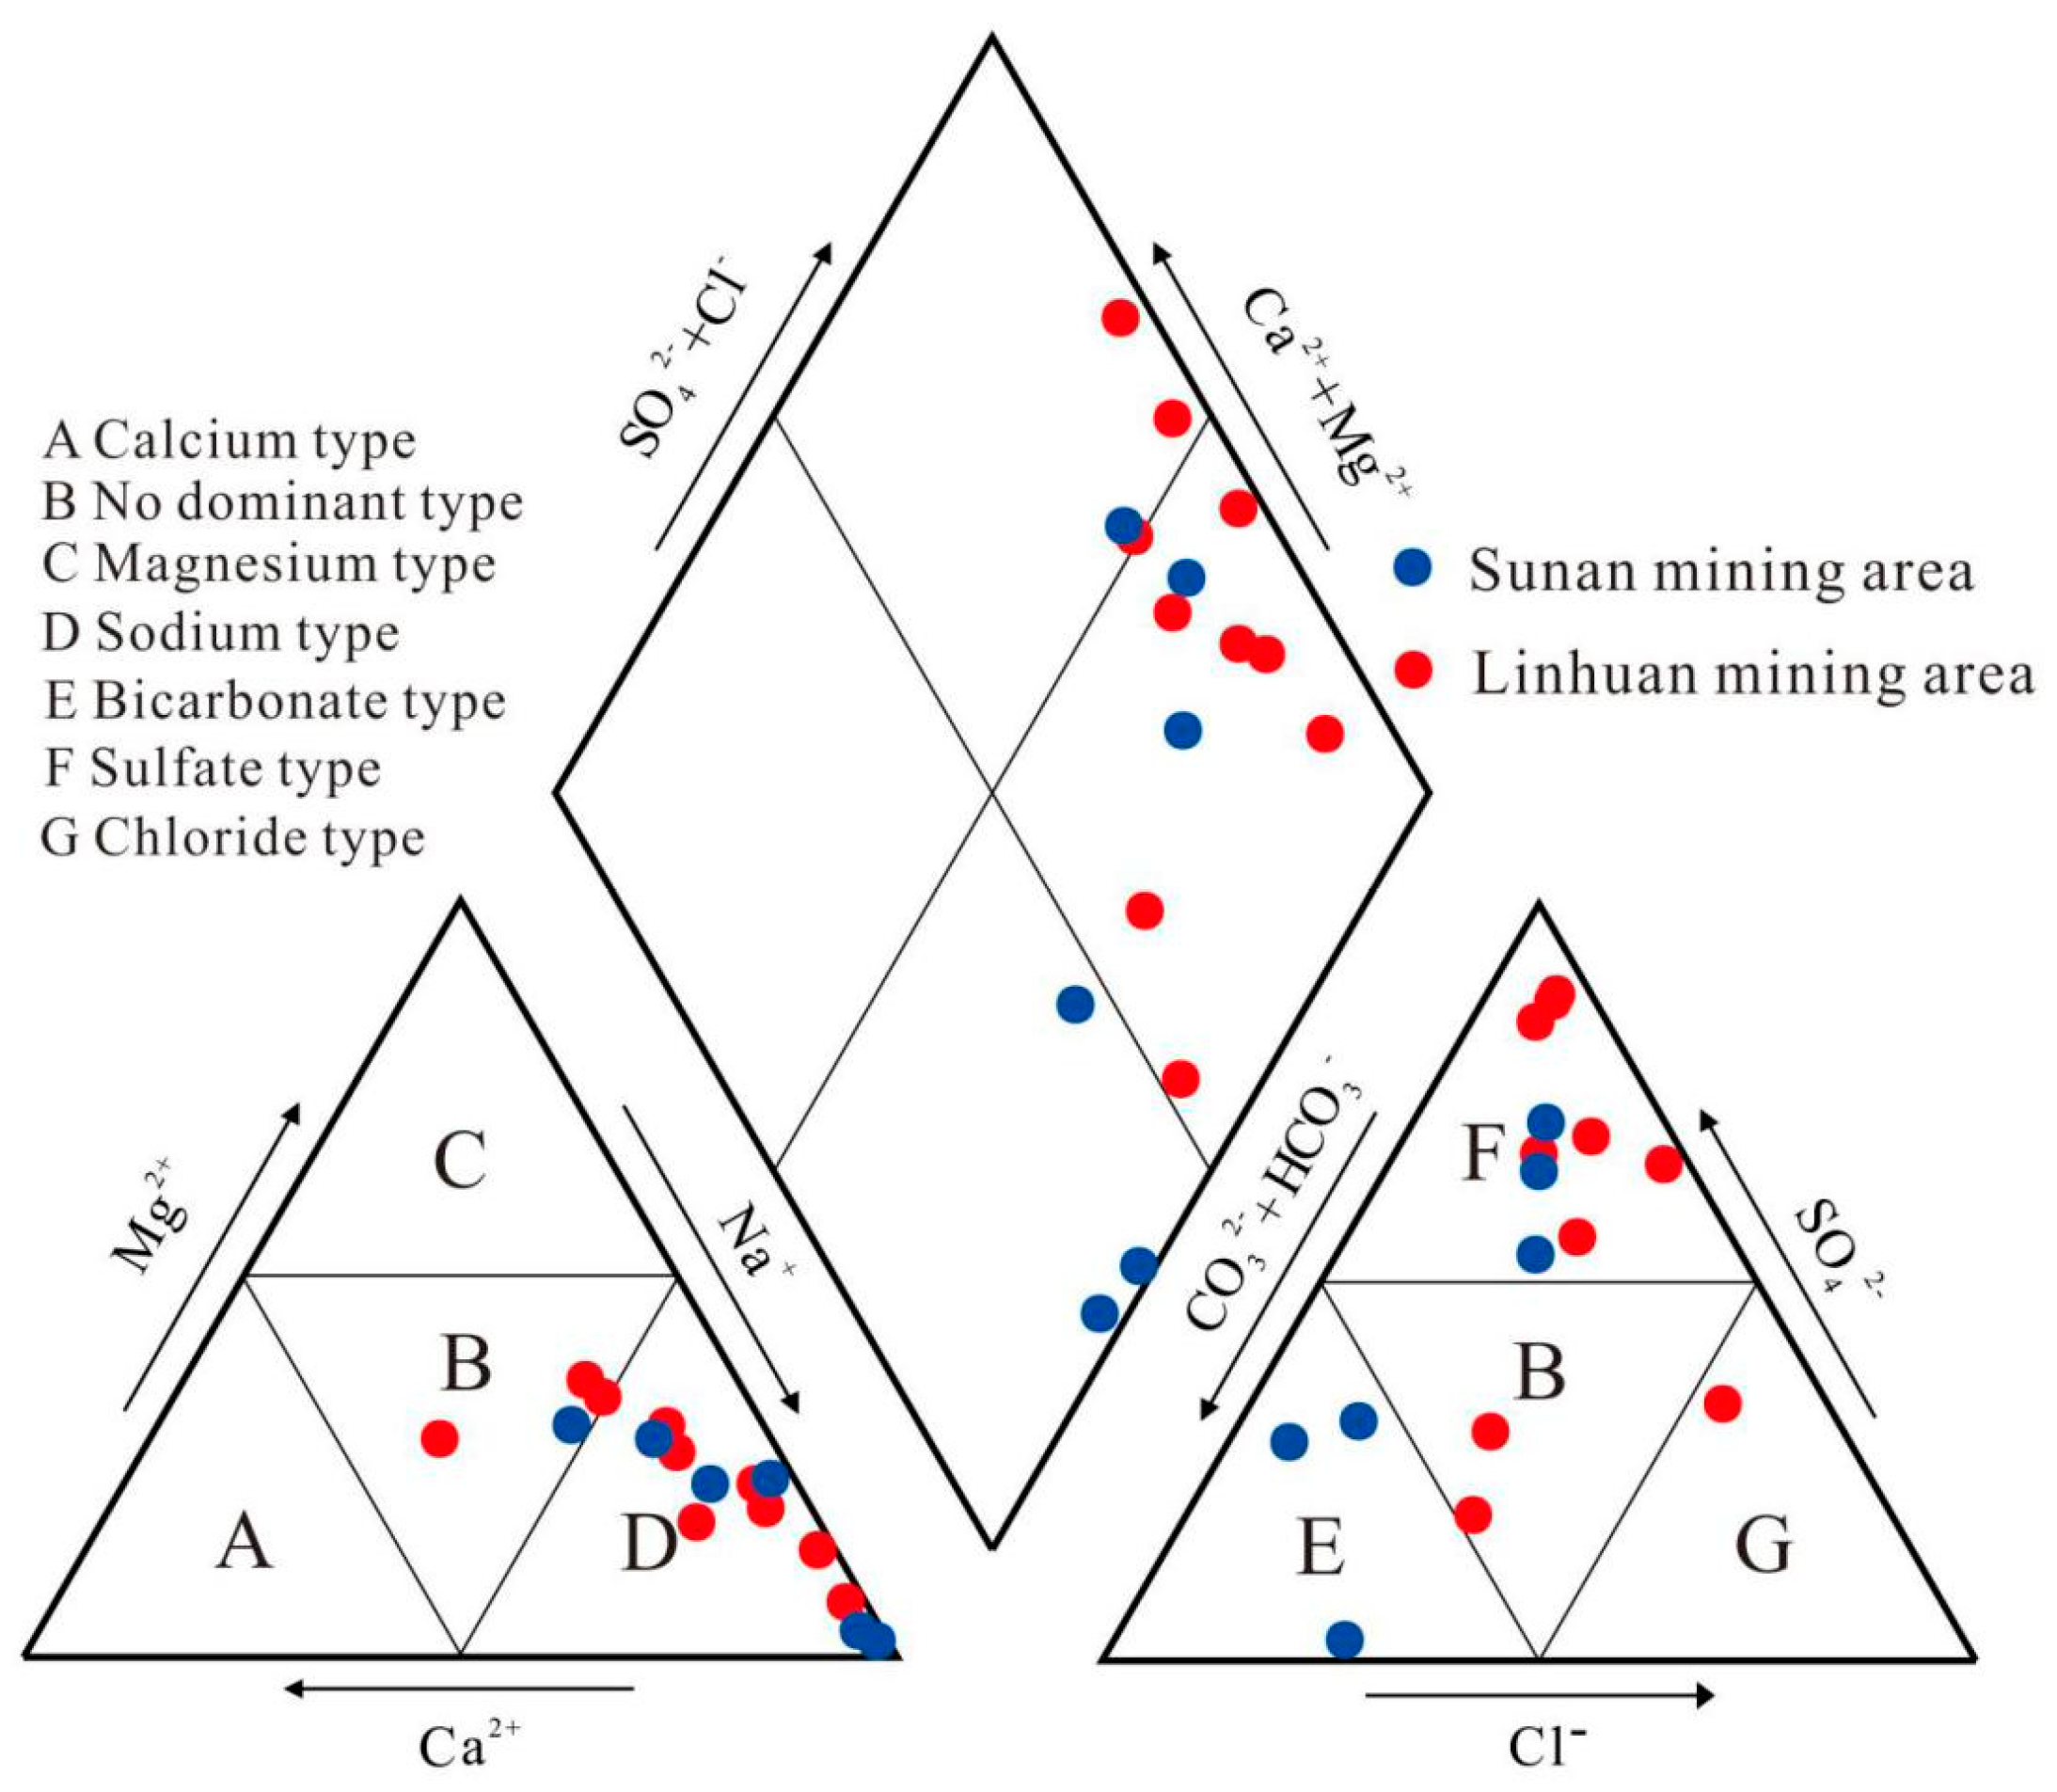
4.1. Analysis of Water Chemical Content Characteristics
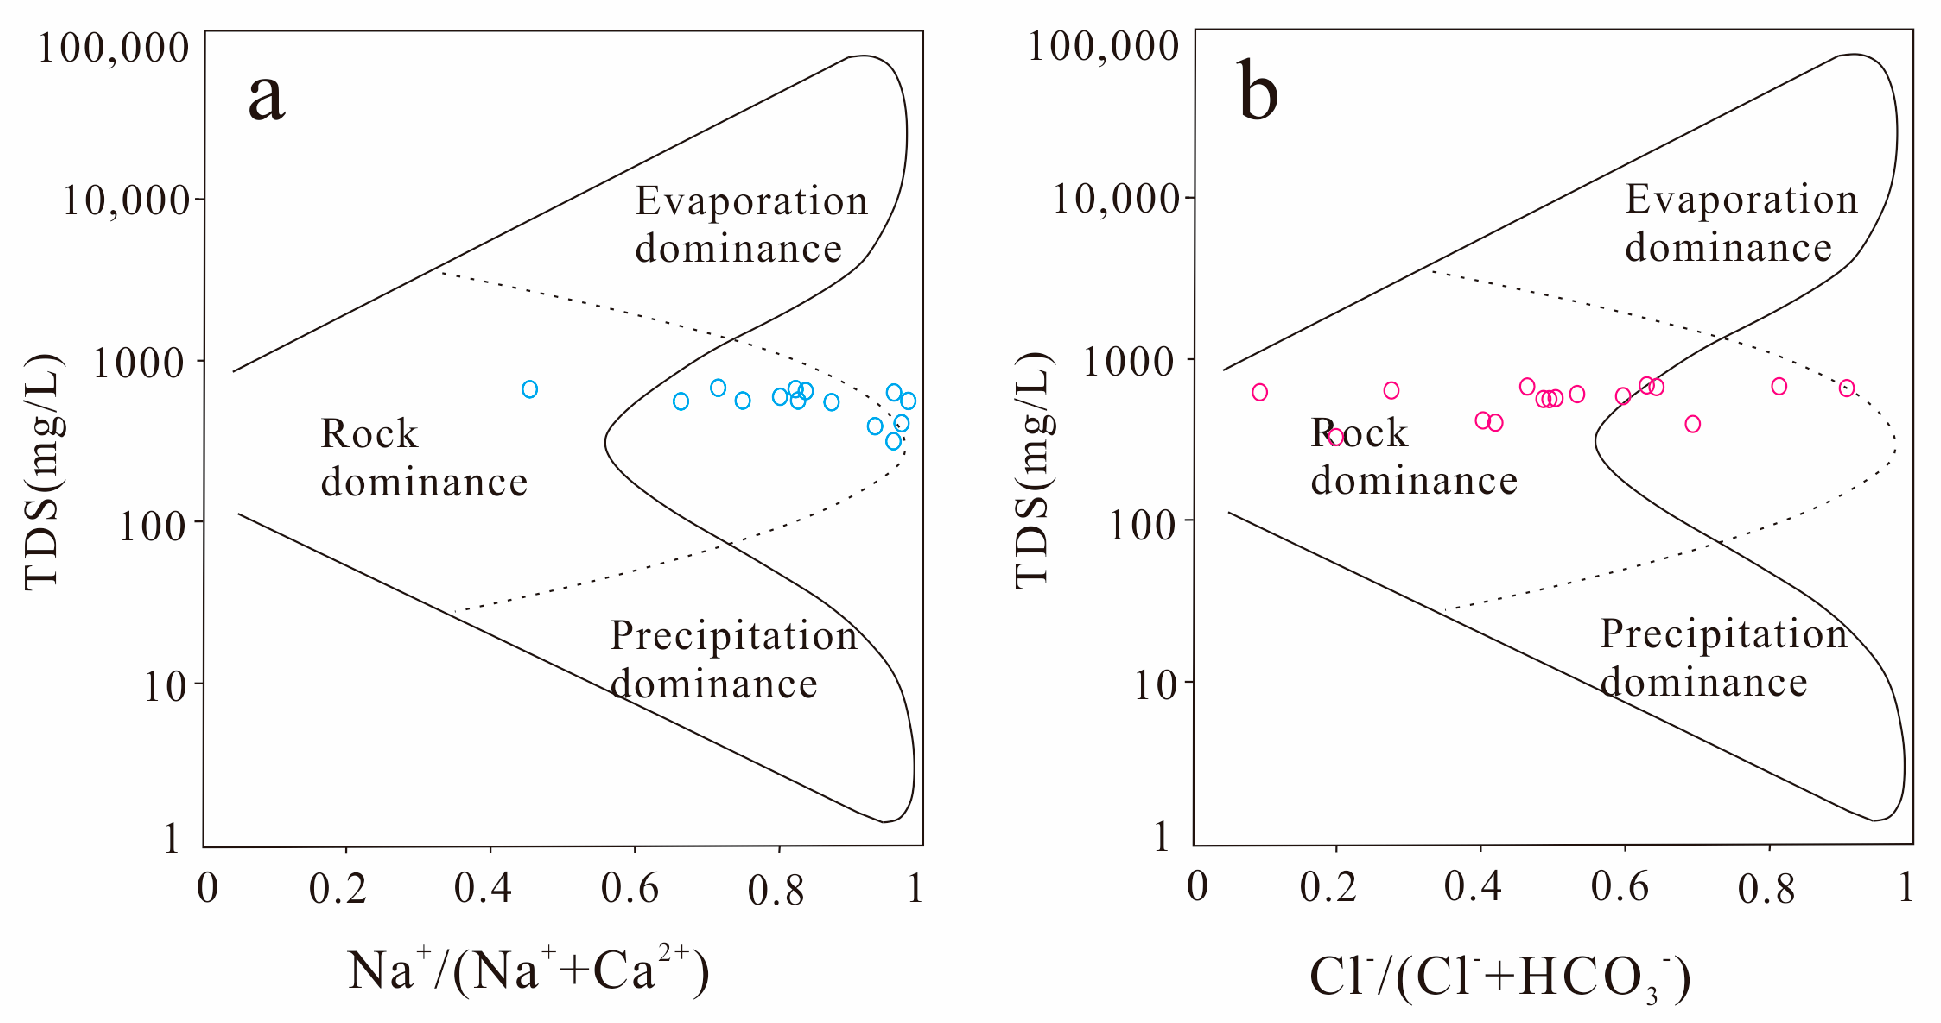
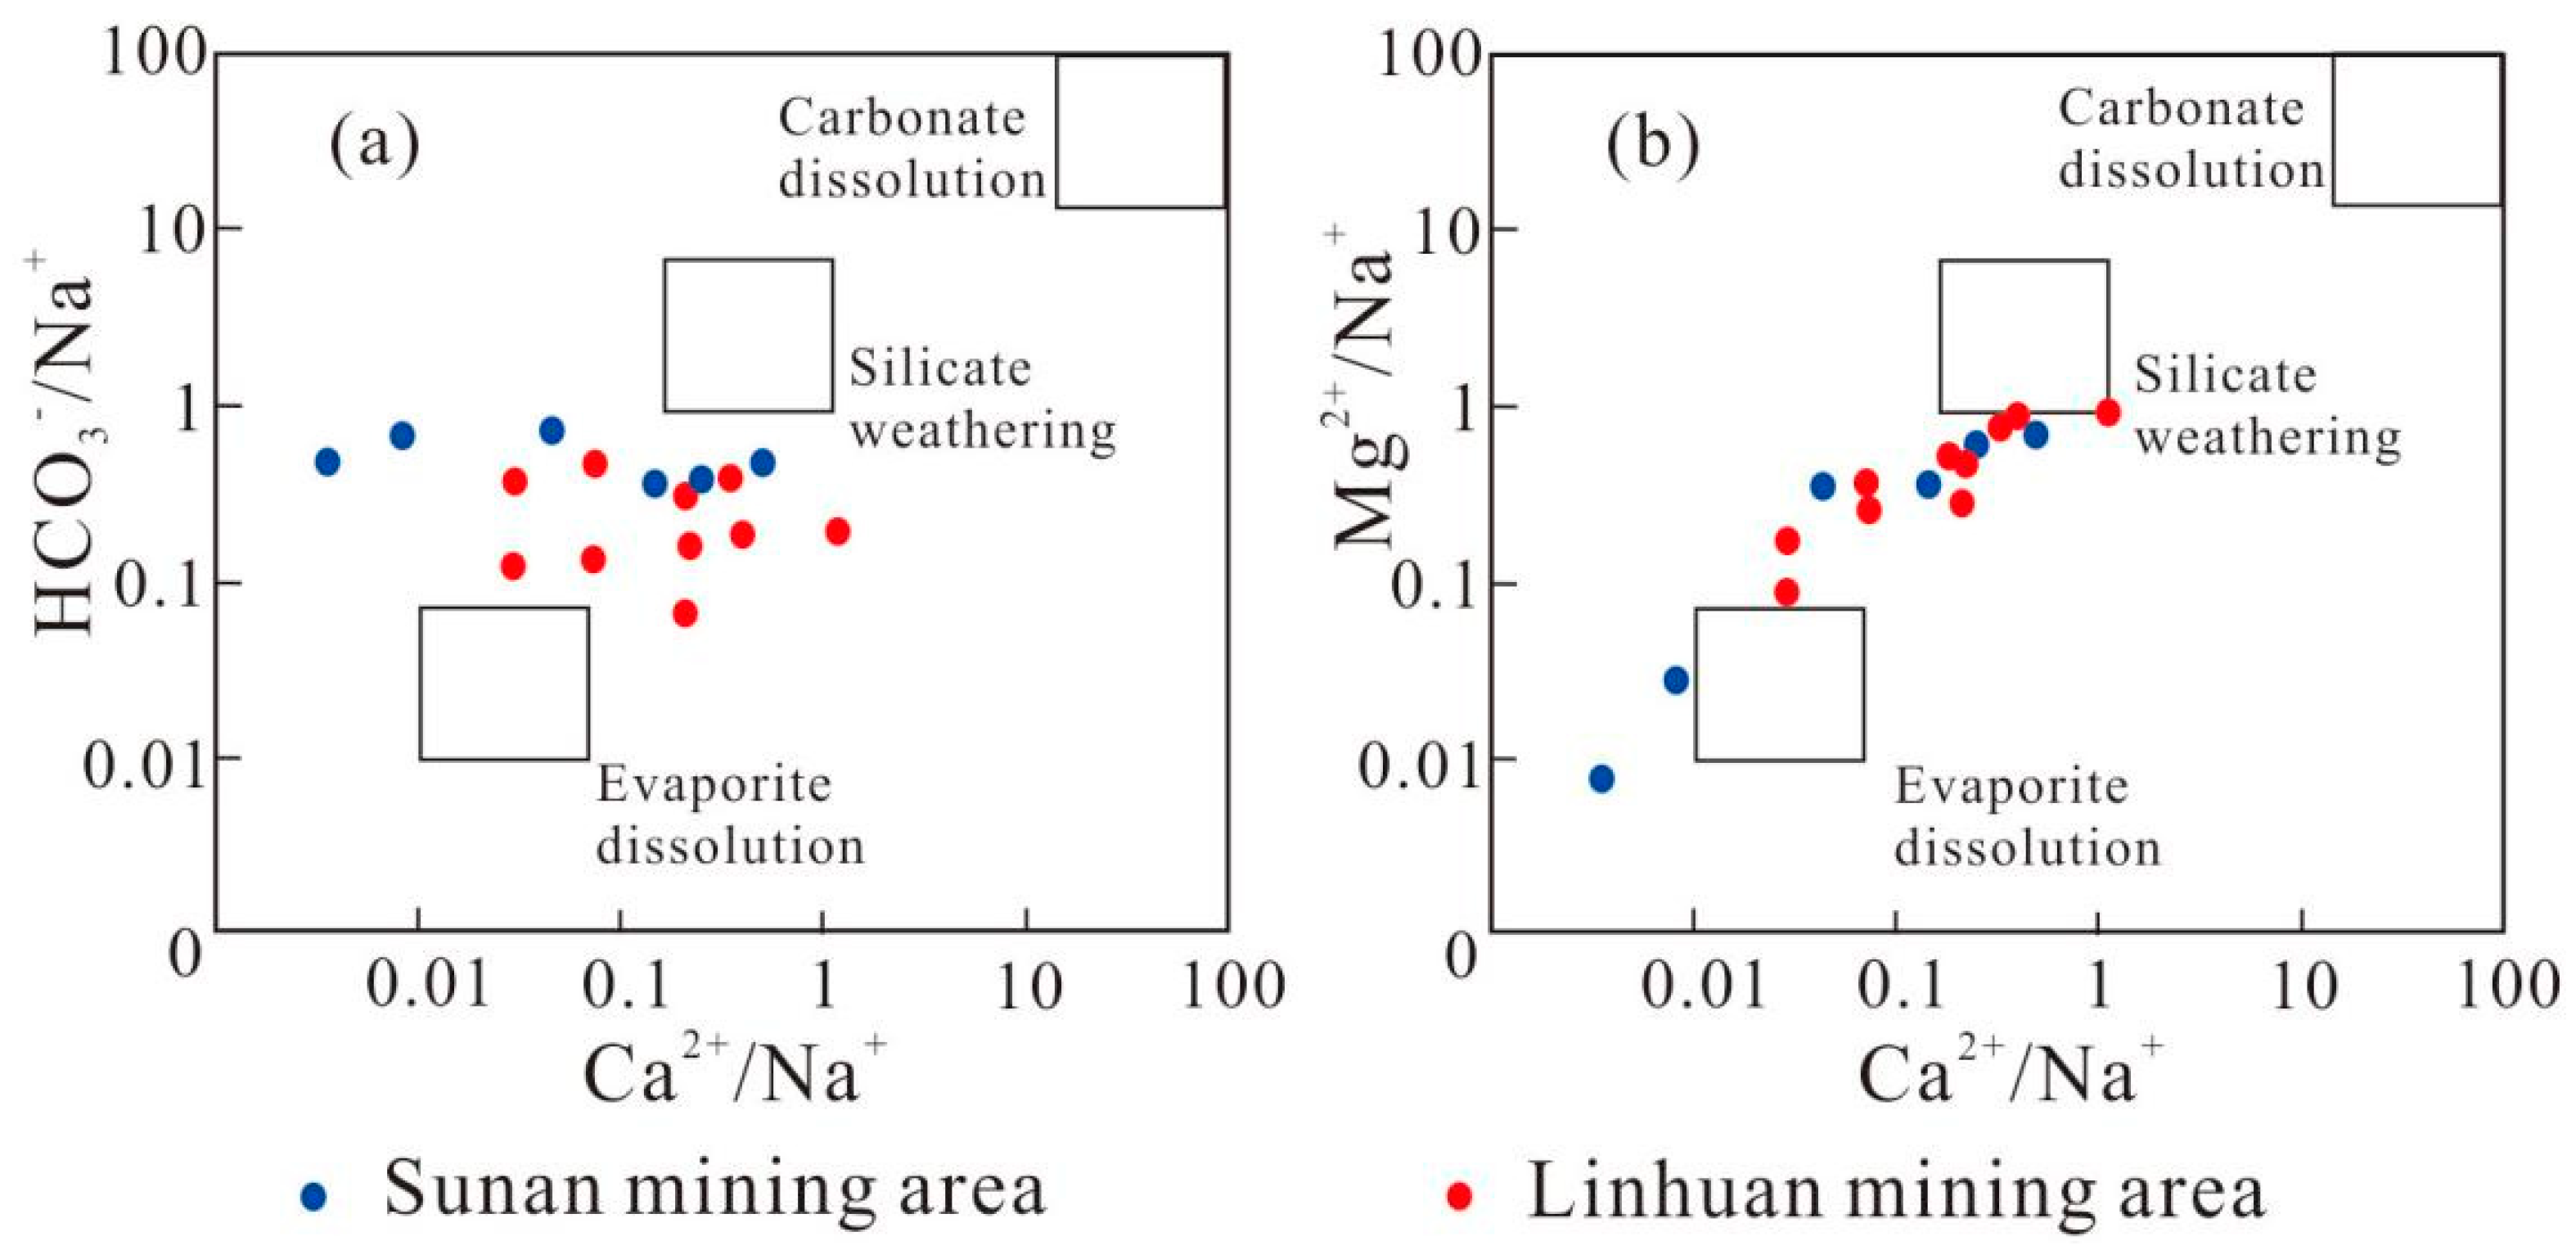
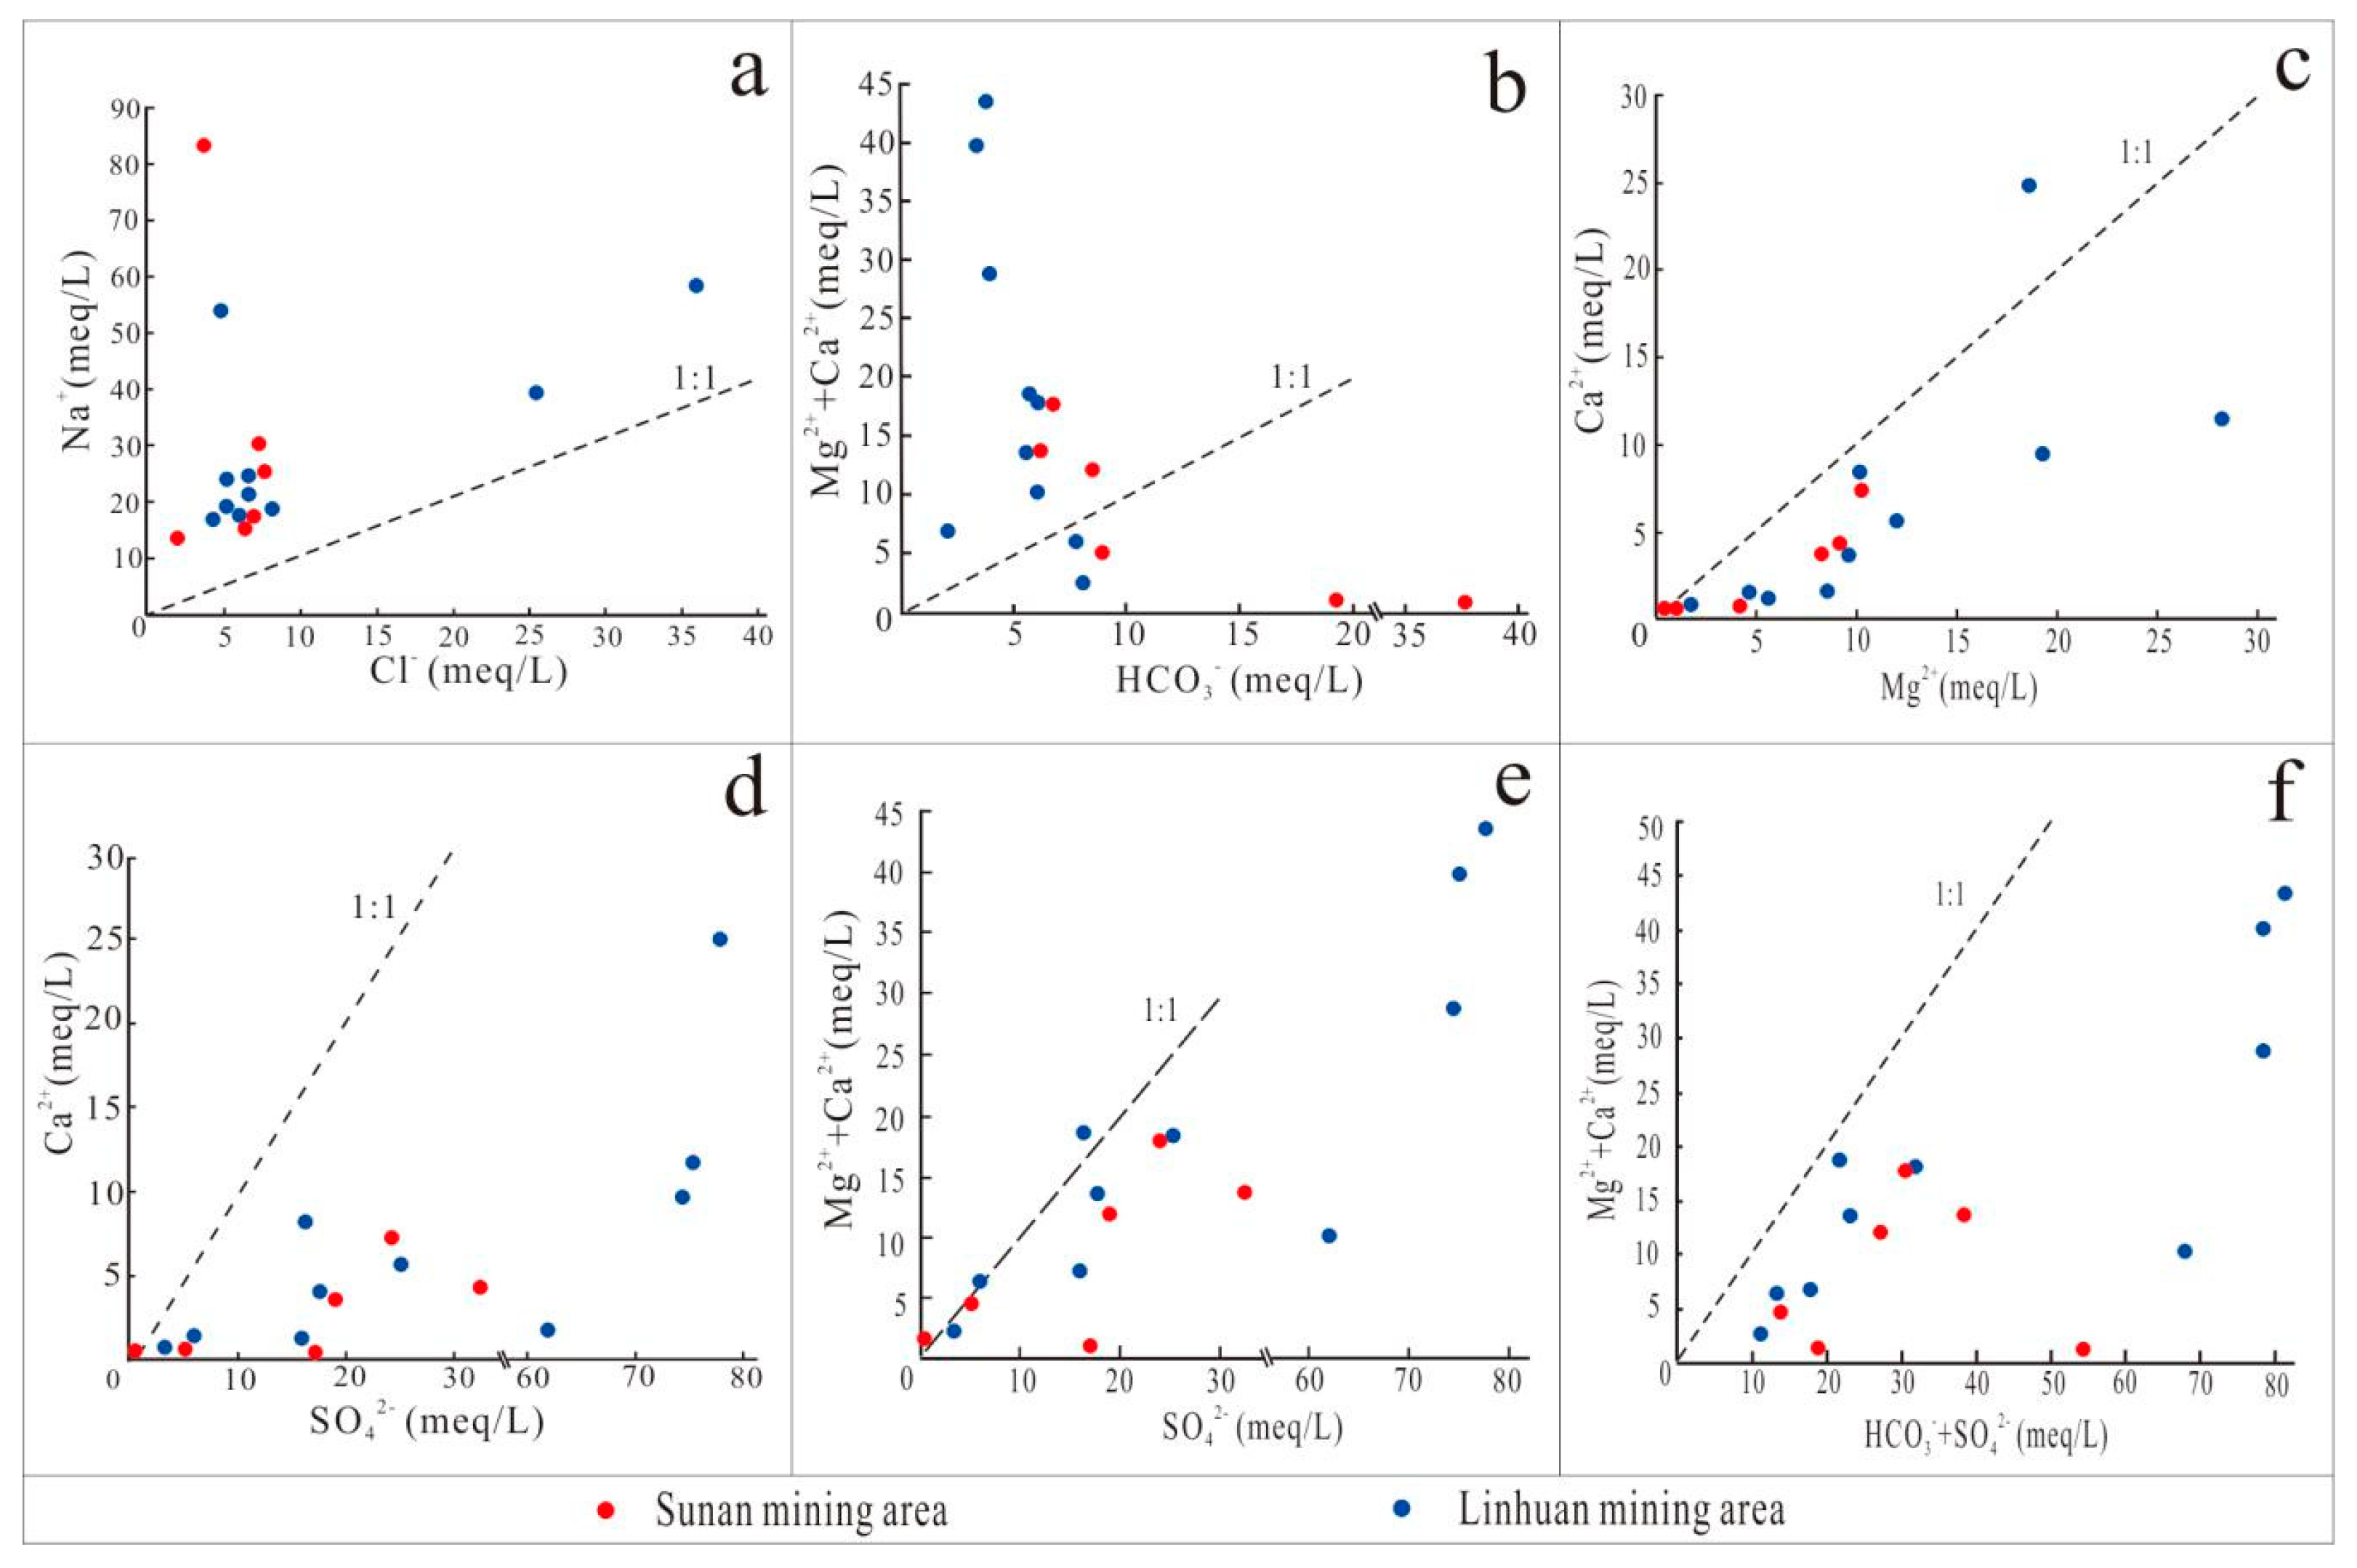
4.2. Mechanism Analysis of Water and Rock Action
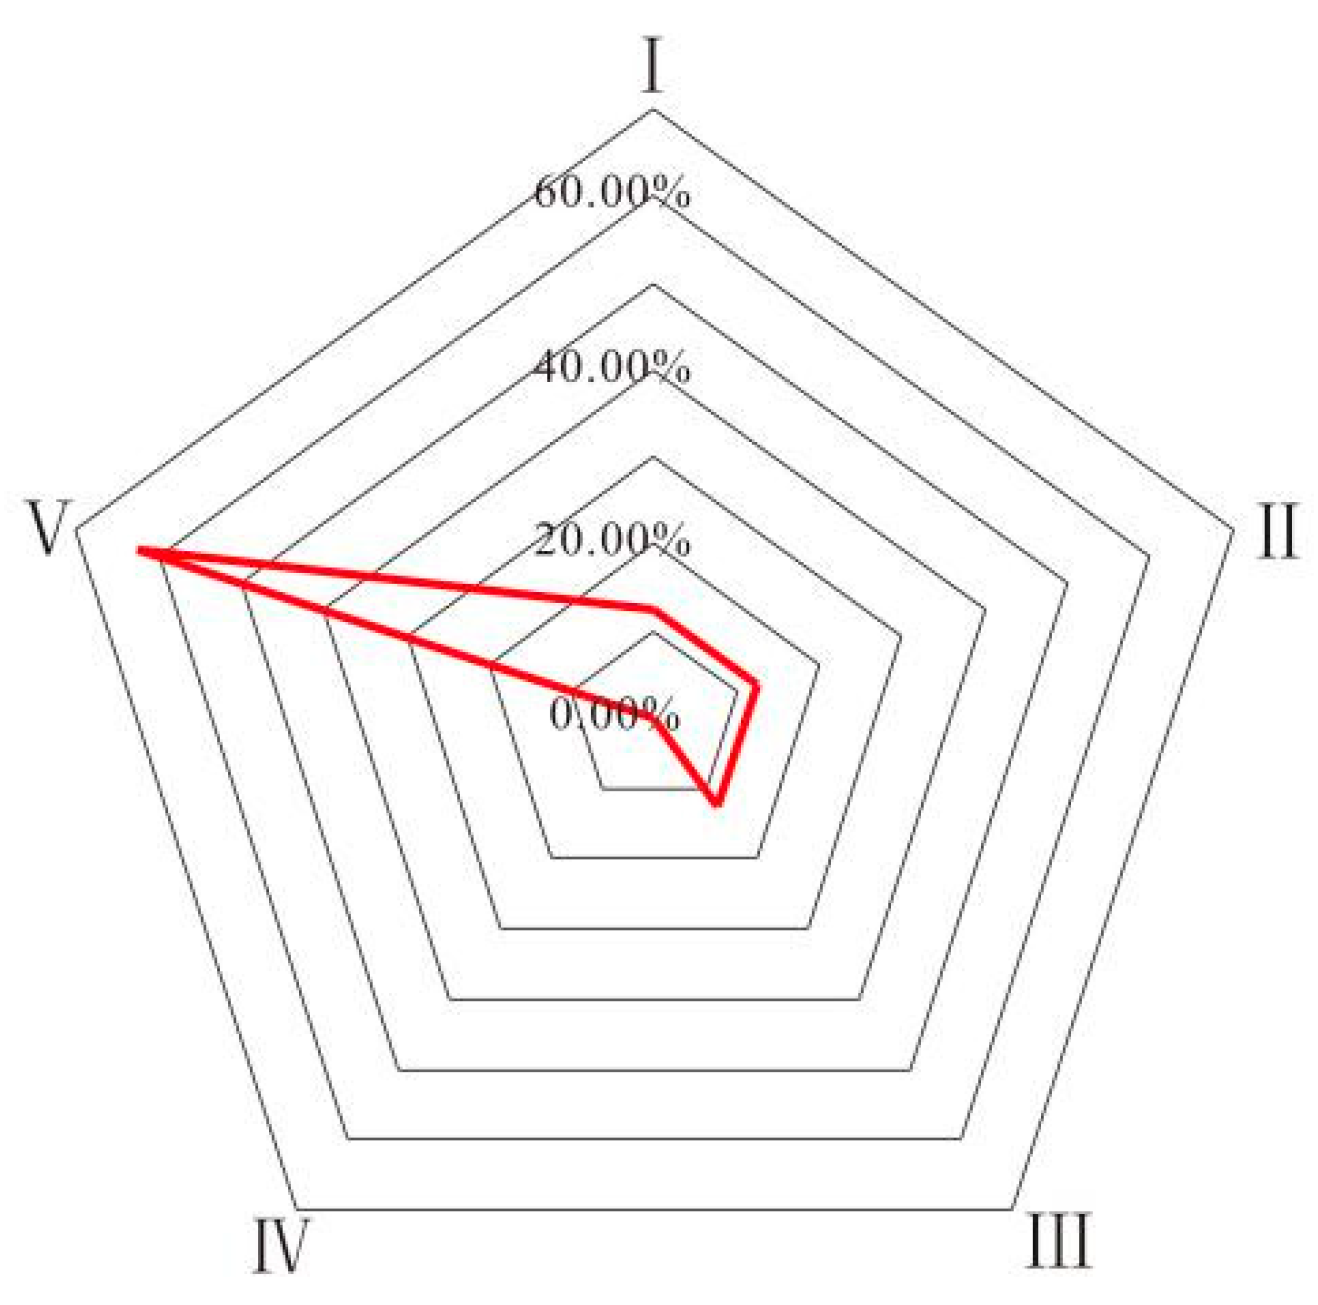
4.3. Fuzzy Comprehensive Evaluation of Water Quality
5. Conclusions
Author Contributions
Funding
Acknowledgments
Conflicts of Interest
References
- Wang, W.; Li, S. Analysis of the main global coal resource countries’ supply-demand structural trend and coal industry outlook. China Min. Mag. 2015, 24, 5–9. (In Chinese) [Google Scholar]
- Yang, Y.; Guo, T.; Jiao, W. Destruction processes of mining on water environment in the mining area combining isotopic and hydrochemical tracer. Environ. Pollut. 2018, 237, 356–365. [Google Scholar] [CrossRef] [PubMed]
- Tiwary, R.K. Environmental Impact of Coal Mining on Water Regime and Its Management. Water Air Soil Pollut. 2001, 132, 185–199. [Google Scholar] [CrossRef]
- Liu, P.; Hoth, N.; Drebenstedt, C.; Sun, Y.; Xu, Z. Hydro-geochemical paths of multi-layer groundwater system in coal mining regions—Using multivariate statistics and geochemical modeling approaches. Sci. Total Environ. 2017, 601, 1–14. [Google Scholar] [CrossRef] [PubMed]
- Yang, Q.; Wang, L.; Ma, H.; Yu, K.; Martín, J.D. Hydrochemical characterization and pollution sources identification of groundwater in Salawusu aquifer system of Ordos Basin, China. Environ. Pollut. 2016, 216, 340–349. [Google Scholar] [CrossRef] [PubMed]
- Owen, D.D.R.; Cox, M.E. Hydrochemical evolution within a large alluvial groundwater resource overlying a shallow coal seam gas reservoir. Sci. Total Environ. 2015, 523, 233–252. [Google Scholar] [CrossRef] [PubMed]
- Lin, M.L.; Peng, W.H.; Gui, H.R. Hydrochemical characteristics and quality assessment of deep groundwater from the coal-bearing aquifer of the Linhuan coal-mining district, Northern Anhui Province, China. Environ. Monit. Assess. 2016, 188, 202. [Google Scholar] [CrossRef] [PubMed]
- Fu, C.; Li, X.; Ma, J.; Liu, L.; Gao, M.; Bai, Z. A hydrochemistry and multi-isotopic study of groundwater origin and hydrochemical evolution in the middle reaches of the Kuye River basin. Appl. Geochem. 2018, 98, 82–93. [Google Scholar] [CrossRef]
- Guan, L.S.; Gui, H.R.; Kang, Z.Y.; Zhao, H.H.; Li, J. Hydrochemical Characteristics and water quality assessment in goaf water of KouQuanGou mining area in DaTong, Shanxi, China. Fresen. Environ. Bull. 2018, 27, 9315–9324. [Google Scholar]
- Li, J.; Gui, H.R.; Qiu, H.L.; Guan, L.S.; Ding, P.F. Evaluation of Environment Quality in Goal Water of Yungang Mining Area in Datong, Shanxi, China. Fresen. Environ. Bull. 2018, 27, 3692–3700. [Google Scholar]
- Qiu, H.; Gui, H.; Song, Q. Human health risk assessment of trace elements in shallow groundwater of the Linhuan coal-mining district, Northern Anhui Province, China. Hum. Ecol. Risk Assess. 2018, 24, 1342–1351. [Google Scholar] [CrossRef]
- Gui, H.; Lin, M. Types of water hazards in China coalmines and regional characteristics. Nat. Hazards 2016, 84, 1501–1512. [Google Scholar] [CrossRef]
- Gui, H.; Lin, M.; Song, X. Identification and Application of Roof Bed Separation (Water) in Coal Mines. Mine Water Environ. 2018, 37, 376–384. [Google Scholar] [CrossRef]
- Gui, H. Strontium Isotope and Major Ions Chemistry of Groundwater from Sunan Coal-Mining Region, Anhui Province, China. Nat. Environ. Pollut. Technol. 2016, 15, 679–682. [Google Scholar]
- Wang, Y.; Sheng, D.; Wang, D.; Ma, H.; Wu, J.; Xu, F. Variable Fuzzy Set Theory to Assess Water Quality of the Meiliang Bay in Taihu Lake Basin. Water Resour. Manag. 2014, 28, 867–880. [Google Scholar] [CrossRef]
- Xia, Y.; Gui, H.; Li, J.; Guan, L. Temporal variability of hydrochemical characteristics and water quality assessment of collapse pond in Zhuxianzhuang coal mining area, China. Fresen. Environ. Bull. 2019, 28, 402–409. [Google Scholar]
- Mohamed, A.K.; Dan, L.; Kai, S.; Mohamed, M.A.A.; Aldaw, E.; Elubid, B.A. Hydrochemical Analysis and Fuzzy Logic Method for Evaluation of Groundwater Quality in the North Chengdu Plain, China. Int. J. Environ. Res. Public Health 2019, 16, 302. [Google Scholar] [CrossRef]
- Dahiya, S.; Singh, B.; Gaur, S.; Garg, V.; Kushwaha, H. Analysis of groundwater quality using fuzzy synthetic evaluation. J. Hazard. Mater. 2007, 147, 938–946. [Google Scholar] [CrossRef]
- Li, Z.; Zhou, B.; Teng, D.; Yang, W.; Qiu, D. Comprehensive evaluation method of groundwater environment in a mining area based on fuzzy set theory. Geosyst. Eng. 2017, 21, 103–112. [Google Scholar] [CrossRef]
- General Administration of Quality Supervision, Inspection and Quarantine of the People’s Republic of China. Quality Standard for Groundwater (GB/T 14848-2017); AQSIQ: Beijing, China, 2017. (In Chinese)
- Ma, Y.; Zhen, X.; Li, Y.; Song, S. Improvement and application of fuzzy synthetic evaluation of groundwater quality. J. China Univ. Min. Technol. 2009, 38, 745–750. (In Chinese) [Google Scholar]
- Xie, F.; Zhang, Y.X.; Ren, Z.; Wang, H.; Ran, L.X. Application of method of improved fuzzy comprehensive evaluation in assessment of groundwater quality. J. Water Resour. Water Eng. 2014, 25, 125–128, 260. (In Chinese) [Google Scholar]
- WHO (World Health Organization). Guidelines for Drinkingwater Quality, 4th ed.; WHO (World Health Organization): Geneva, Switzerland, 2011. [Google Scholar]
- Ministry of Health of China. Standards for Drinking Water Quality; National Standard Gb 5749-2006; Standardization Administration of China: Beijing, China, 2006. (In Chinese) [Google Scholar]
- Dogramaci, S.; Mclean, L.; Skrzypek, G. Hydrochemical and stable isotope indicators of pyrite oxidation in carbonate-rich environment; the Hamersley Basin, Western Australia. J. Hydrol. 2017, 545, 288–298. [Google Scholar] [CrossRef]
- Yang, Z. Deep Karst Development and Water Abundance Characteristics of Taiyuan Formation Limestone in Linhuan Coalmine District. Master’s Thesis, Anhui University of Science and Technology, Huainan, China, 2016. (In Chinese). [Google Scholar]
- Chen, L.; Xie, W.; Feng, X.; Zhang, N.; Yin, X. Formation of hydrochemical composition and spatio-temporal evolution mechanism under mining-induced disturbance in the Linhuan coal-mining district. Arab. J. Geosci. 2017, 10, 57. [Google Scholar] [CrossRef]
- Karmegam, U.; Chidambaram, S.; Prasanna, M.V.; Sasidhar, P.; Manikandan, S.; Johnsonbabu, G.; Dheivanayaki, V.; Paramaguru, P.; Manivannan, R.; Srinivasamoorthy, K.; et al. A study on the mixing proportion in groundwater samples by using Piper diagram and Phreeqc model. Chin. J. Geochem. 2011, 30, 490–495. [Google Scholar] [CrossRef]
- Xie, F. The Groundwater Quality Assessment and Response of Different Irrigation Water Sources to Groundwater in Jinghuiqiu Irrigation District. Master’s Thesis, Northwest A&F University, Xian, China, 2016. (In Chinese). [Google Scholar]
- Chen, L.W.; Gui, H.R.; Yin, X.X. Monitoring of flow field based on stable isotope geochemical characteristics in deep groundwater. Environ. Monit. Assess. 2011, 179, 487–498. [Google Scholar] [CrossRef] [PubMed]
- Gaillardet, J.; Dupre, B.; Louvat, P.; Allègre, C. Global silicate weathering and CO2 consumption rates deduced from the chemistry of large rivers. Chem. Geol. 1999, 159, 2–30. [Google Scholar] [CrossRef]
- Murkute, Y.A. Hydrogeochemical characterization and quality assessment of groundwater around Umrer coal mine area Nagpur District, Maharashtra, India. Environ. Earth Sci. 2014, 72, 4059–4073. [Google Scholar] [CrossRef]
- Marghade, D.; Malpe, D.B.; Zade, A.B. Geochemical characterization of groundwater from northeastern part of Nagpur urban, Central India. Environ. Earth Sci. 2011, 62, 1419–1430. [Google Scholar] [CrossRef]
- Meybeck, M. Global chemical weathering of surficial rocks estimated from river dissolved loads. Am. J. Sci. 1987, 287, 401–428. [Google Scholar] [CrossRef]
- Tiwari, A.K.; Singh, P.K.; Mahato, M.K. Environmental Geochemistry and a Quality Assessment of Mine Water of the West Bokaro Coalfield, India. Mine Water Environ. 2016, 35, 525–535. [Google Scholar] [CrossRef]
- Xing, L.; Guo, H.; Zhan, Y. Groundwater hydrochemical characteristics and processes along flow paths in the North China Plain. J. Asian Earth Sci. 2013, 70, 250–264. [Google Scholar] [CrossRef]


| Grade | Classification | Parameters (Unit: mg/L) | |||
|---|---|---|---|---|---|
| TDS | Na+ | Cl− | SO42− | ||
| I | Excellent suitable for drinking water | ≤300 | ≤100 | ≤50 | ≤50 |
| II | Good suitable for drinking water | ≤500 | ≤150 | ≤150 | ≤150 |
| III | Moderate suitable for drinking water | ≤1000 | ≤200 | ≤250 | ≤250 |
| IV | Poor suitable for drinking water | ≤2000 | ≤400 | ≤350 | ≤350 |
| V | Unsuitable suitable for drinking water | >2000 | >400 | >350 | >350 |
| Paramaters | Units | Min | Max | Mean | C.V(%) | a | b |
|---|---|---|---|---|---|---|---|
| pH | – | 6.78 | 8.24 | 7.31 | 5.3 | 6.5–8.5 | 6.5–8.5 |
| TDS | mg/L | 327 | 686 | 567.63 | 20.04 | 500 | 1000 |
| Na+ | mg/L | 302.72 | 1872.59 | 667.20 | 47.55 | 200 | 200 |
| K+ | mg/L | 8.92 | 75.69 | 28.44 | 70.46 | 12 | − |
| Mg2+ | mg/L | 6.94 | 339.27 | 114.27 | 75.33 | 50 | − |
| Ca2+ | mg/L | 5.06 | 496.19 | 106.44 | 114.69 | 70 | − |
| Cl− | mg/L | 78.76 | 1285.72 | 326.64 | 93.02 | 250 | 250 |
| SO42− | mg/L | 4.40 | 3736.16 | 1416.64 | 89.06 | 250 | 250 |
| HCO3− | mg/L | 129.97 | 2297.29 | 534.85 | 94.92 | 500 | − |
| Sample | I | II | III | IV | V | Water Quality Level |
|---|---|---|---|---|---|---|
| S1 | 0 | 0.2422 | 0.1204 | 0 | 0.6375 | V |
| S2 | 0 | 0.2411 | 0.2719 | 0 | 0.4870 | V |
| S3 | 0 | 0.2277 | 0.2853 | 0 | 0.4870 | V |
| S4 | 0 | 0.3276 | 0.1854 | 0 | 0.4870 | V |
| S5 | 0 | 0.2306 | 0.1320 | 0 | 0.6375 | V |
| S6 | 0 | 0.0376 | 0.4341 | 0.2134 | 0.3149 | III |
| S7 | 0 | 0.0812 | 0.3701 | 0.0616 | 0.4870 | V |
| S8 | 0 | 0.3032 | 0.2360 | 0.1532 | 0.3149 | V |
| S9 | 0.1849 | 0.2529 | 0.2852 | 0.1049 | 0.1721 | III |
| S10 | 0.1396 | 0.5878 | 0.1005 | 0 | 0.1721 | II |
| S11 | 0.0120 | 0.4132 | 0.0877 | 0 | 0.4870 | V |
| S12 | 0.3149 | 0.2661 | 0.2274 | 0.0194 | 0.1721 | I |
| S13 | 0 | 0.3287 | 0.2336 | 0.1229 | 0.3149 | II |
| S14 | 0.0120 | 0.2893 | 0.0847 | 0.3111 | 0.3149 | V |
| S15 | 0 | 0.3154 | 0.1449 | 0.0527 | 0.4870 | V |
| S16 | 0.4208 | 0.0922 | 0.0996 | 0.3874 | 0.0000 | I |
© 2019 by the authors. Licensee MDPI, Basel, Switzerland. This article is an open access article distributed under the terms and conditions of the Creative Commons Attribution (CC BY) license (http://creativecommons.org/licenses/by/4.0/).
Share and Cite
Wang, M.; Gui, H.; Hu, R.; Zhao, H.; Li, J.; Yu, H.; Fang, H. Hydrogeochemical Characteristics and Water Quality Evaluation of Carboniferous Taiyuan Formation Limestone Water in Sulin Mining Area in Northern Anhui, China. Int. J. Environ. Res. Public Health 2019, 16, 2512. https://doi.org/10.3390/ijerph16142512
Wang M, Gui H, Hu R, Zhao H, Li J, Yu H, Fang H. Hydrogeochemical Characteristics and Water Quality Evaluation of Carboniferous Taiyuan Formation Limestone Water in Sulin Mining Area in Northern Anhui, China. International Journal of Environmental Research and Public Health. 2019; 16(14):2512. https://doi.org/10.3390/ijerph16142512
Chicago/Turabian StyleWang, Meichen, Herong Gui, Rongjie Hu, Honghai Zhao, Jun Li, Hao Yu, and Hongxia Fang. 2019. "Hydrogeochemical Characteristics and Water Quality Evaluation of Carboniferous Taiyuan Formation Limestone Water in Sulin Mining Area in Northern Anhui, China" International Journal of Environmental Research and Public Health 16, no. 14: 2512. https://doi.org/10.3390/ijerph16142512
APA StyleWang, M., Gui, H., Hu, R., Zhao, H., Li, J., Yu, H., & Fang, H. (2019). Hydrogeochemical Characteristics and Water Quality Evaluation of Carboniferous Taiyuan Formation Limestone Water in Sulin Mining Area in Northern Anhui, China. International Journal of Environmental Research and Public Health, 16(14), 2512. https://doi.org/10.3390/ijerph16142512