Healthy Food Access in Low-Income High-Minority Communities: A Longitudinal Assessment—2009–2017

 , ,
, ,
Abstract
1. Introduction
2. Materials and Methods
2.1. Sources of Data and Variable Construction
2.1.1. Census Data
2.1.2. Census Tract Income and Race/Ethnicity Classification
2.1.3. Retail Food Outlet Data
2.2. Analysis
3. Results
4. Discussion
5. Conclusions
Author Contributions
Funding
Acknowledgments
Conflicts of Interest
References
- Thornton, R.L.J.; Glover, C.M.; Cené, C.W.; Glik, D.C.; Henderson, J.A.; Williams, D.R. Evaluating strategies for reducing health disparities by addressing the social determinants of health. Health Aff. 2016, 35, 1416–1423. [Google Scholar] [CrossRef] [PubMed]
- Agyeman, J.; McEntee, J. Moving the field of food justice forward through the lens of urban political ecology: Moving the field of food justice forward. Geogr. Compass 2014, 8, 211–220. [Google Scholar] [CrossRef]
- Christine, P.J.; Auchincloss, A.H.; Bertoni, A.G.; Carnethon, M.R.; Sánchez, B.N.; Moore, K.; Adar, S.D.; Horwich, T.B.; Watson, K.E.; Diez Roux, A.V. Longitudinal associations between neighborhood physical and social environments and incident type 2 diabetes mellitus: The Multi-Ethnic Study of Atherosclerosis (MESA). JAMA Intern. Med. 2015, 175, 1311. [Google Scholar] [CrossRef] [PubMed]
- Wing, J.J.; August, E.; Adar, S.D.; Dannenberg, A.L.; Hajat, A.; Sánchez, B.N.; Stein, J.H.; Tattersall, M.C.; Diez Roux, A.V. Change in neighborhood characteristics and change in coronary artery calcium: A longitudinal investigation in the MESA (Multi-Ethnic Study of Atherosclerosis) cohort. Circulation 2016, 134, 504–513. [Google Scholar] [CrossRef] [PubMed]
- Feng, X.; Astell-Burt, T.; Badland, H.; Mavoa, S.; Giles-Corti, B. Modest ratios of fast food outlets to supermarkets and green grocers are associated with higher body mass index: Longitudinal analysis of a sample of 15,229 Australians aged 45 years and older in the Australian National Liveability Study. Health Place 2018, 49, 101–110. [Google Scholar] [CrossRef] [PubMed]
- Centers for Disease Control and Prevention Retail Food Stores: Grocery Stores/Supermarkets and Small Food Stores. 2010. Available online: cdc.gov/healthyplaces/healthtopics/healthyfood/retail.htm (accessed on 22 May 2019).
- Transportation Research Board; Institute of Medicine; National Research Council. Local Government Actions to Prevent Childhood Obesity; The National Academies Press: Washington, DC, USA, 2009. [Google Scholar] [CrossRef]
- Bower, K.M.; Thorpe, R.J.; Rohde, C.; Gaskin, D.J. The intersection of neighborhood racial segregation, poverty, and urbanicity and its impact on food store availability in the United States. Prev. Med. 2014, 58, 33–39. [Google Scholar] [CrossRef] [PubMed]
- Larson, N.I.; Story, M.T.; Nelson, M.C. Neighborhood environments: Disparities in access to healthy foods in the US. Am. J. Prev. Med. 2009, 36, 74–81. [Google Scholar] [CrossRef]
- Powell, L.M.; Slater, S.; Mirtcheva, D.; Bao, Y.; Chaloupka, F.J. Food store availability and neighborhood characteristics in the United States. Prev. Med. 2007, 44, 189–195. [Google Scholar] [CrossRef]
- Zenk, S.N.; Schulz, A.J.; Israel, B.A.; James, S.A.; Bao, S.; Wilson, M.L. Neighborhood racial composition, neighborhood poverty, and the spatial accessibility of supermarkets in metropolitan Detroit. Am. J. Public Health 2005, 95, 660–667. [Google Scholar] [CrossRef]
- Cavanaugh, E.; Mallya, G.; Brensinger, C.; Tierney, A.; Glanz, K. Nutrition environments in corner stores in Philadelphia. Prev. Med. 2013, 56, 149–151. [Google Scholar] [CrossRef]
- Zenk, S.N.; Schulz, A.J.; Israel, B.A.; James, S.A.; Bao, S.; Wilson, M.L. Fruit and vegetable access differs by community racial composition and socioeconomic position in Detroit, Michigan. Ethn. Dis. 2006, 16, 275–280. [Google Scholar] [PubMed]
- Cannuscio, C.C.; Tappe, K.; Hillier, A.; Buttenheim, A.; Karpyn, A.; Glanz, K. Urban food environments and residents’ shopping behaviors. Am. J. Prev. Med. 2013, 45, 606–614. [Google Scholar] [CrossRef] [PubMed]
- Heynen, N.; Kurtz, H.E.; Trauger, A. Food Justice, Hunger and the City. Geogr. Compass 2012, 6, 304–311. [Google Scholar] [CrossRef]
- Rummo, P.E.; Guilkey, D.K.; Ng, S.W.; Popkin, B.M.; Evenson, K.R.; Gordon-Larsen, P. Beyond supermarkets: Food outlet location selection in four U.S. cities over time. Am. J. Prev. Med. 2017, 52, 300–310. [Google Scholar] [CrossRef] [PubMed]
- Richardson, A.S.; Meyer, K.A.; Howard, A.G.; Boone-Heinonen, J.; Popkin, B.M.; Evenson, K.R.; Kiefe, C.I.; Lewis, C.E.; Gordon-Larsen, P. Neighborhood socioeconomic status and food environment: A 20-year longitudinal latent class analysis among CARDIA participants. Health Place 2014, 30, 145–153. [Google Scholar] [CrossRef] [PubMed]
- James, P.; Seward, M.W.; James O’Malley, A.; Subramanian, S.; Block, J.P. Changes in the food environment over time: Examining 40 years of data in the Framingham Heart Study. Int. J. Behav. Nutr. Phys. Act. 2017, 14. [Google Scholar] [CrossRef] [PubMed]
- Ohri-Vachaspati, P.; Martinez, D.; Yedidia, M.J.; Petlick, N. Improving data accuracy of commercial food outlet databases. Am. J. Health Promot. 2011, 26, 116–122. [Google Scholar] [CrossRef]
- US Census Bureau American Community Survey (ACS). Available online: census.gov/programs-surveys/acs/data/summary-file.html (accessed on 22 May 2019).
- US Census Bureau American Community Survey (ACS) 2010 Geography Changes. Available online: census.gov/programs-surveys/acs/technical-documentation/table-and-geography-changes/2010/geography-changes.html (accessed on 22 May 2019).
- Logan, J.R.; Xu, Z.; Stults, B.J. Interpolating U.S. decennial census tract data from as early as 1970 to 2010: A longitudinal tract database. Prof. Geogr. 2014, 66, 412–420. [Google Scholar] [CrossRef]
- Guzman, G.G. Household Income: 2017 (No.ACSBR/17-01); American Community Survey Briefs; US Census Bureau. Available online: census.gov/content/dam/Census/library/publications/2018/acs/acsbr 17-01.pdf (accessed on 22 May 2019).
- Food Marketing Institute Food Industry Glossary. Available online: fmi.org/our-research/food-industry-glossary (accessed on 26 June 2019).
- California Center for Public Health Advocacy, PolicyLink, and the UCLA Center for Health Policy Research. Designed for disease: The link between local food environments and obesity and diabetes 2008. Available online: escholarship.org/uc/item/9zc7p54b (accessed on 26 June 2019).
- Meltzer, R.; Capperis, S. Neighbourhood differences in retail turnover: Evidence from New York City. Urban Stud. 2017, 54, 3022–3057. [Google Scholar] [CrossRef]
- Warren, J.L. Factors associated with supermarket and convenience store closure: A discrete time spatial survival modelling approach. J. R. Stat. Soc. 2017, 181, 783–802. [Google Scholar] [CrossRef]
- Filomena, S.; Scanlin, K.; Morland, K. Brooklyn, New York foodscape 2007–2011: A five-year analysis of stability in food retail environments. Int. J. Behav. Nutr. Phys. Act. 2013, 10. [Google Scholar] [CrossRef] [PubMed]
- DeWeese, R.S.; Todd, M.; Karpyn, A.; Yedidia, M.J.; Kennedy, M.; Bruening, M.; Wharton, C.M.; Ohri-Vachaspati, P. Healthy store programs and the Special Supplemental Nutrition Program for Women, Infants, and Children (WIC), but not the Supplemental Nutrition Assistance Program (SNAP), are associated with corner store healthfulness. Prev. Med. Rep. 2016, 4, 256–261. [Google Scholar] [CrossRef] [PubMed]
- New Jersey YMCA State Alliance, Healthy Corner Stores. Available online: njymca.org/ healthycornerstores/ (accessed on 26 June 2019).
- Whitehouse, A.; Simon, A.; French, S.A.; Wolfson, J. Availability of snacks, candy and beverages in hospital, community clinic and commercial pharmacies. Public Health Nutr. 2012, 15, 1117–1123. [Google Scholar] [CrossRef] [PubMed]
- Farley, T.A.; Baker, E.T.; Futrell, L.; Rice, J.C. The ubiquity of energy-dense snack foods: A national multicity study. Am. J. Public Health 2010, 100, 306–311. [Google Scholar] [CrossRef] [PubMed]
- Caspi, C.E.; Pelletier, J.E.; Harnack, L.; Erickson, D.J.; Laska, M.N. Differences in healthy food supply and stocking practices between small grocery stores, gas-marts, pharmacies and dollar stores. Public Health Nutr. 2016, 19, 540–547. [Google Scholar] [CrossRef] [PubMed]
- Reinvestment Fund, Assessing Place-Based Access to Healthy Food: The Limited Supermarket Access. 2018. Available online: reinvestment.com/wp-content/uploads/2018/08/LSA_2018_Report_web.pdf (accessed on 22 May 2019).
- PolicyLink; The Food Trust; The Reinvestment Fund. The Healthy Food Financing Initiative (HFFI): An Innovative Public-Private Partnership Sparking Economic Development and Improving Health. 2014. Available online: frbsf.org/community-development/files/healthy_food_financing_initiative.pdf (accessed on 22 May 2019).
- Kress, M. Hispanics Emerge as Core C-store Shopper. Convenience Store News 2012. Available online: csnews.com/hispanics-emerge-core-c-store-shopper (accessed on 22 May 2019).
- McLynn, K. US Hispanics More Likely to Purchase Groceries at C-Stores Than Non-Hispanics, Reports NPD; The NPD Group, Inc.: Houston, TX, USA, 2013; Available online: npd.com/wps/portal/npd/us/news/press-releases/us-hispanics-more-likely-to-purchase-roceries-at-c-stores-than-non-hispanics-reports-npd/ (accessed on 22 May 2019).
- Lloyd, K.; Ohri-Vachaspati, P.; Brownlee, S.; Yedidia, M.; Gaboda, D.; Chou, J. New Jersey Childhood Obesity Survey Chartbook Trenton; Rutgers Center for State Health Policy: New Brunswick, NJ, USA, 2010; Available online: cshp.rutgers.edu/Downloads/8670.pdf (accessed on 26 June 2019).
- Lloyd, K.; Ohri-Vachaspati, P.; Brownlee, S.; Yedidia, M.; Gaboda, D.; Chou, J. New Jersey Childhood Obesity Survey Chartbook New Brunswick; Rutgers Center for State Health Policy: New Brunswick, NJ, USA, 2010; Available online: cshp.rutgers.edu/Downloads/8660.pdf (accessed on 26 June 2019).
- Brownlee, S.; Ohri-Vachaspati, P.; Lloyd, K.; Yedidia, M.; Gaboda, D.; Chou, J. New Jersey Childhood Obesity Survey Chartbook Newark; Rutgers Center for State Health Policy: New Brunswick, NJ, USA, 2010; Available online: cshp.rutgers.edu/Downloads/8650.pdf (accessed on 26 June 2019).
- Grigsby-Toussaint, D.S.; Zenk, S.N.; Odoms-Young, A.; Ruggiero, L.; Moise, I. Availability of commonly consumed and culturally specific fruits and vegetables in African-American and Latino neighborhoods. J. Am. Diet. Assoc. 2010, 110, 746–752. [Google Scholar] [CrossRef]
- Zenk, S.N.; Schulz, A.J.; Israel, B.A.; Mentz, G.; Miranda, P.Y.; Opperman, A.; Odoms-Young, A.M. Food shopping behaviours and exposure to discrimination. Public Health Nutr. 2014, 17, 1167–1176. [Google Scholar] [CrossRef]
- Sonnino, R. The new geography of food security: Exploring the potential of urban food strategies. Geogr. J. 2016, 182, 190–200. [Google Scholar] [CrossRef]
- Cavanaugh, E.; Green, S.; Mallya, G.; Tierney, A.; Brensinger, C.; Glanz, K. Changes in food and beverage environments after an urban corner store intervention. Prev. Med. 2014, 65, 7–12. [Google Scholar] [CrossRef]
- Lent, M.R.; Vander Veur, S.S.; McCoy, T.A.; Wojtanowski, A.C.; Sandoval, B.; Sherman, S.; Komaroff, E.; Foster, G.D. A randomized controlled study of a healthy corner store initiative on the purchases of urban, low-income youth. Obesity 2014, 22, 2494–2500. [Google Scholar] [CrossRef]
- Paek, H.J.; Oh, H.J.; Jung, Y.; Thompson, T.; Alaimo, K.; Risley, J.; Mayfield, K. Assessment of a healthy corner store program (FIT Store) in low-income, urban, and ethnically diverse neighborhoods in Michigan. Fam. Community Health 2014, 37, 86–99. [Google Scholar] [CrossRef] [PubMed]


| Census Tract Characteristics | 2009 | 2012 | 2013 | 2014 | 2015 | 2017 | |||||
|---|---|---|---|---|---|---|---|---|---|---|---|
| Census tract median household income a ($) | Actual | IA b | Actual | IA b | Actual | IA b | Actual | IA b | Actual | IA b | Actual |
| Lower income tracts (lowest tertile) | 21,977 | 25,170 | 22,413 | 23,980 | 22,794 | 24,026 | 21,842 | 22,639 | 21,630 | 22,380 | 21,974 |
| Medium income tracts (middle tertile) | 35,468 | 40,622 | 34,237 | 36,632 | 34,116 | 35,959 | 33,951 | 35,189 | 32,154 | 33,269 | 32,568 |
| Higher income tracts (highest tertile) | 50,984 | 58,392 | 47,224 | 50,527 | 46,902 | 49,436 | 45,791 | 47,461 | 45,155 | 46,721 | 46,544 |
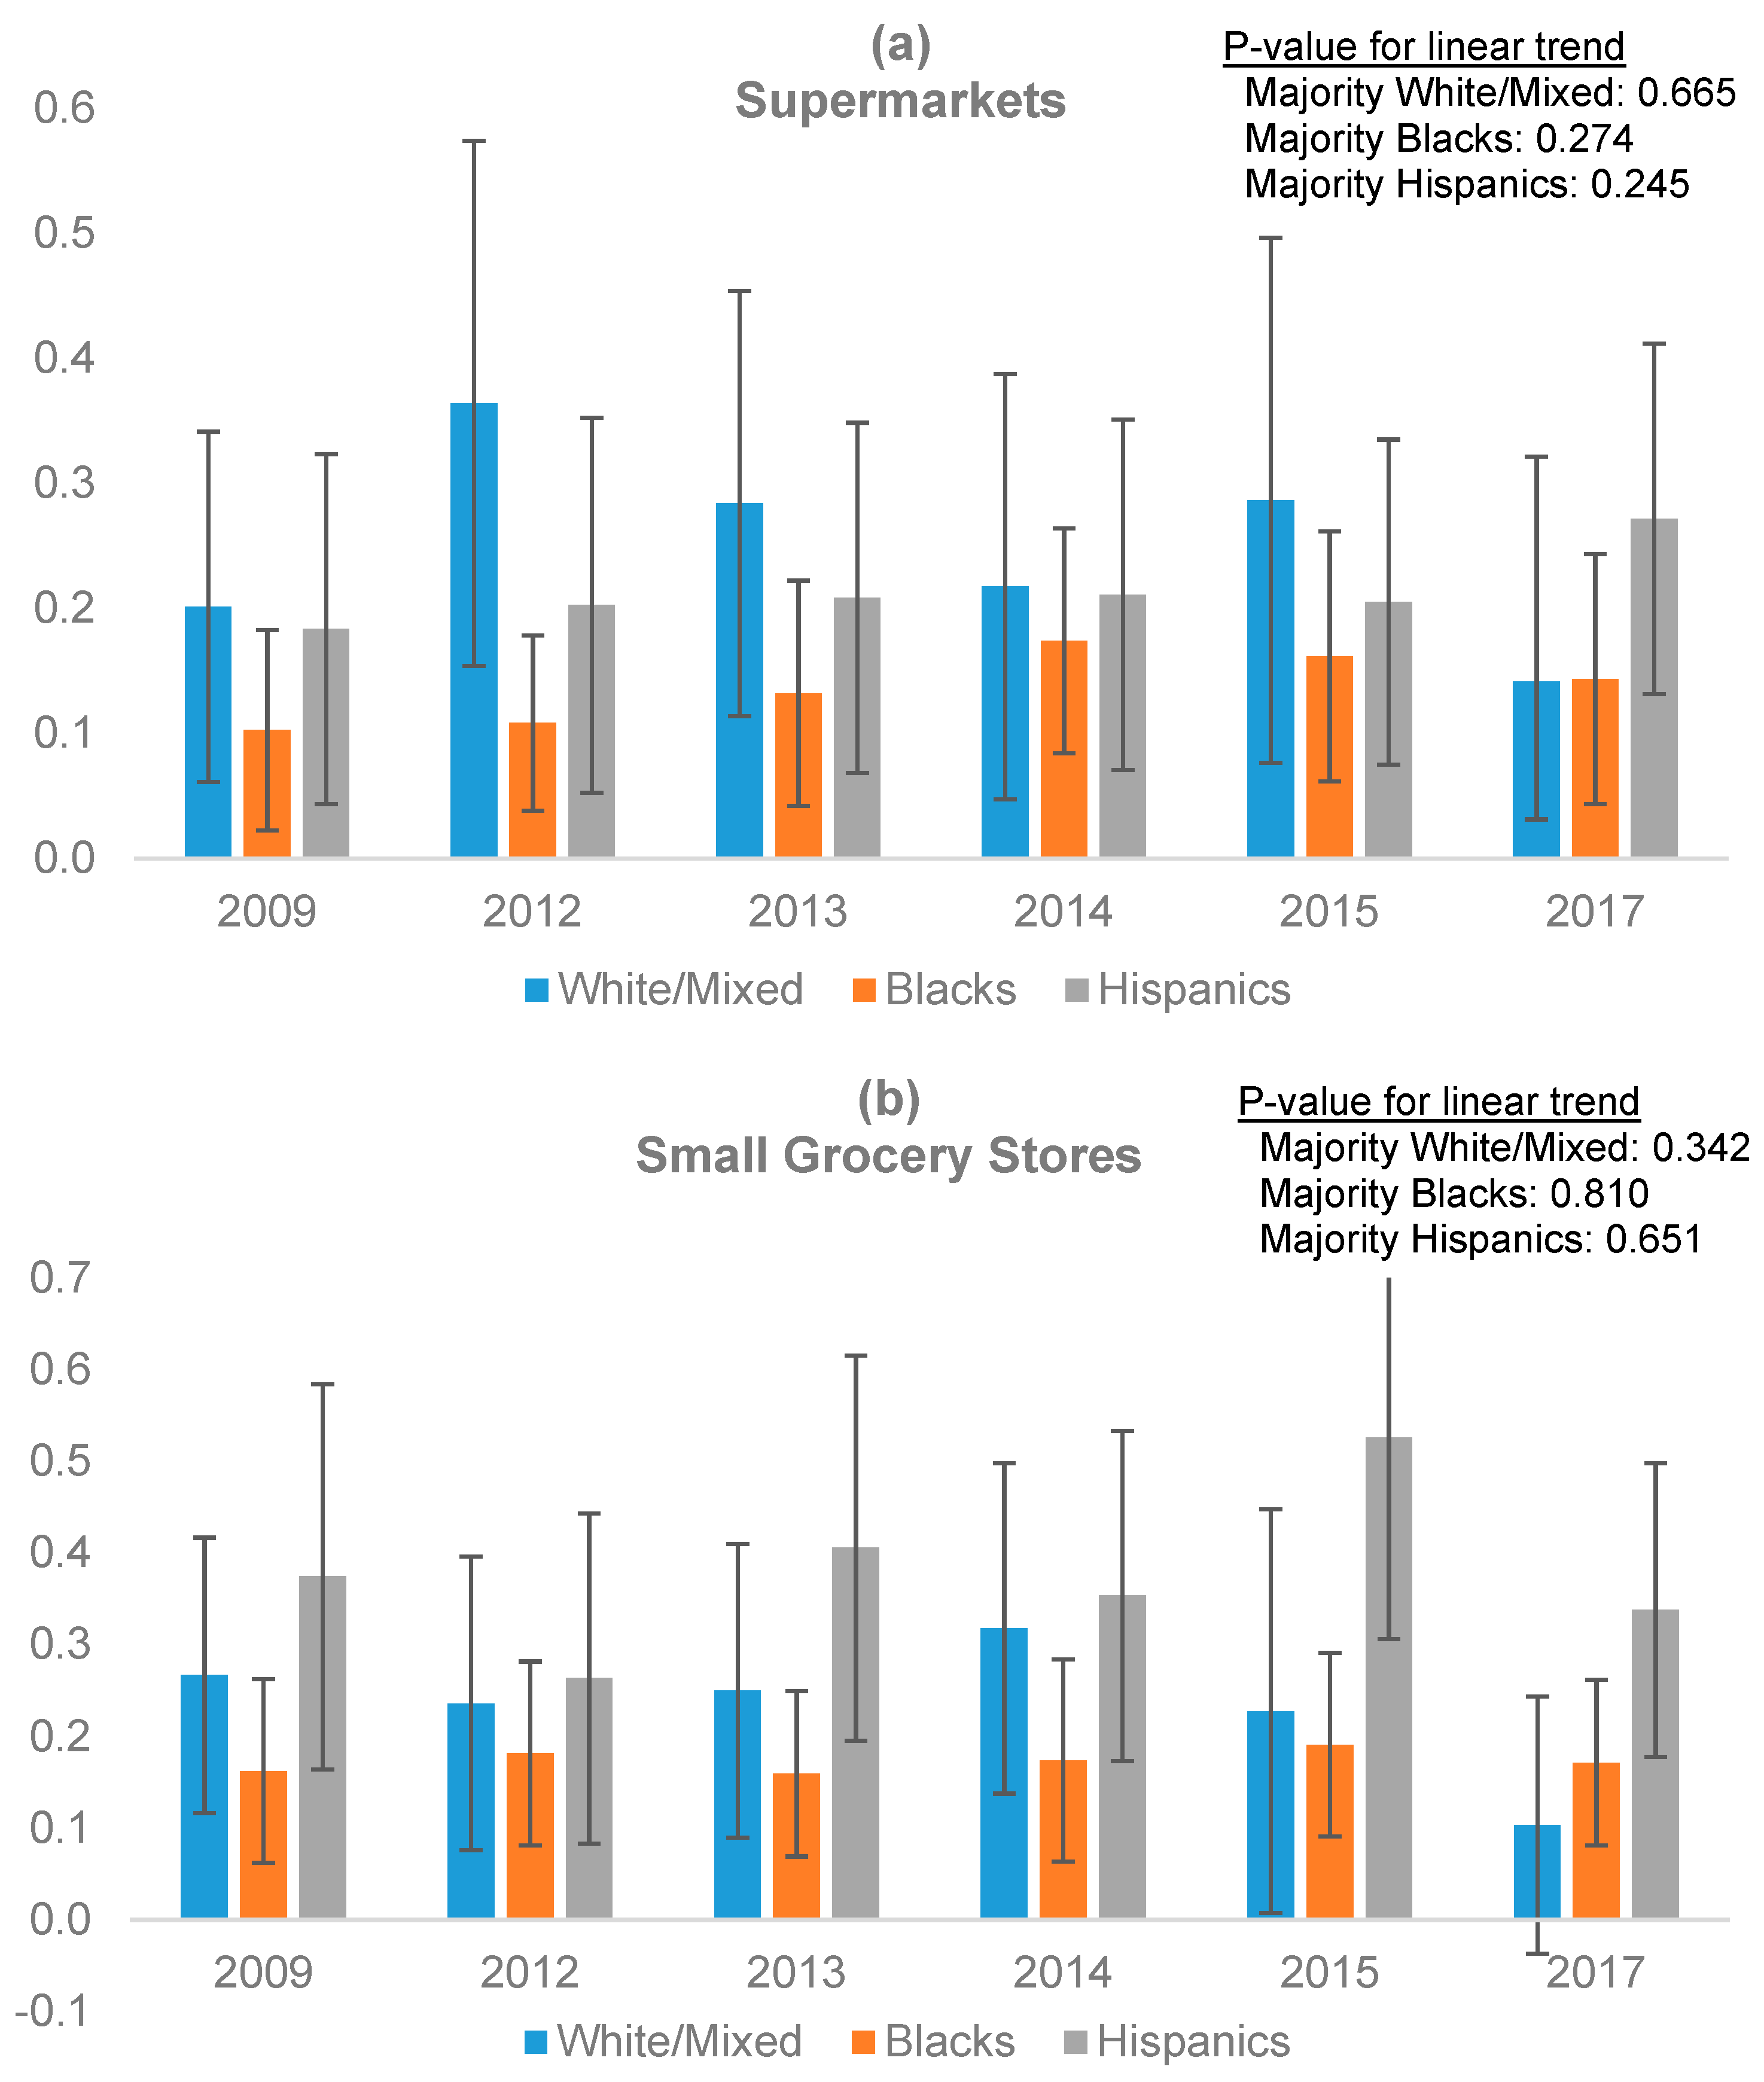
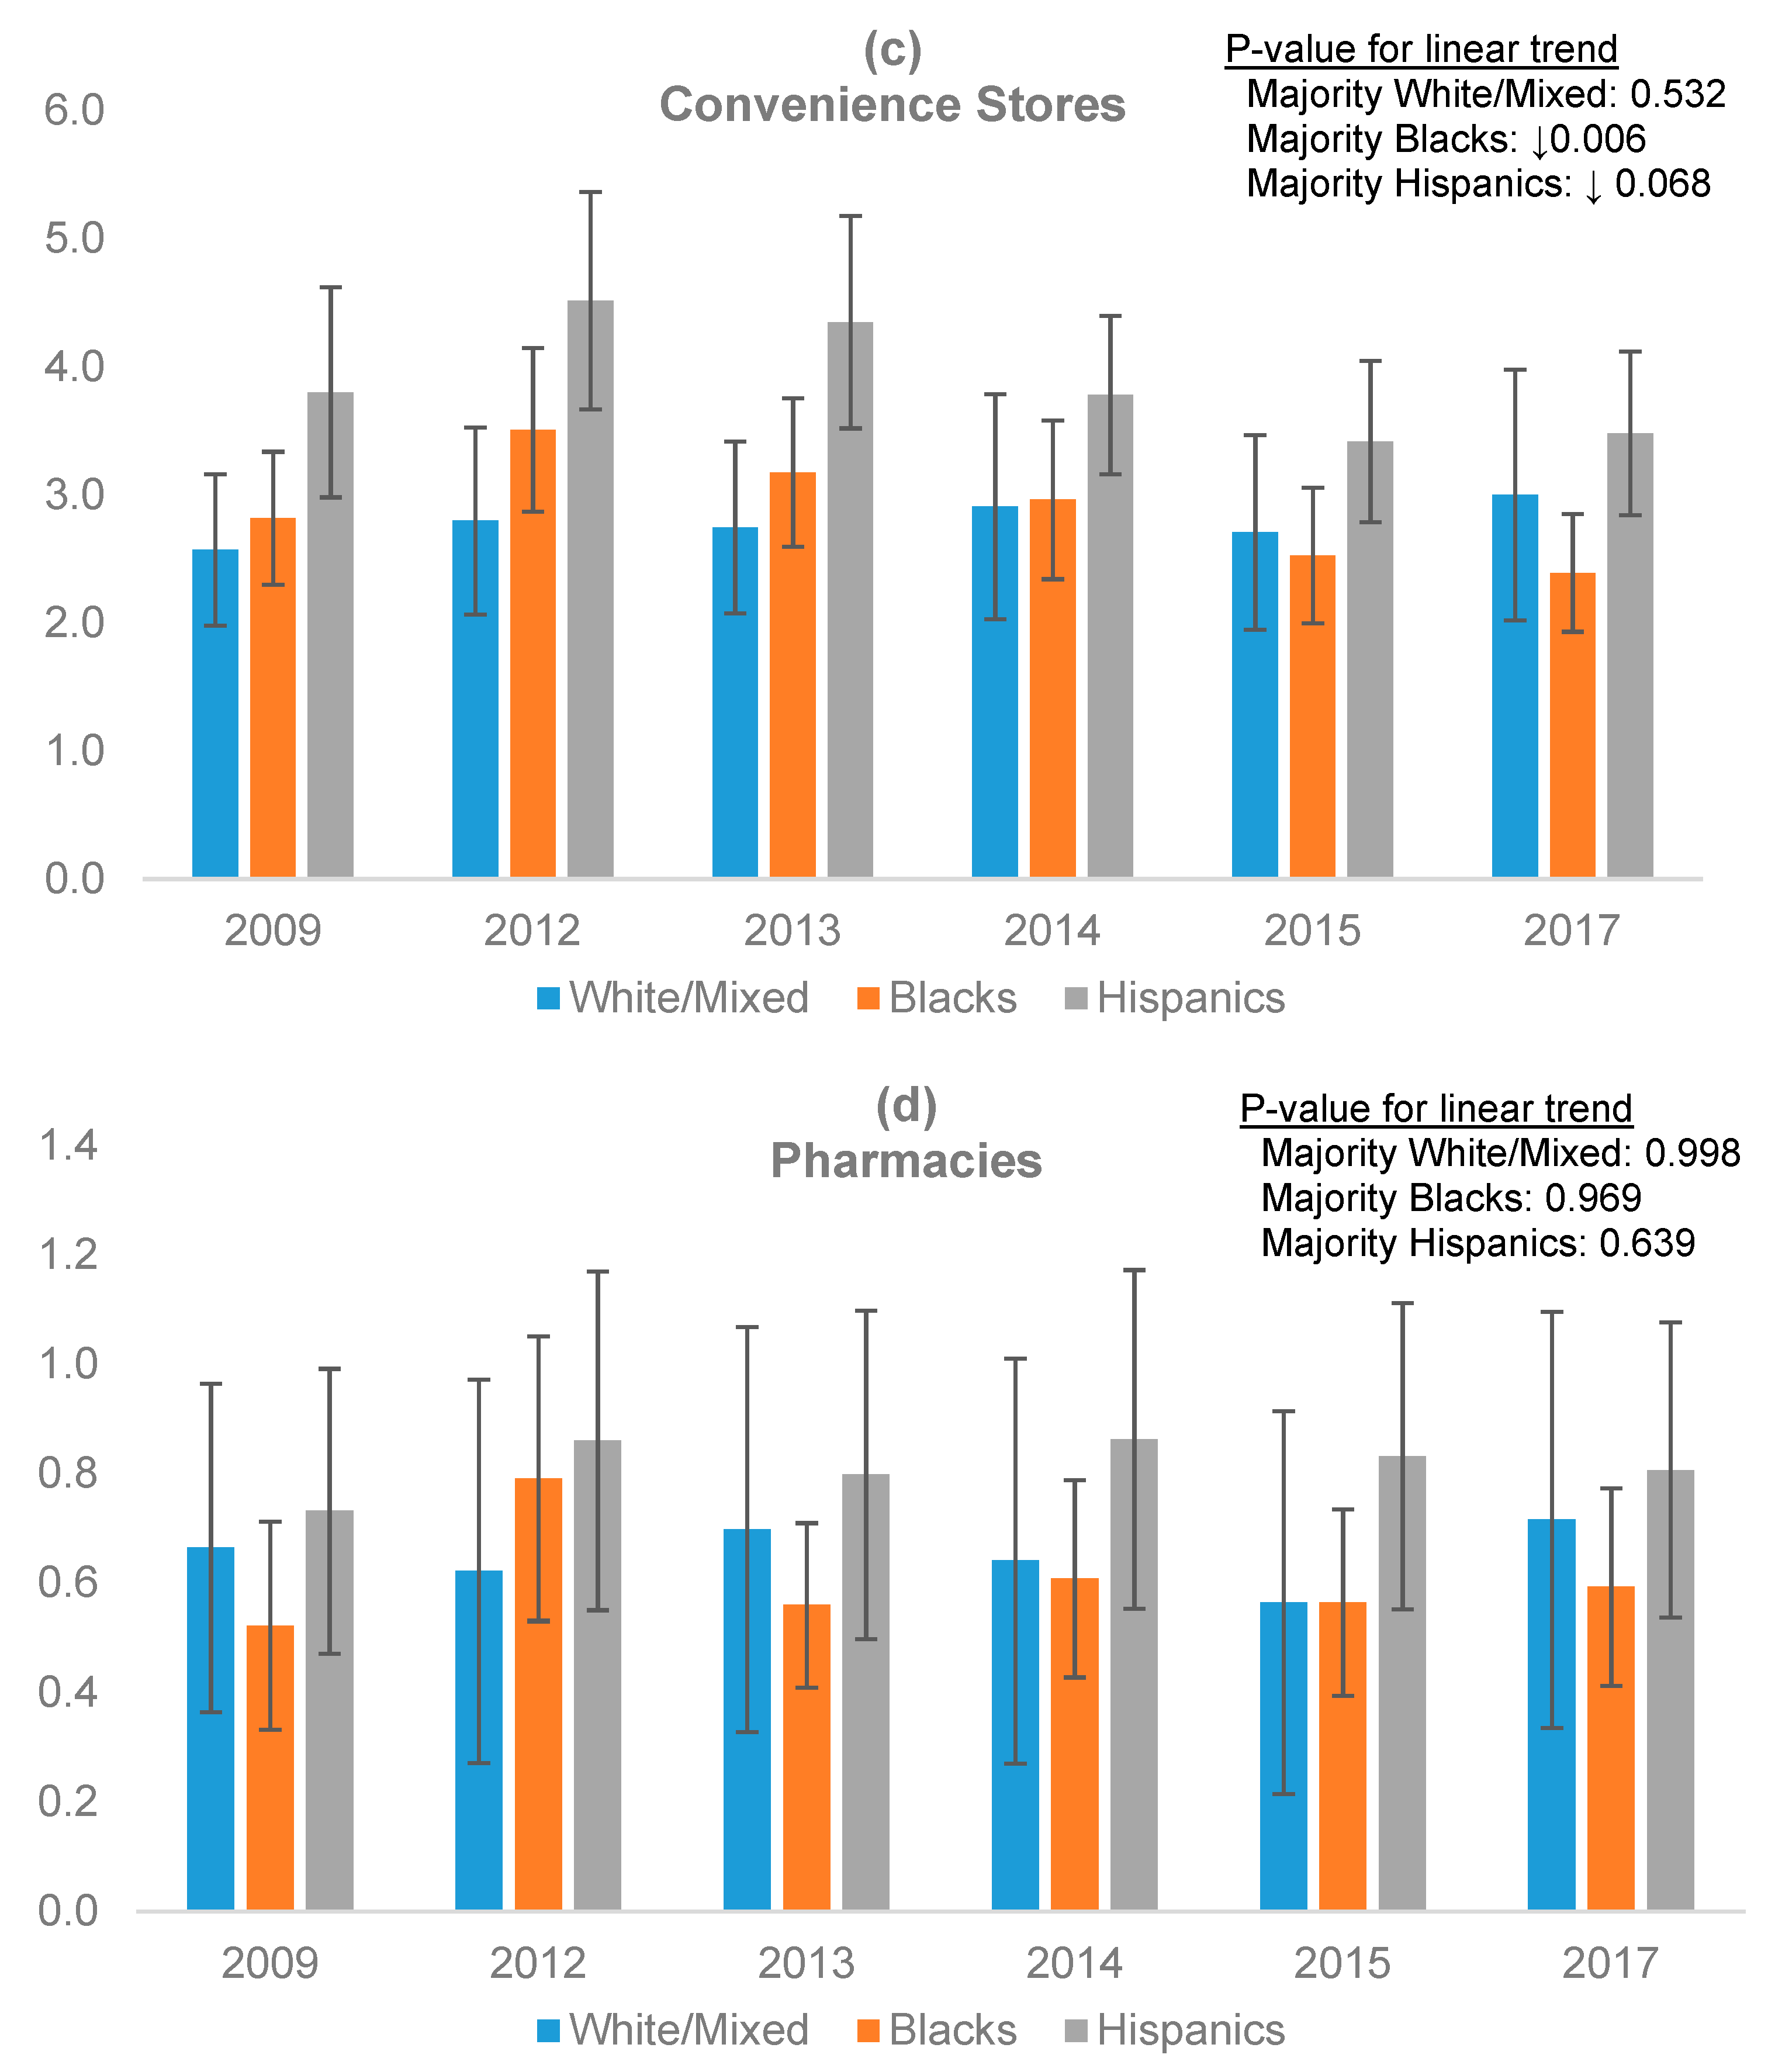
| Census tract majority race/ethnicity n (%) | |||||||||||
| Majority non-Hispanic black tracts | 72 (51) | 73 (51) | 76 (54) | 75 (53) | 74 (52) | 76 (54) | |||||
| Majority Hispanic tracts | 37 (26) | 42 (30) | 41 (29) | 44 (31) | 48 (34) | 48 (34) | |||||
| Majority non-Hispanic white tracts | 11 (8) | 7 (5) | 5 (4) | 4 (3) | 3 (2) | 3 (2) | |||||
| Majority mixed tracts | 22 (15) | 20 (14) | 20 (14) | 19 (13) | 17 (12) | 15 (11) | |||||
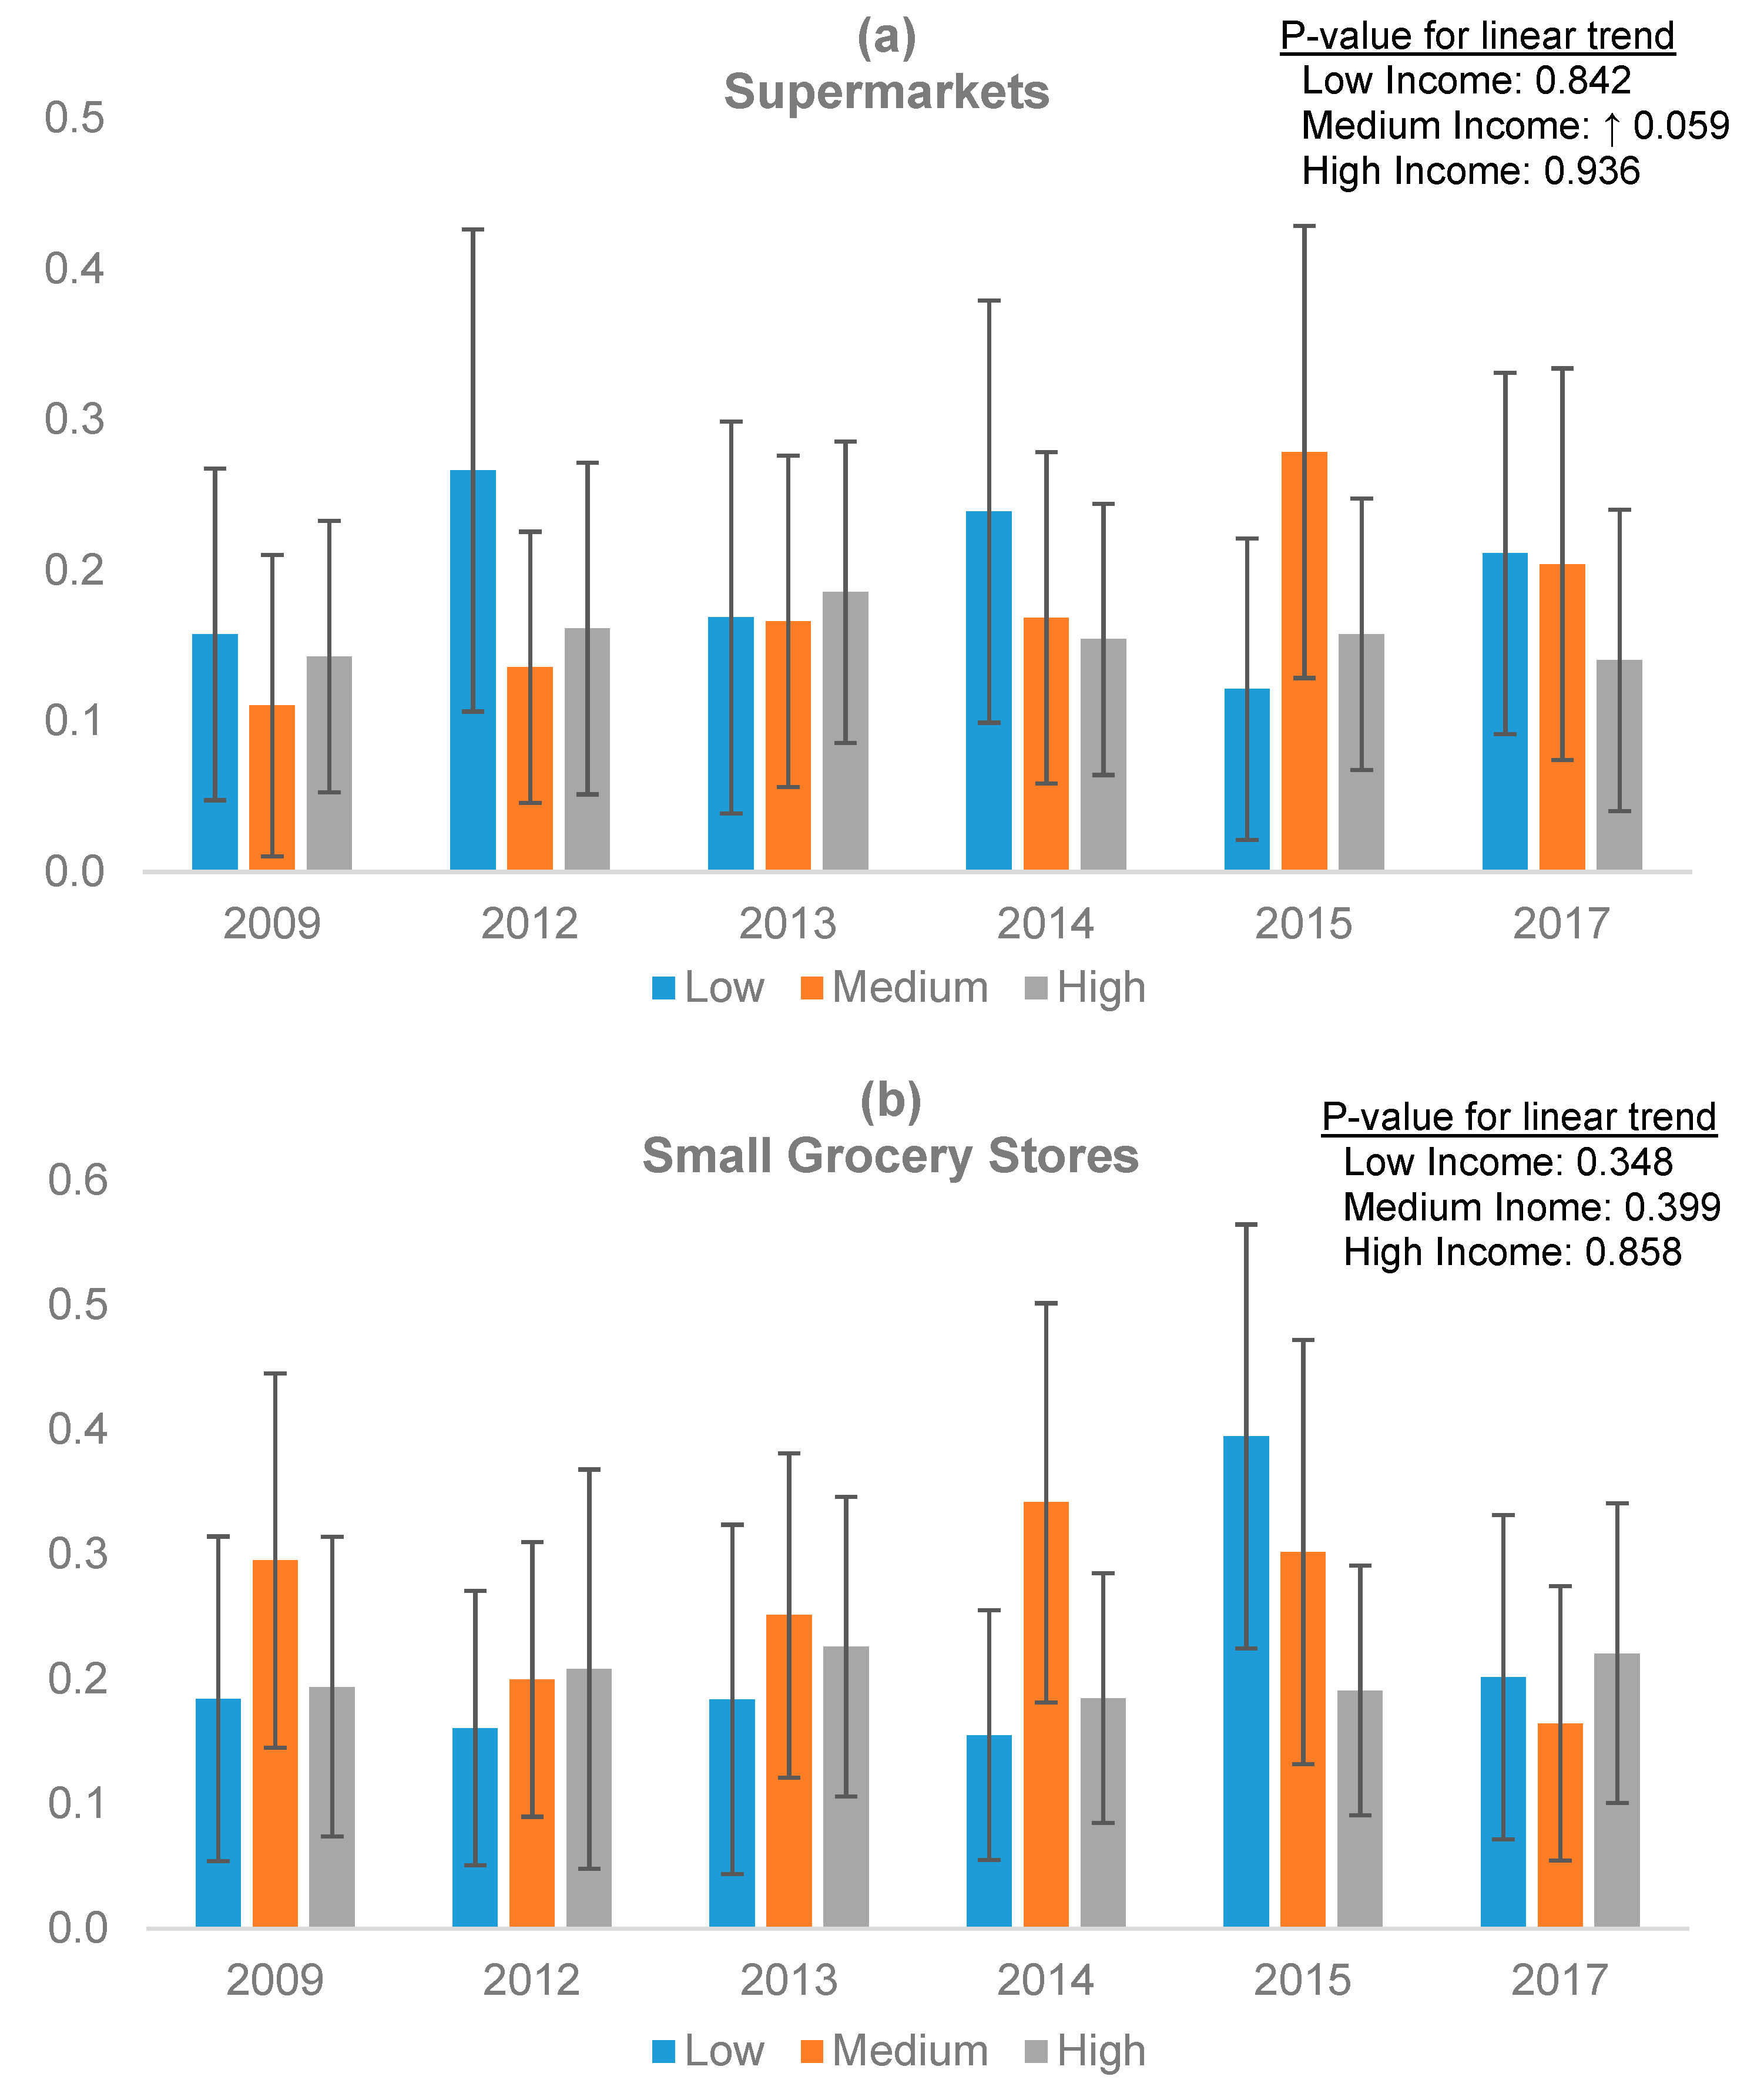
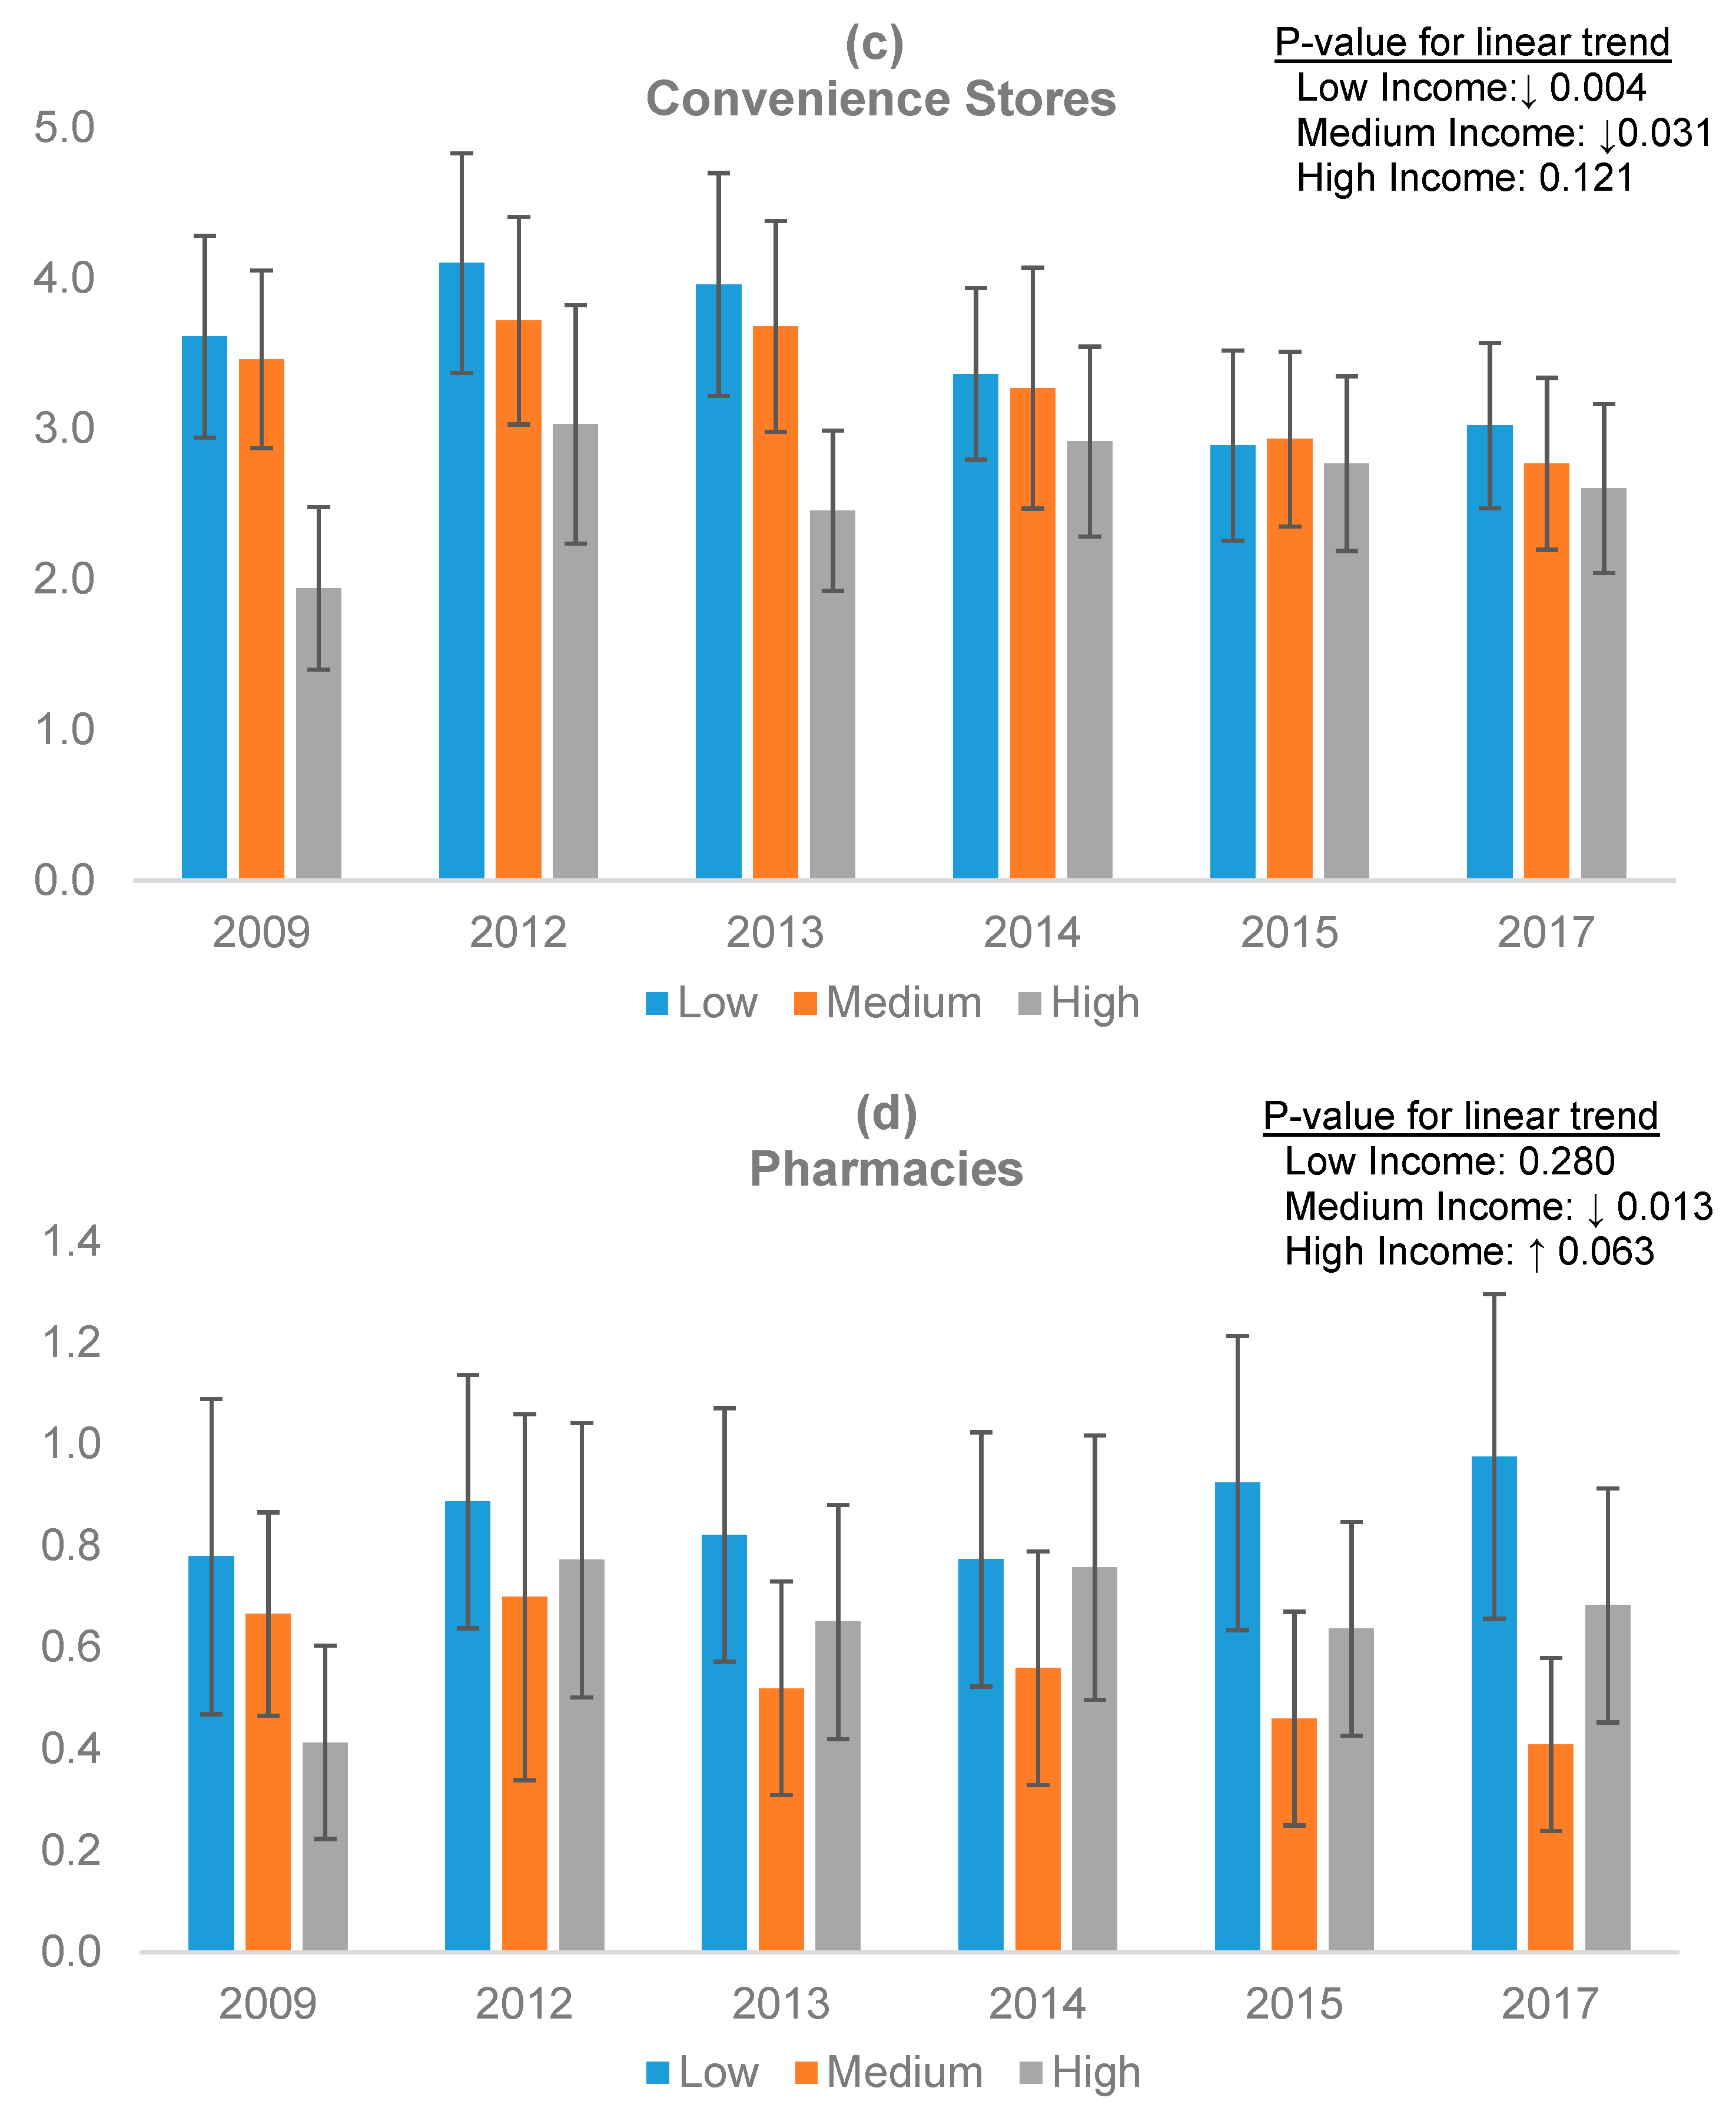
| Store Type | 2009 | 2012 | 2013 | 2014 | 2015 | 2017 | p for Trend |
|---|---|---|---|---|---|---|---|
| Supermarkets | 0.14 (0.03) | 0.18 (0.04) | 0.18 (0.03) | 0.18 (0.03) | 0.19 (0.04) | 0.18 (0.04) | 0.213 |
| Small grocery stores | 0.23 (0.04) | 0.19 (0.04) | 0.22 (0.04) | 0.23 (0.04) | 0.28 (0.04) | 0.19 (0.04) | 0.942 |
| Convenience Stores | 3.03 (0.19) | 3.58 (0.21) | 3.34 (0.20) | 3.12 (0.20) | 2.77 (0.17) | 2.74 (0.17) | 0.008 |
| Pharmacies | 0.61 (0.07) | 0.77 (0.09) | 0.65 (0.07) | 0.68 (0.07) | 0.64 (0.07) | 0.67 (0.07) | 0.809 |
© 2019 by the authors. Licensee MDPI, Basel, Switzerland. This article is an open access article distributed under the terms and conditions of the Creative Commons Attribution (CC BY) license (http://creativecommons.org/licenses/by/4.0/).
Share and Cite
Ohri-Vachaspati, P.; DeWeese, R.S.; Acciai, F.; DeLia, D.; Tulloch, D.; Tong, D.; Lorts, C.; Yedidia, M.J. Healthy Food Access in Low-Income High-Minority Communities: A Longitudinal Assessment—2009–2017. Int. J. Environ. Res. Public Health 2019, 16, 2354. https://doi.org/10.3390/ijerph16132354
Ohri-Vachaspati P, DeWeese RS, Acciai F, DeLia D, Tulloch D, Tong D, Lorts C, Yedidia MJ. Healthy Food Access in Low-Income High-Minority Communities: A Longitudinal Assessment—2009–2017. International Journal of Environmental Research and Public Health. 2019; 16(13):2354. https://doi.org/10.3390/ijerph16132354
Chicago/Turabian StyleOhri-Vachaspati, Punam, Robin S. DeWeese, Francesco Acciai, Derek DeLia, David Tulloch, Daoqin Tong, Cori Lorts, and Michael J. Yedidia. 2019. "Healthy Food Access in Low-Income High-Minority Communities: A Longitudinal Assessment—2009–2017" International Journal of Environmental Research and Public Health 16, no. 13: 2354. https://doi.org/10.3390/ijerph16132354
APA StyleOhri-Vachaspati, P., DeWeese, R. S., Acciai, F., DeLia, D., Tulloch, D., Tong, D., Lorts, C., & Yedidia, M. J. (2019). Healthy Food Access in Low-Income High-Minority Communities: A Longitudinal Assessment—2009–2017. International Journal of Environmental Research and Public Health, 16(13), 2354. https://doi.org/10.3390/ijerph16132354