Usefulness of the Coronary Artery Calcium Score in Predicting Subsequent Coronary Interventions—A Ten-Year Single-Center Perspective


Abstract
:1. Introduction
2. Methods
- 103 (57.5%) women aged 50 to 65 years
- 71 (42.5%) men aged 40 to 65 years
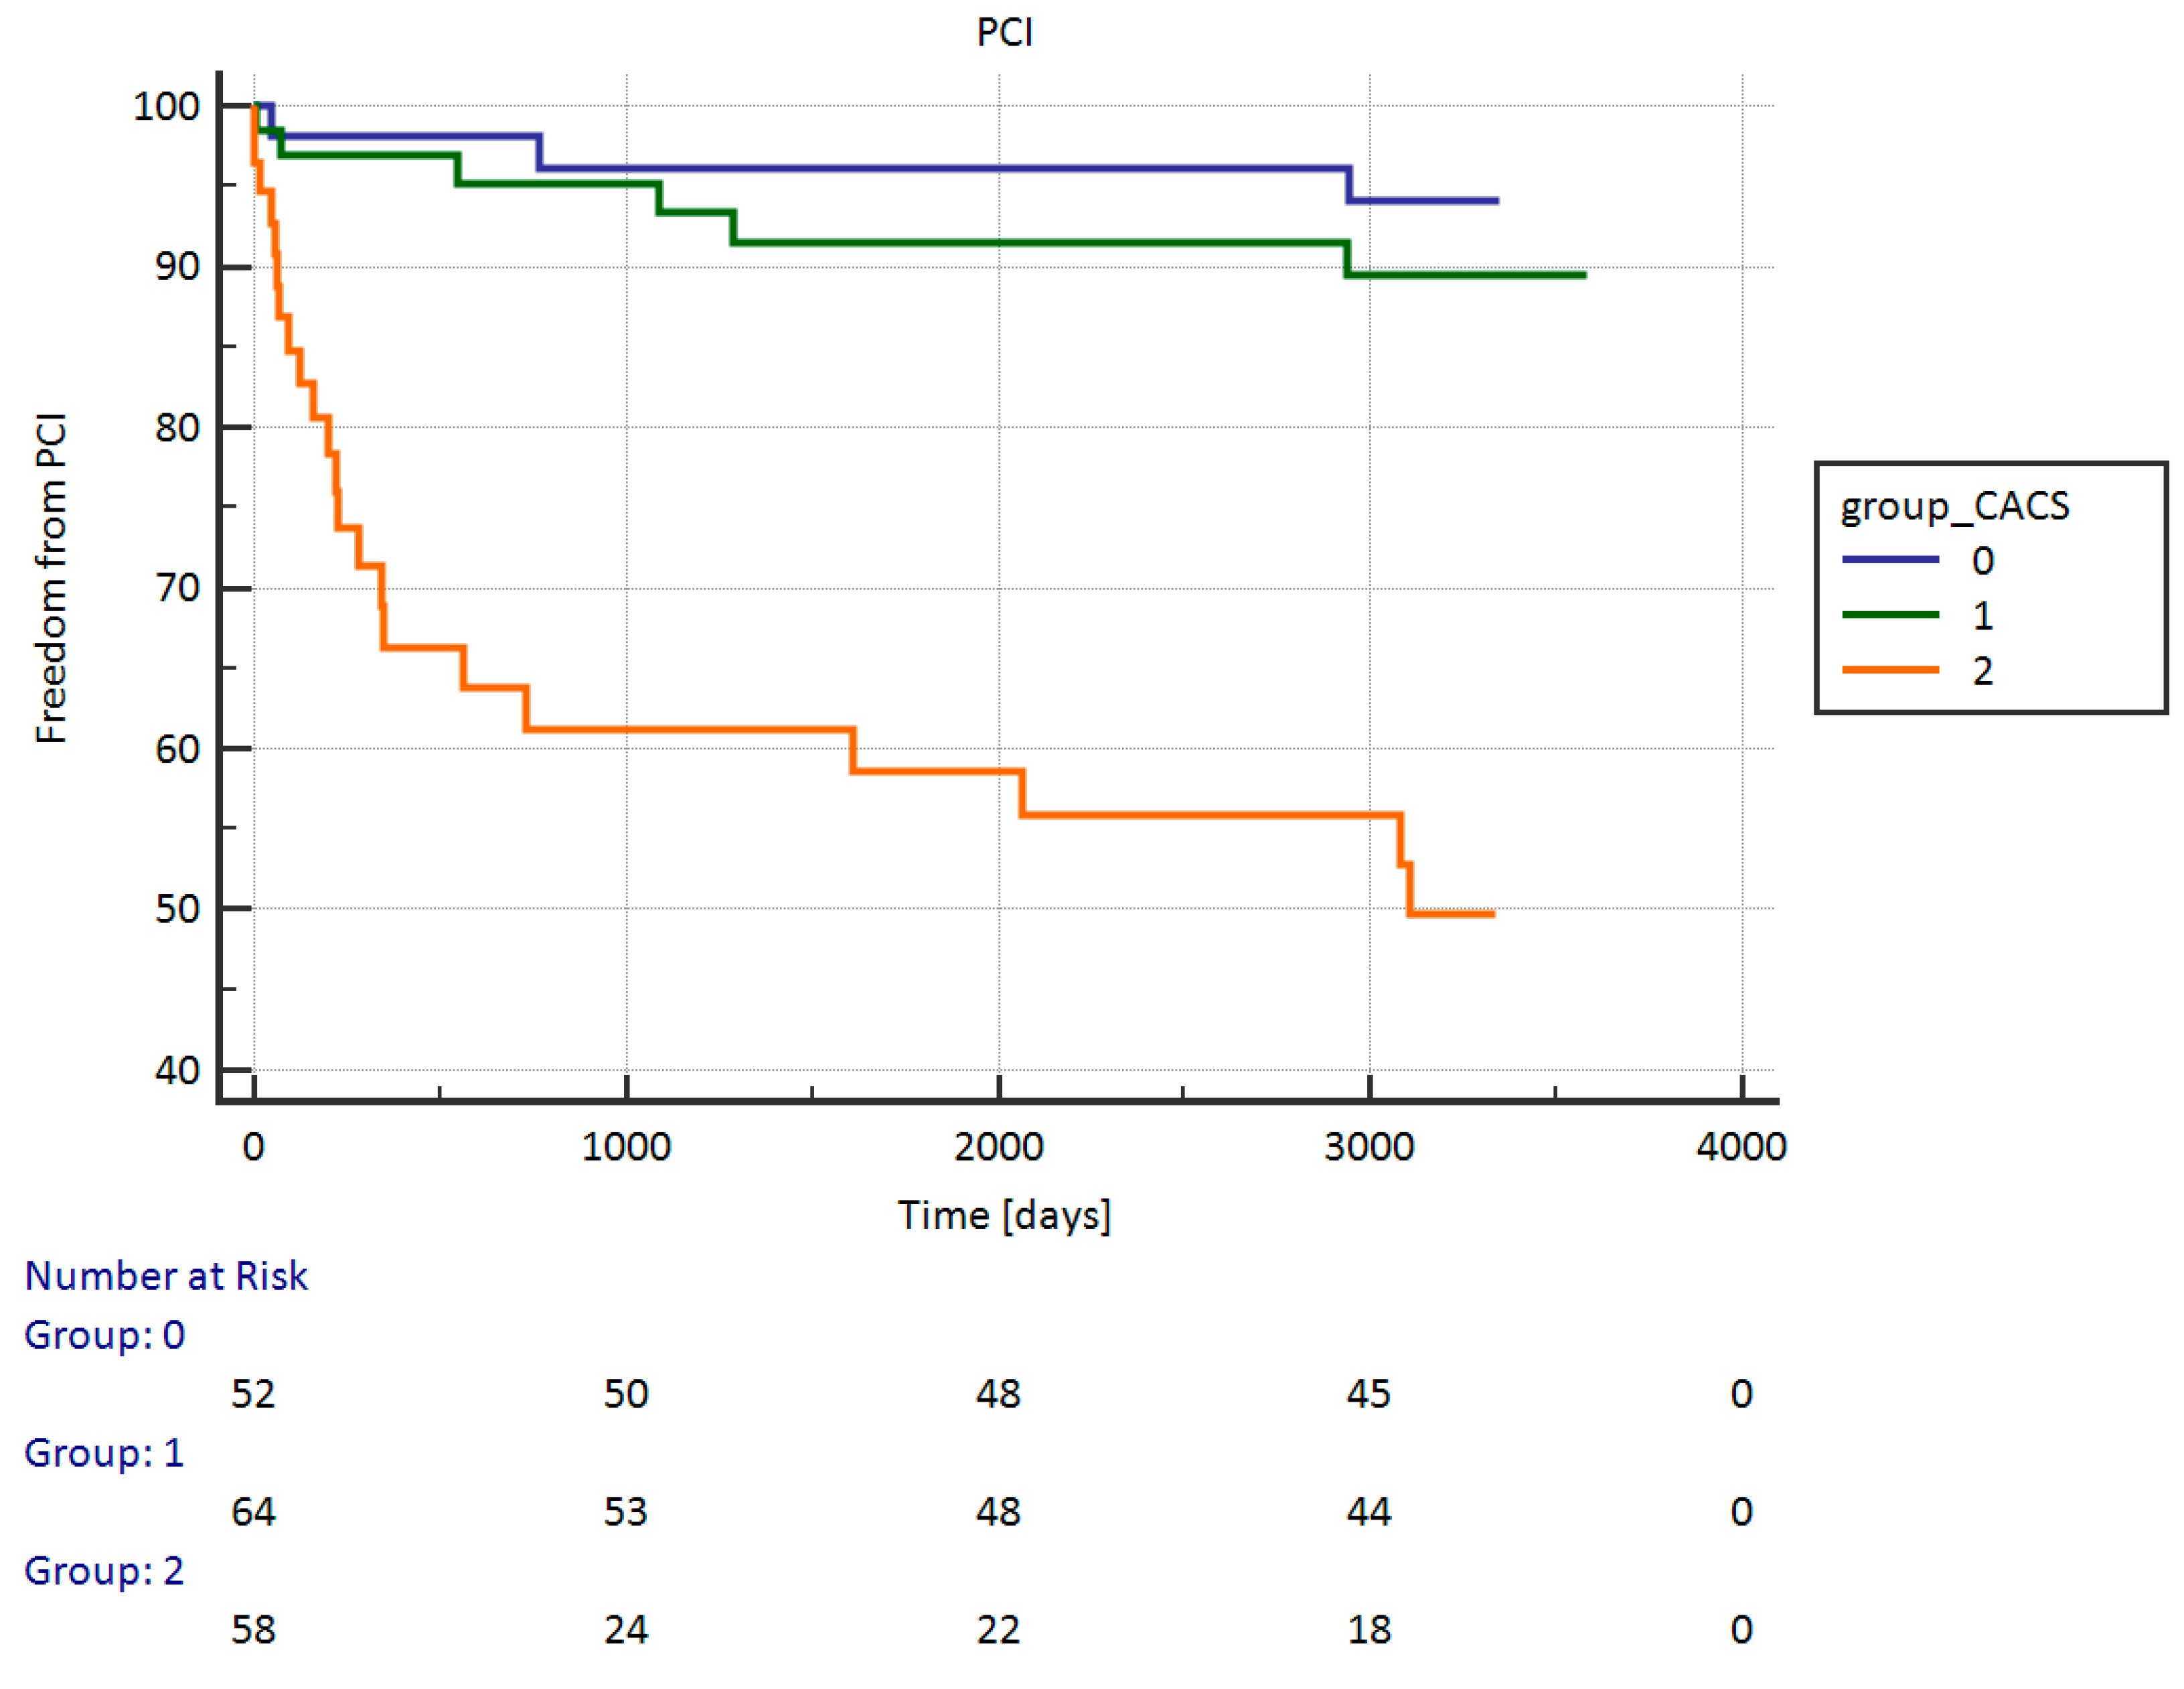
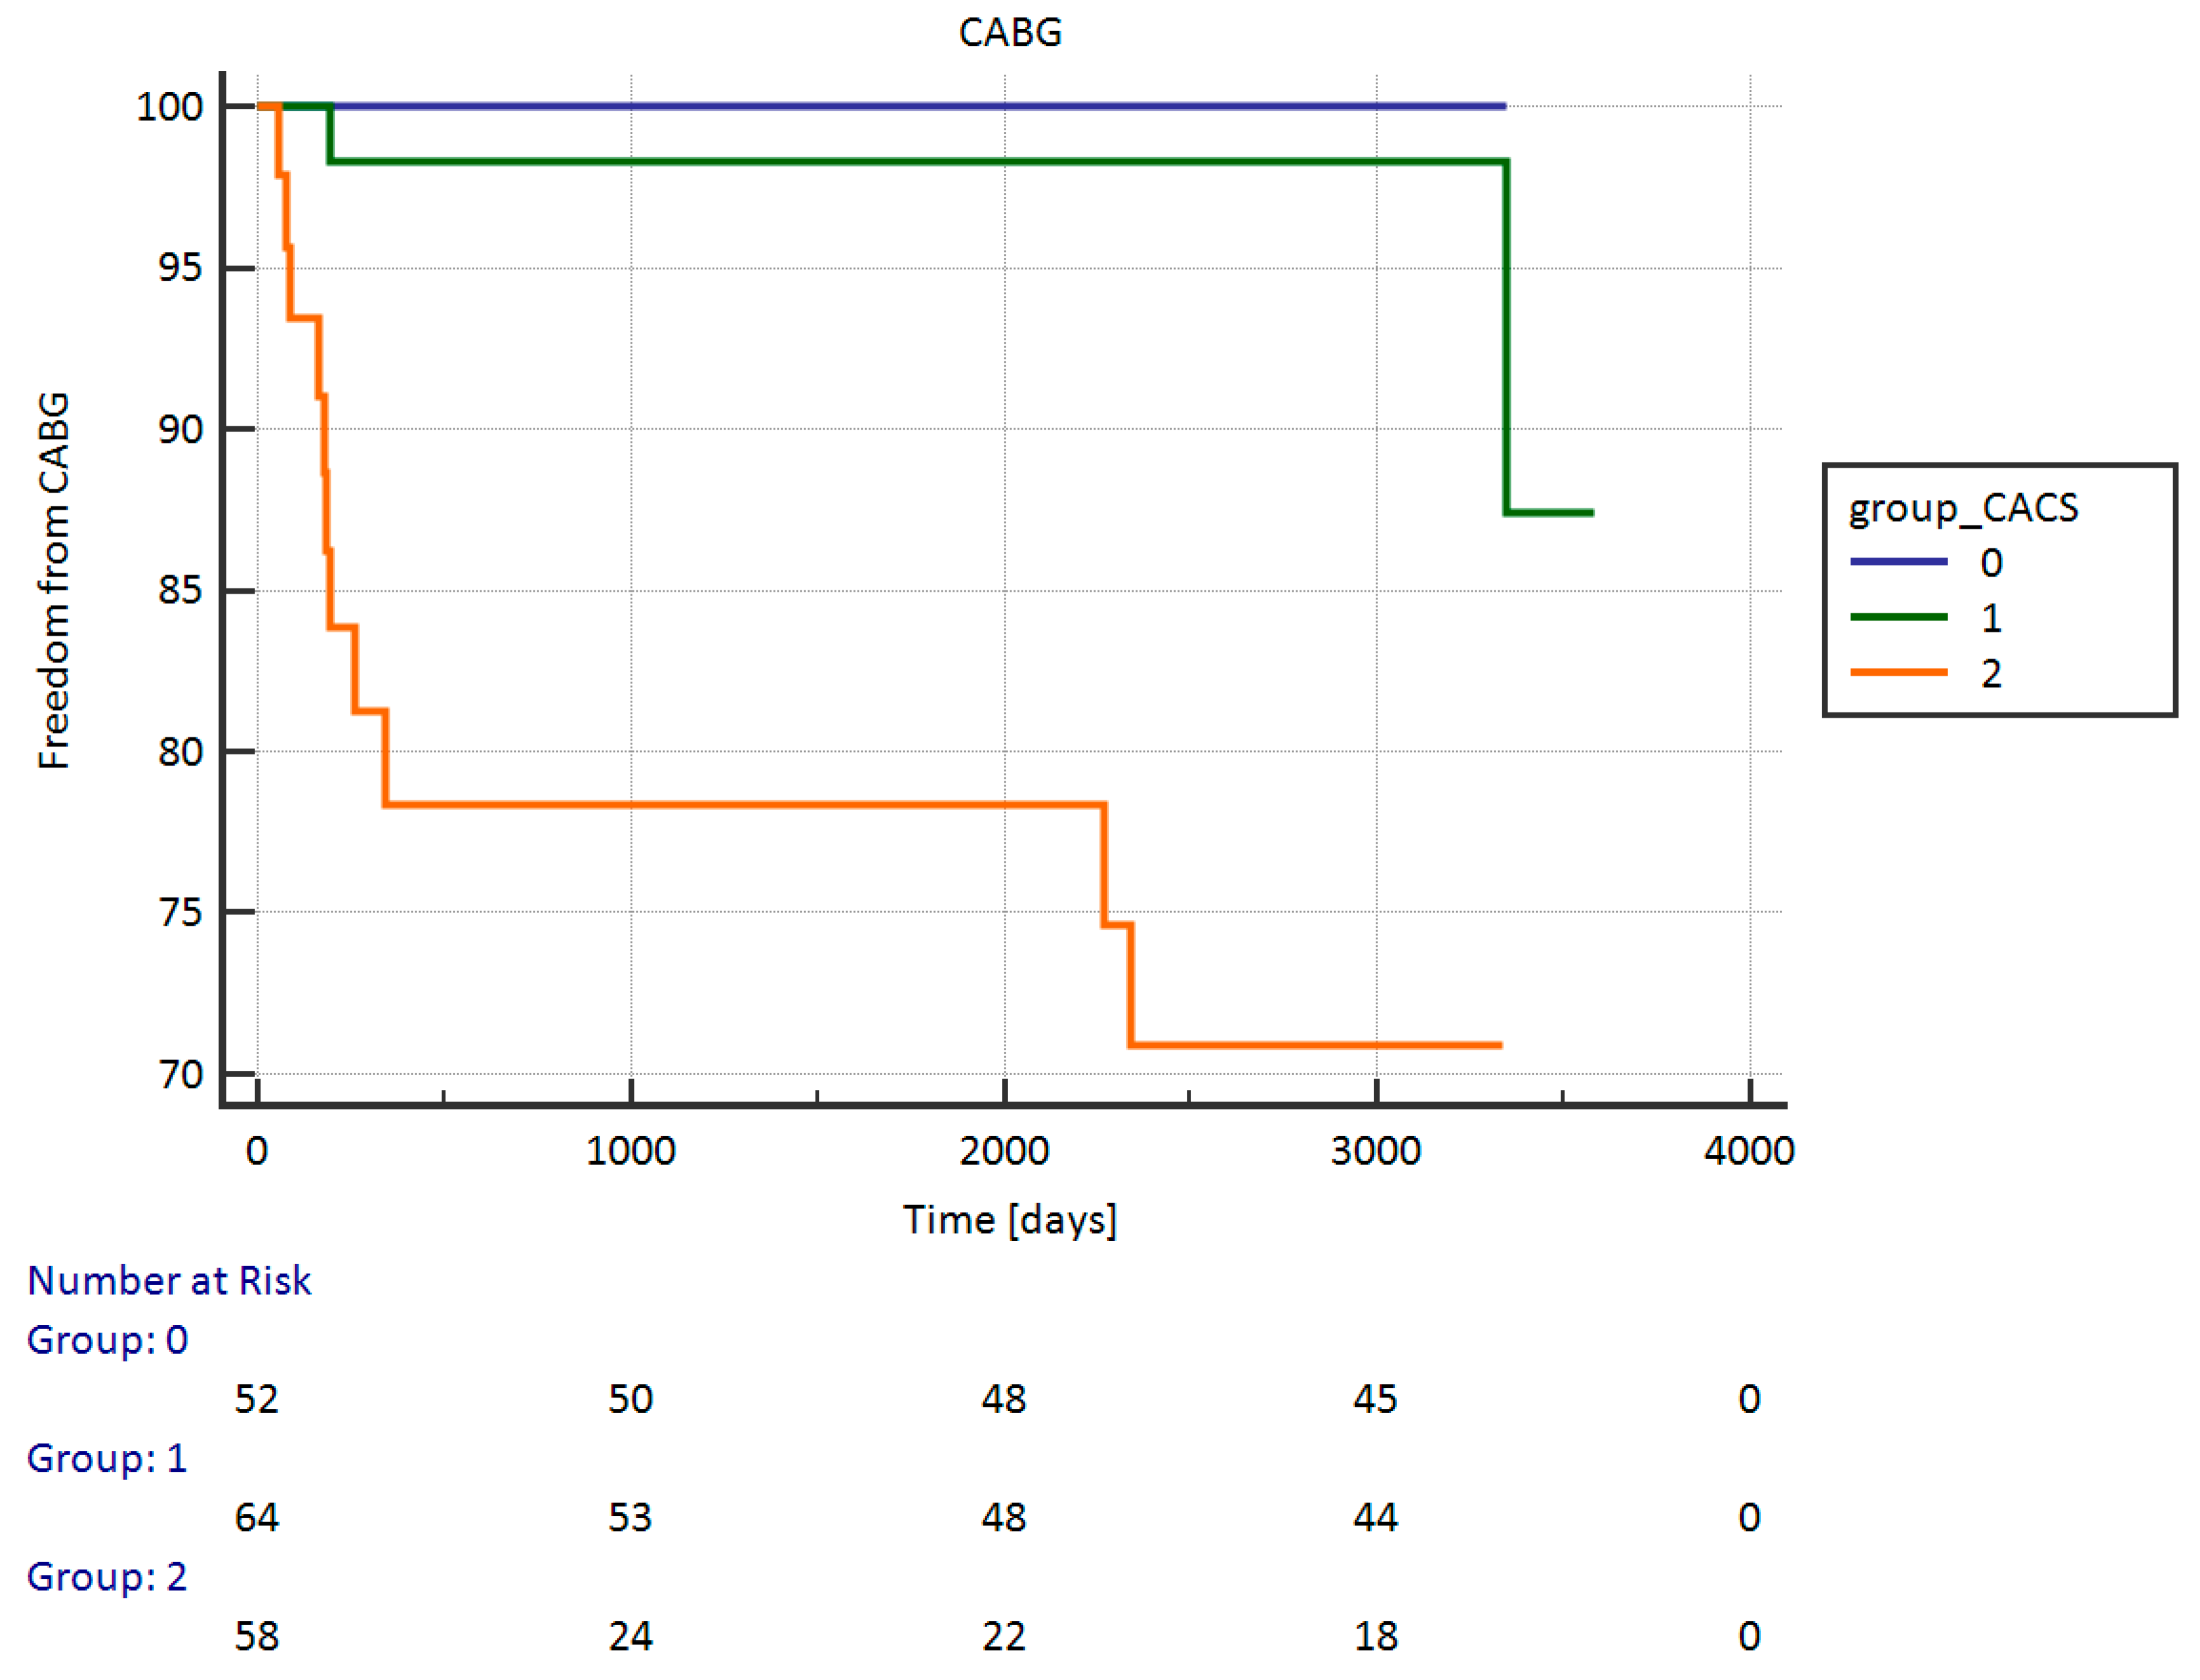
- G1: CACS = 0 AU (52 patients);
- G2: CACS = 1–399 AU (64 patients);
- G3: CACS ≥ 400 AU (58 patients).
2.1. CACS Methods
2.2. Follow-Up
2.3. Statistical Analysis
3. Results
4. Discussion
5. Conclusions
Author Contributions
Funding
Conflicts of Interest
References
- Greenland, P.; Blaha, M.; Budoff, M.; Erbel, R.; Watson, K. Coronary Calcium Score and Cardiovascular Risk. J. Am. Coll. Cardiol. 2018, 72, 434–447. [Google Scholar] [CrossRef] [PubMed]
- Blankstein, R.; Gupta, A.; Rana, J.S.; Nasir, K. The Implication of Coronary Artery Calcium Testing for Cardiovascular Disease Prevention and Diabetes. Endocrinol. Metab. 2017, 32, 47–57. [Google Scholar] [CrossRef] [PubMed]
- Rumberger, J.A.; Sheedy, P.F.; Breen, J.F.; Schwartz, R.S. Electron beam computed tomographic coronary calcium score cutpoints and severity of associated angiographic lumen stenosis. J. Am. Coll. Cardiol. 1997, 29, 1542–1548. [Google Scholar] [CrossRef]
- Hoff, J.A.; Daviglus, M.L.; Chomka, E.V.; Krainik, A.J.; Sevrukov, A.; Kondos, G.T. Conventional coronary artery disease risk factors and coronary artery calcium detected by electron beam tomography in 30,908 healthy individuals. Ann. Epidemiol. 2003, 13, 163–169. [Google Scholar] [CrossRef]
- Montalescot, G.; Sechtem, U.; Achenbach, S.; Andreotti, F.; Arden, C.; Budaj, A.; Bugiardini, R.; Crea, F.; Cuisset, T.; Di Mario, C.; et al. 2013 ESC guidelines on the management of stable coronary artery disease: The Task Force on the management of stable coronary artery disease of the European Society of Cardiology. Eur. Heart J. 2013, 34, 2949–3003. [Google Scholar] [CrossRef]
- Perk, J.; De Backer, G.; Gohlke, H.; Graham, I.; Reiner, Ž.; Verschuren, M.; Albus, C.; Benlian, P.; Boysen, G.; Cifkova, R. European Guidelines on cardiovascular disease prevention in clinical practice (version 2012): The Fifth Joint Task Force of the European Society of Cardiology and Other Societies on Cardiovascular Disease Prevention in Clinical Practice (constituted by representatives of nine societies and by invited experts). Eur. J. Prev. Cardiol. 2012, 19, 585–667. [Google Scholar] [CrossRef]
- Yamamoto, H.; Kitagawa, T.; Kunita, E.; Utsunomiya, H.; Senoo, A.; Nakamoto, Y.; Kihara, Y. Impact of the Coronary Artery Calcium Score on Mid- to Long-Term Cardiovascular Mortality and Morbidity Measured with Coronary Computed Tomography Angiography. Circ. J. 2018, 82, 2342–2349. [Google Scholar] [CrossRef] [PubMed]
- Weber, L.; Cheezum, M.; Reese, J.; Lane, A.; Haley, R.; Lutz, M.; Villines, T. Cardiovascular Imaging for the Primary Prevention of Atherosclerotic Cardiovascular Disease Events. Curr. Cardiovasc. Imaging Rep. 2015, 8, 36. [Google Scholar] [CrossRef] [PubMed]
- Grundy, S.; Stone, N.; Bailey, A.; Beam, C.; Birtcher, K.; Blumenthal, R.; Braun, L.; de Ferranti, S.; Faiella-Tommasino, J.; Forman, D.; et al. 2018 AHA/ACC/AACVPR/AAPA/ABC/ACPM/ADA/AGS/APhA/ASPC/NLA/PCNA Guideline on the Management of Blood Cholesterol: Executive Summary. Circulation 2018. [Google Scholar] [CrossRef] [PubMed]
- Budoff, M.J.; McClelland, R.L.; Nasir, K.; Greenland, P.; Kronmal, R.A.; Kondos, G.T.; Shea, S.; Lima, J.A.; Blumenthal, R.S. Cardiovascular events with ab-sent or minimal coronary calcification: The Multi-Ethnic Study of Atheroscle-rosis (MESA). Am. Heart J. 2009, 158, 554–561. [Google Scholar] [CrossRef] [PubMed]
- McClelland, R.L.; Jorgensen, N.W.; Budoff, M.; Blaha, M.J.; Post, W.S.; Kronmal, R.A.; Bild, D.E.; Shea, S.; Liu, K.; Watson, K.E.; et al. 10-Year Coronary Heart Disease Risk Prediction Using Coronary Artery Calcium and Traditional Risk Factors: Derivation in the MESA (Multi-Ethnic Study of Atherosclerosis) With Validation in the HNR (Heinz Nixdorf Recall) Study and the DHS (Dallas Heart Study). J. Am. Coll. Cardiol. 2015, 66, 1643–1653. [Google Scholar] [CrossRef] [PubMed]
- Ó Hartaigh, B.; Gransar, H.; Callister, T.; Shaw, L.; Schulman-Marcus, J.; Stuijfzand, W.; Valenti, V.; Cho, I.; Szymonifka, J.; Lin, F.; et al. Development and Validation of a Simple-to-Use Nomogram for Predicting 5-, 10-, and 15-Year Survival in Asymptomatic Adults Undergoing Coronary Artery Calcium Scoring. JACC Cardiovasc. Imaging 2018, 11, 450–458. [Google Scholar] [CrossRef] [PubMed]
- Tay, S.; Chang, P.; Lao, W.; Lin, Y.; Chung, Y.; Chan, W. The proper use of coronary calcium score and coronary computed tomography angiography for screening asymptomatic patients with cardiovascular risk factors. Sci. Rep. 2017, 7, 17653. [Google Scholar] [CrossRef] [PubMed]
- Nasir, K.; Clouse, M. Role of nonenhanced multidetector CT coronary artery calcium testing in asymptomatic and symptomatic individuals. Radiology 2012, 264, 637–649. [Google Scholar] [CrossRef] [PubMed]
- Hamilton-Craig, C.R.; Chow, C.K.; Younger, J.F.; Jelinek, V.M.; Chan, J.; Liew, G.Y. Cardiac Society of Australia and New Zealand position statement executive summary: Coronary artery calcium scoring. Med. J. Aust. 2017, 207, 357–361. [Google Scholar] [CrossRef] [PubMed]


| Risk Factors | No Intervention | PCI | CABG | p |
|---|---|---|---|---|
| WHR | 0.90 (0.864–0.920) | 0.906 (0.880–0.931) | 0.908 (0.872–0.942) | 0.3585 |
| Weight | 74 (65–85) | 85 (73.2–98.2) | 96 (84.7–108.5) | 0.0000 |
| BMI | 27.01 (24.39–30.04) | 28.73 (26.54–32.64) | 32.60 (28.19–33.90) | 0.0002 |
| Smoking YES % | 22.31 | 29.03 | 15.38 | 0.7171 |
| Arterial hypertension systolic (mmHg) | 80 (70–85) | 80 (70–90) | 90 (77.5–91.2) | 0.0225 |
| Arterial hypertension diastolic (mmHg) | 130 (120–140) | 140 (130–150) | 150 (140–160) | 0.0000 |
| Hyperlipidemia | 63.84 | 67.74 | 76.92 | 0.6134 |
| Diabetes | 15.38 | 41.93 | 15.38 | 0.0037 |
| T Family burden | 71.54 | 64.52 | 55.85 | 0.3539 |
| Physical activity | 32.31 | 45.16 | 46.15 | 0.2892 |
| Waist | 89.50 (82–100) | 95 (92–102) | 102 (94.50–109) | 0.0021 |
| Age | 58 (54–63) | 61 (56–69) | 57 (54.25–62.75) | 0.0890 |
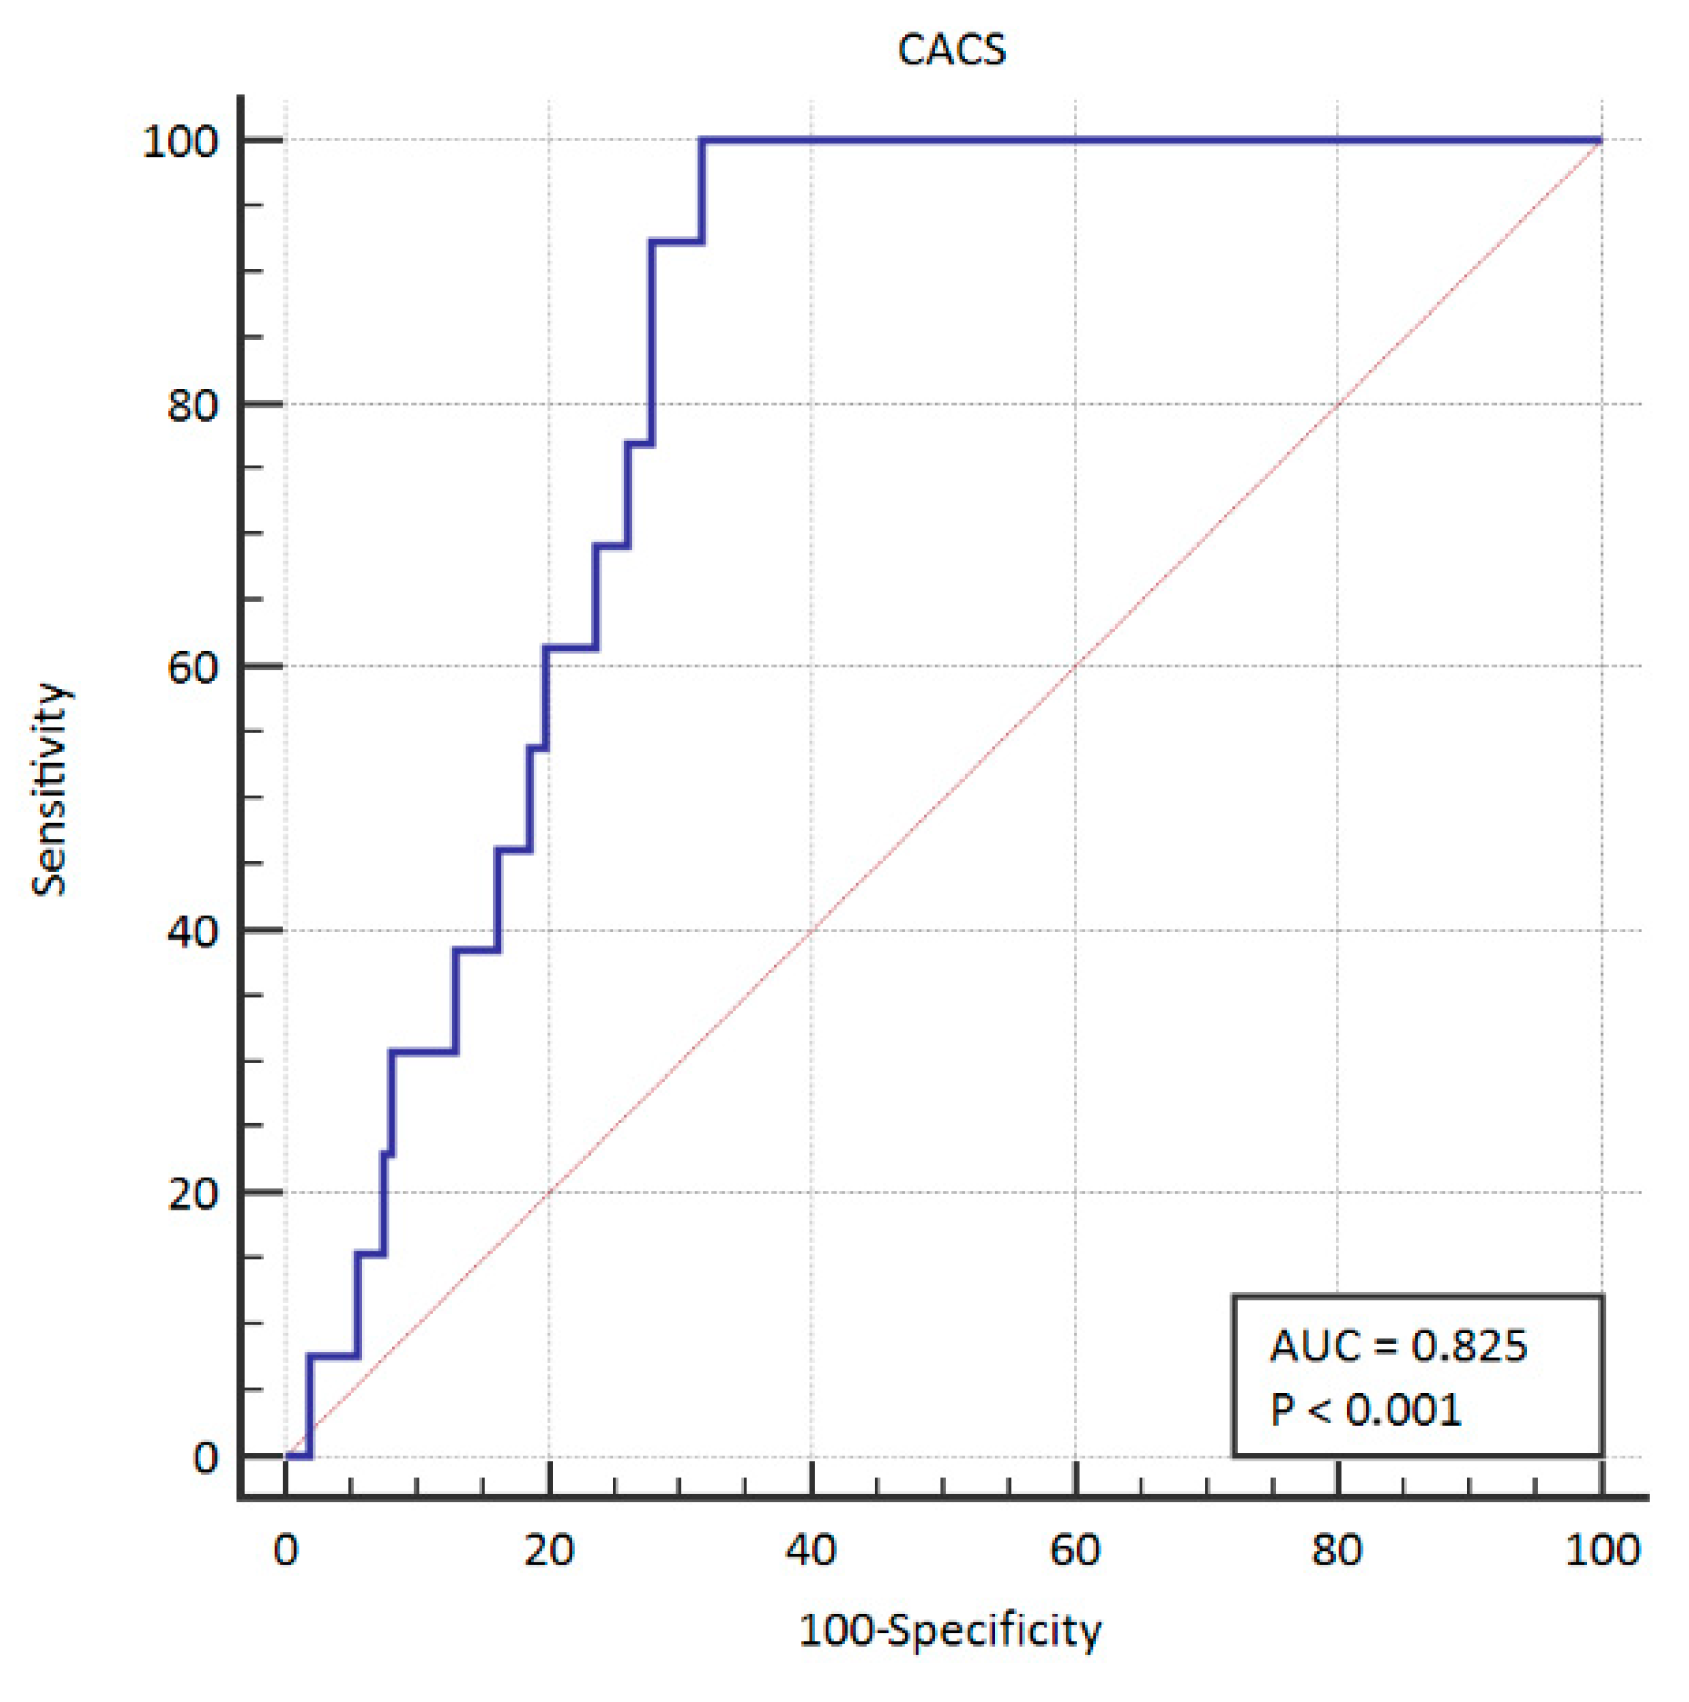
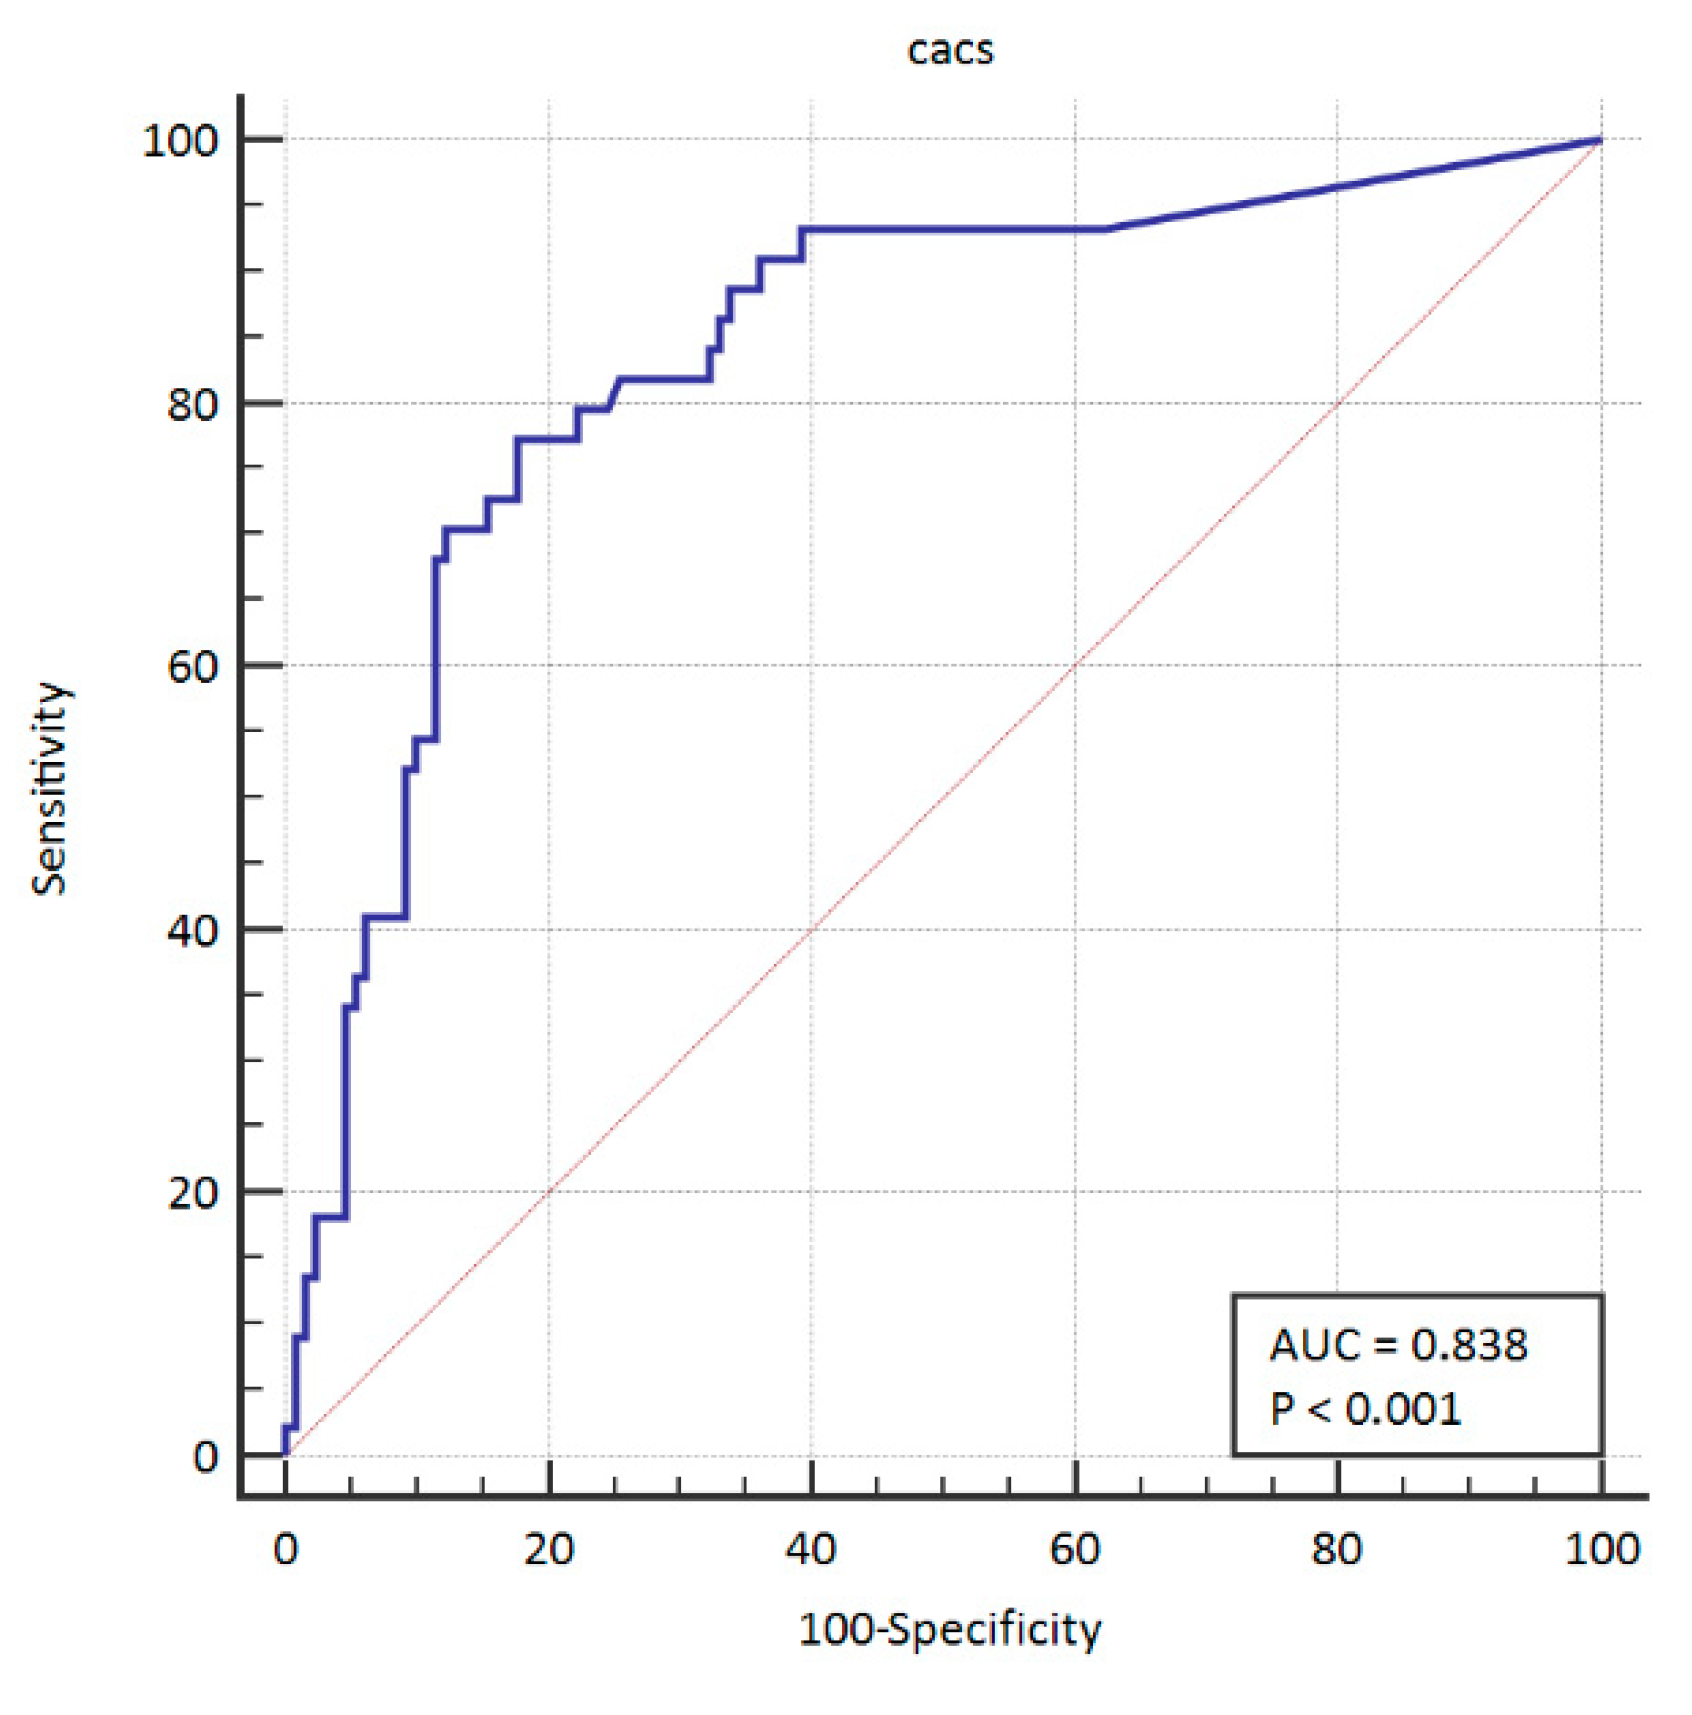
| CACS | 9.5 (0–172) | 598 (97–918) | 577 (421.75–975) | 0.0000 |
| Place of living (city) | 85.38 | 77.42 | 92.31 | 0.3930 |
© 2019 by the authors. Licensee MDPI, Basel, Switzerland. This article is an open access article distributed under the terms and conditions of the Creative Commons Attribution (CC BY) license (http://creativecommons.org/licenses/by/4.0/).
Share and Cite
Mlynarska, A.; Mlynarski, R.; Sosnowski, M. Usefulness of the Coronary Artery Calcium Score in Predicting Subsequent Coronary Interventions—A Ten-Year Single-Center Perspective. Int. J. Environ. Res. Public Health 2019, 16, 2132. https://doi.org/10.3390/ijerph16122132
Mlynarska A, Mlynarski R, Sosnowski M. Usefulness of the Coronary Artery Calcium Score in Predicting Subsequent Coronary Interventions—A Ten-Year Single-Center Perspective. International Journal of Environmental Research and Public Health. 2019; 16(12):2132. https://doi.org/10.3390/ijerph16122132
Chicago/Turabian StyleMlynarska, Agnieszka, Rafal Mlynarski, and Maciej Sosnowski. 2019. "Usefulness of the Coronary Artery Calcium Score in Predicting Subsequent Coronary Interventions—A Ten-Year Single-Center Perspective" International Journal of Environmental Research and Public Health 16, no. 12: 2132. https://doi.org/10.3390/ijerph16122132
APA StyleMlynarska, A., Mlynarski, R., & Sosnowski, M. (2019). Usefulness of the Coronary Artery Calcium Score in Predicting Subsequent Coronary Interventions—A Ten-Year Single-Center Perspective. International Journal of Environmental Research and Public Health, 16(12), 2132. https://doi.org/10.3390/ijerph16122132