Comprehensive Eutrophication Assessment Based on Fuzzy Matter Element Model and Monte Carlo-Triangular Fuzzy Numbers Approach


Abstract
:1. Introduction
2. Methodology
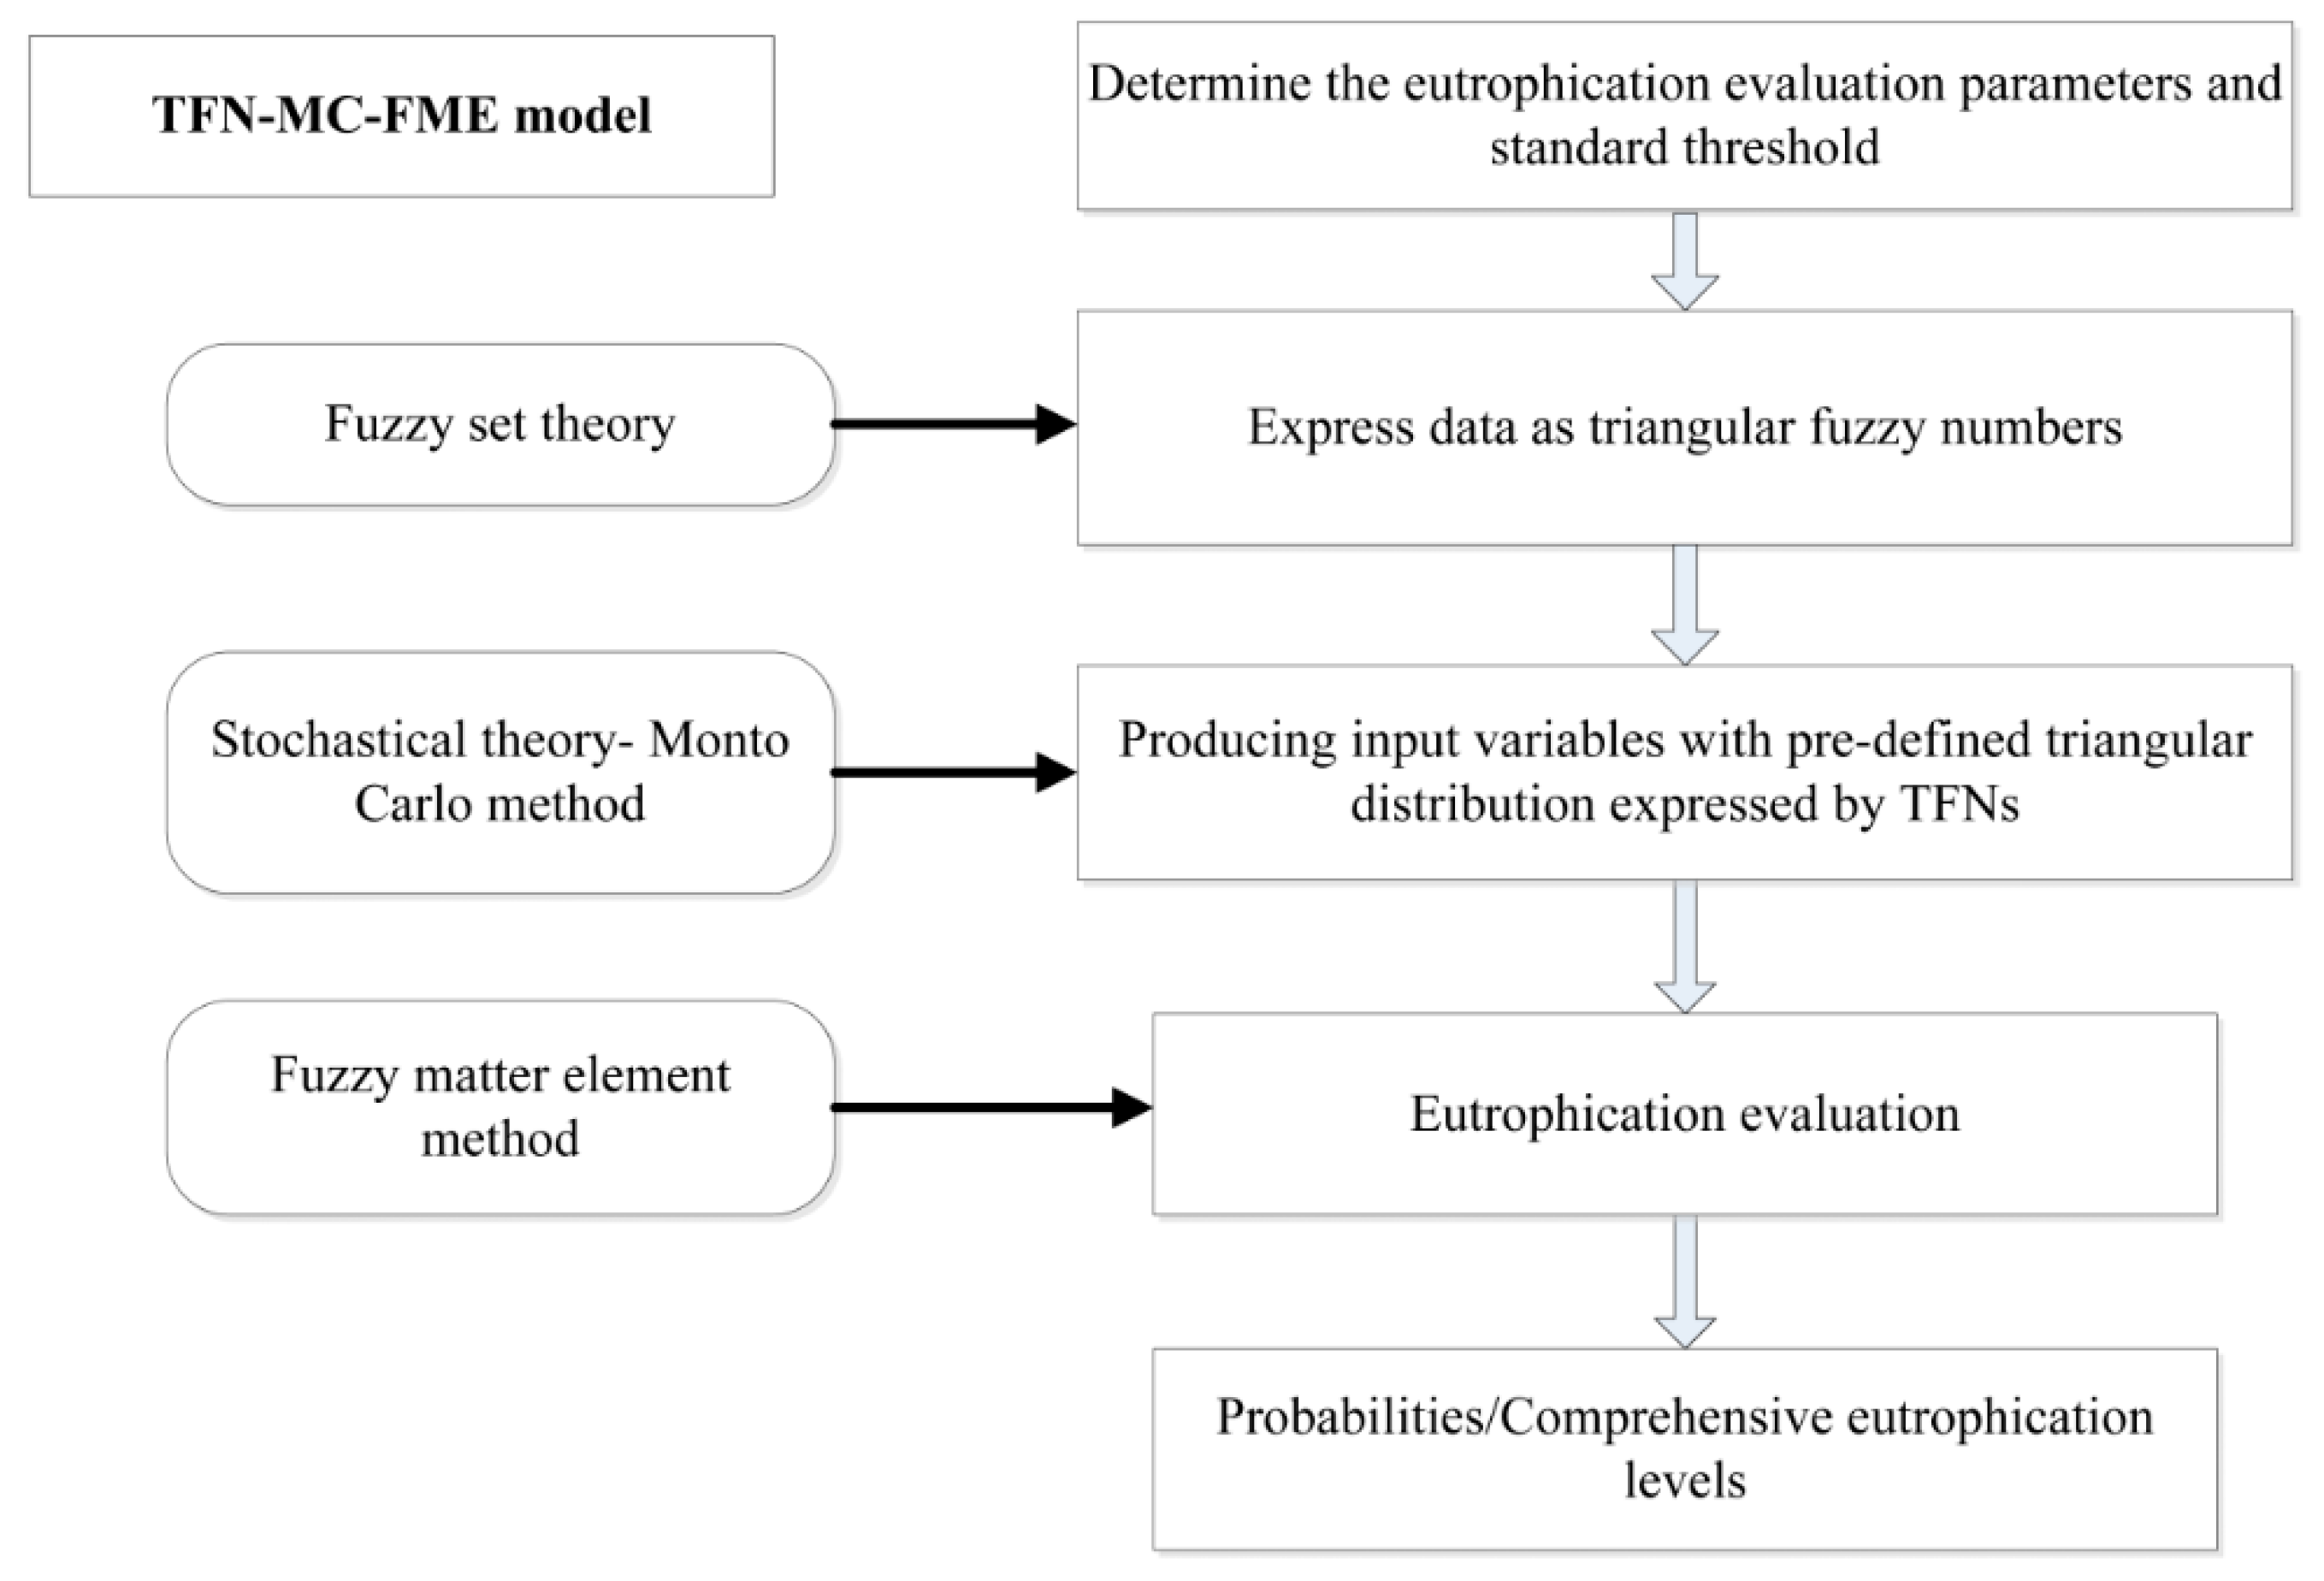
2.1. Triangular Fuzzy Numbers (TFN) Approach
2.2. Monte Carlo (MC) Approach
2.3. Improved Fuzzy Matter Element Model
2.3.1. Establish the Fuzzy Matter Element model of Eutrophication Assessment
2.3.2. Determination of Weights
2.3.3. Calculation of Fuzzy Neartude
2.3.4. Determine the Eutrophication Grade of Lakes
2.4. Comprehensive Eutrophication Evaluation Based on the TFN–MC–FME Model
- (1)
- In terms of the data processing method of TFN, the variables of Chl-a, CODMn, TP, TN, and SD in the FME model were obtained by Equation (1), and expressed with , such as .
- (2)
- The above variables were defined as the independent variables, and probability distributions of the actual observed data were set as TFN distribution type in the Crystal Ball software. The A1, A2, and A3 of variables were typed in each data cell.
- (3)
- According to Equations (3)–(8), the normalized fuzzy matter element matrixs for the k-th studied lake were established. The weights of indictors were identified by Equations (9)–(13). Then, the fuzzy neartudes of the k-th lake to the j-th grade were calculated by Equations (14) and (15). The eutrophication grades of lakes were determined by Equation (16).
- (4)
- By running simulations in the Crystal Ball software, the corresponding probabilistic eutrophication grade for the k-th lake was obtained by setting the interval values of each eutrophication grade in the software. By further combining the probabilities with the eutrophication grade, the comprehensive eutrophication grades were acquired by Equation (17), which was shown as follows:
3. Results and Discussions
3.1. Eutrophication Grade Evaluated by Hybrid TFN–MC–FME Model
3.2. Comparison with Other Approaches
4. Conclusions
Author Contributions
Funding
Conflicts of Interest
References
- Wu, Z.; Wang, X.; Chen, Y.; Cai, Y.; Deng, J. Assessing river water quality using water quality index in Lake Taihu Basin, China. Sci. Total Environ. 2008, 612, 914–922. [Google Scholar] [CrossRef] [PubMed]
- Ali, E.M.; Khairy, H.M. Environmental assessment of drainage water impacts on water quality and eutrophication level of Lake Idku, Egypt. Environ. Pollut. 2016, 216, 437–449. [Google Scholar] [CrossRef]
- Li, B.; Yang, G.; Wan, R.; Hörmann, G.; Huang, J.; Fohrer, N.; Zhang, L. Combining multivariate statistical techniques and random forests model to assess and diagnose the trophic status of Poyang Lake in China. Ecol. Indic. 2017, 83, 74–83. [Google Scholar] [CrossRef]
- Todd, A.S.; Manning, A.H.; Verplanck, P.L.; Crouch, C.; McKnight, D.M.; Dunham, R. Climate-change-driven deterioration of water quality in a mineralized watershed. Environ. Sci. Technol. 2012, 46, 9324–9332. [Google Scholar] [CrossRef]
- Wang, D.; Liu, D.; Ding, H.; Singh, V.P.; Wang, Y.; Zeng, X.; Wu, J.; Wang, L. A cloud model-based approach for water quality assessment. Environ. Res. 2016, 148, 24–35. [Google Scholar] [CrossRef]
- Wu, Z.; Zhang, D.; Cai, Y.; Wang, X.; Zhang, L.; Chen, Y. Water quality assessment based on the water quality index method in Lake Poyang: The largest freshwater lake in China. Sci. Rep. 2017, 7, 17999. [Google Scholar] [CrossRef] [PubMed] [Green Version]
- Chang, F.J.; Chung, C.H.; Chen, P.A.; Liu, C.W.; Coynel, A.; Vachaud, G. Assessment of arsenic concentration in stream water using neuro fuzzy networks with factor analysis. Sci. Total Environ. 2014, 494–495, 202–210. [Google Scholar] [CrossRef]
- Deng, X.; Xu, Y.; Han, L.; Yu, Z.; Yang, M.; Pan, G. Assessment of river health based on an improved entropy-based fuzzy matter-element model in the Taihu Plain, China. Ecol. Indic. 2015, 57, 85–95. [Google Scholar] [CrossRef]
- He, Y.; Dai, A.; Zhu, J.; He, H.; Li, F. Risk assessment of urban network planning in china based on the matter-element model and extension analysis. Int. J. Electr. Power 2011, 33, 775–782. [Google Scholar] [CrossRef]
- Ocampo-Duque, W.; Osorio, C.; Piamba, C.; Schuhmacher, M.; Domingo, J.L. Water quality analysis in rivers with non-parametric probability distributions and fuzzy inference systems: Application to the Cauca River, Colombia. Environ. Int. 2013, 52, 17–28. [Google Scholar] [CrossRef]
- Wong, H.; Hu, B.Q. Application of improved extension evaluation method to water quality evaluation. J. Hydrol. 2014, 509, 539–548. [Google Scholar] [CrossRef]
- Zhi, G.; Chen, Y.; Liao, Z.; Walther, M.; Yuan, X. Comprehensive assessment of eutrophication status based on Monte Carlo–triangular fuzzy numbers model: Site study of Dongting Lake, Mid-South China. Environ. Earth Sci. 2016, 75. [Google Scholar] [CrossRef]
- Mpimpas, H.; Anagnostopoulos, P.; Ganoulis, J. Modelling of water pollution in the Thermaikos Gulf with fuzzy parameters. Ecol. Model. 2001, 142, 91–104. [Google Scholar] [CrossRef]
- Cai, W. Extension theory and its application. Chin. Sci. Bull. 1999, 44, 1538–1548. (In Chinese) [Google Scholar] [CrossRef]
- Li, B.; Yang, G.; Wan, R.; Hormann, G. Dynamic water quality evaluation based on fuzzy matter-element model and functional data analysis, a case study in Poyang Lake. Environ. Sci. Pollut. Res. Int. 2017. [Google Scholar] [CrossRef]
- Zhao, Z.; Guo, Y.; Wei, H.; Ran, Q.; Gu, W. Predictions of the Potential Geographical Distribution and Quality of a Gynostemma Pentaphyllum Base on the Fuzzy Matter Element Model in China. Sustainability 2017, 9, 1114. [Google Scholar] [CrossRef]
- Giachetti, R.E.; Young, R.E. A parametric representation of fuzzy numbers and their arithmetic operators. Fuzzy. Set. Syst. 1997, 91, 185–202. [Google Scholar] [CrossRef] [Green Version]
- Andersen, N.J.H.; Brandstrup, J. Monte Carlo Simulation in Crystal Ball 7.3. Available online: http://medarbejdere.au.dk/fileadmin/www.asb.dk/servicekatalog/IT/Analysevaerktoejer/Crystal_Ball/Crystal_Ball_7.3_UK.pdf (accessed on 1 May 2008).
- Liu, W.; Li, S.; Bu, H.; Zhang, Q.; Liu, G. Eutrophication in the Yunnan Plateau lakes: The influence of lake morphology, watershed land use, and socioeconomic factors. Environ. Sci. Pollut. Res. Int. 2012, 19, 858–870. [Google Scholar] [CrossRef] [PubMed]
- Yan, H.; Wu, D.; Huang, Y.; Wang, G.; Shang, M.; Xu, J.; Shi, X.; Shan, K.; Zhou, B.; Zhao, Y. Water eutrophication assessment based on rough set and multidimensional cloud model. Chemometr. Intell. Lab. 2017, 164, 103–112. [Google Scholar] [CrossRef]
- Wei, C.; Guo, Z.; Wu, J.; Ye, S. Constructing an assessment indices system to analyze integrated regional carrying capacity in the coastal zones—A case in Nantong. Ocean Coast Manag. 2014, 93, 51–59. [Google Scholar] [CrossRef]
- Ding, H.; Wang, D. The evaluation method of water eutrophication based on cloud model. Acta Sci. Circumst. 2013, 33, 251–257. [Google Scholar] [CrossRef]
- Shu, J. Assessment of eutrophication in main lakes of China. Oceanologia et Limnologia Sinica 1993, 24, 616–620. (In Chinese) [Google Scholar]
- Liu, D.; Zou, Z. Water quality evaluation based on improved fuzzy matter-element method. J. Environ. Sci. China 2012, 24, 1210–1216. [Google Scholar] [CrossRef]
- Cui, D. Application of MATLAB neural network in evaluating eutrophication degree of lakes and reservoirs. Environ. Res. Monit. 2012, 25, 42–48. (In Chinese) [Google Scholar]
- Wang, G.; Ren, L.; Wang, B.; Yu, Z. Lake eutrophication evaluation model based on projection pursuit method. Water Resour. Prot. 2009, 25, 13–18. (In Chinese) [Google Scholar]

| Approach | Examples | Advantages | Limitations |
|---|---|---|---|
| Multivariate statistical techniques | Including cluster analysis (CA), discriminant analysis (DA), principle component analysis/factor analysis (PCA/FA). | -Can solve randomness of monitored data -Reduce a complex data set to a considerably low dimension -Obtain the underlying patterns within the original data | -Require larger samples -Data are difficult to obtain |
| Comprehensive assessment method | Including fuzzy set theory based on fuzzy membership function, matter element model, etc. | -Reflected the fuzziness in the evaluation of the classification standard, evaluation class, and degree of eutrophication -Solve uncertainty | Weak to distinguish the adjacent characteristic indicators |
| Machine learning approaches | Including artificial neural networks (ANN), support vector machine, and random forests (RF), etc. | -Provide predictive models with good generalization abilities -Capture unknown patterns in the assessment process -Infer complex relationships without knowledge of a system | -Lacks to accurately analyze each performance index |
| Hybrid models | Including method combined with neuro fuzzy networks with factor analysis, cloud model considering randomness with fuzziness, etc. | Combine the advantages of different methods | -Complicated model structure |
| Rank | Chl-a (mg/m3) | CODMn (mg/L) | TP (mg/m3) | TN (mg/m3) | SD (m) |
|---|---|---|---|---|---|
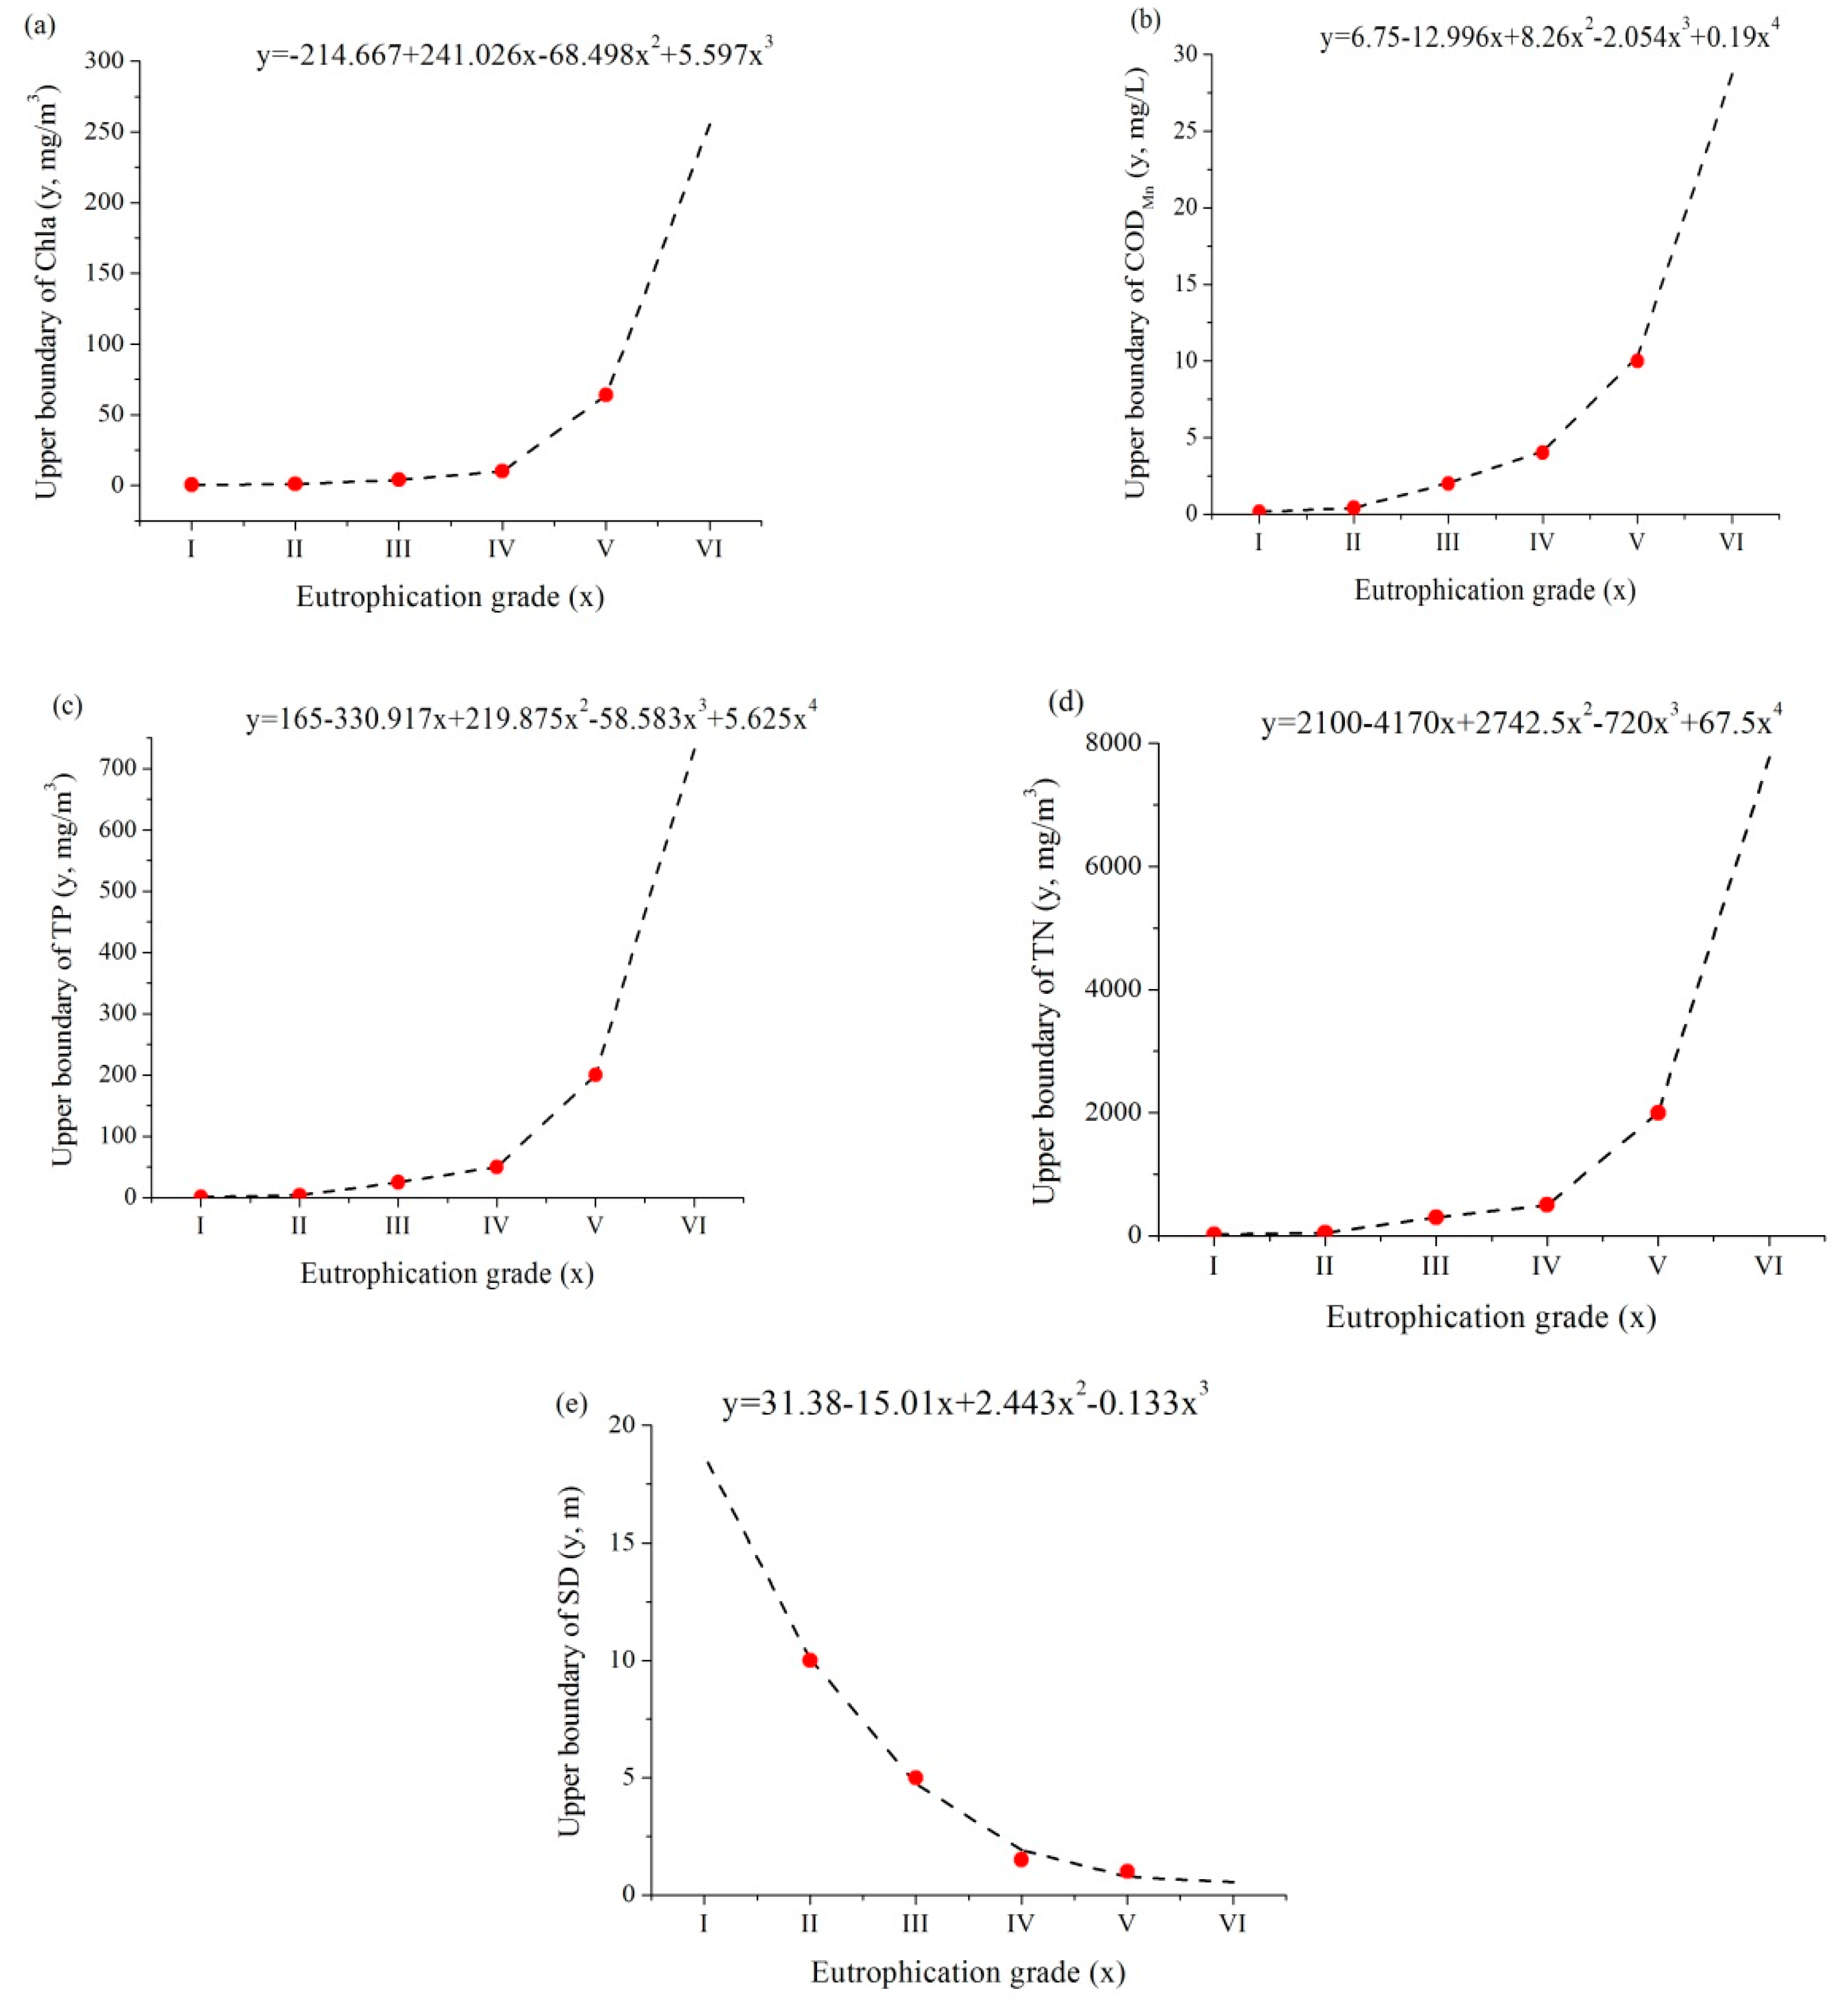
| I | ≤0.5 | ≤0.15 | ≤1 | ≤20 | ≥10 |
| II | ≤1 | ≤0.4 | ≤4 | ≤50 | ≥5 |
| III | ≤4 | ≤2.0 | ≤25 | ≤300 | ≥1.5 |
| IV | ≤10 | ≤4.0 | ≤50 | ≤500 | ≥1.0 |
| V | ≤64 | ≤10.0 | ≤200 | ≤2000 | ≥0.4 |
| VI | >64 | >10 | >200 | >2000 | <0.4 |
| Indicators | Entropy | Entropy Weight | AHP Weight | Entropy–AHP Weight w |
|---|---|---|---|---|
| Chl-a | 2.97 | 0.12 | 0.46 | 0.32 |
| CODMn | 4.54 | 0.21 | 0.15 | 0.19 |
| TP | 5.12 | 0.24 | 0.09 | 0.13 |
| TN | 4.85 | 0.23 | 0.05 | 0.077 |
| SD | 4.48 | 0.20 | 0.25 | 0.30 |
| J | (1, 1.5] | (1.5, 2.5] | (2.5, 3.5] | (3.5, 4.5] | (4.5, 5.5] | (5.5, 6] |
|---|---|---|---|---|---|---|
| Grade | I | II | III | IV | V | VI |
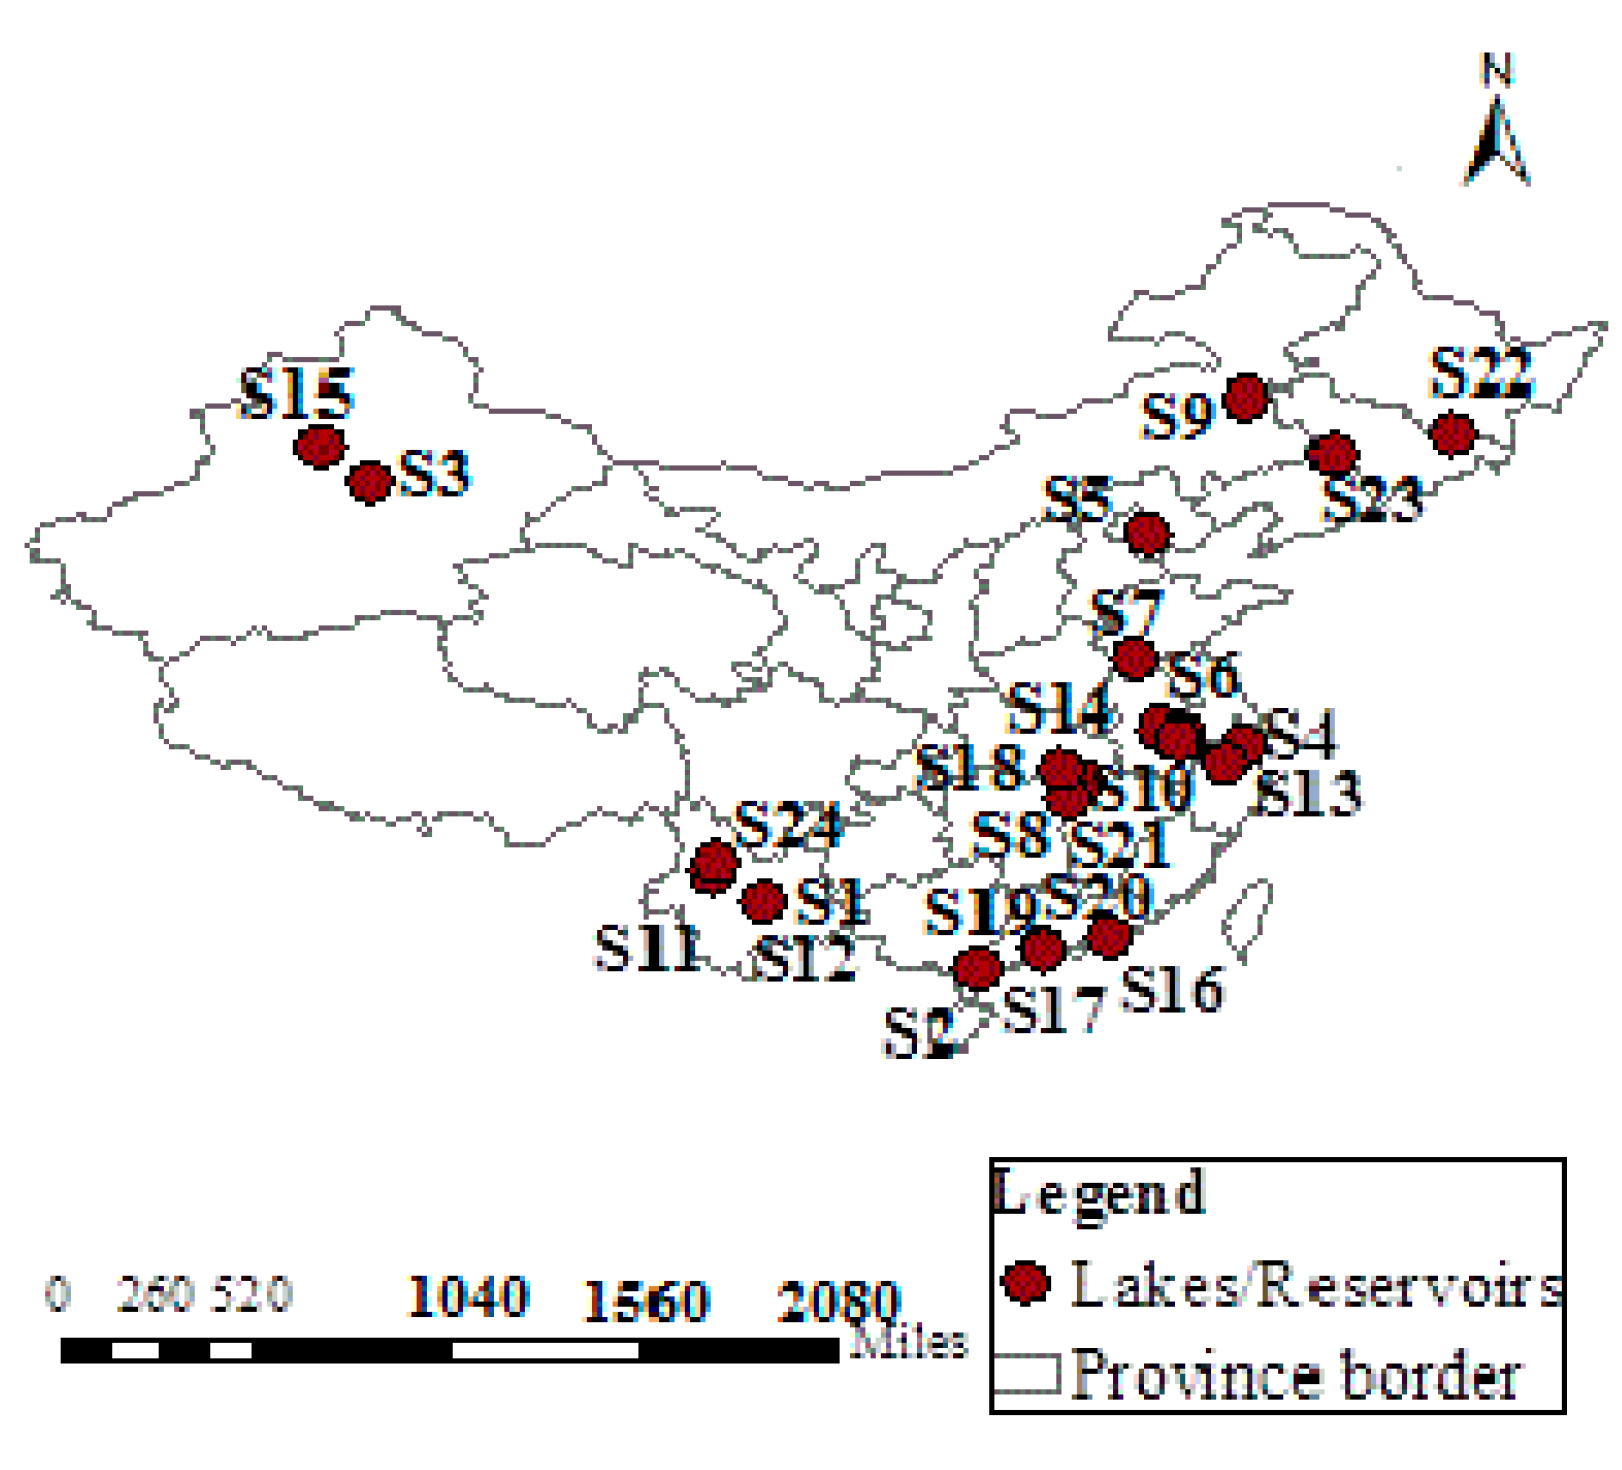
| Sampling Sites | Chl-a (mg/m3) | CODMn (mg/L) | TP (mg/m3) | TN (mg/m3) | SD (m) | ||||||||||
|---|---|---|---|---|---|---|---|---|---|---|---|---|---|---|---|
| A1 | A2 | A3 | A1 | A2 | A3 | A1 | A2 | A3 | A1 | A2 | A3 | A1 | A2 | A3 | |
| Erhai Lake (S1) | 0.49 | 1.86 | 3.00 | 1.70 | 3.09 | 3.24 | 4 | 22 | 40 | 160 | 246 | 465 | 1.22 | 2.77 | 3.45 |
| Gaoshan Lake (S2) | 0.28 | 1.49 | 5.24 | 0.56 | 1.47 | 3.28 | 17 | 46 | 86 | 187 | 358 | 652 | 1.08 | 1.72 | 2.54 |
| Bosten Lake (S3) | 1.74 | 3.52 | 6.59 | 2.85 | 5.96 | 11.08 | 12 | 23 | 41 | 457 | 932 | 1598 | 0.58 | 1.46 | 3.04 |
| Dianshan Lake (S4) | 1.35 | 3.00 | 9.34 | 1.76 | 2.87 | 4.98 | 6 | 29 | 50 | 408 | 1086 | 1732 | 0.19 | 0.67 | 1.47 |
| Yuqiao reservoir (S5) | 2.83 | 10.79 | 22.71 | 1.08 | 4.11 | 9.65 | 4 | 25 | 53 | 325 | 1220 | 2564 | 0.38 | 1.42 | 2.16 |
| Gucheng Lake (S6) | 0.54 | 4.99 | 8.32 | 0.95 | 2.75 | 4.58 | 12 | 52 | 118 | 598 | 2374 | 5462 | 0.05 | 0.28 | 0.59 |
| Nansi Lake (S7) | 0.28 | 3.77 | 8.76 | 2.58 | 6.96 | 11.49 | 63 | 194 | 432 | 1248 | 3201 | 6325 | 0.12 | 0.44 | 0.76 |
| Ci Lake (S8) | 3.68 | 14.47 | 42.36 | 0.87 | 3.74 | 7.64 | 26 | 77 | 186 | 350 | 1000 | 2512 | 0.10 | 0.36 | 0.64 |
| Dali Lake (S9) | 1.38 | 7.24 | 15.24 | 8.27 | 16.25 | 34.58 | 24 | 153 | 354 | 425 | 1671 | 3514 | 0.16 | 0.48 | 1.14 |
| Chao Lake (S10) | 3.85 | 11.80 | 31.65 | 2.56 | 4.01 | 9.86 | 36 | 115 | 364 | 546 | 1786 | 3256 | 0.05 | 0.28 | 0.62 |
| Dianchi Lake(Outer sea) (S11) | 16.52 | 44.43 | 85.36 | 2.58 | 7.11 | 14.56 | 36 | 108 | 328 | 357 | 1309 | 2658 | 0.19 | 0.49 | 0.87 |
| Dianchi Lake (Cao Sea) (S12) | 98.27 | 298.86 | 456.92 | 5.68 | 16.58 | 38.75 | 357 | 931 | 1456 | 685 | 15,273 | 24,365 | 0.06 | 0.23 | 0.42 |
| West Lake (S13) | 15.68 | 58.95 | 115.64 | 0.68 | 6.94 | 17.28 | 39 | 161 | 426 | 426 | 2478 | 2768 | 0.15 | 0.43 | 0.84 |
| Gantang Lake (S14) | 29.56 | 75.69 | 158.64 | 0.98 | 7.23 | 21.32 | 38 | 141 | 325 | 346 | 1417 | 2541 | 0.09 | 0.38 | 0.73 |
| Mogu Lake (S15) | 8.96 | 54.77 | 128.47 | 2.38 | 10.38 | 24.19 | 56 | 287 | 574 | 624 | 2206 | 4567 | 0.21 | 0.53 | 0.87 |
| Li Lake (S16) | 37.54 | 119.51 | 326.98 | 2.13 | 9.92 | 34.67 | 84 | 372 | 753 | 1524 | 3038 | 5367 | 0.16 | 0.34 | 0.62 |
| Dongshan Lake (S17) | 29.34 | 149.45 | 514.28 | 3.48 | 13.40 | 25.86 | 158 | 428 | 796 | 1645 | 5350 | 7658 | 0.08 | 0.22 | 0.43 |
| Moshui Lake (S18) | 48.37 | 153.59 | 358.69 | 2.49 | 13.51 | 38.62 | 95 | 232 | 467 | 7853 | 15,692 | 26,342 | 0.06 | 0.22 | 0.54 |
| Liwan Lake (S19) | 46.32 | 162.92 | 362.97 | 5.62 | 14.46 | 34.25 | 249 | 743 | 1124 | 2405 | 7337 | 11,246 | 0.13 | 0.31 | 0.64 |
| Liuhua Lake (S20) | 75.49 | 323.51 | 615.24 | 8.37 | 25.26 | 42.63 | 342 | 643 | 1024 | 3248 | 6777 | 9754 | 0.03 | 0.15 | 0.32 |
| Xuanwu Lake (S21) | 28.67 | 168.14 | 324.56 | 3.62 | 10.08 | 25.98 | 158 | 663 | 1247 | 1125 | 4073 | 7654 | 0.05 | 0.22 | 0.42 |
| Jingpo Lake (S22) | 0.98 | 4.96 | 14.35 | 1.67 | 5.96 | 24.37 | 88 | 316 | 647 | 324 | 1270 | 2485 | 0.26 | 0.73 | 1.08 |
| Nan Lake (S23) | 21.71 | 120.60 | 328.45 | 2.38 | 8.22 | 21.57 | 65 | 228 | 497 | 1028 | 2630 | 3782 | 0.06 | 0.22 | 0.41 |
| Qionghai Lake (S24) | 0.19 | 0.88 | 3.28 | 0.54 | 1.43 | 4.52 | 57 | 130 | 268 | 217 | 410 | 862 | 1.08 | 2.98 | 4.32 |
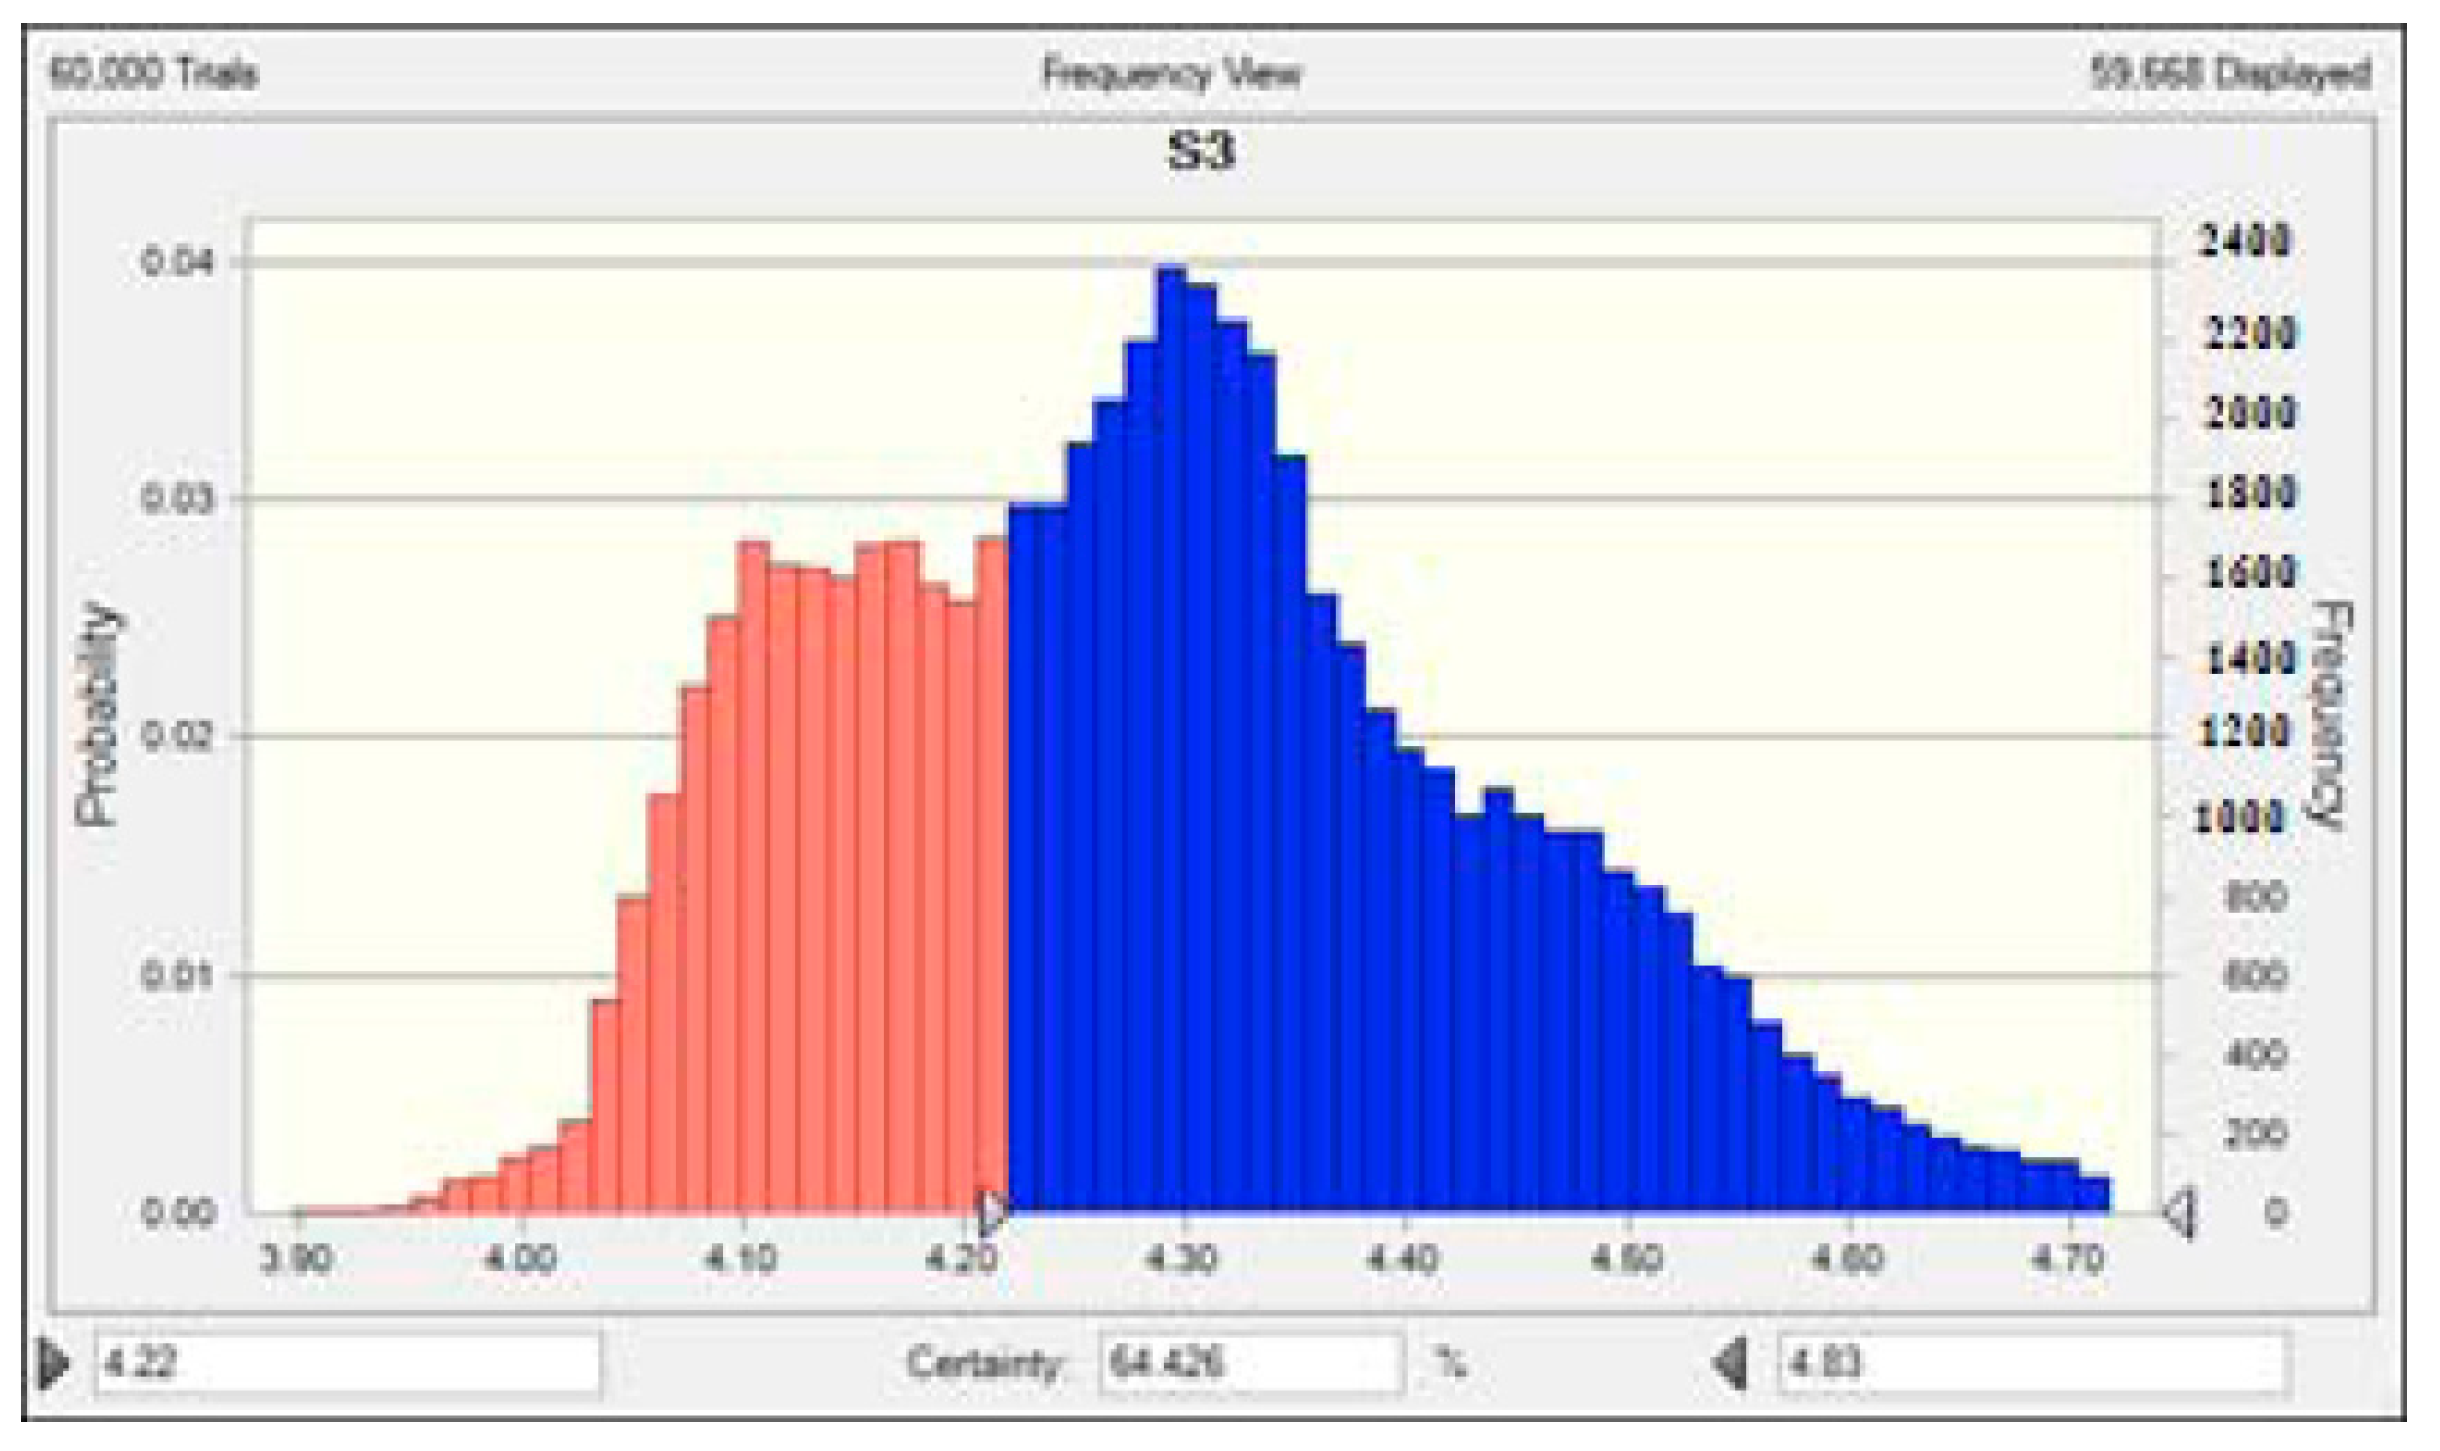
| Cases | Minimum Values | Average Values | Maximum Values |
|---|---|---|---|
| Erhai Lake (S1) | 3.33 | 3.77 | 4.13 |
| Gaoshan Lake (S2) | 3.32 | 3.89 | 4.45 |
| Bosten Lake (S3) | 3.85 | 4.24 | 4.85 |
| Dianshan Lake (S4) | 3.90 | 4.48 | 4.99 |
| Yuqiao reservoir (S5) | 3.56 | 4.55 | 5.19 |
| Gucheng Lake (S6) | 4.07 | 4.83 | 5.19 |
| Nansi Lake (S7) | 4.32 | 5.00 | 5.37 |
| Ci Lake (S8) | 4.56 | 5.16 | 5.44 |
| Dali Lake (S9) | 4.56 | 5.13 | 5.61 |
| Chao Lake (S10) | 4.81 | 5.26 | 5.56 |
| Dianchi Lake(Outer sea) (S11) | 4.87 | 5.26 | 5.68 |
| Dianchi Lake (Cao Sea) (S12) | 5.60 | 5.82 | 5.91 |
| West Lake (S13) | 4.82 | 5.36 | 5.82 |
| Gantang Lake (S14) | 4.93 | 5.48 | 5.83 |
| Mogu Lake (S15) | 4.96 | 5.44 | 5.83 |
| Li Lake (S16) | 5.21 | 5.69 | 5.87 |
| Dongshan Lake (S17) | 5.37 | 5.78 | 5.90 |
| Moshui Lake (S18) | 5.28 | 5.75 | 5.90 |
| Liwan Lake (S19) | 5.34 | 5.74 | 5.89 |
| Liuhua Lake (S20) | 5.69 | 5.87 | 5.91 |
| Xuanwu Lake (S21) | 5.40 | 5.77 | 5.91 |
| Jingpo Lake (S22) | 4.39 | 5.02 | 5.53 |
| Nan Lake (S23) | 5.16 | 5.69 | 5.90 |
| Qionghai Lake (S24) | 3.41 | 3.85 | 4.47 |
| Cases | Possible Intervals of Non-Integral Eutrophication Feature Value Eutrophication Grade | Probability (%) | Eutrophication Status |
|---|---|---|---|
| Erhai Lake (S1) | [3.30, 3.50] | 2.87 | III |
| [3.50, 4.16] | 97.13 | IV | |
| Gaoshan Lake (S2) | [3.32, 3.50] | 1.37 | III |
| [3.50, 4.45] | 98.63 | IV | |
| Bosten Lake (S3) | [3.85, 4.50] | 92.05 | IV |
| [4.50, 4.85] | 7.95 | V | |
| Dianshan Lake (S4) | [3.90, 4.50] | 53.49 | IV |
| [4.50, 4.99] | 46.51 | V | |
| Yuqiao reservoir (S5) | [3.56, 4.50] | 41.82 | IV |
| [4.50, 5.19] | 58.18 | V | |
| Gucheng Lake (S6) | [4.07, 4.50] | 1.09 | IV |
| [4.50. 5.19] | 98.91 | V | |
| Nansi Lake (S7) | [4.32, 4.50] | 0.14 | IV |
| [4.50, 5.37] | 99.86 | V | |
| Ci Lake (S8) | [4.56, 5.44] | 100 | V |
| Dali Lake (S9) | [4.56, 5.50] | 99.63 | V |
| [5.50, 5.61] | 0.37 | VI | |
| Chao Lake (S10) | [4.81, 5.50] | 99.66 | V |
| [5.50, 5.56] | 0.34 | VI | |
| Dianchi Lake (Outer sea) (S11) | [4.87, 5.50] | 99.26 | V |
| [5.50, 5.68] | 0.74 | VI | |
| Dianchi Lake (Cao Sea) (S12) | [5.60, 5.91] | 100 | VI |
| West Lake (S13) | [4.82, 5.50] | 85.66 | V |
| [5.50, 5.82] | 14.34 | VI | |
| Gantang Lake (S14) | [4.93, 5.50] | 54.03 | V |
| [5.50, 5.83] | 45.97 | VI | |
| Mogu Lake (S15) | [4.96, 5.50] | 69.41 | V |
| [5.50, 5.83] | 30.59 | VI | |
| Li Lake (S16) | [5.21, 5.50] | 3.50 | V |
| [5.50, 5.87] | 96.50 | VI | |
| Dongshan Lake (S17) | [5.37, 5.50] | 0.19 | V |
| [5.50, 5.90] | 99.81 | VI | |
| Moshui Lake (S18) | [5.28, 5.50] | 0.59 | V |
| [5.50, 5.90] | 99.41 | VI | |
| Liwan Lake (S19) | [5.34, 5.50] | 0.29 | V |
| [5.50, 5.89] | 99.71 | VI | |
| Liuhua Lake (S20) | [5.69, 5.91] | 100 | VI |
| Xuanwu Lake (S21) | [5.40, 5.50] | 0.04 | V |
| [5.50, 5.91] | 99.61 | VI | |
| Jingpo Lake (S22) | [4.39, 4.50] | 0.04 | IV |
| [4.50, 5.50] | 99.94 | V | |
| [5.50, 5.53] | 0.02 | VI | |
| Nan Lake (S23) | [5.16, 5.50] | 4.13 | V |
| [5.50, 5.90] | 95.87 | VI | |
| Qionghai Lake (S24) | [3.41, 3.50] | 1.31 | III |
| [3.50, 4.47] | 98.69 | IV |
| Cases | Comprehensive Eutrophication Values | Final Eutrophication Grades |
|---|---|---|
| Erhai Lake (S1) | 3.971 | IV |
| Gaoshan Lake (S2) | 3.986 | IV |
| Bosten Lake (S3) | 4.080 | IV |
| Dianshan Lake (S4) | 4.465 | IV |
| Yuqiao reservoir (S5) | 4.582 | V |
| Gucheng Lake (S6) | 4.989 | V |
| Nansi Lake (S7) | 4.999 | V |
| Ci Lake (S8) | 5.000 | V |
| Dali Lake (S9) | 5.004 | V |
| Chao Lake (S10) | 5.003 | V |
| Dianchi Lake(Outer sea) (S11) | 5.007 | V |
| Dianchi Lake (Cao Sea) (S12) | 6.000 | VI |
| West Lake (S13) | 5.143 | V |
| Gantang Lake (S14) | 5.460 | V |
| Mogu Lake (S15) | 5.306 | V |
| Li Lake (S16) | 5.965 | VI |
| Dongshan Lake (S17) | 5.998 | VI |
| Moshui Lake (S18) | 5.994 | VI |
| Liwan Lake (S19) | 5.997 | VI |
| Liuhua Lake (S20) | 6.000 | VI |
| Xuanwu Lake (S21) | 5.979 | VI |
| Jingpo Lake (S22) | 5.000 | V |
| Nan Lake (S23) | 5.959 | VI |
| Qionghai Lake (S24) | 3.987 | IV |
| Cases | Hybrid Method | Trophic Level Index (TLI) [24] | Back Propagation Neutral Network [25] | Projection Pursuit Method [26] |
|---|---|---|---|---|
| Erhai Lake (S1) | IV | III | III | III |
| Gaozhou Reservoir (S2) | IV | III | III | III |
| Bosten Lake (S3) | IV | IV | IV | V |
| Dianshan Lake (S4) | IV | IV | IV | IV |
| Yuqiao reservoir (S5) | V | IV | IV | V |
| Gucheng Lake (S6) | V | V | V | V |
| Nansi Lake (S7) | V | V | V | V |
| Ci Lake (S8) | V | V | V | V |
| Dali Lake (S9) | V | V | V | V |
| Chao Lake (S10) | V | V | V | V |
| Dianchi Lake(Outer sea) (S11) | V | V | V | V |
| Dianchi Lake (Cao Sea) (S12) | VI | VI | VI | VI |
| West Lake (S13) | V | V | V | V |
| Gantang Lake (S14) | V | V | V | V |
| Mogu Lake (S15) | V | V | V | VI |
| Li Lake (S16) | VI | VI | VI | VI |
| Dongshan Lake (S17) | VI | VI | VI | VI |
| Moshui Lake (S18) | VI | VI | VI | VI |
| Liwan Lake (S19) | VI | VI | VI | VI |
| Liuhua Lake (S20) | VI | VI | VI | VI |
| Xuanwu Lake (S21) | VI | VI | VI | VI |
| Jingpo Lake (S22) | V | V | V | V |
| Nan Lake (S23) | VI | VI | VI | VI |
| Qionghai Lake (S24) | IV | III | VI | IV |
© 2019 by the authors. Licensee MDPI, Basel, Switzerland. This article is an open access article distributed under the terms and conditions of the Creative Commons Attribution (CC BY) license (http://creativecommons.org/licenses/by/4.0/).
Share and Cite
Wang, Y.; Ran, W. Comprehensive Eutrophication Assessment Based on Fuzzy Matter Element Model and Monte Carlo-Triangular Fuzzy Numbers Approach. Int. J. Environ. Res. Public Health 2019, 16, 1769. https://doi.org/10.3390/ijerph16101769
Wang Y, Ran W. Comprehensive Eutrophication Assessment Based on Fuzzy Matter Element Model and Monte Carlo-Triangular Fuzzy Numbers Approach. International Journal of Environmental Research and Public Health. 2019; 16(10):1769. https://doi.org/10.3390/ijerph16101769
Chicago/Turabian StyleWang, Yumin, and Weijian Ran. 2019. "Comprehensive Eutrophication Assessment Based on Fuzzy Matter Element Model and Monte Carlo-Triangular Fuzzy Numbers Approach" International Journal of Environmental Research and Public Health 16, no. 10: 1769. https://doi.org/10.3390/ijerph16101769
APA StyleWang, Y., & Ran, W. (2019). Comprehensive Eutrophication Assessment Based on Fuzzy Matter Element Model and Monte Carlo-Triangular Fuzzy Numbers Approach. International Journal of Environmental Research and Public Health, 16(10), 1769. https://doi.org/10.3390/ijerph16101769