Justice in Dementia Care Resource Allocation: How Should We Plan for Dementia Services?


Abstract
1. Introduction
2. Materials and Methods
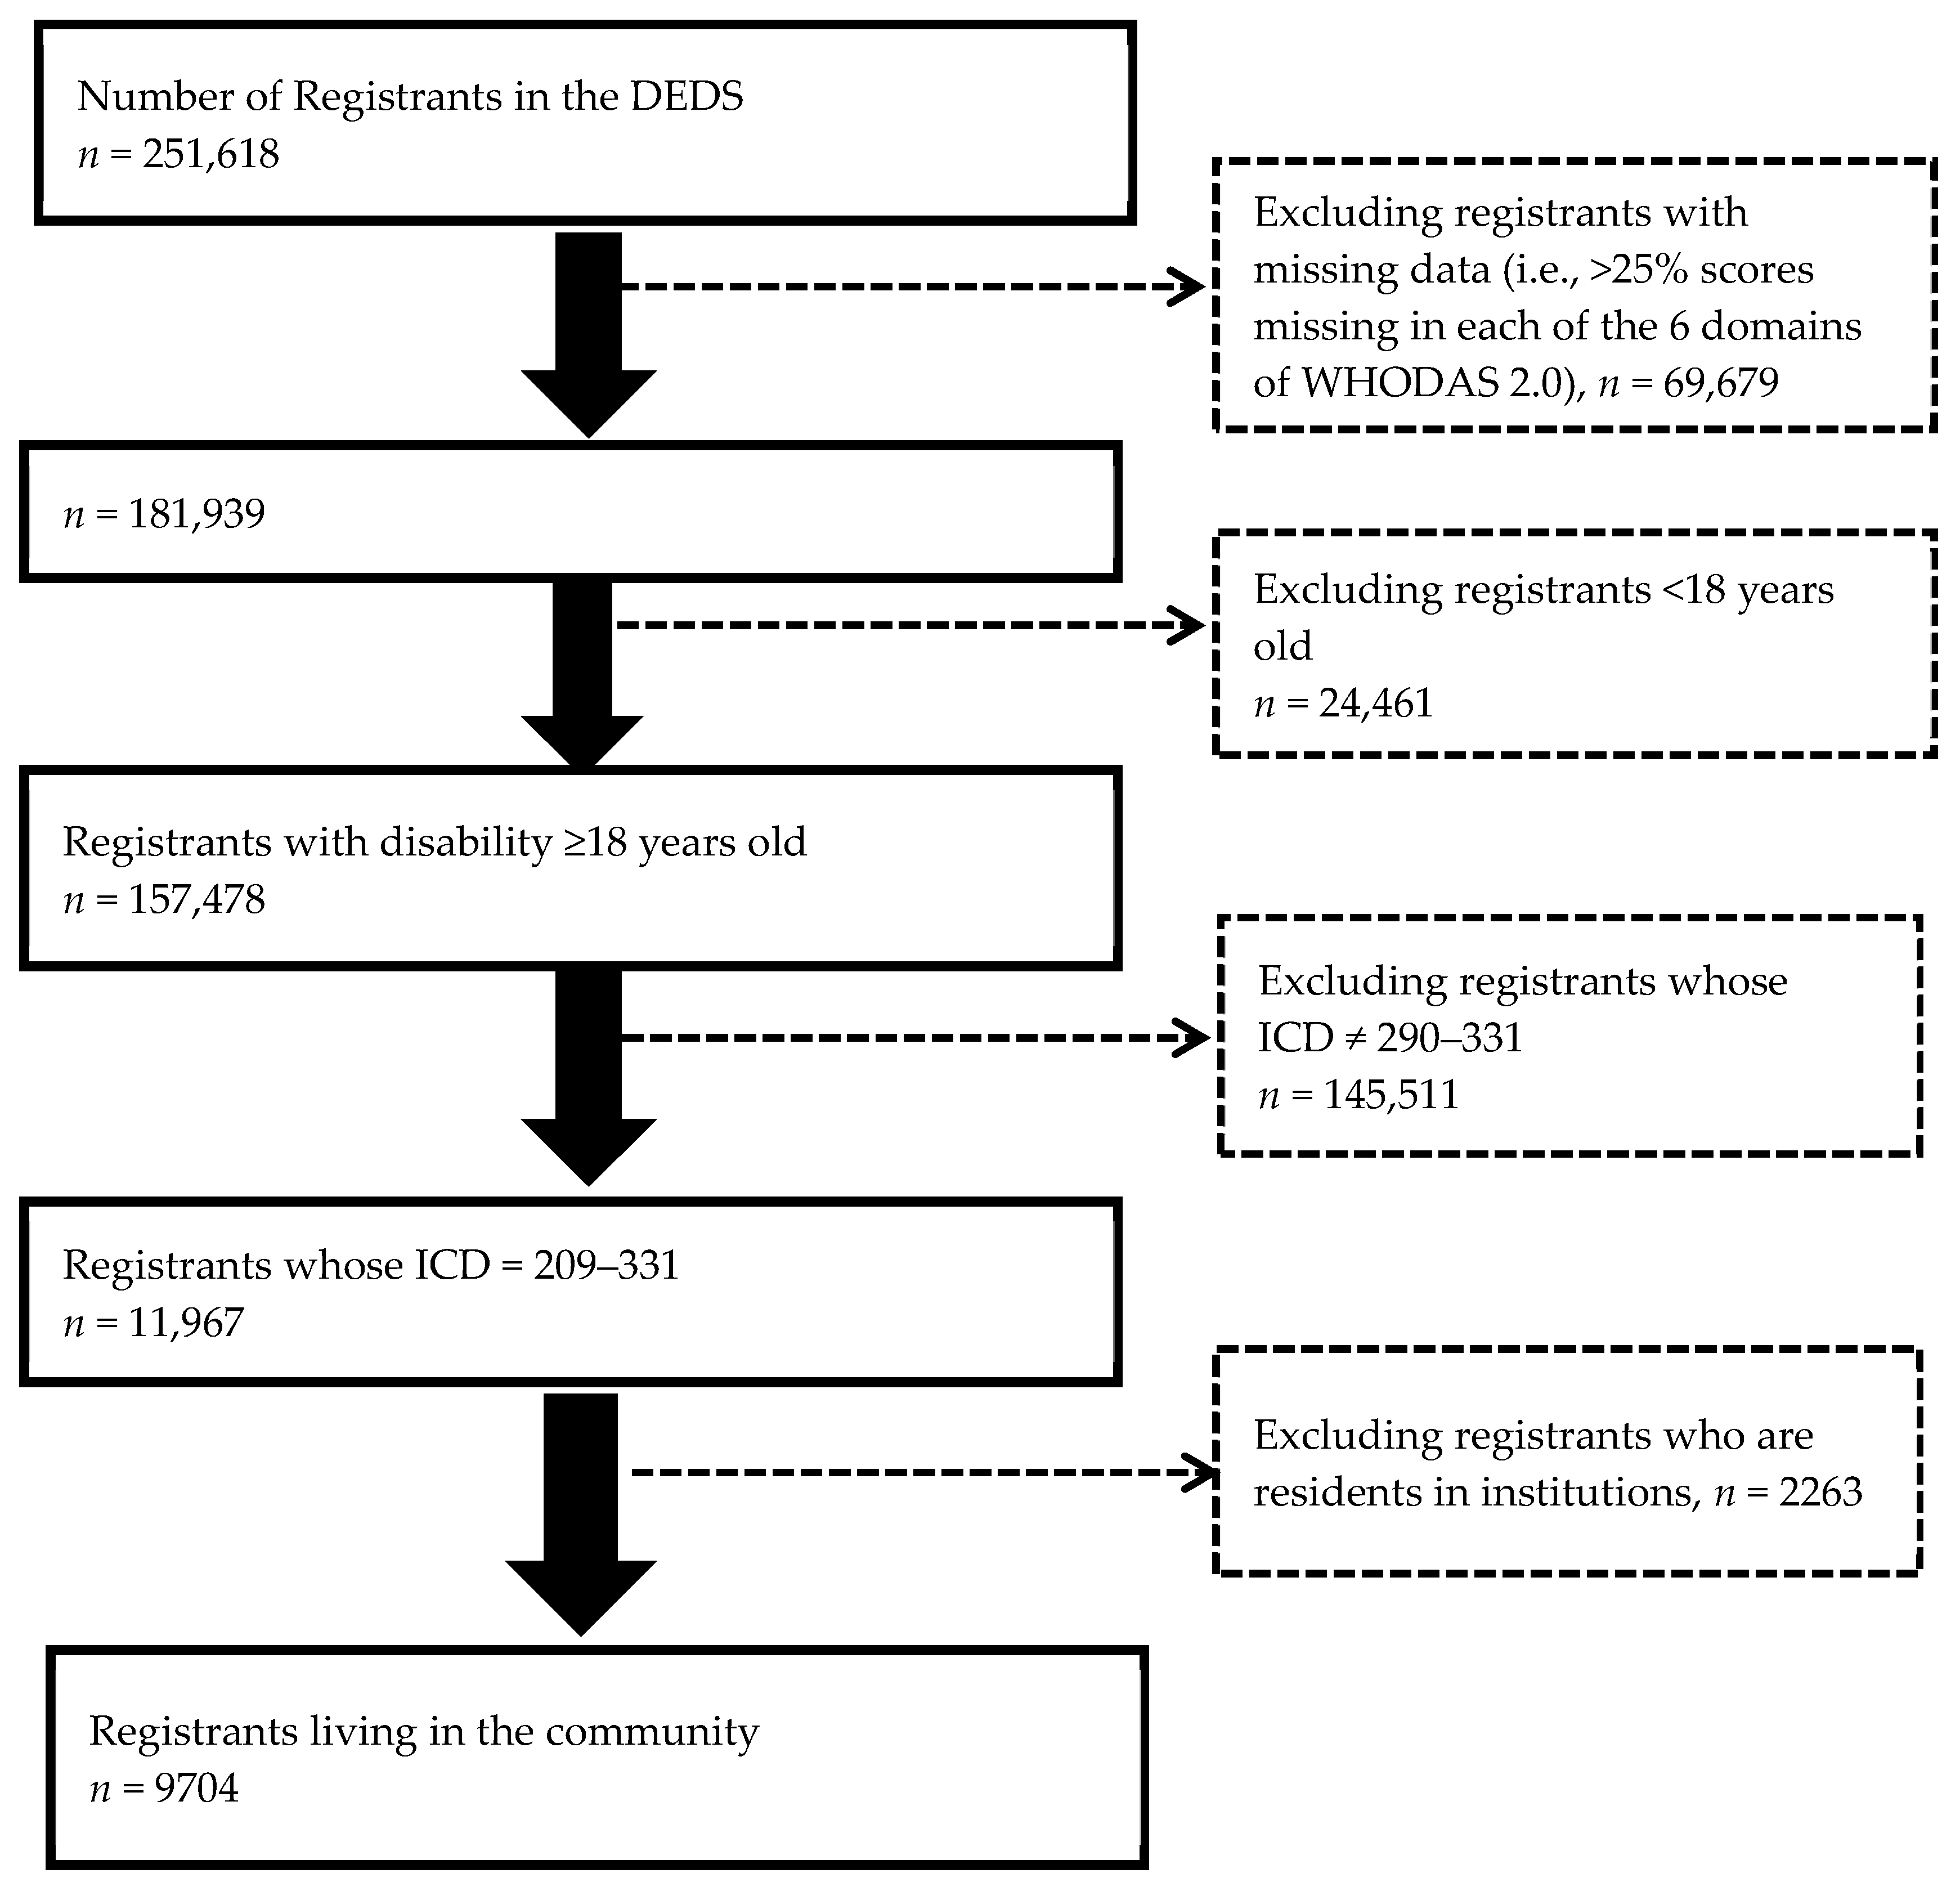
2.1. Participants
2.2. Materials
Definitions of General and High Level of Need for Dementia Care Services Based on the WHODAS 2.0-36-item
2.3. Data Analysis
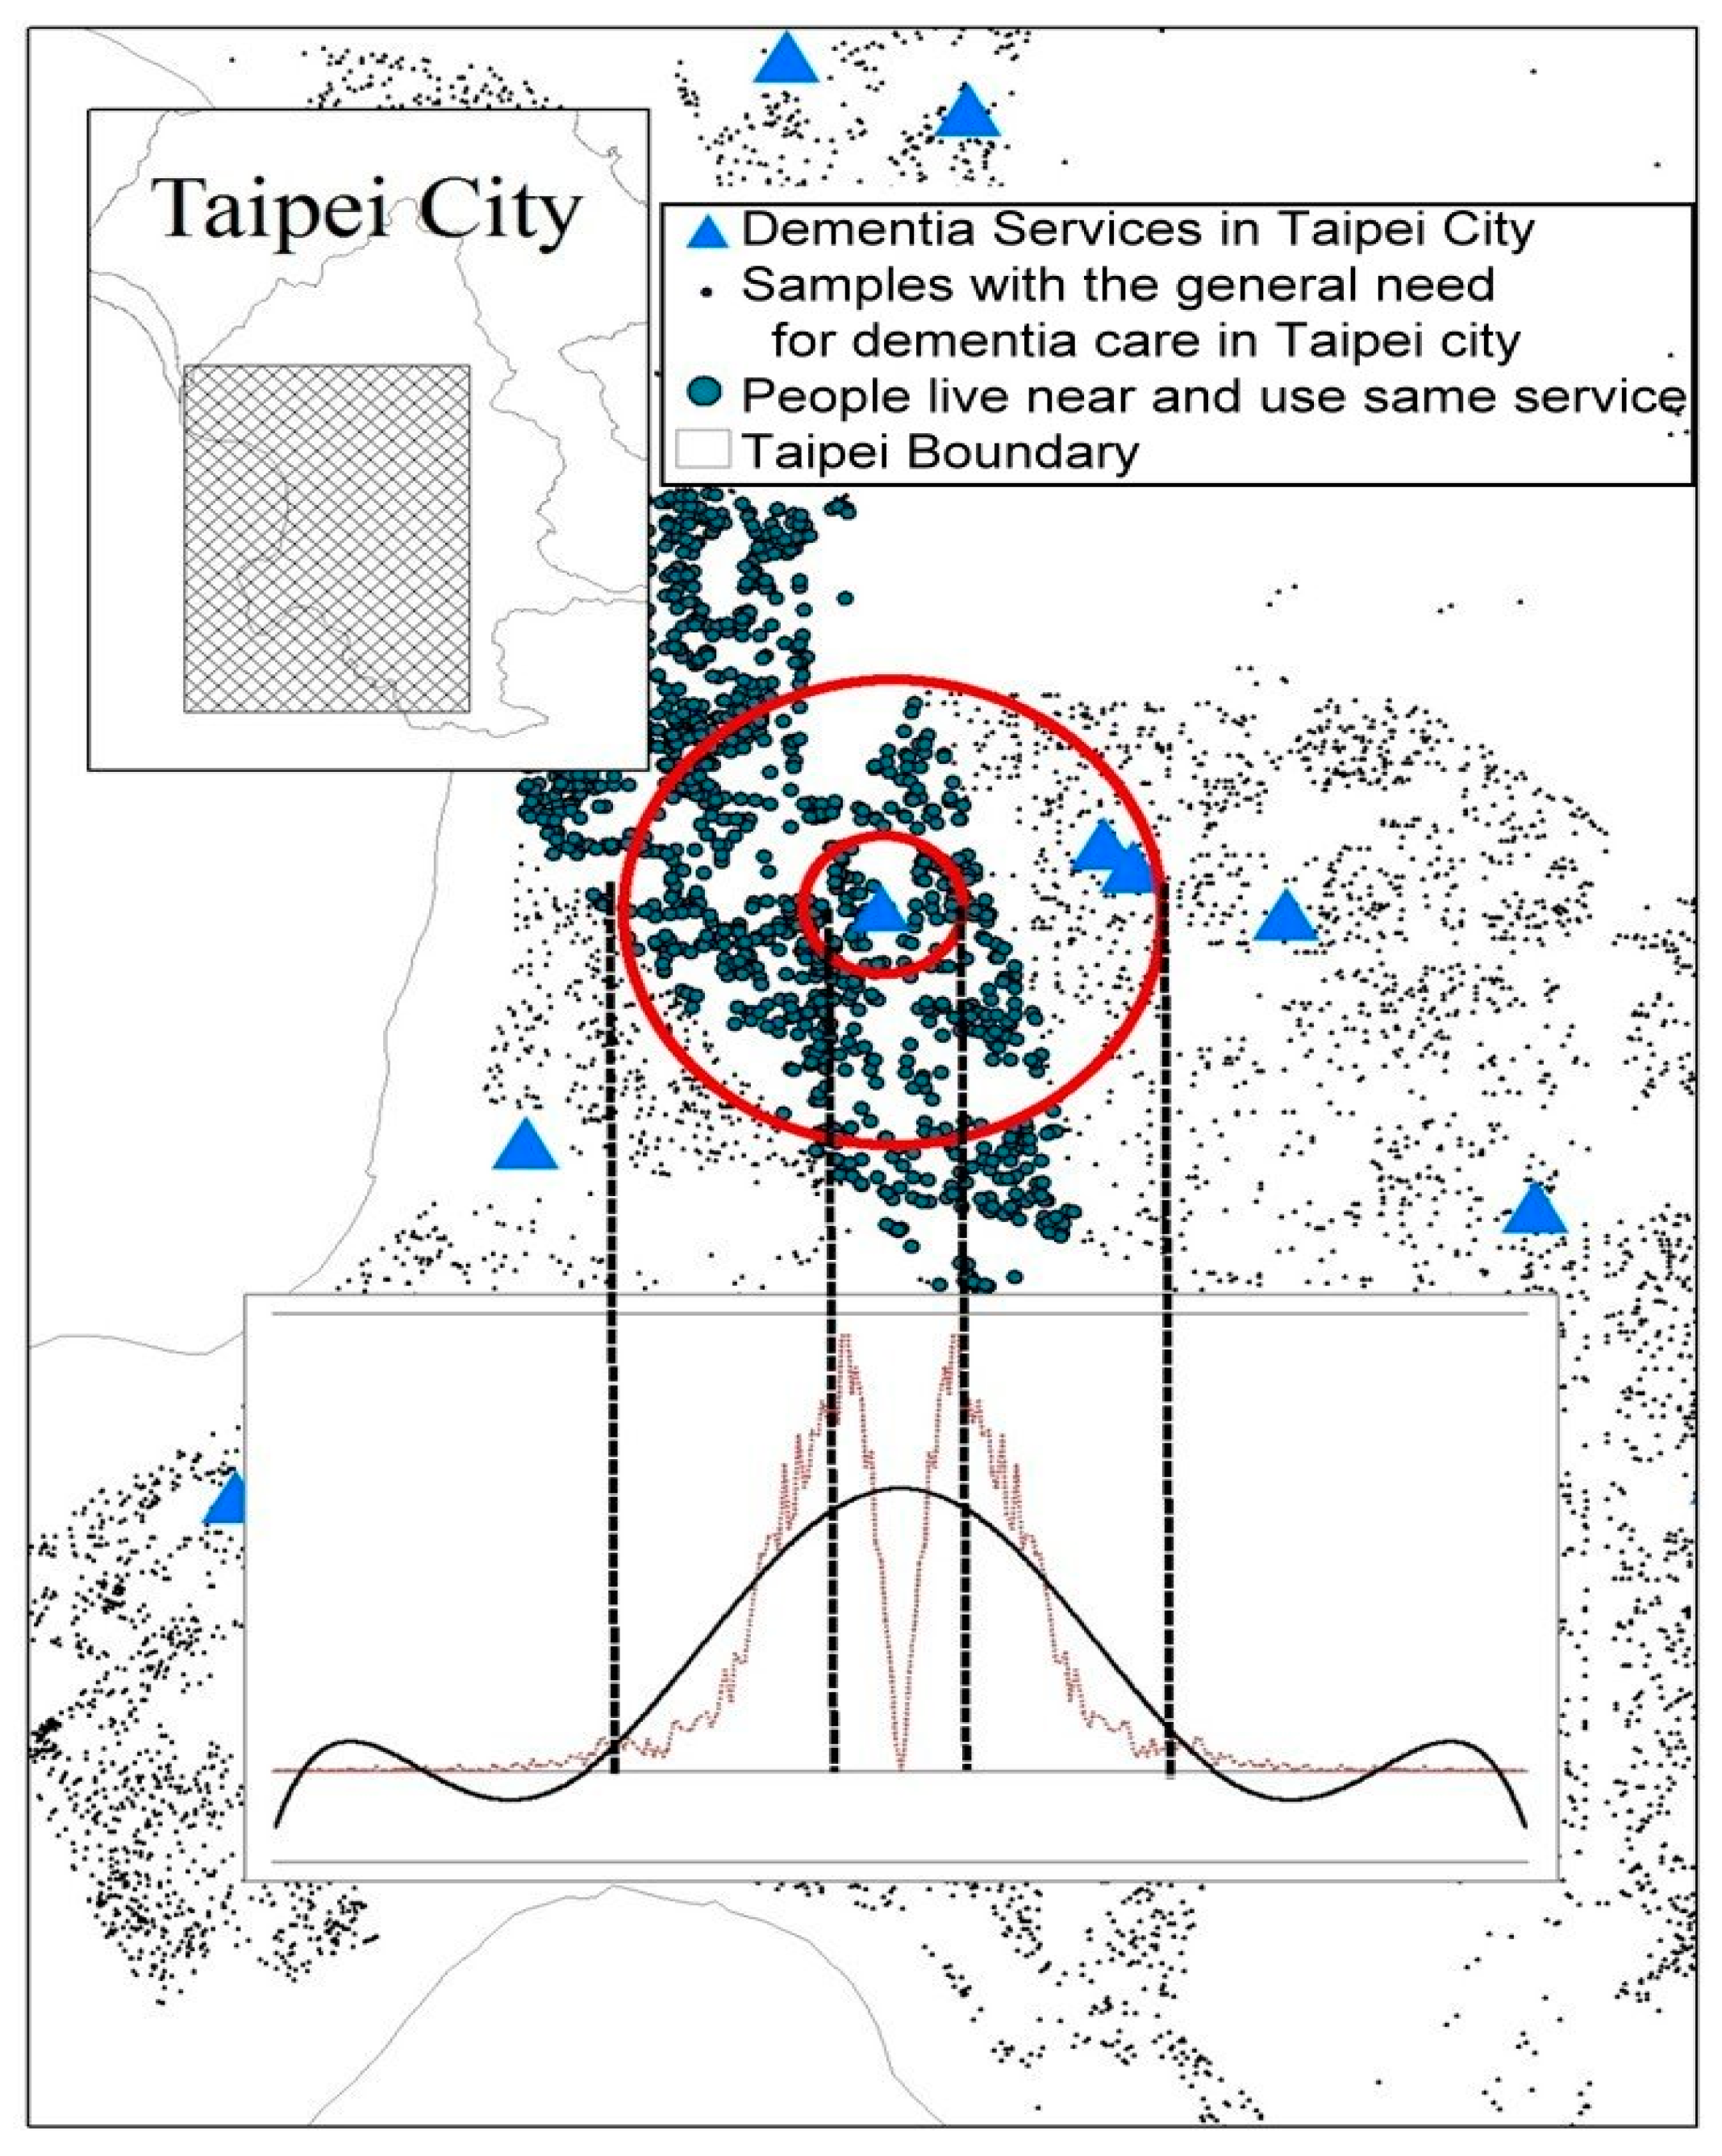
2.3.1. Spatial Analysis
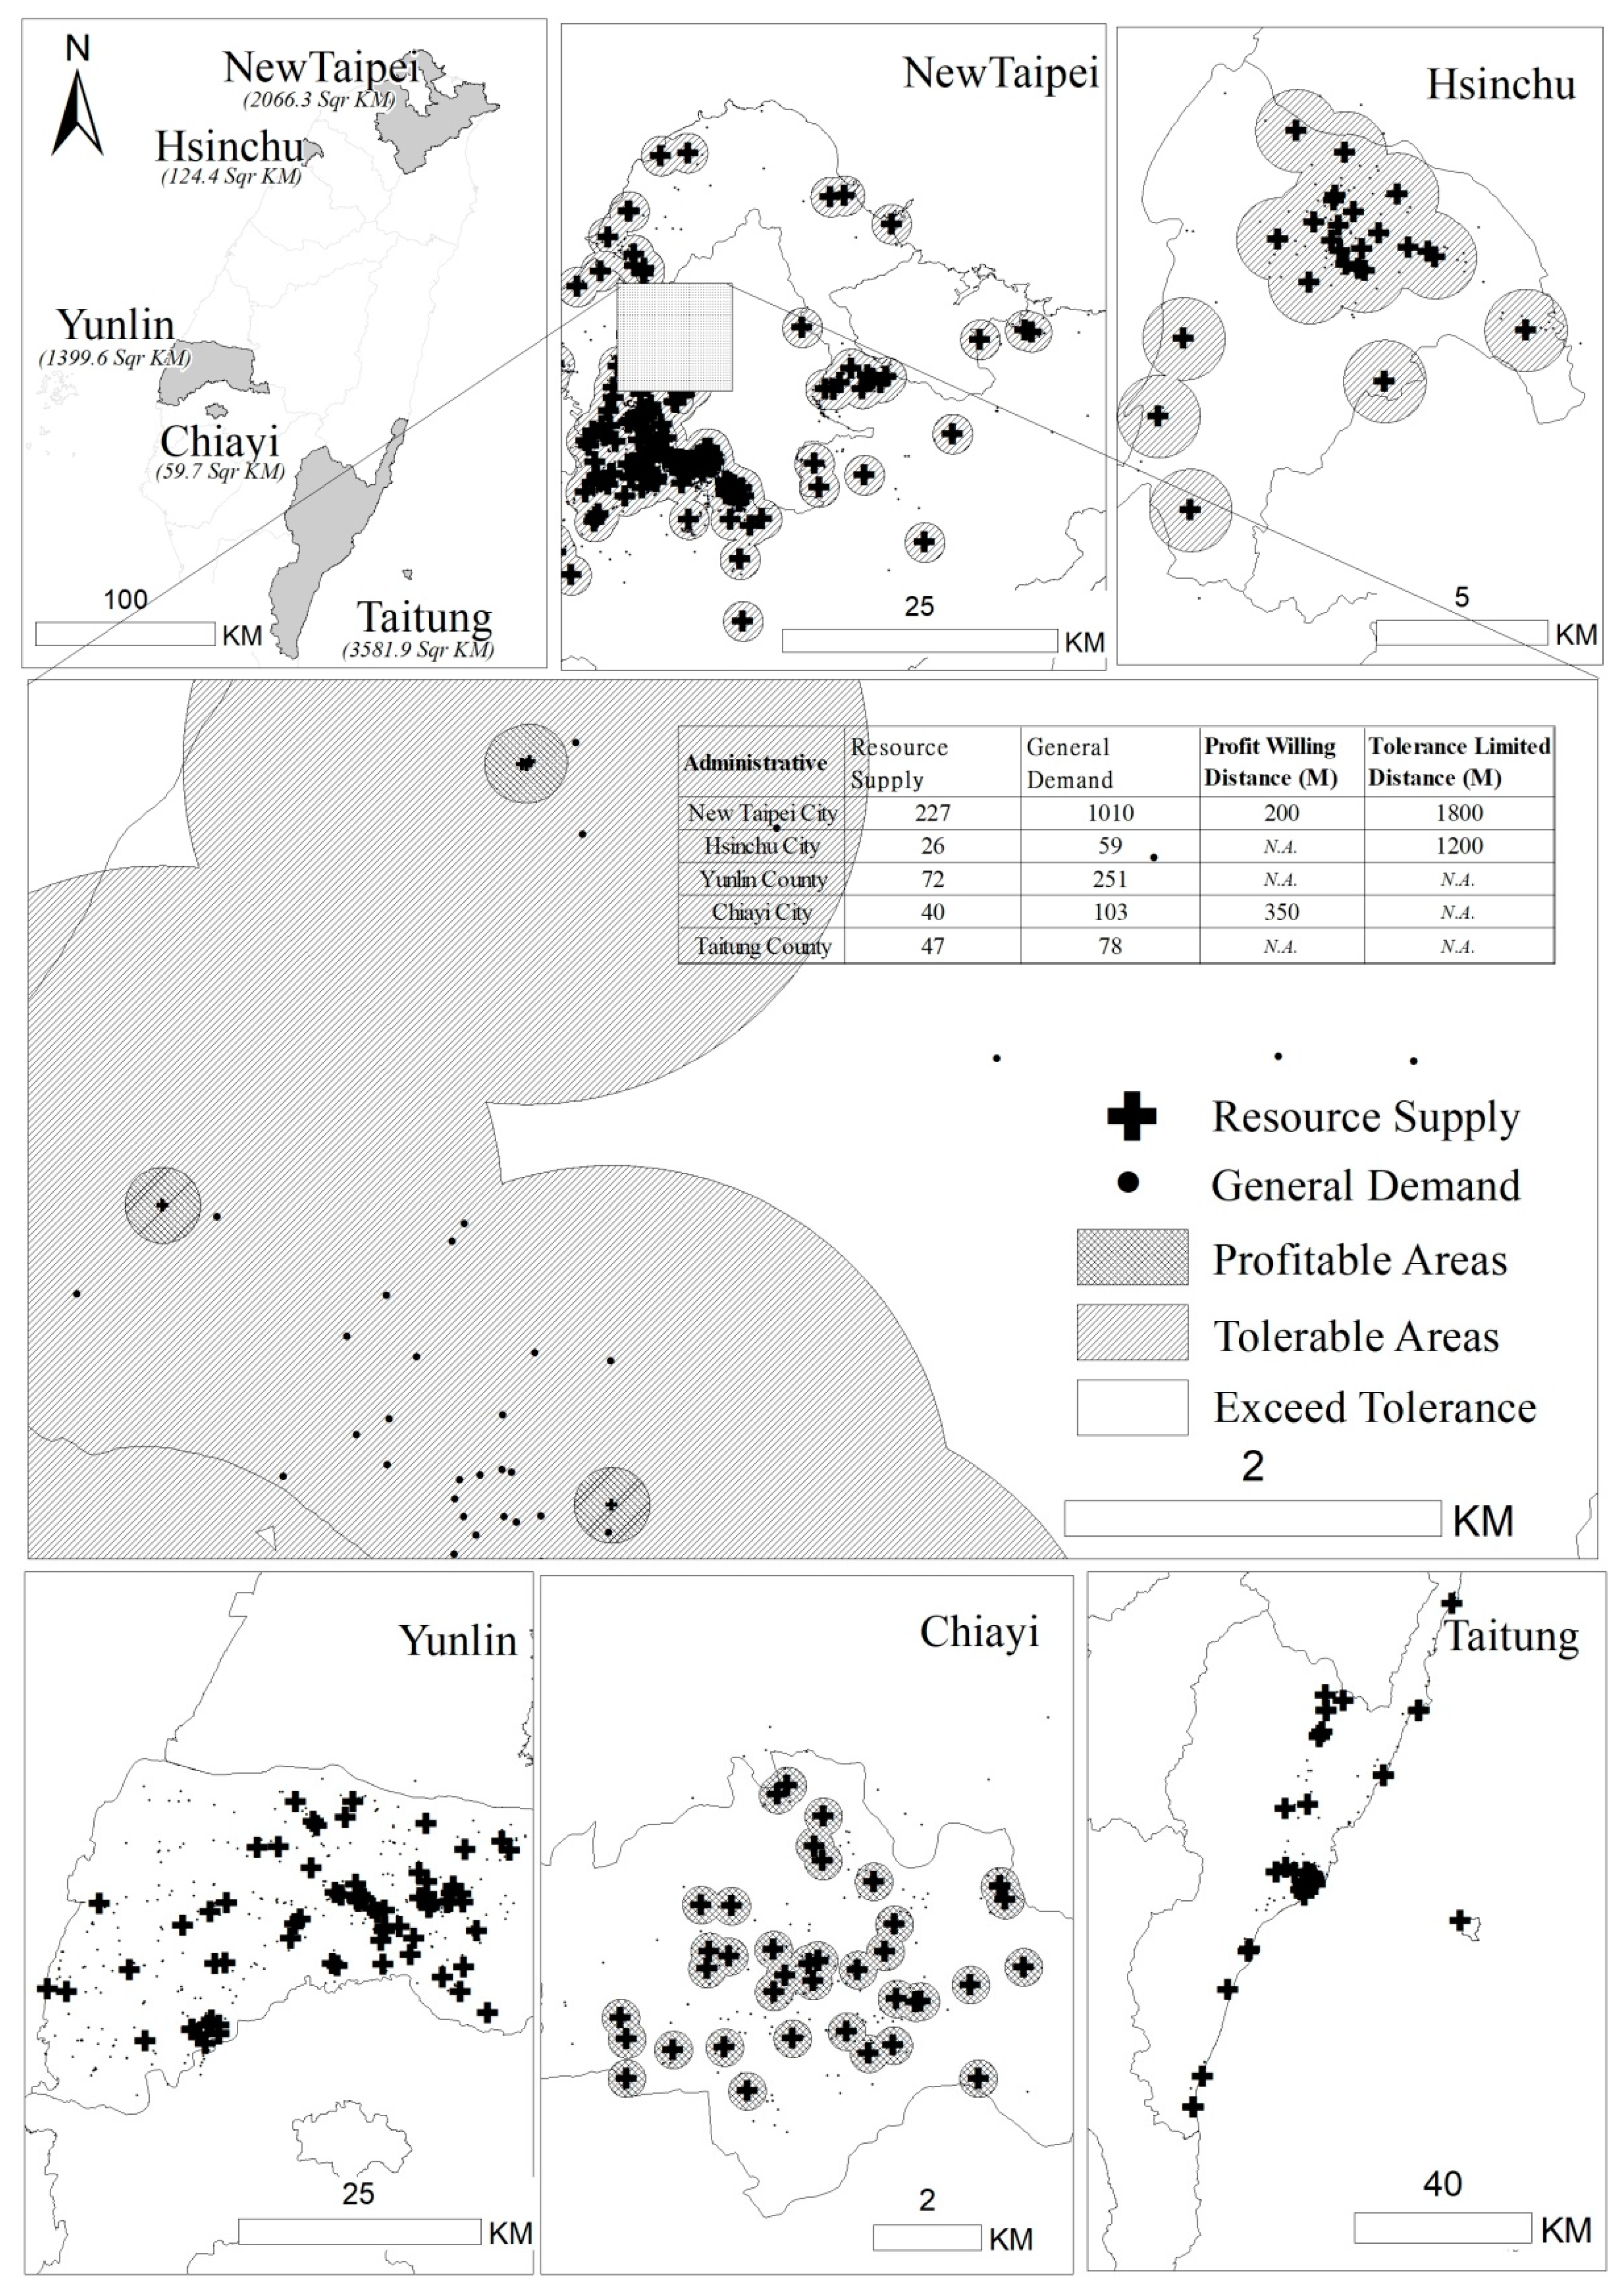
2.3.2. PWD and TLD Measurements: Indices of Accessibility of Services
3. Results
3.1. Characteristics of Service Users and Providers
3.2. Service Availability/Accessibility and Burden of Distance
4. Discussion
4.1. PWD & TLD vs. 2SFCA & E2SFCA
4.2. Policy Priorities When Setting up Dementia Services
5. Conclusions
Author Contributions
Funding
Acknowledgments
Conflicts of Interest
Appendix A

| Variables | Cutoff Point | Sensitivity | Specificity | AUC | 95% Cl | p-Value | |
|---|---|---|---|---|---|---|---|
| Domain 1 | 77.50 | 0.657 | 0.584 | 0.659 | 0.649 | 0.668 | <0.001 * |
| Domain 2 | 78.00 | 0.599 | 0.721 | 0.712 | 0.704 | 0.721 | <0.001 * |
| Domain 3 | 55.00 | 0.546 | 0.714 | 0.659 | 0.649 | 0.668 | <0.001 * |
| Domain 4 | 96.00 | 0.519 | 0.730 | 0.652 | 0.643 | 0.661 | <0.001 * |
| Domain 5 | 95.00 | 0.754 | 0.477 | 0.623 | 0.614 | 0.632 | <0.001 * |
| Domain 6 | 60.50 | 0.521 | 0.703 | 0.647 | 0.638 | 0.657 | <0.001 * |
| Total | 66.50 | 0.669 | 0.630 | 0.704 | 0.695 | 0.713 | <0.001 * |
References
- Patterson, C. The World Alzheimer Report 2018: The State of the Art of Dementia Research: New frontiers. Available online: https://www.alz.co.uk/research/WorldAlzheimerReport2018.pdf?2 (accessed on 17 April 2019).
- Prince, M.; Comas-Herrera, A.; Knapp, M.; Guerchet, M.; Karagiannidou, M. The World Alzheimer Report 2016: Improving Healthcare for People Living with Dementia: Coverage, Quality and Costs Now and in the Future. Available online: https://www.alz.co.uk/research/world-report-2016 (accessed on 17 April 2019).
- Ministry of Health and Welfare (MOHW). The Disabled Population by Locality and Age to the End of 2017. Created on 5 May 2017. Last updated on 31 March 2018. Available online: https://dep.mohw.gov.tw/DOS/cp-2976-13826-113.html (accessed on 17 April 2019). (In Chinese)
- Chen, Y.; Yin, Z.; Xie, Q. Suggestions to ameliorate the inequity in urban/rural allocation of healthcare resources in China. Int. J. Equity Health 2014, 13, 34. Available online: https://search.proquest.com/docview/1523074643?accountid=8088 (accessed on 17 April 2019). [CrossRef]
- Gillon, R. Justice and allocation of medical resources. Br. Med. J. 1985, 291, 266–268. Available online: https://www.ncbi.nlm.nih.gov/pmc/articles/PMC1416877/pdf/bmjcred00458-0038.pdf (accessed on 17 April 2019). [CrossRef] [PubMed][Green Version]
- Rawls, J. A Theory of Justice, revised ed.; Harvard University Press: Cambridge, MA, USA, 1971; pp. 47–98. Available online: http://www.consiglio.regione.campania.it/cms/CM_PORTALE_CRC/servlet/Docs?dir=docs_biblio&file=BiblioContenuto_3641.pdf (accessed on 17 April 2019).
- Campbell, R.J.; Ramirez, A.M.; Perez, K.; Roetzheim, R.G. Cervical cancer rates and the supply of primary care physicians in Florida. Fam. Med. 2003, 35, 60–64. Available online: https://fammedarchives.blob.core.windows.net/imagesandpdfs/fmhub/fm2003/jan03/hsr.pdf (accessed on 17 April 2019). [PubMed]
- Hong, W.H.; Gheng, S.H.; Chang, R.E.; Chiang, T.L. Changes in the Proportion of cross-region Admissions in Taiwan, 1985–1995. Taiwan J. Public Health 1998, 17, 388–394. [Google Scholar] [CrossRef]
- Hong, Y.C.; Lin, C.H. Exploring the Relationship between Medical Resources and Health Status: An Empirical Study of Crude and Accidental Death Rates in 23 Counties in Taiwan. Taiwan J. Public Health 2010, 29, 347–359. [Google Scholar] [CrossRef]
- Lee, C.C.; Lu, J.F. Health Equality and Equity in Health Care Utilization among Children in Taiwan. Taiwan J. Public Health 2013, 32, 449–462. [Google Scholar] [CrossRef]
- Lu, J.F.; Leung, G.M.; Kwon, S.; Tin, K.Y.K.; van Doorslaer, E.; O’Donnell, O. Horizontal equity in health care utilization—Evidence from three high-income Asian economies. Soc. Sci. Med. 2007, 64, 199–212. [Google Scholar] [CrossRef] [PubMed]
- Enders, A.; Brandt, Z. Using geographic information system technology to improve emergency management and disaster response for people with disabilities. J. Disabil. Policy Stud. 2007, 17, 223–232. Available online: http://citeseerx.ist.psu.edu/viewdoc/download?doi=10.1.1.497.4717&rep=rep1&type=pdf (accessed on 17 April 2019). [CrossRef]
- Chang, Y.C.; Wen, T.H.; Lai, M.S. Using geographic information systems (GIS) to identify the association between geographic accessibility and hospital-seeking behavior by hepatocellular carcinoma patients in Taiwan. Taiwan J. Public Health 2009, 28, 517–529. Available online: http://homepage.ntu.edu.tw/~wenthung/paper/2009_GIS.Accessibility_Healthcare.pdf (accessed on 17 April 2019).
- Blanfore, J.I.; Kumar, S.; Luo, W.; MacEachren, A.M. It’s a long, long walk: Accessibility to hospitals, maternity and integrated health centers in Niger. Int. J. Health Geogr. 2012, 1, 24–39. [Google Scholar] [CrossRef]
- Matsumoto, M.; Ogawa, T.; Kashima, S.; Takeuchi, K. The impact of rural hospital closures on equity of commuting time for haemodialysis patients: Simulation analysis using the capacity-distance model. Int. J. Health Geogr. 2012, 11, 28–38. [Google Scholar] [CrossRef] [PubMed]
- Panciera, R.; Khan, A.; Rizvi, S.J.R.; Ahmed, S.; Ahmed, T.; Islam, R.; Adams, A.M. The influence of travel time on emergency obstetric care seeking behavior in the urban poor of Bangladesh: A GIS study. BMC Pregnancy Childbirth 2016, 16, 240. [Google Scholar] [CrossRef]
- Philip, D.S.; Betty, H.; van Ineveld, C.H.M.; Marcia, F. Rural–urban differences in health status of elderly Manitobans. Can. J. Rural Med. 2002, 7, 89–93. Available online: https://search.proquest.com/docview/217560254/fulltextPDF/A54B98595A8F4C25PQ/1?accountid=8088 (accessed on 17 April 2019).
- Syu, B.R. Spatial Structure Analysis of primary health services in Eastern Taiwan. Geogr. Inform. Syst. 2013, 7, 27–29. [Google Scholar] [CrossRef]
- Lin, S.W.; Yen, C.F.; Chiu, T.Y.; Chi, W.C.; Liou, T.H. New indices for home nursing care resource disparities in rural and urban areas, based on geocoding and geographic distance barriers: A cross-sectional study. Int. J. Health Geogr. 2015, 14, 28–38. [Google Scholar] [CrossRef]
- Liao, H.C. Exploring the Definition of Primary Healthcare Shortage Areas in Taiwan: Integrating Spatial and Nonspatial Factors. Publ. Adm. Pol. 2013, 44, 1–39. Available online: http://www.airitilibrary.com/Publication/alDetailedMesh?docid=17286425-201406-201407310008-201407310008-121-152 (accessed on 17 April 2019).
- Ursulica, T.E. The relationship between health care needs and accessibility to health care services in Botosani county-Romania. Procedia Environ. Sci. 2016, 32, 300–310. [Google Scholar] [CrossRef]
- Chiu, T.Y.; Yen, C.F.; Chou, C.H.; Lin, J.D.; Hwang, A.W.; Liao, H.F.; Chi, W.C. Development of traditional Chinese version of World Health Organization Disability Assessment Schedule 2.0 36-item (WHODAS 2.0) in Taiwan: Validity and reliability analyses. Res. Dev. Disabil. 2014, 35, 2812–2820. [Google Scholar] [CrossRef]
- Yen, C.F.; Hwang, A.W.; Liou, T.H.; Chiu, T.Y.; Hsu, H.Y.; Chi, W.C.; Wu, T.F.; Chang, B.S.; Lu, S.J.; Liao, H.F. Validity and reliability of the Functioning Disability Evaluation Scale-Adult Version based on the WHODAS 2.0-36 items. J. Formos. Med. Assoc. 2014, 113, 839–849. [Google Scholar] [CrossRef]
- Ministry of Health and Welfare (MOHW). The Map of Dementia Care Service. Available online: https://www.dementiaservicemap.com.tw/ (accessed on 2 April 2019). (In Chinese)
- Üstün, T.B.; Kostanjsek, N.; Chatterji, S.; Rehm, J. Measuring Health and Disability: Manual for WHO Disability Assessment Schedule WHODAS 2.0; World Health Organization: Geneva, Switzerland, 2010. [Google Scholar]
- Huang, S.W.; Chang, K.H.; Escorpizo, R.; Hu, C.J.; Chi, W.C.; Yen, C.F.; Liao, H.F.; Chiu, W.T.; Liou, T.H. Using the World Health Organization Disability Assessment Schedule 2.0 (WHODAS 2.0) for Predicting Institutionalization of Patients with Dementia in Taiwan. Medicine 2015, 94, 47. [Google Scholar] [CrossRef]
- Wang, F.; Luo, W. Assessing spatial and nonspatial factors for healthcare access: Towards an integrated approach to defining health professional shortage areas. Health Place 2005, 11, 131–146. [Google Scholar] [CrossRef]
- McGrail, M.R.; Humphreys, J.S. Measuring spatial accessibility to primary care in rural areas: Improving the effectiveness of the two-step floating catchment area method. Appl. Geogr. 2009, 29, 533–541. [Google Scholar] [CrossRef]
- Luo, W.; Qi, Y. An enhanced two-step floating catchment area (E2SFCA) method for measuring spatial accessibility to primary care physicians. Health Place 2009, 15, 1100–1107. [Google Scholar] [CrossRef]
- Kilinc, M.S.; Milburn, A.B.; Stamm, J.L.H. Measuring potential spatial accessibility of home healthcare services. Socio-Econ. Plan. Sci 2016. [Google Scholar] [CrossRef]
- Shoval, N.; Wahl, H.W.; Auslander, G.; Isaacson, M.; Oswald, F.; Edry, T.; Landau, R.; Heinik, J. Use of the global positioning system to measure the out-of-home mobility of older adults with differing cognitive functioning. Ageing Soc. 2011, 31, 849–869. [Google Scholar] [CrossRef]
- Towne, S.D.; Smith, M.L.; Ory, M.G. Geographic variations in access and utilization of cancer screening services: Examining disparities among American Indian and Alaska Native Elders. Int. J. Health Geogr. 2014, 13, 18–29. [Google Scholar] [CrossRef]


| Variables | Dementia Cases Living in the Community | Dementia Cases with General Demand a | Dementia Cases with High Level of Need b | p-Value ab | |
|---|---|---|---|---|---|
| n = 9704 | n = 6593 | n = 3111 | |||
| n (%) | n (%) | n (%) | |||
| Age (mean ± SD) | 78.22 ± 9.78 | 76.98 ± 9.93 | 82.10 ± 8.48 | <0.001 | |
| 21–30 | 5 (0.1) | 5 (0.1) | 0 | <0.001 | |
| 31–-40 | 30 (0.3) | 26 (0.4) | 4 (0.1) | ||
| 41–50 | 117 (1.2) | 102 (1.5) | 15 (0.5) | ||
| 51–60 | 403 (4.2) | 349 (5.3) | 54 (1.7) | ||
| 61–70 | 1181 (12.2) | 967 (14.7) | 214 (6.9) | ||
| 71–80 | 3432 (35.4) | 2553 (38.7) | 879 (28.3) | ||
| 81–90 | 3975 (41.0) | 2374 (36) | 1601 (51.5) | ||
| 91–100 | 553 (5.7) | 215 (3.3) | 338 (10.9) | ||
| 101–110 | 8 (0.1) | 2 (0.03) | 6 (0.2) | ||
| Gender | Male | 3590 (37) | 2456 (37.3) | 1134 (36.5) | 0.446 |
| Female | 6114 (63) | 4137 (62.7) | 1977 (63.5) | ||
| Severity of Disability | Mild | 2729 (28.1) | 2526 (38.3) | 203 (6.5) | <0.001 |
| Moderate | 3615 (37.3) | 2686 (40.7) | 929 (29.9) | ||
| Severe | 734 (7.6) | 432 (6.6) | 302 (9.7) | ||
| Extremely serious | 2626 (27.1) | 949 (14.4) | 2626(53.9) | ||
| Score | Dementia Cases Living in the Community | Median | Dementia Cases with General Demand a | Median | Dementia Cases with High Level of Need b | Median | p-Value ab |
|---|---|---|---|---|---|---|---|
| n = 9704 | n = 6593 | n = 3111 | |||||
| (mean ± SD) | (mean ± SD) | (mean ± SD) | |||||
| Summary score | 65.74 ± 23.33 | 68.87 | 54.56 ± 19.60 | 56.52 | 89.43 ± 7.58 | 90.22 | <0.001 |
| D1 Cognition | 72.13 ± 25.65 | 80.00 | 61.17 ± 23.89 | 60.00 | 95.35 ± 7.02 | 100 | <0.001 |
| D2 Mobility | 60.61 ± 35.42 | 62.50 | 44.64 ± 31.62 | 43.75 | 94.45 ± 10.41 | 100 | <0.001 |
| D3 Self-care | 57.70 ± 35.42 | 60.00 | 40.05 ± 29.16 | 40.00 | 95.11 ± 7.15 | 100 | <0.001 |
| D4 Getting along | 70.47 ± 29.56 | 80.34 | 59.21 ± 28.86 | 58.33 | 94.35 ± 11.02 | 100 | <0.001 |
| D5 Life activities | 83.06 ± 26.90 | 100.00 | 75.37 ± 29.45 | 90.00 | 99.37 ± 5.28 | 100 | <0.001 |
| D6 Participation | 52.11 ± 25.74 | 50.0 | 43.33 ± 22.33 | 41.67 | 70.74 ± 22.36 | 75.00 | <0.001 |
| City or County | Area | Providers a | Dementia Cases Living in the Community b | Dementia Cases with General Demand | Dementia Cases with High Level of Need | Ratio of Dementia Cases to Providers (b/a) |
|---|---|---|---|---|---|---|
| km2 | n (%) | |||||
| Taipei City | 271.8 | 162 (9.1) | 1564 (16.1) | 996 (15.1) | 568 (18.3) | 9.65 |
| New Taipei City | 2052.6 | 227 (12.7) | 1554 (16.0) | 1010 (15.3) | 544 (17.5) | 6.85 |
| Keelung City | 132.8 | 38 (2.1) | 105 (1.1) | 81 (1.2) | 24 (0.8) | 2.76 |
| Taoyuan City | 1221.0 | 102 (5.7) | 622 (6.4) | 409 (6.2) | 213 (6.9) | 6.10 |
| Hsinchu County | 1427.5 | 48 (2.7) | 153 (1.6) | 84 (1.3) | 69 (2.2) | 3.19 |
| Hsinchu City | 104.2 | 26 (1.5) | 90 (0.9) | 59 (0.9) | 31 (1.0) | 3.46 |
| Miaoli County | 1820.3 | 41 (2.3) | 194 (2.0) | 122 (1.9) | 72 (2.3) | 4.73 |
| Taichung City | 2214.9 | 149 (8.4) | 868 (8.9) | 563 (8.5) | 305 (9.8) | 5.83 |
| Changhua County | 1074.4 | 90 (5.1) | 416 (4.3) | 292 (4.4) | 124 (4.0) | 4.62 |
| Nantou County | 4106.4 | 42 (2.4) | 232 (2.4) | 178 (2.7) | 54 (1.7) | 5.52 |
| Yunlin County | 1290.8 | 72 (4.0) | 388 (4.0) | 251 (3.8) | 137 (4.4) | 5.39 |
| Chiayi County | 1903.6 | 54 (3.0) | 358 (3.7) | 261 (4.0) | 97 (3.1) | 6.63 |
| Chiayi City | 60.0 | 40 (2.2) | 152 (1.6) | 103 (1.6) | 49 (1.6) | 3.80 |
| Tainan City | 2191.7 | 169 (9.5) | 965 (9.9) | 719 (10.9) | 246 (7.9) | 5.71 |
| Kaohsiung City | 2951.9 | 237 (13.3) | 1005 (10.4) | 737 (11.2) | 268 (8.6) | 4.24 |
| Pingtung County | 2775.6 | 98 (5.5) | 394 (4.1) | 279 (4.2) | 115 (3.7) | 4.02 |
| Yilan County | 2143.6 | 72 (4.0) | 263 (2.7) | 197 (3.0) | 66 (2.1) | 3.65 |
| Hualien County | 4628.6 | 40 (2.2) | 181 (1.9) | 126 (1.9) | 55 (1.8) | 4.53 |
| Taitung County | 3515.3 | 47 (2.6) | 123 (1.3) | 78 (1.2) | 45 (1.5) | 2.62 |
| Penghu County | 126.9 | 13 (0.7) | 32 (0.3) | 20 (0.3) | 12 (0.4) | 2.46 |
| Kinmen County | 151.7 | 9 (0.5) | 42 (0.4) | 27 (0.4) | 15 (0.5) | 4.67 |
| Lienchiang County | 28.8 | 6 (0.3) | 3 (0.0) | 1 (0.0) | 2 (0.1) | 0.50 |
| Total | 36,194.4 | 1782 (100) | 9704 (100) | 6593 (100) | 3111 (100) | 5.45 |
| City or County | Providers a | Dementia Cases Living in the Community b | Dementia Cases with General Demand | Dementia Cases with High Level of Need for | |||
|---|---|---|---|---|---|---|---|
| n | PWD (m) | TLD (m) | PWD (m) | TLD (m) | PWD (m) | TLD (m) | |
| Taipei City | 162 | 650 | 1200 | 350 | 1300 | - | 600 |
| New Taipei City | 227 | 200 | 2200 | 200 | 1800 | - | 950 |
| Keelung City | 38 | 300 | 1250 | - | - | - | 550 |
| Taoyuan City | 102 | 200 | 3250 | 250 | 1850 | 150 | 2250 |
| Hsinchu County | 48 | 200 | 1500 | 300 | 1200 | - | - |
| Hsinchu City | 26 | 150 | - | - | 1200 | - | - |
| Miaoli County | 41 | 150 | 2950 | 150 | 1000 | - | - |
| Taichung City | 149 | 150 | 3000 | 150 | 3000 | 150 | 2150 |
| Changhua County | 90 | 150 | 4750 | - | - | - | - |
| Nantou County | 42 | 150 | 3650 | - | 4050 | - | - |
| Yunlin County | 72 | - | 6250 | - | - | - | - |
| Chiayi County | 54 | 300 | 1200 | 400 | 700 | - | - |
| Chiayi City | 40 | 250 | - | 350 | - | 350 | - |
| Tainan City | 169 | 350 | 1200 | 300 | 1450 | 450 | 4500 |
| Kaohsiung City | 237 | 350 | 1600 | 300 | 1700 | 300 | 1600 |
| Pingtung County | 98 | 150 | 3600 | 150 | 2950 | - | - |
| Yilan County | 72 | 150 | 1200 | - | 1100 | - | - |
| Hualien County | 40 | 600 | 1700 | 550 | 1650 | - | - |
| Taitung County | 47 | - | 1300 | - | - | - | 900 |
| Penghu County | 13 | - | - | - | - | - | - |
| Kinmen County | 9 | - | - | - | - | - | - |
| Lienchiang County | 6 | - | - | - | - | - | - |
| The Status of PWD and TLD | All Dementia Cases | Dementia Cases with General Demand | Dementia Cases with High Level of Need | |||
|---|---|---|---|---|---|---|
| n | City or County | n | City or County | n | City or County | |
| With both PWD and TLD | 15 | Taipei City | 11 | Taipei City | 4 | Taoyuan City |
| New Taipei City | New Taipei City | Taichung City | ||||
| Keelung City | Taoyuan City | Tainan City | ||||
| Taoyuan City | Hsinchu County | Kaohsiung City | ||||
| Hsinchu County | Miaoli County | |||||
| Miaoli County | Taichung City | |||||
| Taichung City | Chiayi County | |||||
| Changhua County | Tainan City | |||||
| Nantou County | Kaohsiung City | |||||
| Chiayi County | Pingtung County | |||||
| Tainan City | Hualien County | |||||
| Kaohsiung City | ||||||
| Pingtung County | ||||||
| Yilan County | ||||||
| Hualien County | ||||||
| Only PWD | 2 | Hsinchu City | 1 | Chiayi City | 1 | Chiayi City |
| Chiayi City | ||||||
| Only TLD | 2 | Yunlin County | 3 | Hsinchu City | 4 | Taipei City |
| Taitung County | Nantou County | New Taipei City | ||||
| Yilan County | Keelung City | |||||
| Taitung County | ||||||
| Neither PWD nor TLD | 3 | Penghu County | 7 | Keelung City | 13 | Hsinchu County |
| Kinmen County | Changhua County | Hsinchu City | ||||
| Lienchiang County | Yunlin County | Miaoli County | ||||
| Taitung County | Changhua County | |||||
| Penghu County | Nantou County | |||||
| Kinmen County | Yunlin County | |||||
| Lienchiang County | Chiayi County | |||||
| Pingtung County | ||||||
| Yilan County | ||||||
| Hualien County | ||||||
| Penghu County | ||||||
| Kinmen County | ||||||
| Lienchiang County | ||||||
| Year | 2005 | 2009 | 2009 | 2016 | 2015 | Present Study |
|---|---|---|---|---|---|---|
| Author(s) | Wang and Luo | McGrail and Humphreys | Luo and Qi | Kilinc et al. | Lin et al. | Yen & Lin |
| Purpose | Assessing the accessibility of primary care in Illinois | Assessing the accessibility of primary care in rural areas in Victoria, Australia | Measuring the accessibility of primary care physicians | Assessing and measuring the accessibility and disparity in home care services | Developing new indices to compare nursing home care services in urban and rural areas | Using the PWD and TLD to examine the accessibility of dementia services and plan for resource allocation based on distributive justice |
| Method | 2SFCA, factor analysis | 2SFCA, closest facility analysis (a tool of network analysis) | E2SFCA, spatial cluster analysis | Revised 2SFCA, spatial cluster analysis | Spatial autocorrelation, regression | Spatial autocorrelation, join point analysis |
| Index used * | Moran’s I | PWD TLD | Revised PWD and TLD | |||
| Index development & variables collected (level of complexity) | Spatial and non-spatial factors (e.g., individual’s age, gender, race, socioeconomic status and language skills) and characteristics of a population or area (e.g., land use, university graduation rate, ratio of single-parent families, state of unemployment, and ratio of occupational categories). Weighted factors are derived based on their eigenvalues and fuzzy logic. | Spatial (i.e., locations of service users and providers) and non-spatial factors (i.e., service availability, acuteness of service demand). The WHODAS 2.0 assessment results (as in the present study) or other measurements of health needs (target group). | ||||
© 2019 by the authors. Licensee MDPI, Basel, Switzerland. This article is an open access article distributed under the terms and conditions of the Creative Commons Attribution (CC BY) license (http://creativecommons.org/licenses/by/4.0/).
Share and Cite
Yen, C.-F.; Lin, S.-W. Justice in Dementia Care Resource Allocation: How Should We Plan for Dementia Services? Int. J. Environ. Res. Public Health 2019, 16, 1754. https://doi.org/10.3390/ijerph16101754
Yen C-F, Lin S-W. Justice in Dementia Care Resource Allocation: How Should We Plan for Dementia Services? International Journal of Environmental Research and Public Health. 2019; 16(10):1754. https://doi.org/10.3390/ijerph16101754
Chicago/Turabian StyleYen, Chia-Feng, and Shyang-Woei Lin. 2019. "Justice in Dementia Care Resource Allocation: How Should We Plan for Dementia Services?" International Journal of Environmental Research and Public Health 16, no. 10: 1754. https://doi.org/10.3390/ijerph16101754
APA StyleYen, C.-F., & Lin, S.-W. (2019). Justice in Dementia Care Resource Allocation: How Should We Plan for Dementia Services? International Journal of Environmental Research and Public Health, 16(10), 1754. https://doi.org/10.3390/ijerph16101754