Linking Industrial Hazards and Social Inequalities: Environmental Injustice in Gujarat, India


Abstract
1. Introduction
2. Materials and Methods
2.1. Study Area
2.2. Dependent Variables
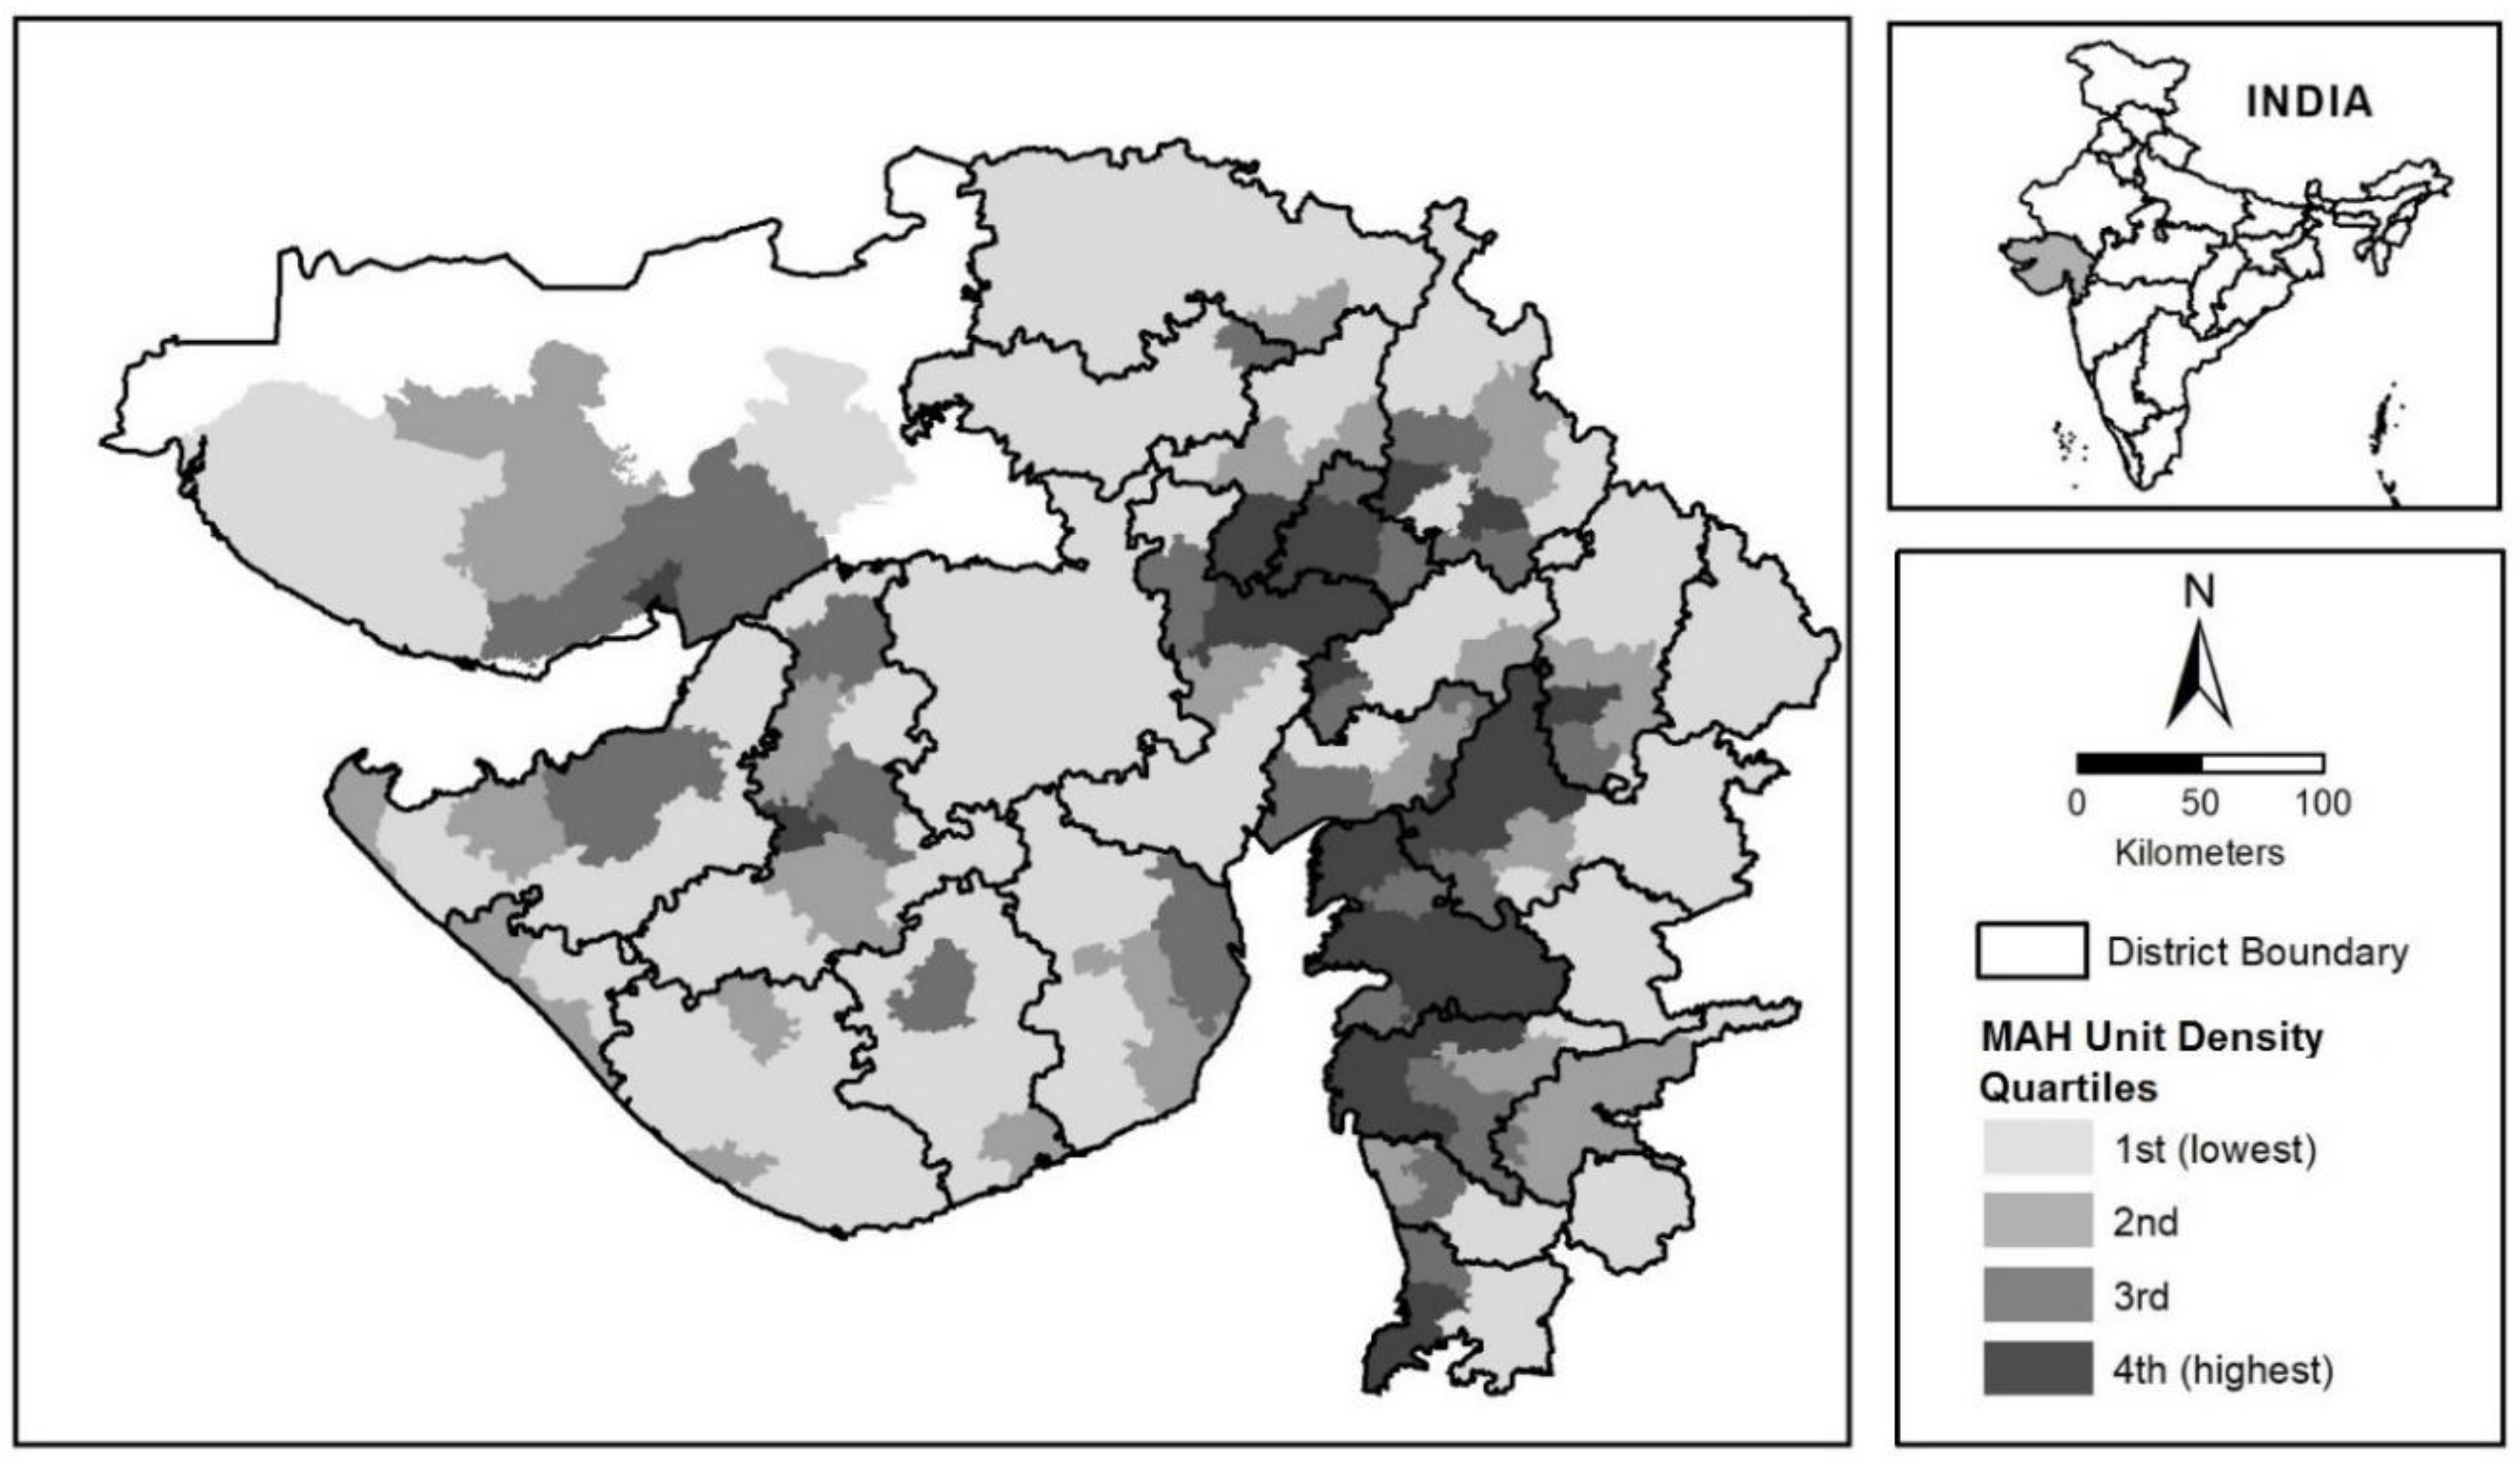
- A 2 km by 2 km spatial grid of points was overlaid on the map layer representing the geocoded locations of MAH units.
- The number of MAH units within 5 km of each grid point was divided by the area of the search to derive a MAH unit density value for every grid point.
- The map layer representing subdistrict boundaries was overlaid on the grid of MAH unit density and the mean (average) density value of all grid points located within each subdistrict boundary was calculated and assigned as an attribute of that subdistrict.
2.3. Explanatory Variables
2.4. Statistical Methodology
3. Results
4. Discussion
5. Conclusions
Author Contributions
Funding
Acknowledgments
Conflicts of Interest
References
- Basu, P. Environmental justice in South and Southeast Asia: Inequalities and struggles in rural and urban contexts. In The Routledge Handbook of Environmental Justice; Holifield, R., Chakraborty, J., Walker, G., Eds.; Routledge: New York, NY, USA, 2018; pp. 603–614. [Google Scholar]
- Bose, S.; Kohli, B. Study of FDI trends and patterns in BRICS economies during the period 1990–2015. Emerg. Econ. Stud. 2018, 4, 78–101. [Google Scholar] [CrossRef]
- Naude, W.; Szirmai, A.; Lavopa, A. Industrialization Lessons from BRICS: A Comparative Analysis; IZA: Bonn, Germany, 2013; Available online: http://repec.iza.org/dp7543.pdf (accessed on 27 November 2018).
- Ramaswamy, K. Growth, structural change and spatial inequality in India: Some dimensions of regional disparity. In 2016 KIEP Visiting Fellows Program; 2017; pp. 224–249. Available online: https://papers.ssrn.com/sol3/papers.cfm?abstract_id=2973734 (accessed on 27 November 2018).
- Directorate of Economics and Statistics. Socio-Economic Review 2017–2018 Gujarat State; Government of Gujarat: Gandhinagar, India, 2018. Available online: https://gujecostat.gujarat.gov.in/sites/default/files/socio-economic-review-2017-18-part-i-iii.pdf (accessed on 27 November 2018).
- ENVIS Centre. Industrial Environment. State of Environment Reports of Gujarat-2012. Available online: http://www.gujenvis.nic.in/PDF/soe-industrial.pdf (accessed on 27 November 2018).
- Awasthi, D. Recent changes in Gujarat industry: Issues and evidence. Econ. Political Wkly. 2000, 35, 3183–3192. [Google Scholar]
- Dholakia, R. Liberalisation in Gujarat: Review of recent experience. Econ. Political Wkly. 2000, 35, 3121–3124. [Google Scholar]
- Unni, J.; Lalitha, N.; Rani, U. Economic reforms and productivity trends in Indian manufacturing. Econ. Political Wkly. 2001, 36, 3914–3922. [Google Scholar]
- Chaurasia, A.R. Human development in Gujarat: Evidence from 2011 Population Census. Indian J. Hum. Dev. 2017, 11, 313–334. [Google Scholar] [CrossRef]
- Jaffrelot, C. What ‘Gujarat model’?—Growth without development—And with socio-political polarisation. South Asia J. South Asian Stud. 2015, 38, 820–838. [Google Scholar] [CrossRef]
- KPMG. Accelerating Growth in Gujarat: A Discussion Note. 2007. Available online: http://www.in.kpmg.com/pdf/Gujarat.pdf (accessed on 27 November 2018).
- Census. State Census 2011. Available online: http://www.census2011.co.in/states.php (accessed on 27 November 2018).
- Gujarat Industrial Development Corporation (GIDC). Industrial Policy 2015. Available online: http://gidc.gujarat.gov.in/Industrial_Policy.html (accessed on 27 November 2018).
- Vibrant Gujarat. Evolution of Vibrant Gujarat. Available online: https://vibrantgujarat.com/vg-2019 (accessed on 27 November 2018).
- Central Pollution Control Board (CPCB). National Inventory of Hazardous Waste Generating Industries and Hazardous Waste Management in India. 2009. Available online: http://cpcb.nic.in/upload/NewItems/NewItem_145_hw_inventory_final_report_2009.pdf (accessed on 27 November 2018).
- Counterview. Gujarat Generates Largest Share of Hazardous Waste in India, Requires more Land for Waste Disposal to Prevent Land Degradation. 2014. Available online: https://counterview.org/2014/07/09/gujarat-generates-largest-share-of-hazardous-waste-in-india-requires-more-land-for-waste-disposal-to-prevent-land-degradation/ (accessed on 27 November 2018).
- Counterview. Gujarat has 30 per Cent of India’s Major Accident Hazard Units, Yet Doesn’t Have Chemical Emergency Plan. 2013. Available online: https://www.counterview.net/2013/10/gujarat-has-30-per-cent-of-indias-major.html (accessed on 27 November 2018).
- Varadarajan, S. (Ed.) Gujarat: The Making of a Tragedy; Penguin: New Delhi, India, 2002. [Google Scholar]
- Shah, J. A Comparative Analysis of Two Major Cotton Textile Centres of India-Bombay and Ahmedabad. Treballs de la Societat Catalana de Geografia. 1985. Available online: https://www.raco.cat/index.php/treballsscgeografia/article/viewFile/156834/208727 (accessed on 27 November 2018).
- Industries Commissionerate. Status of Special Economic Zone; Government of Gujarat: 2017. Available online: https://ic.gujarat.gov.in/status-of-special-economic-zone.aspx (accessed on 27 November 2018).
- George, P.T. Special Economic Zones and People’s Struggles in Gujarat; dph: 2011. Available online: http://base.d-p-h.info/en/fiches/dph/fiche-dph-8854.html (accessed on 27 November 2018).
- Disaster Management Institute (DMI). Major Accident Hazard Units; Bhopal, India. 2018. Available online: http://www.hrdp-idrm.in/e5783/e26901/ (accessed on 27 November 2018).
- Director Industrial Safety and Health. List of MAH Factories of Gujarat State; Labour and Employment Department, Government of Gujarat: 2017. Available online: https://dish.gujarat.gov.in/statistics-factories-index.htm (accessed on 27 November 2018).
- ML Infomap. Available online: https://www.mlinfomap.com/ContactUs/indiamaps.html (accessed on 27 November 2018).
- LeadDog Consulting. Available online: http://goleaddog.com/gis-map/asia/india/ (accessed on 27 November 2018).
- Chakraborty, J. Spatial representation and estimation of environmental risk: A review of analytic approaches. In The Routledge Handbook of Environmental Justice; Holifield, R., Chakraborty, J., Walker, G., Eds.; Routledge: New York, NY, USA, 2018; pp. 175–189. [Google Scholar]
- Bolin, B.; Nelson, A.; Hackett, E.; Pijawka, D.; Smith, S.; Sadalla, E.; Sicotte, D.; Matranga, E.; O’Donnell, M. The ecology of technological risk in a sunbelt city. Environ. Plan. A 2002, 34, 317–339. [Google Scholar] [CrossRef]
- Mennis, J.; Jordan, L. The distribution of environmental equity: Exploring spatial non-stationarity in multivariate models of air toxic releases. Ann. Assoc. Am. Geogr. 2005, 95, 249–268. [Google Scholar] [CrossRef]
- Grineski, S.E.; Collins, T.W. Exploring environmental injustice in the Global South: Maquiladoras in Ciudad Juárez. Popul. Environ. 2008, 29, 247–270. [Google Scholar] [CrossRef]
- Chakraborty, J.; Collins, T.W.; Grineski, S.E.; Montgomery, M.C.; Hernandez, M. Comparing disproportionate exposure to acute and chronic pollution risks: A case study in Houston; Texas. Risk Anal. 2014, 34, 2005–2020. [Google Scholar] [CrossRef]
- Bailey, T.C.; Gatrell, A. Interactive Spatial Data Analysis; Longman Scientific and Technical: Harlow, Essex, UK, 1995. [Google Scholar]
- U.S. Environmental Protection Agency (EPA). EJSCREEN Environmental Justice Mapping and Screening Tool Technical Documentation; EPA: Washington, DC, USA, 2017.
- Census of India. District Census Handbook-Part B. 2011. Available online: http://www.censusindia.gov.in/2011census/dchb/Gujarat.html (accessed on 27 November 2018).
- Census of India 2011. Percentage of Households to Total Households by Amenities and Assets (India & States/UTs—Sub-District Level). Houselisting and Housing Census Data—2011. Available online: http://www.censusindia.gov.in/2011census/hlo/HLO_Tables.html (accessed on 27 November 2018).
- Kathuria, V.; Khan, N. Vulnerability to air pollution: Is there any inequity in exposure? Econ. Political Wkly. 2007, 142, 3158–3165. [Google Scholar]
- Basu, P.; Chakraborty, J. Environmental justice implications of industrial hazardous waste generation in India: A national scale analysis. Environ. Res. Lett. 2016, 11, 125001. [Google Scholar] [CrossRef]
- Baden, B.; Noonan, D.; Turaga, R. Scales of justice: Is there a geographic bias in environmental equity analysis? J. Environ. Plan. Manag. 2007, 50, 163–185. [Google Scholar] [CrossRef]
- Pastor, M.; Morello-Frosch, R.; Sadd, J. The air is always cleaner on the other side: Race; space; and ambient air toxics exposures in California. J. Urban Aff. 2005, 27, 127–148. [Google Scholar] [CrossRef]
- Downey, L. Environmental racial inequality in Detroit. Soc. Forces 2006, 85, 771–796. [Google Scholar] [CrossRef] [PubMed]
- Ash, M.; Fetter, T. Who lives on the wrong side of the environmental tracks? Evidence from the EPA’s risk-screening environmental indicators model. Soc. Sci. Q. 2004, 78, 793–810. [Google Scholar] [CrossRef]
- Census of India 2011. Meta Data. Available online: http://www.censusindia.gov.in/2011census/HLO/Metadata_Census_2011.pdf (accessed on 27 November 2018).
- Daniels, G.; Friedman, S. Spatial inequality and the distribution of industrial toxic releases: Evidence from the 1990 TRI. Soc. Sci. Q. 1999, 80, 244–262. [Google Scholar]
- Véron, R. Remaking urban environments: The political ecology of air pollution in Delhi. Environ. Plan. A 2006, 38, 2093–2109. [Google Scholar] [CrossRef]
- Gupta, D. Interrogating Caste: Understanding Hierarchy and Difference in Indian Society; Penguin Books: Delhi, India, 2000. [Google Scholar]
- Deshpande, A. The Grammar of Caste: Economic Discrimination in Contemporary India; Oxford University Press: Noida, India, 2011. [Google Scholar]
- Vithayathil, T.; Singh, G. Spaces of discrimination: Residential segregation in Indian cities. Econ. Political Wkly. 2012, 47, 60–66. [Google Scholar]
- Director, Scheduled Caste Welfare. Scheduled Caste Population-2011; Department of Social Justice & Empowerment, Sachivalay: Gandhinagar, Gujarat, India. Available online: https://sje.gujarat.gov.in/dscw/showpage.aspx?contentid=1821&lang=english (accessed on 27 November 2018).
- Status of Adivasis and Indigenous Peoples’ Project (SAIP). District-wise population of STs. Available online: http://saipdata.awardspace.com/gujarat_district-wise_st_population.htm (accessed on 27 November 2018).
- Status of Adivasis and Indigenous Peoples’ Project (SAIP). Areas of ST Population in Gujarat. Available online: http://saipdata.awardspace.com/gujarat_areas_of_STs.jpg (accessed on 27 November 2018).
- Chakraborty, J. Automobiles, air toxics, and adverse health risks: Environmental inequities in Tampa Bay; Florida. Ann. Assoc. Am. Geogr. 2009, 99, 674–697. [Google Scholar] [CrossRef]
- Collins, T.W.; Grineski, S.E.; Chakraborty, J.; Montgomery, M.C.; Hernandez, M. Downscaling environmental justice analysis: Determinants of household-level hazardous air pollutant exposure in Greater Houston. Ann. Assoc. Am. Geogr. 2015, 105, 685–703. [Google Scholar] [CrossRef]
- Census of India 2011. Houses-Household Amenities and Assets-All Indicators. Available online: http://censusindia.gov.in/2011census/hlo/Data_sheet/India/HLO_Indicators.pdf (accessed on 27 November 2018).
- Kumar, A. India’s Residential rental housing. Econ. Political Wkly. 2016, 51, 112–120. [Google Scholar]
- Nelder, J.; Wedderburn, R. Generalized linear models. J. R. Stat. Soc. Ser. A 1972, 135, 370–384. [Google Scholar] [CrossRef]
- Liang, K.; Zeger, S. Longitudinal data analysis using generalized linear models. Biometrika 1986, 73, 13–22. [Google Scholar] [CrossRef]
- Diggle, P.; Liang, K.; Zeger, S. Analysis of Longitudinal Data; Oxford University Press: Oxford, UK, 1994. [Google Scholar]
- Ghisletta, P.; Spini, D. An introduction to generalized estimating equations and an application to assess selectivity effects in a longitudinal study on very old individuals. J. Educ. Behav. Stat. 2009, 29, 421–437. [Google Scholar] [CrossRef]
- Maldonado, A.; Collins, T.W.; Grineski, S.E.; Chakraborty, J. Exposure to flood hazards in Miami and Houston: Are Hispanic immigrants at greater risk than other social groups? Int. J. Environ. Res. Public Health 2016, 13, 775. [Google Scholar] [CrossRef] [PubMed]
- Grineski, S.E.; Collins, T.W.; Chakraborty, J.; Montgomery, M.C. Hazard characteristics and patterns of environmental injustice: Household-level determinants of environmental risk in Miami, Florida. Risk Anal. 2017, 37, 1419–1434. [Google Scholar] [CrossRef]
- Chakraborty, J. Proximity to extremely hazardous substances for people with disabilities: A case study in Houston; Texas. Disabil. Health J. 2018, 12, 121–125. [Google Scholar] [CrossRef]
- Diggle, P.; Heagerty, P.; Liang, K.; Zeger, S. Longitudinal Data Analysis, 2nd ed.; Oxford University Press: Oxford, UK, 2002. [Google Scholar]
- Diez, R.A. A glossary for multilevel analysis. J. Epidemiol. Commun. Health 2002, 56, 588–594. [Google Scholar] [CrossRef]


| Variable | Min | Max | Mean | Std. Dev. |
|---|---|---|---|---|
| Dependent variables: | ||||
| Density: all industries (MAH units) | 0.000 | 0.103 | 0.004 | 0.011 |
| Density: large capacity industries | 0.000 | 0.085 | 0.003 | 0.008 |
| Density: medium/small capacity industries | 0.000 | 0.021 | 0.001 | 0.003 |
| Density: private sector industries | 0.000 | 0.085 | 0.003 | 0.009 |
| Density: public sector industries | 0.000 | 0.030 | 0.001 | 0.003 |
| Independent variables: | ||||
| Population density (persons per square km) | 28 | 14,360 | 492 | 1285 |
| Proportion urban population | 0.000 | 1.000 | 0.215 | 0.211 |
| Proportion Scheduled Caste | 0.001 | 0.182 | 0.070 | 0.040 |
| Proportion Scheduled Tribe | 0.001 | 0.981 | 0.181 | 0.298 |
| Proportion literate | 0.359 | 0.817 | 0.644 | 0.090 |
| Proportion households owning home | 0.450 | 0.991 | 0.892 | 0.083 |
| Variable | All MAH Units | Large Capacity | Medium or Small Capacity | Private Sector | Public Sector |
|---|---|---|---|---|---|
| Population density | 0.373 ** | 0.331 ** | 0.459 ** | 0.346 ** | 0.369 ** |
| Proportion urban population | 0.438 ** | 0.420 ** | 0.439 ** | 0.402 ** | 0.434 ** |
| Proportion Scheduled Caste | −0.014 | −0.021 | 0.015 | −0.006 | −0.004 |
| Proportion Scheduled Tribe | −0.043 | −0.028 | −0.073 | −0.040 | −0.058 |
| Proportion literate | 0.281 ** | 0.272 ** | 0.266 ** | 0.259 ** | 0.248 ** |
| Proportion households owning home | −0.484 ** | −0.515 ** | −0.374 | −0.414 ** | −0.584 ** |
| Variable | Beta | Wald’s Chi-Sq. |
|---|---|---|
| Population density | −0.082 | 5.155 * |
| Proportion urban population | 0.787 | 16.422 ** |
| Proportion Scheduled Caste | 0.682 | 3.144 * |
| Proportion Scheduled Tribe | 1.725 | 19.140 * |
| Proportion literate | 1.844 | 2.899 |
| Proportion households owning home | −0.502 | 6.596 * |
| Intercept | −8.534 | 23.218 ** |
| Model fit (QIC) | 49.958 | |
| N (subdistricts) | 225 |
| Variable | Large Capacity | Medium/Small Capacity | ||
|---|---|---|---|---|
| Beta | Wald Chi-Sq. | Beta | Wald Chi-Sq. | |
| Population density | −0.071 | 1.973 | −0.152 | 16.946 ** |
| Proportion urban population | 0.628 | 9.661 ** | 1.464 | 17.454 ** |
| Proportion Scheduled Caste | 0.511 | 2.651 | 1.585 | 9.291 ** |
| Proportion Scheduled Tribe | 1.454 | 24.360 ** | 3.333 | 12.091 * |
| Proportion literate | 1.271 | 3.090 | 4.801 | 7.489 ** |
| Proportion households owning home | −0.475 | 11.524 ** | −0.971 | 6.103 * |
| Intercept | −7.735 | 59.394 ** | −16.426 | 16.496 ** |
| Model fit (QIC) | 45.006 | 66.175 | ||
| N (subdistricts) | 225 | 225 | ||
| Variable | Private Sector | Public Sector | ||
|---|---|---|---|---|
| Beta | Wald Chi-Sq. | Beta | Wald Chi-Sq. | |
| Population density | −0.063 | 3.259 | −0.185 | 21.304 ** |
| Proportion urban population | 0.885 | 18.087 ** | 0.970 | 10.619 ** |
| Proportion Scheduled Caste | 0.781 | 3.929 * | 1.002 | 3.412 |
| Proportion Scheduled Tribe | 2.159 | 12.397 ** | 0.580 | 0.251 |
| Proportion literate | 1.838 | 3.755 | 4.092 | 7.689 * |
| Proportion households owning home | −0.460 | 7.306 ** | −1.172 | 10.973 ** |
| Intercept | −0.901 | 26.707 ** | −15.383 | 17.053 ** |
| Model fit (QIC) | 39.604 | 55.277 | ||
| N (subdistricts) | 225 | 225 | ||
© 2018 by the authors. Licensee MDPI, Basel, Switzerland. This article is an open access article distributed under the terms and conditions of the Creative Commons Attribution (CC BY) license (http://creativecommons.org/licenses/by/4.0/).
Share and Cite
Chakraborty, J.; Basu, P. Linking Industrial Hazards and Social Inequalities: Environmental Injustice in Gujarat, India. Int. J. Environ. Res. Public Health 2019, 16, 42. https://doi.org/10.3390/ijerph16010042
Chakraborty J, Basu P. Linking Industrial Hazards and Social Inequalities: Environmental Injustice in Gujarat, India. International Journal of Environmental Research and Public Health. 2019; 16(1):42. https://doi.org/10.3390/ijerph16010042
Chicago/Turabian StyleChakraborty, Jayajit, and Pratyusha Basu. 2019. "Linking Industrial Hazards and Social Inequalities: Environmental Injustice in Gujarat, India" International Journal of Environmental Research and Public Health 16, no. 1: 42. https://doi.org/10.3390/ijerph16010042
APA StyleChakraborty, J., & Basu, P. (2019). Linking Industrial Hazards and Social Inequalities: Environmental Injustice in Gujarat, India. International Journal of Environmental Research and Public Health, 16(1), 42. https://doi.org/10.3390/ijerph16010042