Parental Migration and Left-Behind Children’s Depressive Symptoms: Estimation Based on a Nationally-Representative Panel Dataset

 ,
,  ,
, 
Abstract
:1. Introduction
2. Data
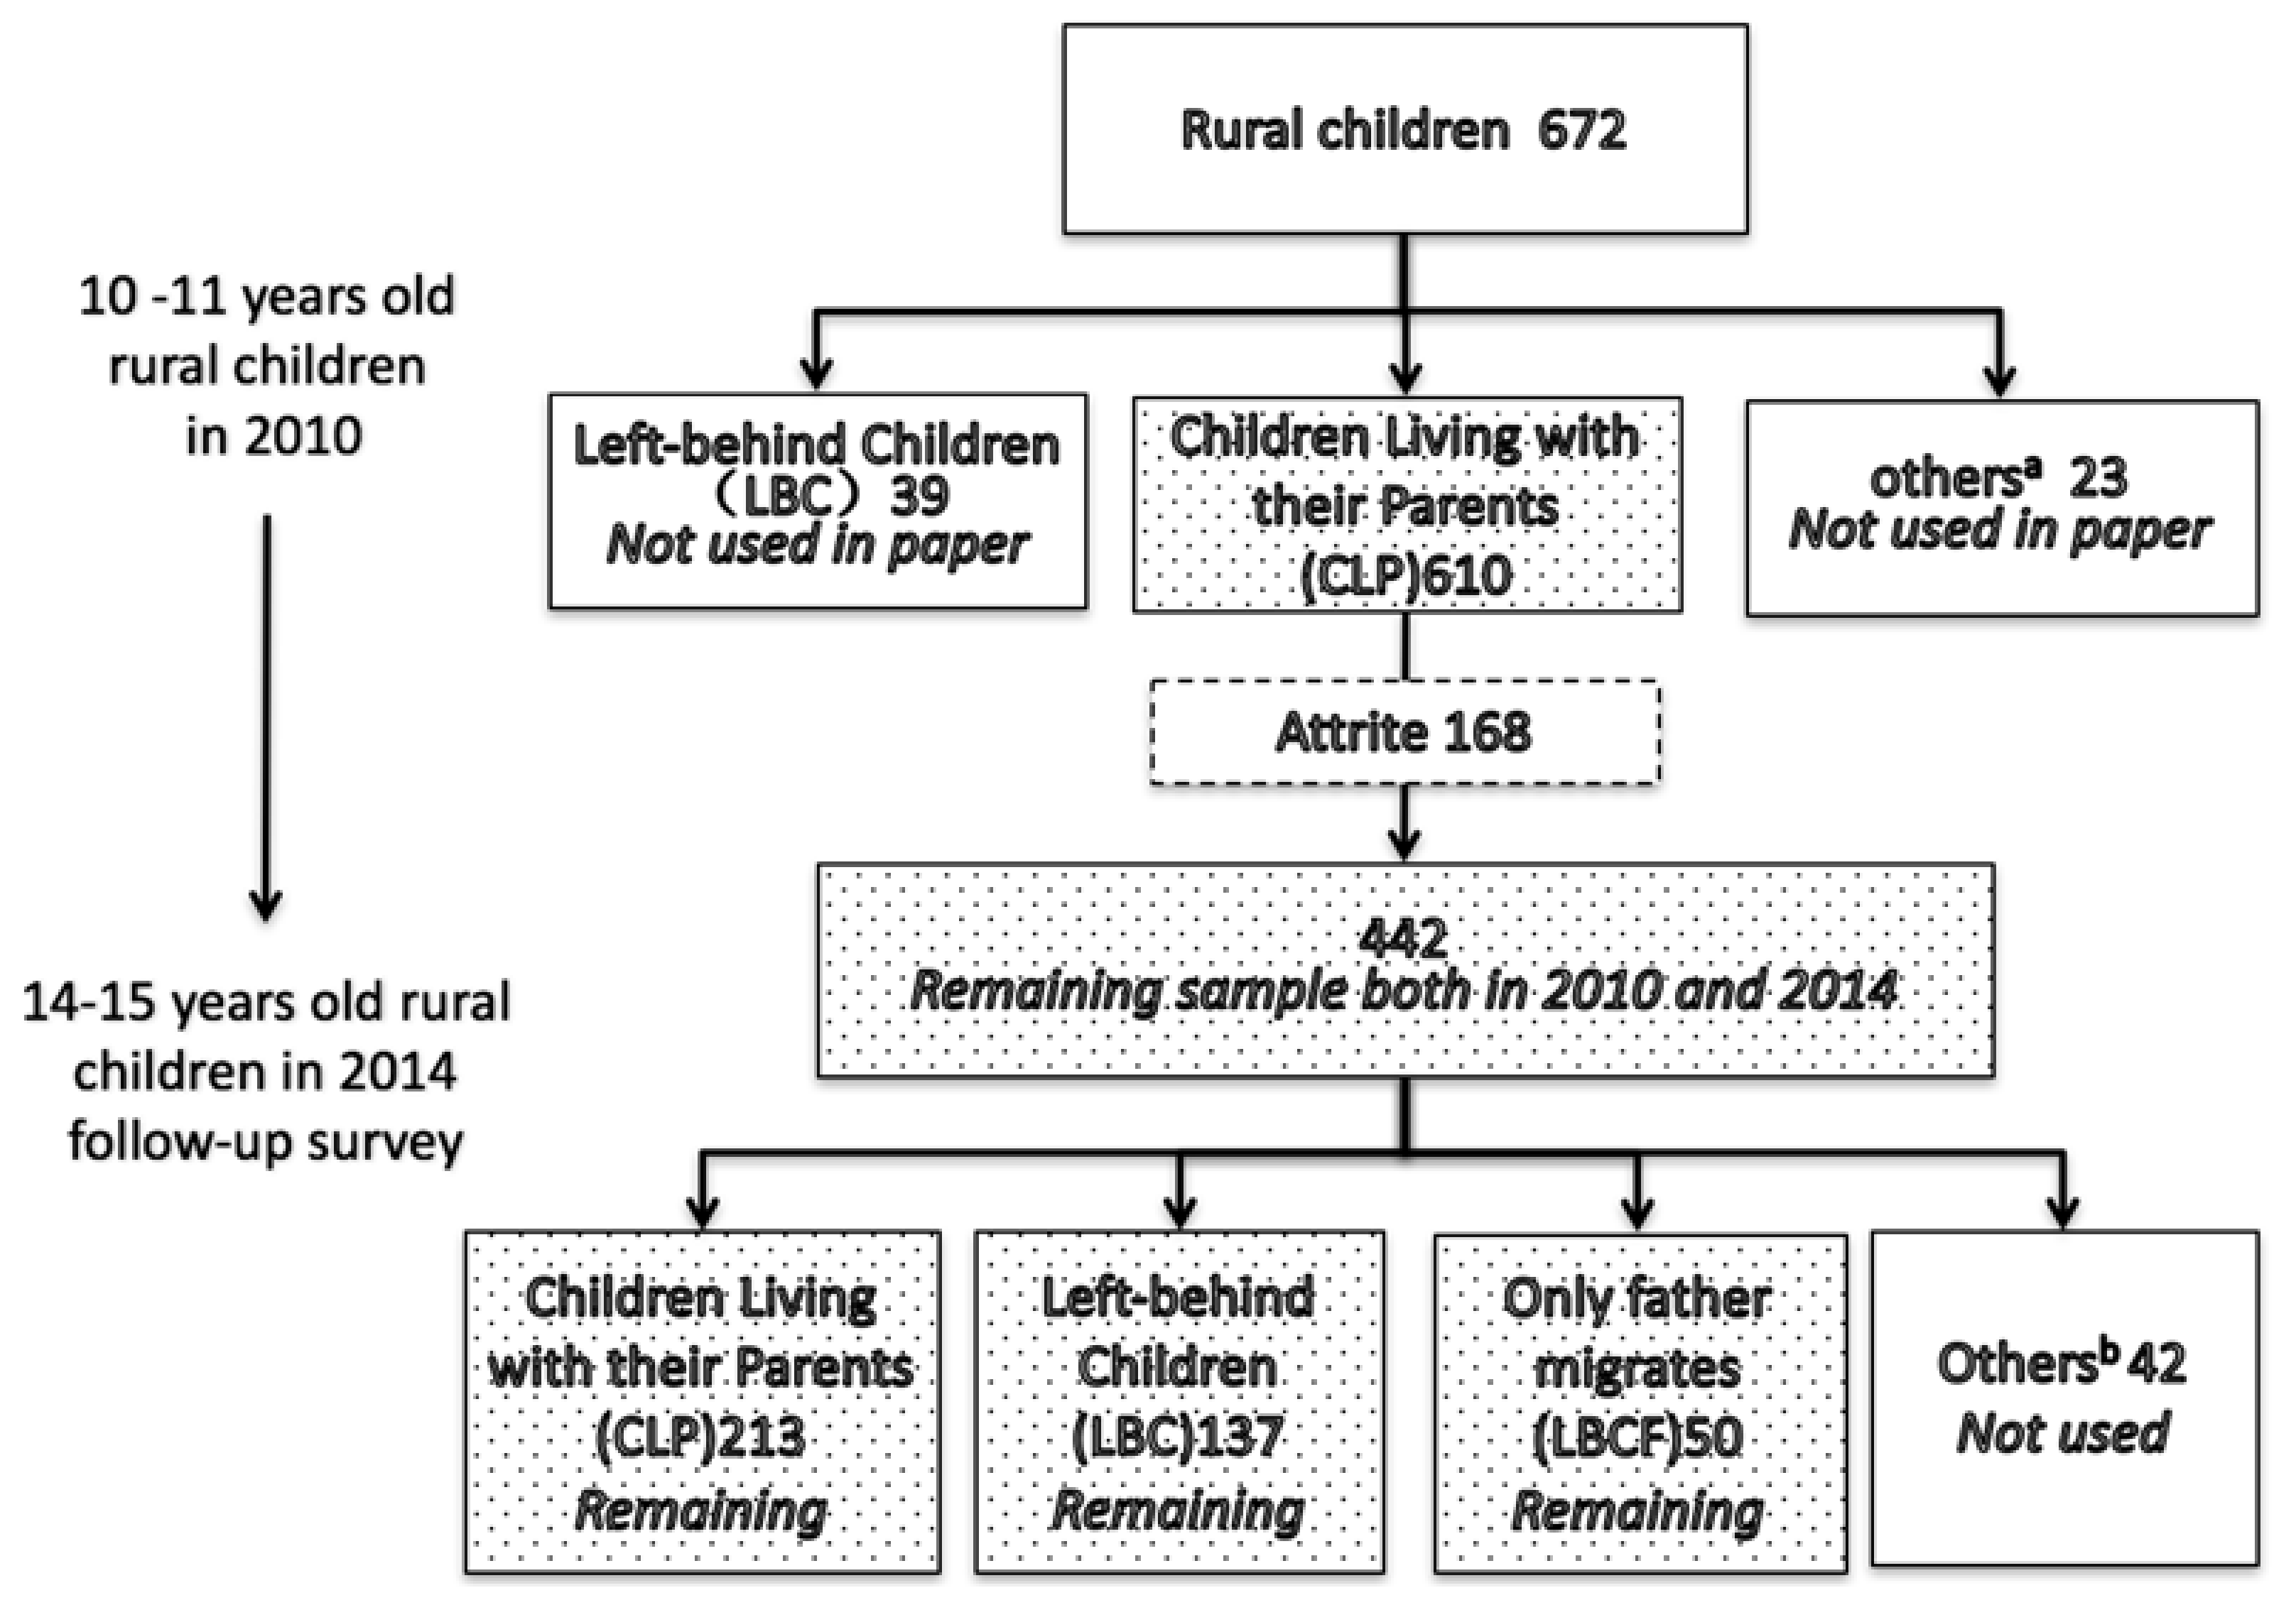
2.1. Data Source and Sampling
2.2. Measures
2.3. Descriptive Analysis
3. Methodology
3.1. Difference-in-Difference Approach
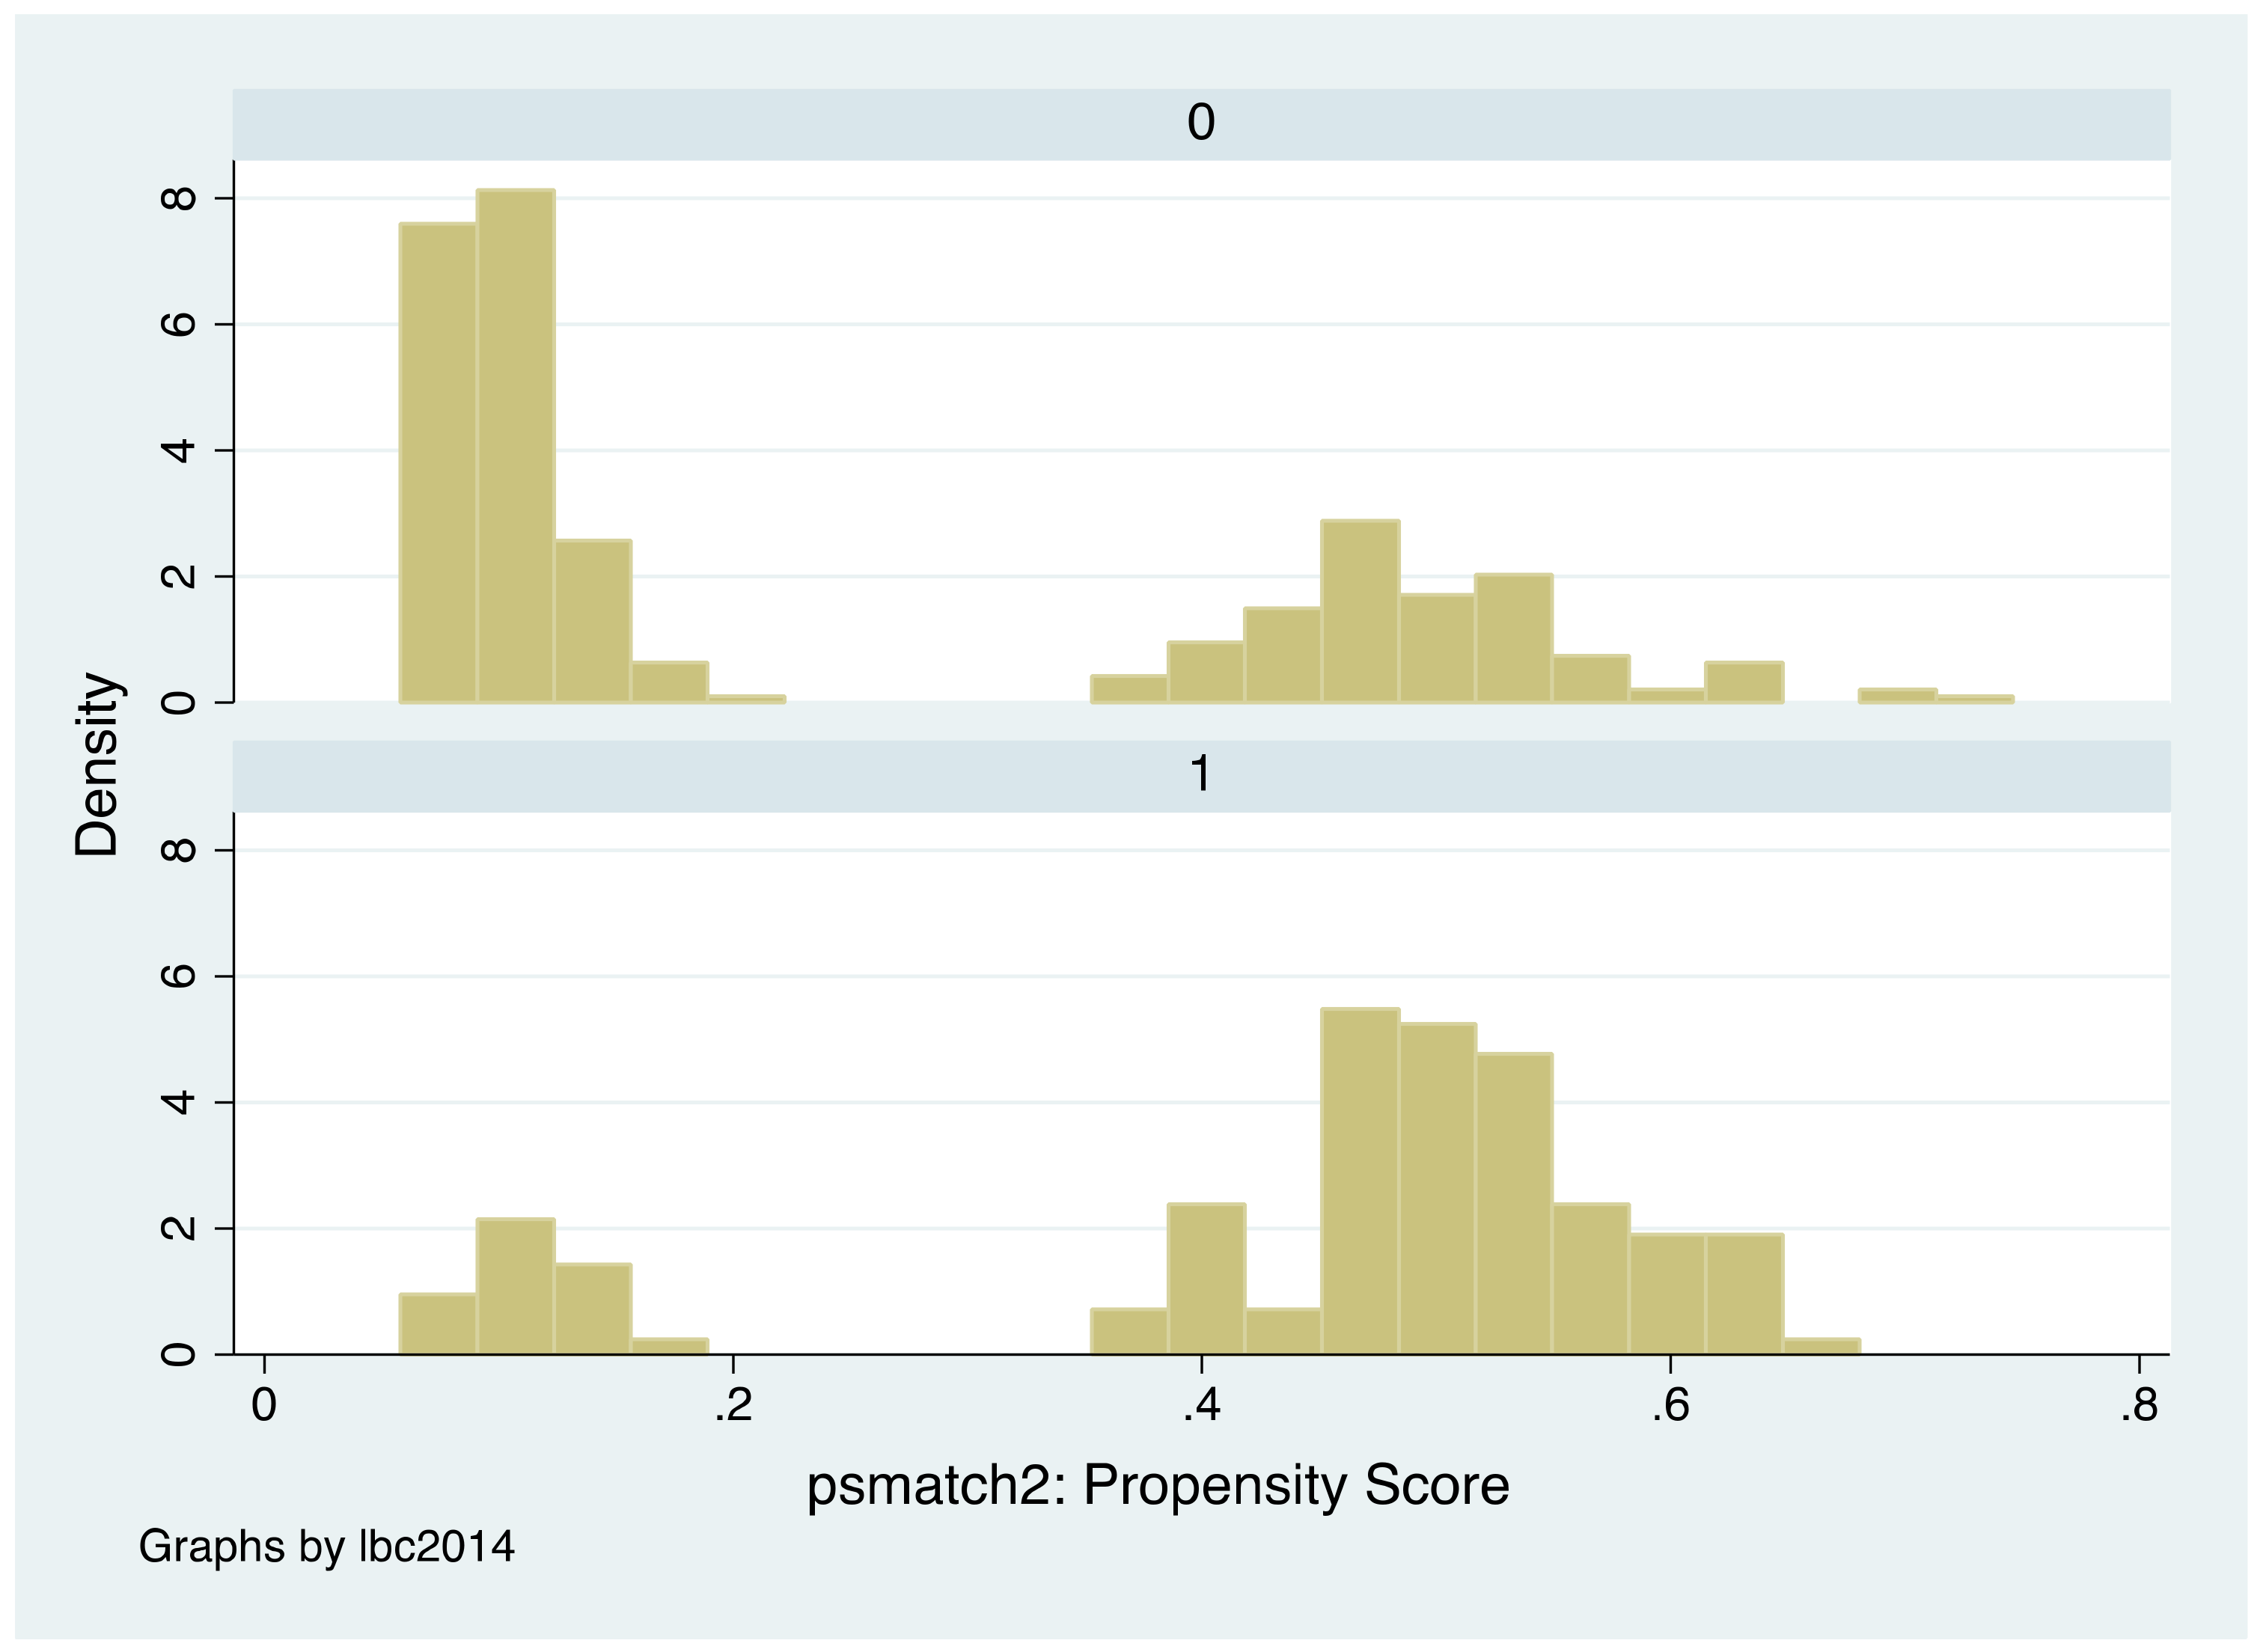
3.2. Propensity Score Matching Approach
4. Estimation Results
4.1. The Effect of Parental Migration on the Depressive Symptoms Outcomes of LBCs
4.2. Matching and DID-Matching Results
4.3. Mechanism Analysis
4.3.1. Parenting Effect
4.3.2. Income Effect
5. Conclusions
Author Contributions
Acknowledgments
Conflicts of Interest
Appendix A

| Item | During the Past Month: | Scores b | ||||
|---|---|---|---|---|---|---|
| A a | B a | C a | D a | E a | ||
| 1 | How often did you feel so depressed that nothing could cheer you up? | 1 | 2 | 3 | 4 | 5 |
| 2 | How often did you feel nervous? | 1 | 2 | 3 | 4 | 5 |
| 3 | How often did you feel restless or fidgety? | 1 | 2 | 3 | 4 | 5 |
| 4 | How often did you feel hopeless? | 1 | 2 | 3 | 4 | 5 |
| 5 | How often did you feel that everything was an effort? | 1 | 2 | 3 | 4 | 5 |
| 6 | How often did you feel that life was meaningless? | 1 | 2 | 3 | 4 | 5 |
| Item | During the Past Week: | Score a | |||
|---|---|---|---|---|---|
| A | B | C | D | ||
| 1 | I was bothered by things that usually don’t bother me. | 0 | 1 | 2 | 3 |
| 2 | I did not feel like eating; my appetite was poor. | 0 | 1 | 2 | 3 |
| 3 | I felt that I could not shake off the blues even with help from my family or friends. | 0 | 1 | 2 | 3 |
| 4 | I felt I was just as good as other people. | 3 | 2 | 1 | 0 |
| 5 | I had trouble keeping my mind on what I was doing. | 0 | 1 | 2 | 3 |
| 6 | I felt depressed. | 0 | 1 | 2 | 3 |
| 7 | I felt that everything I did was an effort. | 0 | 1 | 2 | 3 |
| 8 | I felt hopeful about the future. | 3 | 2 | 1 | 0 |
| 9 | I thought my life had been a failure. | 0 | 1 | 2 | 3 |
| 10 | I felt fearful. | 0 | 1 | 2 | 3 |
| 11 | My sleep was restless. | 0 | 1 | 2 | 3 |
| 12 | I was happy. | 3 | 2 | 1 | 0 |
| 13 | I talked less than usual. | 0 | 1 | 2 | 3 |
| 14 | I felt lonely. | 0 | 1 | 2 | 3 |
| 15 | People were unfriendly. | 0 | 1 | 2 | 3 |
| 16 | I enjoyed life. | 3 | 2 | 1 | 0 |
| 17 | I had crying spells. | 0 | 1 | 2 | 3 |
| 18 | I felt sad. | 0 | 1 | 2 | 3 |
| 19 | I felt that people disliked me. | 0 | 1 | 2 | 3 |
| 20 | I could not get going. | 0 | 1 | 2 | 3 |
| Dependent Variable: Attrited (1 = yes, 0 = no) | Coefficient | Standard Error |
|---|---|---|
| Standardized depression report in 2010 | 0.111 | (0.219) |
| Age in 2010 | −0.086 | (0.332) |
| minority in 2010, 1 = yes 0 = no | 2.686 ** | (1.315) |
| board in 2010, 1 = yes 0 = no | 0.514 | (0.869) |
| The log of family income per person in 2010 (Yuan) | 0.198 | (0.194) |
| Health self-report in 2010 | −0.038 | (0.367) |
| County dummy | Yes | |
| Observations | 577 | |
References
- Hesketh, T.; Ding, Q.J. Anxiety and depression in adolescents in urban and rural China. Psychol. Rep. 2005, 96, 435–444. [Google Scholar] [CrossRef] [PubMed]
- Zhou, M.; Zhang, G.; Rozelle, S.; Kenny, K.; Xue, H. Depressive Symptoms of Chinese Children: Prevalence and Correlated Factors among Subgroups. Int. J. Environ. Res. Public Health 2018, 15, 283. [Google Scholar] [CrossRef] [PubMed]
- Jia, L.; Jiang, S.M.; Shang, Y.Y.; Huang, Y.X.; Li, Y.J.; Xie, D.R.; Huang, K.H.; Zhi, F.C. Investigation of the Incidence of Pancreatic Cancer-Related Depression and Its Relationship with the Quality of Life of Patients. Digestion 2010, 82, 4–9. [Google Scholar] [CrossRef] [PubMed]
- Wang, X.; Liu, Q.M.; Ren, Y.J.; Lv, J.; Li, L.M. Family influences on physical activity and sedentary behaviours in Chinese junior high school students: A cross-sectional study. BMC Public Health 2015, 15, 1–9. [Google Scholar] [CrossRef] [PubMed]
- Kiernan, K.E.; Mensah, F.K. Poverty, Maternal Depression, Family Status and Children’s Cognitive and Behavioural Development in Early Childhood: A Longitudinal Study. J. Soc. Policy 2009, 38, 569–588. [Google Scholar] [CrossRef]
- Tran, T.B.; Uebelacker, L.; Wenze, S.J.; Collins, C.; Broughton, M.K. Adaptive and Maladaptive Means of Using Facebook: A Qualitative Pilot Study to Inform Suggestions for Development of a Future Intervention for Depression. J. Psychiatr. Pract. 2015, 21, 458–473. [Google Scholar] [CrossRef] [PubMed]
- Zhao, H.W.; Zhou, C.X.; Su, X.L.; Xiao, X.C.; Guo, Y. Effect of mental intervention on post-stroke depression and rehabilitation of neurological function. Chin. J. Clin. Rehabilitat. 2004, 13, 2408–2409. [Google Scholar]
- Gibson, B.S.; Gondoli, D.M.; Johnson, A.C.; Steeger, C.M.; Dobrzenski, B.A.; Morrissey, R.A. Component analysis of verbal versus spatial working memory training in adolescents with ADHD: A randomized, controlled trial. Child Neuropsychol. 2011, 17, 546–563. [Google Scholar] [CrossRef] [PubMed]
- Giannelli, G.C.; Mangiavacchi, L. Children’s Schooling and Parental Migration: Empirical Evidence on the ‘Left-behind’ Generation in Albania. Labour 2010, 24, 76–92. [Google Scholar] [CrossRef]
- Bollard, A.; Mckenzie, D.; Morten, M.; Rapoport, H. Remittances and the Brain Drain Revisited. World Bank Econ. Rev. 2011, 1, 132–156. [Google Scholar] [CrossRef]
- He, B.; Fan, J.; Liu, N.; Li, H.; Wang, Y.; Williams, J.; Wong, K. Depression risk of ‘left-behind children’ in rural China. Psychiatry Res. 2012, 200, 306–312. [Google Scholar] [CrossRef] [PubMed]
- Wu, Q.; Lu, D.; Mi, K. Social capital and the mental health of children in rural China with different experiences of parental migration. Soc. Sci. Med. 2015, 132, 270–277. [Google Scholar] [CrossRef] [PubMed]
- Gassmann, F.; Siegel, M.; Vanore, M.; Waidler, J. The impact of migration on children left behind in Moldova. 2013. Available online: https://www.unicef.org/The_Impacts_of_Migration_on_Children_in_Moldova(1).pdf (accessed on 24 May 2018).
- Macours, K.; Vakis, R. Seasonal migration and early childhood development. World Dev. 2010, 38, 857–869. [Google Scholar] [CrossRef]
- Dang, W.M.; Ma, W.J.; Wang, S.; Shi, C.; Su, L.P.; Guan, H.Y.; Zhang, Q.; Wang, Y.; Zhao, Q.; Yang, T. Investigation on mental health of residents living in a mineral area in Hubei province. Zhonghua Lao Dong Wei Sheng Zhi Ye Bing Za Zhi 2008, 26, 457–468. [Google Scholar] [PubMed]
- Radloff, L.S. The CES-D Scale: A self-report depression scale for research in the general population. Appl. Psychol. Meas. 1977, 1, 385–401. [Google Scholar] [CrossRef]
- Link, B.G.; Struening, E.L.; Rahav, M.; Phelan, J.C.; Nuttbrock, L. On Stigma and Its Consequences: Evidence from a Longitudinal Study of Men with Dual Diagnoses of Mental Illness and Substance Abuse. J. Health Soc. Behav. 1997, 38, 177–190. [Google Scholar] [CrossRef] [PubMed]
- Hann, D.; Winter, K.; Jacobsen, P. Measurement of depressive symptoms in cancer patients: Evaluation of the Center for Epidemiological Studies Depression Scale (CES-D). J. Psychosom. Res. 1999, 46, 437–443. [Google Scholar] [CrossRef]
- Smith, J.A.; Todd, P.E. Does matching overcome LaLonde’s critique of nonexperimental estimators? J. Econom. 2005, 125, 305–353. [Google Scholar] [CrossRef]
- Rosenbaum, P.R.; Rubin, D.B. The central role of the propensity score in observational studies for causal effects. Biometrika 1983, 70, 41–55. [Google Scholar] [CrossRef]
- Caliendo, M.; Kopeinig, S. Some practical guidance for the implementation of propensity score matching. J. Econ. Surv. 2008, 22, 31–72. [Google Scholar] [CrossRef]
- Dehejia, R.H.; Wahba, S. Causal effects in nonexperimental studies: Reevaluating the evaluation of training programs. J. Am. Stat. Assoc. 1999, 94, 1053–1062. [Google Scholar] [CrossRef]
- Dehejia, R.H.; Wahba, S. Propensity Score-Matching Methods for Nonexperimental Causal Studies. Rev. Econ. Stat. 2002, 84, 151–161. [Google Scholar] [CrossRef]
- Abadie, A.; Imbens, G.W. Bias-Corrected Matching Estimators for Average Treatment Effects. J. Bus. Econ. Stat. 2011, 29, 1–11. [Google Scholar] [CrossRef]
- Abadie, A.; Imbens, G.W. Large Sample Properties of Matching Estimators for Average Treatment Effects. Econometrica 2006, 74, 235–267. [Google Scholar] [CrossRef]


| 2010 | 2014 | ||||||
|---|---|---|---|---|---|---|---|
| n | % | Depression Score | n | % | Depression Score | ||
| [1] | [2] | [3] | [4] | [5] | [6] | ||
| [1] | All | 442 | 100 | 3.54 | 442 | 100 | 6.98 |
| [2] | Gender | ||||||
| [3] | Male | 232 | 52.49 | 3.47 | 232 | 52.49 | 7.21 |
| [4] | Female | 210 | 47.51 | 3.61 | 210 | 47.51 | 6.78 |
| [5] | Minority | ||||||
| [6] | Han Chinese | 390 | 88.24 | 3.54 | 390 | 88.24 | 6.71 |
| [7] | non-Han Chinese | 52 | 11.76 | 3.62 | 52 | 11.76 | 9.06 |
| [8] | Age | ||||||
| [9] | 10 | 220 | 49.77 | 3.43 | |||
| [10] | 11 | 222 | 50.23 | 3.66 | |||
| [11] | 14 | 220 | 49.77 | 7.00 | |||
| [12] | 15 | 222 | 50.23 | 6.79 | |||
| [13] | Did you board at your school? | ||||||
| [14] | 0 = no | 386 | 87.33 | 3.47 | 207 | 46.83 | 7.16 |
| [15] | 1 = yes | 56 | 12.67 | 4.05 | 235 | 53.17 | 6.83 |
| [16] | How would you rate your health status? | ||||||
| [17] | 1 = excellent | 333 | 75.34 | 3.20 | 126 | 28.51 | 5.71 |
| [18] | 2 = very good | 93 | 21.04 | 4.41 | 155 | 35.07 | 6.35 |
| [19] | 3 = good | 10 | 2.26 | 3.20 | 131 | 29.64 | 8.47 |
| [20] | 4 = fair | 5 | 1.13 | 10.00 | 24 | 5.43 | 9.25 |
| [21] | 5 = poor | 1 | 0.23 | 9.00 | 6 | 1.36 | 8.50 |
| Total | CLP | LBC | LBCF | ||||
|---|---|---|---|---|---|---|---|
| Mean | Mean | Mean | H0:(3) = (2) | Mean | H0:(5) = (2) | ||
| (s.e.) | (s.e.) | (s.e.) | Difference | (s.e.) | Difference | ||
| [1] | [2] | [3] | [4] a | [5] | [6] b | ||
| [1] | Male in 2014, 1 = yes 0 = no | 0.47 | 0.47 | 0.51 | 0.04 | 0.38 | −0.09 |
| (0.50) | (0.50) | (0.50) | (0.05) | (0.49) | (0.08) | ||
| [2] | Age in 2014 | 10.50 | 14.49 | 14.49 | 0.00 | 14.52 | 0.03 |
| (0.50) | (0.51) | (0.52) | (0.00) | (0.50) | (0.01) | ||
| [3] | Minority in 2014, 1 = yes 0 = no | 0.12 | 0.99 | 1.00 | 0.01 | 1.00 | 0.01 |
| (0.32) | (0.10) | (0.00) | (0.29) | (0.00) | (0.08) | ||
| [4] | Board in 2014, 1 = yes 0 = no | 0.13 | 0.38 | 0.85 | 0.47 *** | 0.38 | 0.00 |
| (0.33) | (0.49) | (0.35) | (0.05) | (0.49) | (0.08) | ||
| [5] | Family net income per person in 2014 | 4396.92 | 7911.53 | 8213.26 | 301.73 *** | 9767.28 | 1856.00 |
| (4647.06) | (9111.72) | (5991.50) | (884.71) | (7707.61) | (1292.00) | ||
| [6] | Self-report health in 2014 | 1.30 | 2.04 | 2.23 | 0.19 ** | 2.08 | 0.04 |
| (0.59) | (0.95) | (0.89) | (0.03) | (0.90) | (0.14) | ||
| Dependent Variable: The Difference of Depression Score (Score14-Score10) | Restricted & Unadjusted | Unrestricted & Unadjusted | Restricted & Unadjusted | Restricted & Adjusted | |
|---|---|---|---|---|---|
| [1] | [2] | [3] | [4] | ||
| [1] | LBCs in 2014, 1 = yes 0 = no | 1.955 * | 1.827 ** | 2.861 ** | 1.973 * |
| (1.049) | (0.883) | (1.283) | (1.030) | ||
| [2] | Male in 2014, 1 = yes 0 = no | 0.490 | 0.512 | 0.033 | −0.009 |
| (1.022) | (0.888) | (1.003) | (0.860) | ||
| [3] | LBCFs in 2014 1 = yes 0 = no | −2.543 | −1.868 | −3.064 | −2.450 |
| (2.439) | (1.977) | (2.451) | (1.995) | ||
| [4] | (LBCFs in 2014) * (Male in 2014) | −0.133 | 1.945 | −0.028 | 2.053 |
| (2.375) | (2.040) | (2.510) | (2.006) | ||
| [5] | Age in 2014 | −1.733 * | −1.290 | ||
| (0.966) | (0.851) | ||||
| [6] | Minority in 2014, 1 = yes 0 = no | −7.182 *** | −10.736 *** | ||
| (1.612) | (2.686) | ||||
| [7] | Board in 2014, 1 = yes 0 = no | −2.001 | −0.842 | ||
| (1.464) | (1.233) | ||||
| [8] | The log of family income per person in 2014 (Yuan) | −0.673 * | −0.266 | ||
| (0.396) | (0.376) | ||||
| [9] | Health self-report in 2014 | 0.370 | 0.514 | ||
| (0.600) | (0.499) | ||||
| [10] | Standardized depression report in 2010 | −3.417 *** | −3.494 *** | ||
| (0.530) | (0.533) | ||||
| [11] | Constant | 2.510 ** | −0.620 | 44.205 *** | 32.414 ** |
| (1.022) | (1.003) | (13.906) | (12.765) | ||
| [12] | County dummy | yes | yes | yes | yes |
| [13] | Observations | 442 | 442 | 415 | 415 |
| [14] | R-squared | 0.627 | 0.722 | 0.669 | 0.762 |
| Treatment Variable: Left-Behind Children, 1 = Yes 0 = No | Matching | Difference-in-Difference Matching | |
|---|---|---|---|
| [1] | [2] | ||
| [1] | Propensity score matching | ||
| [2] | Coefficient | 1.147 * | 2.162 ** |
| [3] | Std. error | (0.600) | (1.046) |
| [4] | County dummy a | Yes | Yes |
| [5] | Control variables b | Yes | Yes |
| [6] | Bias corrected matching | ||
| [7] | Coefficient | 2.707 *** | 2.731 *** |
| [8] | Std. error | (0.901) | (0.898) |
| [9] | County dummy | Yes | Yes |
| [10] | Control variables | Yes | Yes |
| Standardized Depression Scores | Coeff. | Std. Error | Obs. | R-Square | |
|---|---|---|---|---|---|
| [1] | [2] | [3] | [4] | ||
| [1] | Parenting effect | ||||
| [2] | Only mother migrate matching all children in 2014 a | 1.668 ** | (0.653) | 415 | 0.016 |
| [3] | Only father migrate matching all children in 2014 | 0.751 | (0.638) | 413 | 0.003 |
| [4] | LBCF2014 matching LBC2014 b | 2.105 * | (1.104) | 175 | 0.021 |
| [5] | Income effect | ||||
| [6] | Family income in 2010 | −0.669 | (0.658) | 415 | 0.002 |
| [7] | Family income increased | −0.182 | (0.654) | 413 | 0.000 |
| [8] | CLP2014 matching LBCF2014 c | −0.381 | (1.016) | 246 | 0.001 |
| [9] | Both parenting and income effect | ||||
| [10] | CLP2014 matching LBC2014 d | 1.724 ** | (0.721) | 327 | 0.017 |
© 2018 by the authors. Licensee MDPI, Basel, Switzerland. This article is an open access article distributed under the terms and conditions of the Creative Commons Attribution (CC BY) license (http://creativecommons.org/licenses/by/4.0/).
Share and Cite
Zhou, M.; Sun, X.; Huang, L.; Zhang, G.; Kenny, K.; Xue, H.; Auden, E.; Rozelle, S. Parental Migration and Left-Behind Children’s Depressive Symptoms: Estimation Based on a Nationally-Representative Panel Dataset. Int. J. Environ. Res. Public Health 2018, 15, 1069. https://doi.org/10.3390/ijerph15061069
Zhou M, Sun X, Huang L, Zhang G, Kenny K, Xue H, Auden E, Rozelle S. Parental Migration and Left-Behind Children’s Depressive Symptoms: Estimation Based on a Nationally-Representative Panel Dataset. International Journal of Environmental Research and Public Health. 2018; 15(6):1069. https://doi.org/10.3390/ijerph15061069
Chicago/Turabian StyleZhou, Mi, Xiaotong Sun, Li Huang, Guangsheng Zhang, Kaleigh Kenny, Hao Xue, Emma Auden, and Scott Rozelle. 2018. "Parental Migration and Left-Behind Children’s Depressive Symptoms: Estimation Based on a Nationally-Representative Panel Dataset" International Journal of Environmental Research and Public Health 15, no. 6: 1069. https://doi.org/10.3390/ijerph15061069
APA StyleZhou, M., Sun, X., Huang, L., Zhang, G., Kenny, K., Xue, H., Auden, E., & Rozelle, S. (2018). Parental Migration and Left-Behind Children’s Depressive Symptoms: Estimation Based on a Nationally-Representative Panel Dataset. International Journal of Environmental Research and Public Health, 15(6), 1069. https://doi.org/10.3390/ijerph15061069