Residents’ Self-Reported Health Effects and Annoyance in Relation to Air Pollution Exposure in an Industrial Area in Eastern-Estonia

 ,
,
Abstract
1. Introduction
2. Materials and Methods
2.1. Questionnaire Study
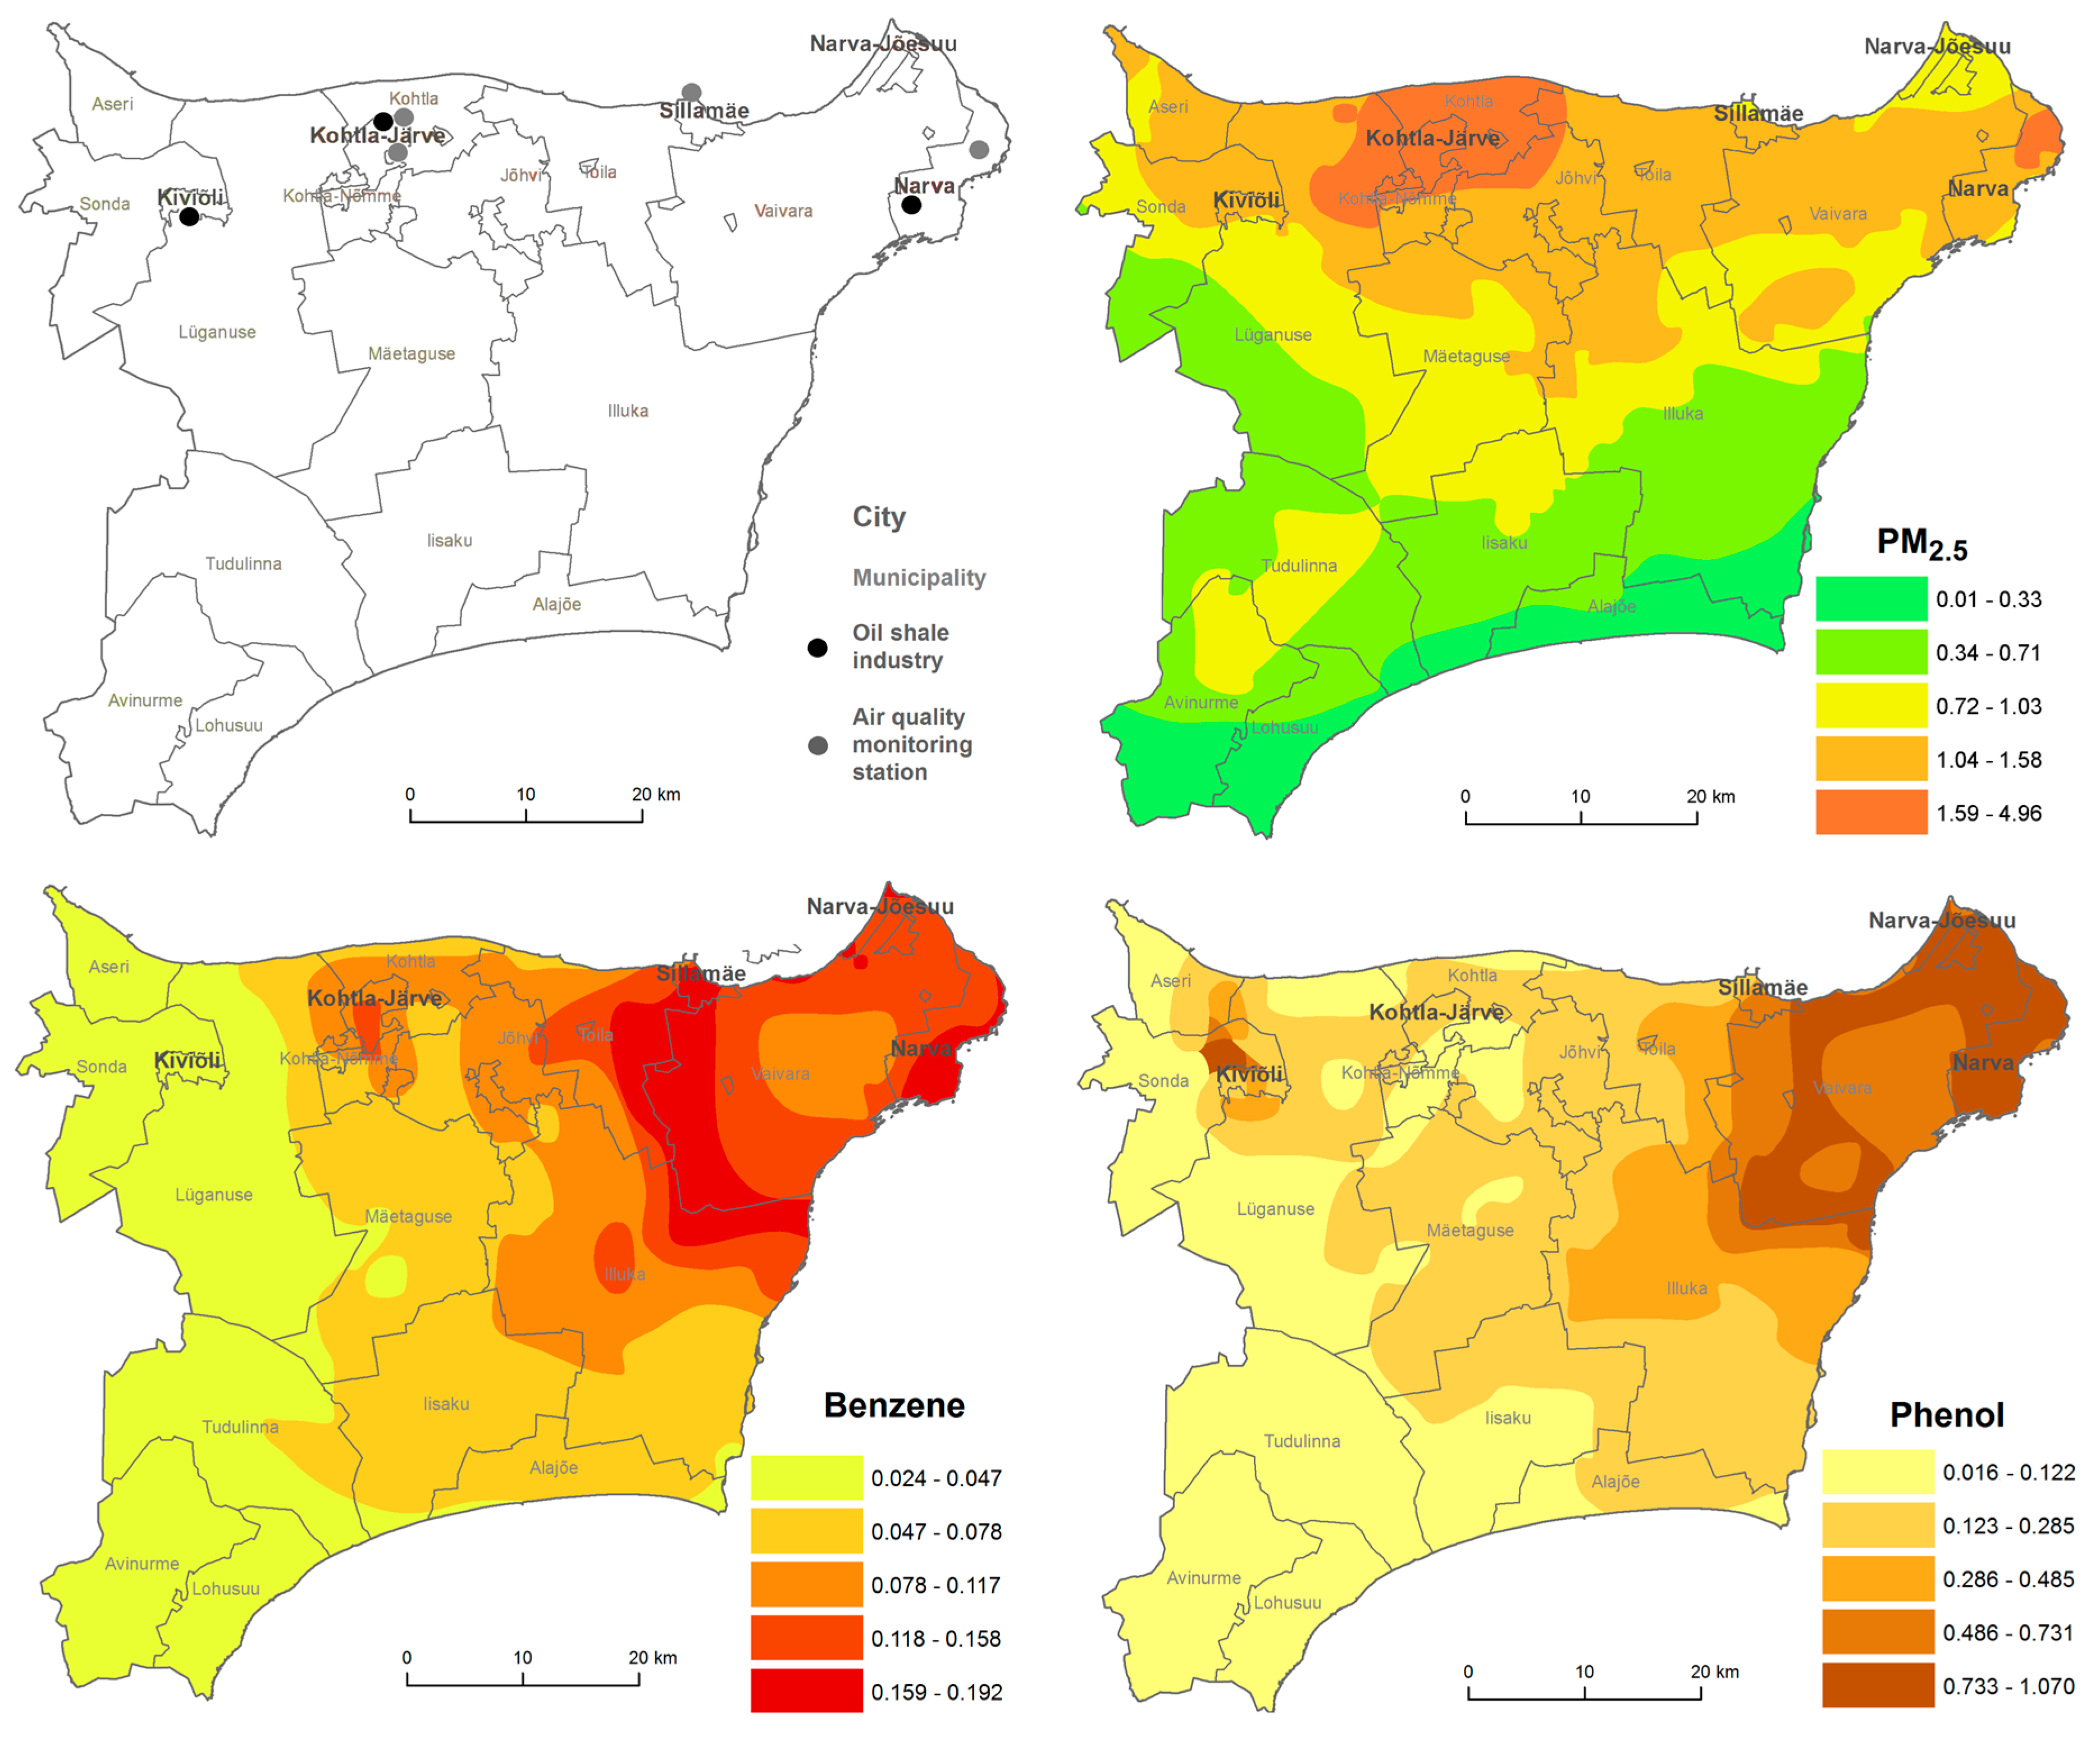
2.2. Air Quality Monitoring and Pollution Dispersion Modelling
2.3. Statistical Analysis
3. Results
3.1. Prevalence of Respiratory Symptoms and Chronic Health Effects
3.2. Monitored and Modelled Air Pollution Levels in Ida-Viru County
3.3. The Relationship between Air Quality and the Health Situation in Ida-Viru County
3.4. Annoyance by Socio-Demographic Group and Relationships with Health Complaints
4. Discussion
5. Conclusions
Acknowledgments
Author Contributions
Conflicts of Interest
Appendix A. Used Questions
- Gender—“Are you male or female?”
- Age—Calculation based on “What is your date of birth?”, and “What is today’s date?”
- Body mass index (BMI)—calculated as (weight (kg))/height2 (m)) based on “How much do you weigh?”, and “How tall are you?”
- Ethnicity—“What ethnicity you belong to?”
- Education—“Please mark the educational level which best describes your level.”
- Self-assessed health status—“How would you rate your health today?”
- Marital status—“What is your current marital status?”
- Current smoker—“Do you smoke? (this applies even if you only smoke the odd cigarette/cigar or pipe every week)”
- Ex-smoker—“Did you smoke previously?”
- Monthly net income during the last 12 months per family member—“How large was the monthly net income during the last 12 months per family member”
- Wheezing without a cold—“Have you had wheezing or whistling in your chest at any time in the last 12 months?”, and if so, “Have you had this wheezing or whistling when you did not have a cold?”
- Chest tightness—“Have you woken up with a feeling of tightness in your chest at any time in the last 12 months?”
- Shortness of breath—“Have you been woken by an attack of shortness of breath at any time in the last 12 months?”
- Attack of coughing—“Have you been woken by an attack of coughing at any time in the last 12 months?”
- Asthma attack—“Have you had an attack of asthma in the last 12 months?”
- Wheezing—“Have you ever had wheezing or whistling in your chest?”
- Long-term cough—“In recent years, have you been troubled by a protracted cough?”
- Allergic rhinitis—“Have you ever experienced nasal symptoms such as nasal congestion, rhinorrhoea (runny nose) and/or sneezing attacks without having a cold?”, and if “Yes”; “Yes” to question “Do you have any nasal allergies including hay fever?”
- Asthma—“Have you ever had asthma diagnosed by a doctor?”
- COPD—“Has a doctor ever told you that you have chronic obstructive pulmonary disease (COPD)?”
- Hypertension—“Have you ever had hypertension (high blood pressure) diagnosed by a doctor?”
- Heart diseases—“Do you have any heart disease?”
- Myocardial infarction—“Have you ever been treated in hospital because of heart infarction?”
- Stroke—“Have you ever had stroke?”
- Diabetes—“Have you ever had diabetes diagnosed by a doctor?”
- Smoking history—“Are you a smoker?” and “Are you an ex-smoker?”; defining “never smokers”, “current smokers” and “ex-smokers”.
- Annoyance with air pollution—“How annoyed are you due to air pollution (from traffic, industry etc.) if you have opened the window?
Appendix B.


Appendix C.

| Crude Model | |||
| PM2.5 | Benzene | Phenol | |
| During the last 12 months | |||
| Wheezing without a cold | 1.03 (0.94–1.13) | 1.06 (0.98–1.38) | 1.28 (0.95–1.71) |
| Chest tightness | 1.11 (1.01–1.22) | 1.28 (0.97–1.67) | 1.41 (1.05–1.88) |
| Shortness of breath | 1.09 (0.98–1.22) | 1.26 (0.92–1.73) | 1.21 (0.86–1.70) |
| Attack of coughing | 1.03 (0.94–1.13) | 0.90 (0.84–1.15) | 0.89 (0.68–1.17) |
| Asthma attack | 1.20 (1.04–1.38) | 1.24 (0.93–2.00) | 0.64 (0.36–1.12) |
| Ever had | |||
| Wheezing | 1.07 (0.98–1.18) | 1.31 (1.00–1.71) | 1.22 (0.91–1.64) |
| Long-term cough | 1.00 (0.91–1.11) | 1.32 (1.00–1.74) | 1.42 (1.06–1.91) |
| Allergic rhinitis | 1.03 (0.92–1.16) | 0.89 (0.64–1.23) | 0.86 (0.59–1.26) |
| Asthma | 1.11 (0.96–1.30) | 1.39 (0.85–2.26) | 0.80 (0.46–1.39) |
| COPD | 1.09 (0.84–1.41) | 1.59 (0.69–1.77) | 2.07 (0.90–4.76) |
| Hypertension | 1.03 (0.94–1.13) | 1.16 (0.89–1.51) | 1.21 (0.90–1.62) |
| Heart disease | 1.07 (0.95–1.20) | 1.44 (1.01–2.05) | 1.53 (1.06–2.21) |
| Myocardial infarction | 0.95 (0.79–1.14) | 2.03 (1.22–3.39) | 2.23 (1.36–3.64) |
| Stroke | 0.95 (0.73–1.24) | 1.32 (0.65–2.67) | 1.34 (0.65–2.78) |
| Diabetes | 0.97 (0.83–1.13) | 1.42 (0.92–2.19) | 1.33 (0.85–2.10) |
| Only Estonians in Ida-Viru County | |||
| PM2.5 | Benzene | Phenol | |
| During the last 12 months * | |||
| Wheezing without a cold | 0.96 (0.76–1.21) | 0.96 (0.56–1.64) | 0.97 (0.83–1.21) |
| Chest tightness | 1.17 (0.93–1.46) | 1.27 (0.72–2.23) | 1.07 (0.92–1.23) |
| Shortness of breath | 1.23 (0.95–1.59) | 2.36 (1.20–2.04) | 1.12 (0.95–1.31) |
| Attack of coughing | 1.08 (0.88–1.33) | 0.96 (0.59–1.56) | 0.96 (0.84–1.09) |
| Asthma attack | 1.25 (0.89–1.77) | 1.12 (0.68–1.68) | 0.99 (0.71–1.37) |
| Ever had * | |||
| Wheezing | 1.05 (0.84–1.32) | 1.17 (0.67–2.04) | 0.96 (0.83–1.12) |
| Long-term cough | 1.24 (0.98–1.58) | 1.09 (0.61–1.96) | 1.01 (0.86–1.18) |
| Allergic rhinitis | 1.00 (0.76–1.32) | 0.63 (0.62–1.19) | 0.76 (0.59–0.97) |
| Asthma | 0.78 (0.48–1.27) | 0.93 (0.66–2.52) | 1.03 (0.81–1.31) |
| COPD | - | - | 0.40 (0.05–3.36) |
| Hypertension | 1.14 (0.89–1.47) | 1.49 (0.79–2.83) | 1.19 (1.00–1.40) |
| Heart disease | 0.96 (0.65–1.42) | 0.93 (0.67–2.25) | 1.06 (0.85–1.31) |
| Myocardial infarction | 0.96 (0.48–1.92) | 1.38 (0.67–2.19) | 1.23 (0.88–1.72) |
| Stroke | 0.83 (0.09–7.58) | 0.55 (0.13–2.06) | 0.91 (0.48–1.72) |
| Diabetes | 0.83 (0.49–1.40) | 1.21 (0.70–1.90) | 0.95 (0.67–1.34) |
| Only non-Estonians in Ida-Viru County | |||
| PM2.5 | Benzene | Phenol | |
| During the last 12 months * | |||
| Wheezing without a cold | 1.04 (0.91–1.18) | 1.03 (0.77–1.38) | 1.52 (1.02–2.25) |
| Chest tightness | 1.09 (0.96–1.25) | 1.11 (0.82–1.49) | 1.35 (0.91–2.01) |
| Shortness of breath | 1.13 (0.98–1.31) | 0.81 (0.58–1.13) | 0.96 (0.61–1.52) |
| Attack of coughing | 1.05 (0.93–1.19) | 1.02 (0.77–1.36) | 1.05 (0.72–1.53) |
| Asthma attack | 1.22 (1.02–1.46) | 0.99 (0.61–1.61) | 0.47 (0.23–0.98) |
| Ever had * | |||
| Wheezing | 1.11 (0.97–1.26) | 1.02 (0.77–1.36) | 1.08 (0.73–1.59) |
| Long-term cough | 0.92 (0.80–1.05) | 1.14 (0.85–1.53) | 1.41 (0.96–2.08) |
| Allergic rhinitis | 1.12 (0.95–1.31) | 1.15 (0.80–1.66) | 1.15 (0.71–1.88) |
| Asthma | 1.10 (0.90–1.35) | 1.11 (0.65–1.86) | 0.66 (0.32–1.37) |
| COPD | 1.15 (0.77–1.72) | 1.26 (0.54–2.92) | 1.82 (0.59–5.59) |
| Hypertension | 1.09 (0.95–1.26) | 0.93 (0.68–1.28) | 0.92 (0.60–1.42) |
| Heart disease | 1.15 (0.98–1.35) | 1.01 (0.70–1.47) | 1.02 (0.62–1.67) |
| Myocardial infarction | 0.96 (0.76–1.22) | 1.49 (0.88–2.50) | 1.74 (0.92–3.29) |
| Stroke | 0.99 (0.72–1.35) | 1.11 (0.57–2.16) | 0.85 (0.35–2.09) |
| Diabetes | 1.04 (0.84–1.27) | 1.26 (0.79–2.03) | 1.22 (0.66–2.24) |
| Only those, who have been working in oil shale sector | |||
| PM2.5 | Benzene | Phenol | |
| During the last 12 months * | |||
| Wheezing without a cold | 1.33 (1.05–1.70) | 1.03 (0.63–1.69) | 1.08 (0.75–1.57) |
| Chest tightness | 1.10 (0.87–1.40) | 1.47 (0.88–2.44) | 1.37 (0.95–1.97) |
| Shortness of breath | 1.24 (0.96–1.61) | 0.89 (0.49–1.59) | 1.15 (0.75–1.76) |
| Attack of coughing | 1.02 (0.82–1.28) | 1.08 (0.67–1.72) | 0.98 (0.69–1.38) |
| Asthma attack | 1.93 (1.30–2.86) | 2.52 (0.83–7.63) | 0.61 (0.26–1.45) |
| Ever had * | |||
| Wheezing | 1.36 (1.06–1.74) | 1.06 (0.65–1.73) | 0.87 (0.60–1.27) |
| Long-term cough | 0.99 (0.77–1.28) | 1.30 (0.77–2.19) | 1.41 (0.97–2.07) |
| Allergic rhinitis | 1.27 (0.88–1.82) | 0.99 (0.49–2.02) | 0.86 (0.49–1.51) |
| Asthma | 1.47 (1.01–2.15) | 3.50 (1.01–12.11) | 0.84 (0.55–1.27) |
| COPD | 0.55 (0.04–7.84) | 2.16 (0.26–17.91) | 1.33 (0.37–4.70) |
| Hypertension | 1.27 (0.97–1.67) | 1.00 (0.58–1.72) | 0.89 (0.59–1.32) |
| Heart disease | 1.11 (0.82–1.50) | 1.26 (0.68–2.36) | 1.30 (0.84–2.02) |
| Myocardial infarction | 0.71 (0.38–1.32) | 2.26 (0.95–5.37) | 1.60 (0.91–2.81) |
| Stroke | 0.51 (0.20–1.27) | 0.74 (0.26–2.12) | 1.39 (0.72–2.67) |
| Diabetes | 1.20 (0.86–1.68) | 1.58 (0.72–3.48) | 0.95 (0.65–1.38) |
| Only those, who have not been working in oil shale sector | |||
| PM2.5 | Benzene | Phenol | |
| During the last 12 months * | |||
| Wheezing without a cold | 0.97 (0.84–1.12) | 0.99 (0.68–1.44) | 1.24 (0.82–1.87) |
| Chest tightness | 1.17 (1.02–1.35) * | 1.30 (0.88–1.91) | 1.30 (0.86–1.96) |
| Shortness of breath | 1.15 (0.98–1.35) | 1.26 (0.80–1.99) | 1.11 (0.68–1.81) |
| Attack of coughing | 1.03 (0.90–1.18) | 0.91 (0.64–1.28) | 0.91 (0.62–1.34) |
| Asthma attack | 1.07 (0.86–1.34) | 0.76 (0.41–1.41) | 0.58 (0.27–1.25) |
| Ever had * | |||
| Wheezing | 1.04 (0.90–1.19) | 1.13 (0.78–1.64) | 1.14 (0.76–1.72) |
| Long-term cough | 0.98 (0.85–1.13) | 1.34 (0.92–1.95) | 1.33 (0.89–2.00) |
| Allergic rhinitis | 1.05 (0.90–1.24) | 0.80 (0.52–1.24) | 0.74 (0.45–1.21) |
| Asthma | 0.91 (0.69–1.18) | 0.81 (0.42–1.55) | 0.72 (0.33–1.57) |
| COPD | 1.30 (0.88–1.92) | 1.98 (0.62–6.31) | 1.87 (0.62–5.64) |
| Hypertension | 1.04 (0.89–1.21) | 1.16 (0.77–1.74) | 1.34 (0.86–2.10) |
| Heart disease | 1.25 (0.92–1.35) | 1.24 (0.73–2.11) | 1.23 (0.70–2.16) |
| Myocardial infarction | 1.08 (0.82–1.43) | 2.07 (0.93–1.06) | 2.26 (1.04–4.88) * |
| Stroke | 1.08 (0.69–1.69) | 3.85 (0.85–17.49) | 1.85 (0.54–6.28) |
| Diabetes | 0.88 (0.65–1.19) | 1.25 (0.66–2.40) | 0.91 (0.45–1.84) |
Appendix D.
| Ida-Viru County | Lääne-Viru County | Tartu | Chi2 | p Value | |
|---|---|---|---|---|---|
| Total | 22.4 | 14.9 | 11.8 | 36.70 | 0.000 |
| Gender | |||||
| Male | 22.4 | 14.9 | 11.8 | 36.70 | 0.000 |
| Female | 25.5 | 15.6 | 13.2 | 28.25 | 0.006 |
| Age | |||||
| 18–27 | 19.5 | 20.0 | 13.3 | 2.24 | 0.327 |
| 28–37 | 24.5 | 11.1 | 11.0 | 12.68 | 0.002 |
| 38–47 | 18.4 | 9.1 | 10.1 | 7.15 | 0.028 |
| 48–57 | 24.5 | 15.6 | 46.2 | 5.28 | 0.071 |
| 58–67 | 24.3 | 20.0 | 22.2 | 0.31 | 0.855 |
| 68+ | 17.5 | 14.3 | 0 | 0.65 | 0.721 |
| Ethnicity | |||||
| Estonian | 18.5 | 13.7 | 10.0 | 13.70 | 0.001 |
| Non-Estonian | 24.2 | 17.9 | 21.9 | 0.85 | 0.655 |
| Monthly average net income during the last 12 months per family member | |||||
| Under 100 € | 26.5 | 50.0 | 21.1 | 0.85 | 0.655 |
| 100–299 € | 22.3 | 10.3 | 15.4 | 4.08 | 0.130 |
| 300–499 € | 22.8 | 15.3 | 15.0 | 5.93 | 0.052 |
| 500–799 € | 15.2 | 12.5 | 9.0 | 3.95 | 0.139 |
| 800–999 € | 28.8 | 25.0 | 9.5 | 11.92 | 0.003 |
| Over 1000 € | 28.6 | 16.7 | 8.2 | 11.62 | 0.003 |
| Education | |||||
| Elementary or basic | 25.4 | 13.3 | 16.7 | 2.00 | 0.369 |
| Secondary | 20.9 | 14.2 | 13.1 | 10.70 | 0.005 |
| Applied or higher | 24.2 | 17.9 | 10.3 | 24.59 | 0.000 |
| Self-assessed health status | |||||
| Very good | 14.3 | 23.1 | 6.1 | 6.17 | 0.046 |
| Good | 17.3 | 7.2 | 10.1 | 9.70 | 0.008 |
| Average | 21.5 | 16.2 | 17.2 | 1.74 | 0.420 |
| Bad | 37.9 | 10.9 | 27.0 | 1.37 | 0.504 |
| Very bad | 20.0 | 0 | 0 | 35.50 | 0.000 |
| During the last 12 months | |||||
| Chest tightness | 36.6 | 27.0 | 22.9 | 8.46 | 0.015 |
| Shortage of breath | 38.4 | 34.8 | 28.8 | 2.49 | 0.288 |
| Asthma attack | 33.3 | 40.0 | 21.4 | 2.27 | 0.321 |
| Ever had | |||||
| Wheezing | 34.0 | 22.9 | 21.7 | 7.80 | 0.020 |
| Long-term cough | 28.9 | 25.0 | 19.8 | 4.82 | 0.090 |
| Allergic rhinitis | 25.8 | 18.8) | 15.3 | 6.54 | 0.038 |
| Asthma | 31.7 | 36.4 | 12.3 | 8.02 | 0.018 |
| COPD | 30.0 | 33.3 | 30.0 | 0.01 | 0.993 |
References
- Gavrilova, O.; Randla, T.; Vallner, L.; Strandberg, M.; Vilu, R. Life Cycle Analysis of the Estonian Oil Shale Industry; Estonian Fund of Nature, Tallinn University of Technology: Tallinn, Estonia, 2005. [Google Scholar]
- Ministry of the Environment. National Development Plan for the Use of Oil Shale 2016–2030; Ministry of the Environment: Tallinn, Estonia, 2016; p. 75. [Google Scholar]
- Beger, M. Eesti Põlevkivitööstuse Aastaraamat 2016; Kompetentsikeskuse Laboris: Kohtla-Järve, Estonia, 2017. [Google Scholar]
- Organization for Economic Cooperation and Development (OECD); Economic Commission for Latin America and the Caribbean (ECLAC). Oecd Environmental Performance Reviews: Estonia 2016; OECD Publishing: Paris, UK, 2016. [Google Scholar]
- Office of Technology Assessment. An Assessment of Oil Shale Technologies; United States Government Printing Office: Washington, DC, USA, 1980. [Google Scholar]
- Etlin, S. Гигиенические Основы Охраны Атмосферного Воздуха в Районе Размещения Предприятий Сланцевой Химии и Энергетики. Ph.D. Thesis, Moscow, Russia, 1989. [Google Scholar]
- Sorensen, M.; Poole, J.; Autrup, H.; Muzyka, V.; Jensen, A.; Loft, S.; Knudsen, L.E. Benzene exposure assessed by metabolite excretion in Estonian oil shale mineworkers: Influence of glutathione S-transferase polymorphisms. Cancer Epidemiol. Biomarkers Prev. 2004, 13, 1729–1735. [Google Scholar] [PubMed]
- Muzyka, V.; Scheepers, P.T.; Bogovski, S.; Lang, I.; Schmidt, N.; Ryazanov, V.; Veidebaum, T. Porphyrin metabolism in lymphocytes of miners exposed to diesel exhaust at oil shale mine. Sci. Total Environ. 2004, 322, 41–50. [Google Scholar] [CrossRef]
- Anderson, D.; Hughes, J.A.; Brinkworth, M.H.; Cebulska-Wasilewska, A.; Nizankowska, E.; Graca, B.; Veidebaum, T.; Peltonen, K.; Sorsa, M. Examination of ras oncoproteins in human plasma from healthy controls and workers exposed to petroleum emissions, including benzene-related compounds. Mutat. Res. 1999, 445, 167–173. [Google Scholar] [CrossRef]
- Kuljukka, T.; Vaaranrinta, R.; Veidebaum, T.; Sorsa, M.; Peltonen, K. Exposure to PAH compounds among cokery workers in the oil shale industry. Environ. Health Perspect. 1996, 104, 539–541. [Google Scholar] [CrossRef] [PubMed]
- Kivisto, H.; Pekari, K.; Peltonen, K.; Svinhufvud, J.; Veidebaum, T.; Sorsa, M.; Aitio, A. Biological monitoring of exposure to benzene in the production of benzene and in a cokery. Sci. Total Environ. 1997, 199, 49–63. [Google Scholar] [CrossRef]
- Marcon, F.; Zijno, A.; Crebelli, R.; Carere, A.; Veidebaum, T.; Peltonen, K.; Parks, R.; Schuler, M.; Eastmond, D. Chromosome damage and aneuploidy detected by interphase multicolour FISH in benzene-exposed shale oil workers. Mutat. Res. 1999, 445, 155–166. [Google Scholar] [CrossRef]
- Martuzzi, M.; Pasetto, R.; Martin-Olmedo, P. Industrially contaminated sites and health. J. Environ. Public Health 2014, 2014. [Google Scholar] [CrossRef] [PubMed]
- Pascal, M.; Pascal, L.; Bidondo, M.-L.; Cochet, A.; Sarter, H.; Stempfelet, M.; Wagner, V. A review of the epidemiological methods used to investigate the health impacts of air pollution around major industrial areas. J. Environ. Public Health 2013, 2013. [Google Scholar] [CrossRef] [PubMed]
- Rom, W.N.; Lee, J.S.; Craft, B.F. Occupational and environmental health problems of the developing oil shale industry: A review. Am. J. Ind. Med. 1981, 2, 247–260. [Google Scholar] [CrossRef] [PubMed]
- Pirastu, R.; Pasetto, R.; Zona, A.; Ancona, C.; Iavarone, I.; Martuzzi, M.; Comba, P. The health profile of populations living in contaminated sites: Sentieri approach. J. Environ. Public Health 2013, 2013. [Google Scholar] [CrossRef] [PubMed]
- Comba, P.; Ricci, P.; Iavarone, I.; Pirastu, R.; Buzzoni, C.; Fusco, M.; Ferretti, S.; Fazzo, L.; Pasetto, R.; Zona, A.; et al. Cancer incidence in Italian contaminated sites. Ann. Ist. Super. Sanita 2014, 50, 186–191. [Google Scholar] [PubMed]
- Pasetto, R.; Zona, A.; Pirastu, R.; Cernigliaro, A.; Dardanoni, G.; Addario, S.P.; Scondotto, S.; Comba, P. Mortality and morbidity study of petrochemical employees in a polluted site. Environ. Health 2012, 11, 34. [Google Scholar] [CrossRef] [PubMed]
- Pirastu, R.; Comba, P.; Iavarone, I.; Zona, A.; Conti, S.; Minelli, G.; Manno, V.; Mincuzzi, A.; Minerba, S.; Forastiere, F.; et al. Environment and health in contaminated sites: The case of Taranto, Italy. J. Environ. Public Health 2013, 2013. [Google Scholar] [CrossRef] [PubMed]
- Ancona, C.; Badaloni, C.; Mataloni, F.; Bolignano, A.; Bucci, S.; Cesaroni, G.; Sozzi, R.; Davoli, M.; Forastiere, F. Mortality and morbidity in a population exposed to multiple sources of air pollution: A retrospective cohort study using air dispersion models. Environ. Res. 2015, 137, 467–474. [Google Scholar] [CrossRef] [PubMed]
- Sans, S.; Elliott, P.; Kleinschmidt, I.; Shaddick, G.; Pattenden, S.; Walls, P.; Grundy, C.; Dolk, H. Cancer incidence and mortality near the Baglan Bay petrochemical works, South Wales. Occup. Environ. Med. 1995, 52, 217–224. [Google Scholar] [CrossRef] [PubMed]
- Petrauskaite, R.; Pershagen, G.; Gurevicius, R. Lung cancer near an industrial site in Lithuania with major emissions of airway irritants. Int. J. Cancer 2002, 99, 106–111. [Google Scholar] [CrossRef] [PubMed]
- Belli, S.; Benedetti, M.; Comba, P.; Lagravinese, D.; Martucci, V.; Martuzzi, M.; Morleo, D.; Trinca, S.; Viviano, G. Case-control study on cancer risk associated to residence in the neighbourhood of a petrochemical plant. Eur. J. Epidemiol. 2004, 19, 49–54. [Google Scholar] [CrossRef] [PubMed]
- Edwards, R.; Pless-Mulloli, T.; Howel, D.; Chadwick, T.; Bhopal, R.; Harrison, R.; Gribbin, H. Does living near heavy industry cause lung cancer in women? A case-control study using life grid interviews. Thorax 2006, 61, 1076–1082. [Google Scholar] [CrossRef] [PubMed]
- Tsai, S.S.; Tiao, M.M.; Kuo, H.W.; Wu, T.N.; Yang, C.Y. Association of bladder cancer with residential exposure to petrochemical air pollutant emissions in Taiwan. J. Toxicol. Environ. Health Part A 2009, 72, 53–59. [Google Scholar] [CrossRef] [PubMed]
- Wilkinson, P.; Thakrar, B.; Walls, P.; Landon, M.; Falconer, S.; Grundy, C.; Elliott, P. Lymphohaematopoietic malignancy around all industrial complexes that include major oil refineries in Great Britain. Occup. Environ. Med. 1999, 56, 577–580. [Google Scholar] [CrossRef] [PubMed]
- Axelsson, G.; Barregard, L.; Holmberg, E.; Sallsten, G. Cancer incidence in a petrochemical industry area in Sweden. Sci. Total Environ. 2010, 408, 4482–4487. [Google Scholar] [CrossRef] [PubMed]
- Tsai, S.P.; Cardarelli, K.M.; Wendt, J.K.; Fraser, A.E. Mortality patterns among residents in Louisiana’s industrial corridor, USA, 1970–1999. Occup. Environ. Med. 2004, 61, 295–304. [Google Scholar] [CrossRef] [PubMed]
- Simonsen, N.; Scribner, R.; Su, L.J.; Williams, D.; Luckett, B.; Yang, T.; Fontham, E.T. Environmental exposure to emissions from petrochemical sites and lung cancer: The lower Mississippi interagency cancer study. J. Environ. Public Health 2010, 2010. [Google Scholar] [CrossRef] [PubMed]
- Tsai, S.P.; Wendt, J.K.; Cardarelli, K.M.; Fraser, A.E. A mortality and morbidity study of refinery and petrochemical employees in Louisiana. Occup. Environ. Med. 2003, 60, 627–633. [Google Scholar] [CrossRef] [PubMed]
- Pignato, S.; Coniglio, M.; Rotondo, A.; Giammanco, G. Prevalence of self-reported asthma and respiratory allergic symptoms in young adults living near a heavy polluted industrial area in Sicily. J. Prev. Med. Hyg. 2004, 45, 40–44. [Google Scholar]
- Louw, S.J.; Cowie, H.A.; Seaton, A. Epidemiologic studies of Scottish oil shale workers: II. Lung function in shale workers’ pneumoconiosis. Am. J. Ind. Med. 1986, 9, 423–432. [Google Scholar] [CrossRef] [PubMed]
- Miller, B.G.; Cowie, H.A.; Middleton, W.G.; Seaton, A. Epidemiologic studies of Scottish oil shale workers: III. Causes of death. Am. J. Ind. Med. 1986, 9, 433–446. [Google Scholar] [CrossRef] [PubMed]
- Dubnov, J.; Barchana, M.; Rishpon, S.; Leventhal, A.; Segal, I.; Carel, R.; Portnov, B.A. Estimating the effect of air pollution from a coal-fired power station on the development of children’s pulmonary function. Environ. Res. 2007, 103, 87–98. [Google Scholar] [CrossRef] [PubMed]
- Brender, J.D.; Zhan, F.B.; Langlois, P.H.; Suarez, L.; Scheuerle, A. Residential proximity to waste sites and industrial facilities and chromosomal anomalies in offspring. Int. J. Hyg. Environ. Health 2008, 211, 50–58. [Google Scholar] [CrossRef] [PubMed]
- Berglund, B.; Berglund, U.; Lindvall, T. Measurement and control of annoyance. In Environmental Annoyance: Characterization, Measurement and Control; Koelga, H.S., Ed.; Elsevier: Amsterdam, The Netherlands, 1987; pp. 29–44. [Google Scholar]
- Claeson, A.S.; Liden, E.; Nordin, M.; Nordin, S. The role of perceived pollution and health risk perception in annoyance and health symptoms: A population-based study of odorous air pollution. Int. Arch. Occup. Environ. Health 2013, 86, 367–374. [Google Scholar] [CrossRef] [PubMed]
- Orru, K.; Nordin, S.; Harzia, H.; Orru, H. The role of perceived air pollution and health risk perception in health symptoms and disease: A population-based study combined with modelled levels of PM10. Int. Arch. Occup. Environ. Health 2018. under review. [Google Scholar]
- Oglesby, L.; Kunzli, N.; Monn, C.; Schindler, C.; Ackermann-Liebrich, U.; Leuenberger, P. Validity of annoyance scores for estimation of long term air pollution exposure in epidemiologic studies: The Swiss study on air pollution and lung diseases in adults (Sapaldia). Am. J. Epidemiol. 2000, 152, 75–83. [Google Scholar] [CrossRef] [PubMed]
- Sucker, K.; Both, R.; Bischoff, M.; Guski, R.; Winneke, G. Odor frequency and odor annoyance. Part I: Assessment of frequency, intensity and hedonic tone of environmental odors in the field. Int. Arch. Occup. Environ. Health 2008, 81, 671–682. [Google Scholar] [CrossRef] [PubMed]
- Stenlund, T.; Liden, E.; Andersson, K.; Garvill, J.; Nordin, S. Annoyance and health symptoms and their influencing factors: A population-based air pollution intervention study. Public Health 2009, 123, 339–345. [Google Scholar] [CrossRef] [PubMed]
- Lissaker, C.T.; Talbott, E.O.; Kan, H.; Xu, X. Status and determinants of individual actions to reduce health impacts of air pollution in US adults. Arch. Environ. Occup. Health 2016, 71, 43–48. [Google Scholar] [CrossRef] [PubMed]
- Orru, K.; Hendrikson, R.; Nordlund, A.; Nutt, N.; Veeber, T.; Orru, H. Environmental Health: Understanding Risks and Motivation for Coping; Estonian Health Board, Tartu University: Tartu, Estonia, 2015. [Google Scholar]
- Runeson-Broberg, R.; Norback, D. Sick building syndrome (SBS) and sick house syndrome (SHS) in relation to psychosocial stress at work in the Swedish workforce. Int. Arch. Occup. Environ. Health 2013, 86, 915–922. [Google Scholar] [CrossRef] [PubMed]
- European Environment Agency (EEA). Costs of Air Pollution from European Industrial Facilities 2008–2012—An Updated Assessment; European Environment Agency: Luxembourg, 2014. [Google Scholar]
- Orru, H.; Kimmel, V.; Kikas, Ü.; Soon, A.; Künzli, N.; Schins, R.P.F.; Borm, P.J.A.; Forsberg, B. Elemental composition and oxidative properties of PM2.5 in Estonia in relation to origin of air masses—Results from the ECRHS II in Tartu. Sci. Total Environ. 2010, 408, 1515–1522. [Google Scholar] [CrossRef] [PubMed]
- Maasikmets, M.; Saare, K.; Arumäe, T.; Lehes, L.; Viidik, A.; Ebber, A. Analysis of Complex Assessment of the Quality of Ambient Air in Estonian Towns; Estonian Environmental Research Centre: Tallinn, Estonia, 2013. [Google Scholar]
- Laan, B.; Komsaare, K.; Kaasik, M.; Hõrrak, U. Estimating the origin of background aerosol pollution in Estonia. In Proceedings of the 9th International Conference on Air Quality Science and Application, Hatfield, UK, 24–28 March 2014; Mitto, T., Fallmann, J., Mikolajczyk, U., Suppan, P., Singh, V., Sokhi, R., Eds.; University of Hertfordshire: Hatfield, UK, 2014; p. 247. [Google Scholar]
- Orru, H.; Maasikmets, M.; Lai, T.; Tamm, T.; Kaasik, M.; Kimmel, V.; Orru, K.; Merisalu, E.; Forsberg, B. Health impacts of particulate matter in five major Estonian towns: Main sources of exposure and local differences. Air Qual. Atmos. Health 2011, 4, 247–258. [Google Scholar] [CrossRef]
- Orru, H.; Jogi, R.; Kaasik, M.; Forsberg, B. Chronic traffic-induced PM exposure and self-reported respiratory and cardiovascular health in the RHINE Tartu Cohort. Int. J. Environ. Res. Public Health 2009, 6, 2740–2751. [Google Scholar] [CrossRef] [PubMed]
- Pindus, M.; Orru, H.; Modig, L. Close proximity to busy roads increases the prevalence and onset of cardiac disease—Results from RHINE Tartu. Public Health 2015, 129, 1398–1405. [Google Scholar] [CrossRef] [PubMed]
- Läll, K.; Raag, M.; Orru, H. Particulate air pollution and mortality in Tallinn: A time-series analysis in north-eastern European country. In Proceedings of the 2013 Conference of the International Society of Environmental Epidemiology (ISEE), the International Society of Exposure Science (ISES), and the International Society of Indoor Air Quality and Climate (ISIAQ), Basel, Switzerland, 19–23 August 2013; Environmental Health Perspectives: Research Triangle Park, NC, USA, 2013; p. 4177. [Google Scholar]
- Johannessen, A.; Verlato, G.; Benediktsdottir, B.; Forsberg, B.; Franklin, K.; Gislason, T.; Holm, M.; Janson, C.; Jogi, R.; Lindberg, E.; et al. Longterm follow-up in European respiratory health studies—Patterns and implications. BMC Pulm. Med. 2014, 14, 63. [Google Scholar] [CrossRef] [PubMed]
- AirViro. Working with the dispersion module. How to simulate the dispersion of pollutants. In SMHI AirviroUser’s Reference; AirViro: Gothenburg, Sweden, 2010; Volume 2. [Google Scholar]
- Meren, M.; Jannus-Pruljan, L.; Loit, H.M.; Polluste, J.; Jonsson, E.; Kiviloog, J.; Lundback, B. Asthma, chronic bronchitis and respiratory symptoms among adults in Estonia according to a postal questionnaire. Respir. Med. 2001, 95, 954–964. [Google Scholar] [CrossRef] [PubMed]
- Jannus-Pruljan, L.; Meren, M.; Polluste, J.; Loit, H.M.; Kiviloog, J.; Baburin, A.; Lundback, B. Postal survey on asthma, chronic bronchitis and respiratory symptoms among adult Estonians and non-Estonians (FinEsS-study). Eur. J. Public Health 2004, 14, 114–119. [Google Scholar] [CrossRef] [PubMed]
- Wilson, D.; Takahashi, K.; Pan, G.; Chan, C.-C.; Zhang, S.; Feng, Y.; Hoshuyama, T.; Chuang, K.-J.; Lin, R.-T.; Hwang, J.-S. Respiratory symptoms among residents of a heavy-industry province in China: Prevalence and risk factors. Respir. Med. 2008, 102, 1536–1544. [Google Scholar] [CrossRef] [PubMed]
- Pilotto, L.S.; Smith, B.J.; Nitschke, M.; Ruffin, R.E.; Mitchell, R. Industry, air quality, cigarette smoke and rates of respiratory illness in Port Adelaide. Aust. N. Z. J. Public Health 1999, 23, 657–660. [Google Scholar] [CrossRef] [PubMed]
- Fung, K.Y.; Luginaah, I.N.; Gorey, K.M. Impact of air pollution on hospital admissions in Southwestern Ontario, Canada: Generating hypotheses in sentinel high-exposure places. Environ. Health 2007, 6, 18. [Google Scholar] [CrossRef] [PubMed]
- Pascal, L.; Pascal, M.; Stempfelet, M.; Goria, S.; Declercq, C. Ecological study on hospitalizations for cancer, cardiovascular, and respiratory diseases in the industrial area of Etang-de-Berre in the south of France. J. Environ. Public Health 2013, 2013. [Google Scholar] [CrossRef] [PubMed]
- Aylin, P.; Bottle, A.; Wakefield, J.; Jarup, L.; Elliott, P. Proximity to coke works and hospital admissions for respiratory and cardiovascular disease in England and Wales. Thorax 2001, 56, 228–233. [Google Scholar] [CrossRef] [PubMed]
- Wittek, A.; Sokalski, B.; Grzeszczak, W.; Strojek, K. Prevalence of diabetes and cardiovascular risk factors of industrial area in southern Poland. Exp. Clin. Endocrinol. Diabetes 2009, 117, 350–353. [Google Scholar] [CrossRef] [PubMed]
- Bourdrel, T.; Bind, M.A.; Bejot, Y.; Morel, O.; Argacha, J.F. Cardiovascular effects of air pollution. Arch. Cardiovasc. Dis. 2017, 110, 634–642. [Google Scholar] [CrossRef] [PubMed]
- Xing, Y.F.; Xu, Y.H.; Shi, M.H.; Lian, Y.X. The impact of PM2.5 on the human respiratory system. J. Thorac. Dis. 2016, 8, E69–E74. [Google Scholar] [PubMed]
- Hansen, A.B.; Ravnskjaer, L.; Loft, S.; Andersen, K.K.; Brauner, E.V.; Baastrup, R.; Yao, C.; Ketzel, M.; Becker, T.; Brandt, J.; et al. Long-term exposure to fine particulate matter and incidence of diabetes in the Danish nurse cohort. Environ. Int. 2016, 91, 243–250. [Google Scholar] [CrossRef] [PubMed]
- Esposito, K.; Petrizzo, M.; Maiorino, M.I.; Bellastella, G.; Giugliano, D. Particulate matter pollutants and risk of type 2 diabetes: A time for concern? Endocrine 2016, 51, 32–37. [Google Scholar] [CrossRef] [PubMed]
- Bahadar, H.; Mostafalou, S.; Abdollahi, M. Current understandings and perspectives on non-cancer health effects of benzene: A global concern. Toxicol. Appl. Pharmacol. 2014, 276, 83–94. [Google Scholar] [CrossRef] [PubMed]
- Fenga, C.; Gangemi, S.; Costa, C. Benzene exposure is associated with epigenetic changes (review). Mol. Med. Rep. 2016, 13, 3401–3405. [Google Scholar] [CrossRef] [PubMed]
- Umweltbundesamtes. Richtwerte für phenol in der innenraumluft. Bundesgesundheitsbl. 2011, 54, 1262–1268. [Google Scholar]
- European Chemicals Bureau (ECB). Phenol. European Union Risk Assessment Report, Revised Edition; European Chemicals Bureau, Joint Research Center: Ispra, Italy, 2006. [Google Scholar]
- Baird, J.C.; Birgitta Berglund, M.; Berglund, U.; Lindvall, T. Symptom patterns as an early warning signal of community health problems. Environ. Int. 1990, 16, 3–9. [Google Scholar] [CrossRef]
- Teinemaa, E.; Maasikmets, M.; Saare, K.; Vill, M. Õhukvaliteedi Andmete Kogumine ja Aruandlus: 2016 a. Lõpparuanne; Estonian Environmental Research Centre: Tallinn, Estonia, 2017; p. 122. [Google Scholar]
- Pihor, K.; Kralik, S.; Aolaid-Aas, A.; Jürgenson, A.; Paat-Ahi, G.; Rell, M.; Batueva, V. Põlevkivi Kaevandamise ja Töötlemise Sotsiaalmajanduslike Mõjude Hindamine; Center for Plocy Studies Praxis: Tallinn, Estonia, 2013. [Google Scholar]
- Babich, H.; Davis, D.L. Phenol: A review of environmental and health risks. Regul. Toxicol. Pharmacol. 1981, 1, 90–109. [Google Scholar] [CrossRef]
- Kahn, H. Toxicity of oil shale chemical products. A review. Scand. J. Work Environ. Health 1979, 5, 1–9. [Google Scholar] [CrossRef] [PubMed]
- Jirik, V.; Machaczka, O.; Miturova, H.; Tomasek, I.; Slachtova, H.; Janoutova, J.; Velicka, H.; Janout, V. Air pollution and potential health risk in Ostrava region—A review. Cent. Eur. J. Public Health 2016, 24, S4–S17. [Google Scholar] [CrossRef] [PubMed]
- World Health Organization (WHO). Hydrogen Sulfide: Human Health Aspects; World Health Organization: Geneva, Switzerland, 2003. [Google Scholar]
- Orru, H.; Tomasova, J.; Idavain, J.; Julge, K.; Rebane, T.; Ruut, J.; Albrecht, L.; Tamm, K.; Kesanurm, K.; Aidla-Bauvald, K. Health impacts of the oil shale sector in eastern Estonia. Rapp. Istisan 2016, 16, 54–57. [Google Scholar]
- Pille, V.; Muzõka, V.; Bogovski, S.; Viitak, A.; Veidebaum, T. Täiendavad võimalused pikaajaliste kutse-ekspositsioonide toksilise toime hindamiseks. Eest. Arst 2004, 83, 806–810. [Google Scholar]
- Kuljukka-Rabb, T.; Nylund, L.; Vaaranrinta, R.; Savela, K.; Mutanen, P.; Veidebaum, T.; Sorsa, M.; Rannug, A.; Peltonen, K. The effect of relevant genotypes on PAH exposure-related biomarkers. J. Expo. Anal. Environ. Epidemiol. 2002, 12, 81–91. [Google Scholar] [CrossRef] [PubMed]
- Murakas, R.; Trumm, A.; Merilain, M.; Jalak, A. Tööturu—Ja Muude Meetmete Vajalikkusest Väljateenitud Aastate Pensioni Kaotamisel; University of Tartu: Tartu, Estonia, 2012. [Google Scholar]
- Tint, P. Risk assessment in the working environment in Estonia. Int. J. Occup. Saf. Ergon. 1998, 4, 237–248. [Google Scholar] [CrossRef] [PubMed]
- Kung, V.A. Morphological investigations of fibrogenic action of Estonian oil shale dust. Environ. Health Perspect. 1979, 30, 153–155. [Google Scholar] [CrossRef] [PubMed]

| Ida-Viru County | Lääne-Viru County | Tartu | Total | |
|---|---|---|---|---|
| Gender | ||||
| Female | 508 (59.8) | 105 (57.7) | 1430 (60) | 2046 (59.9) |
| Age | ||||
| 18–27 | 78 (9.2) | 20 (11) | 277 (11.6) | 376 (11) |
| 28–37 | 105 (12.4) | 28 (15.5) | 462 (19.4) | 598 (17.5) |
| 38–47 | 171 (20.2) | 34 (18.7) | 949 (39.8) | 1151 (33.7) |
| 48–57 | 204 (24) | 48 (26.6) | 467 (19.6) | 717 (21) |
| 58–67 | 241 (28.4) | 38 (21) | 224 (9.4) | 505 (14.8) |
| 68+ | 49 (5.8) | 13 (7.2) | 5 (0.2) | 68 (2) |
| Body mass index (BMI) | ||||
| Underweight (BMI < 20) | 62 (7.3) | 10 (5.6) | 231 (9.7) | 304 (8.9) |
| Healthy (BMI 20–24.99 | 254 (29.9) | 61 (33.7) | 1020 (42.8) | 1339 (39.2) |
| Overweight (BMI 25–30) | 306 (36) | 64 (34.9) | 713 (29.9) | 1079 (31.6) |
| Obese (BMI > 30) | 228 (26.8) | 47 (25.8) | 420 (17.6) | 693 (20.3) |
| Ethnicity | ||||
| Estonian | 272 (32) | 153 (84) | 2026 (85) | 2179 (63.8) |
| Russian | 517 (60.9) | 21 (11.6) | 312 (13.1) | 1093 (32) |
| Other | 60 (7.1) | 8 (4.4) | 45 (1.9) | 143 (4.2) |
| Monthly net income during the last 12 months per family member | ||||
| Under 100 € | 39 (4.6) | 2 (1.2) | 43 (1.8) | 99 (2.9) |
| 100–299 € | 246 (29) | 33 (18.1) | 322 (13.5) | 686 (20.1) |
| 300–499 € | 301 (35.4) | 67 (36.7) | 665 (27.9) | 1079 (31.6) |
| 500–799 € | 161 (19) | 52 (28.8) | 701 (29.4) | 861 (25.2) |
| 800–999 € | 55 (6.5) | 8 (4.5) | 336 (14.1) | 348 (10.2) |
| Over 1000 € | 47 (5.5) | 19 (10.7) | 317 (13.3) | 342 (10) |
| Education | ||||
| Elementary or basic | 79 (9.3) | 21 (11.6) | 122 (5.1) | 222 (6.5) |
| Secondary | 540 (63.6) | 121 (66.3) | 1082 (45.4) | 1745 (51.1) |
| Applied or higher | 230 (27.1) | 40 (22.1) | 1180 (49.5) | 1448 (42.4) |
| Working in oil shale sector | ||||
| Have been working | 239 (28.2) | 1 (0.5) | 48 (2) | 287 (8.4) |
| Smoking | ||||
| Current smoker | 212 (25) | 39 (21.3) | 460 (19.3) | 710 (20.8) |
| Ex-smoker | 179 (21.1) | 37 (20.2) | 434 (18.2) | 649 (19) |
| Self-assessed health status | ||||
| Very good | 30 (3.5) | 11 (6.1) | 384 (16.1) | 345 (10.1) |
| Good | 241 (28.4) | 71 (39.2) | 1321 (55.4) | 1468 (43) |
| Average | 456 (53.7) | 78 (43.1) | 594 (24.9) | 1305 (38.2) |
| Bad | 112 (13.2) | 20 (11) | 79 (3.3) | 273 (8) |
| Very bad | 11 (1.3) | 1 (0.6) | 10 (0.4) | 27 (0.8) |
| Marital status | ||||
| Single | 113 (13.3) | 38 (20.8) | 432 (18.1) | 584 (17.1) |
| Married | 464 (54.7) | 84 (46.1) | 1087 (45.6) | 1636 (47.9) |
| Cohabiting | 122 (14.4) | 37 (20.2) | 620 (26) | 779 (22.8) |
| Divorced | 94 (11.1) | 16 (9) | 210 (8.8) | 321 (9.4) |
| Widowed | 55 (6.5) | 7 (4) | 33 (1.4) | 99 (2.9) |
| Ida-Viru County | Lääne-Viru County | Tartu | Estonians | Non-Estonians | |
|---|---|---|---|---|---|
| During the last 12 months | |||||
| Wheezing without a cold | 358 (42.2 1) | 66 (36.2) | 427 (17.9) | 405 (30.0) | 353 (46.0 3) |
| Chest tightness | 256 (30.1 1) | 42 (23.3) | 403 (16.9) | 215 (15.9) | 242 (31.6 3) |
| Shortness of breath | 165 (19.4 1) | 27 (14.6) | 286 (12.0) | 143 (10.6) | 156 (20.4 3) |
| Attack of coughing | 384 (45.2) | 77 (42.2) | 997 (41.8) | 539 (39.9) | 324 (42.3) |
| Asthma attack | 65 (7.6 1) | 12 (6.7) | 91 (3.8) | 62 (4.6) | 60 (7.8 3) |
| Ever had | |||||
| Wheezing | 275 (32.4 1,2) | 37 (20.5) | 539 (22.6) | 251 (18.6) | 254 (33.1 3) |
| Long-term cough | 249 (29.3 1) | 41 (22.3) | 498 (20.9) | 259 (19.2) | 242 (31.6 3) |
| Nose allergies/hay fever | 185 (21.8) | 41 (22.5) | 577 (24.2) | 320 (23.7) | 157 (20.5) |
| Asthma | 64 (7.5) | 15 (8.0) | 174 (7.3) | 91 (6.7) | 58 (7.5) |
| COPD | 20 (2.4) | 3 (1.7) | 24 (1.0) | 12 (0.9) | 21 (2.7 3) |
| Hypertension | 292 (34.4 1) | 59 (32.2) | 370 (15.5) | 181 (13.4) | 250 (32.6 3) |
| Heart disease | 138 (16.3 1,2) | 18 (10.0) | 241 (10.1) | 85 (6.3) | 130 (16.9 3) |
| Myocardial infarction | 66 (7.8 1) | 7 (4.1) | 48 (2.0) | 16 (1.2) | 61 (7.9 3) |
| Stroke | 31 (3.6 1) | 4 (2.4) | 24 (1.0) | 11 (0.8) | 31 (4.1 3) |
| Diabetes | 84 (9.9 1) | 11 (5.8) | 69 (2.9) | 35 (2.6) | 72 (9.4 3) |
| PM2.5 | Benzene | Phenol | |
|---|---|---|---|
| During the last 12 months * | |||
| Wheezing without a cold | 1.03 (0.92–1.14) | 1.06 (0.79–1.43) | 1.36 (0.98–1.90) |
| Chest tightness | 1.13 (1.02–1.26) | 1.30 (0.96–1.76) | 1.44 (1.03–2.00) |
| Shortness of breath | 1.16 (1.03–1.31) | 1.14 (0.80–1.62) | 1.18 (0.80–1.74) |
| Attack of coughing | 1.04 (0.94–1.15) | 0.94 (0.71–1.24) | 0.95 (0.70–1.30) |
| Asthma attack | 1.22 (1.04–1.42) | 1.14 (0.67–1.95) | 0.60 (0.32–1.15) |
| Ever had * | |||
| Wheezing | 1.10 (0.99–1.22) | 1.16 (0.86–1.56) | 1.11 (0.80–1.55) |
| Long-term cough | 0.99 (0.89–1.11) | 1.31 (0.96–1.77) | 1.48 (1.06–2.07) |
| Allergic rhinitis | 1.07 (0.94–1.22) | 0.92 (0.64–1.32) | 0.89 (0.59–1.34) |
| Asthma | 1.04 (0.87–1.24) | 1.20 (0.70–2.06) | 0.84 (0.45–1.56) |
| COPD | 1.22 (0.84–1.76) | 1.97 (0.72–2.10) | 1.92 (0.71–5.19) |
| Hypertension | 1.10 (0.98–1.24) | 1.15 (0.83–1.59) | 1.21 (0.84–1.74) |
| Heart disease | 1.12 (0.98–1.28) | 1.24 (0.83–1.84) | 1.30 (0.85–1.98) |
| Myocardial infarction | 0.99 (0.80–1.22) | 1.98 (1.11–3.53) | 2.17 (1.23–3.83) |
| Stroke | 1.01 (0.76–1.35) | 1.39 (0.62–3.11) | 1.14 (0.50–2.62) |
| Diabetes | 1.01 (0.85–1.21) | 1.42 (0.86–2.34) | 1.33 (0.78–2.27) |
| Base model | Ida-Viru County | Lääne-Viru County | Tartu |
| Gender (ref females) | 0.64 (0.42–0.97) | 1.01 (0.36–2.88) | 0.64 (0.41–1.00) |
| Age | 1.00 (0.99–1.02) | 0.99 (0.95–1.03) | 0.99 (0.97–1.02) |
| Elementary or basic education (ref applied or higher) | 1.13 (0.56–2.27) | 0.36 (0.03–4.58) | 1.41 (0.59–3.33) |
| Secondary education (ref applied or higher) | 0.87 (0.56–1.34) | 0.66 (0.21–2.04) | 1.21 (0.78–1.87) |
| Income | 1.08 (0.91–1.27) | 1.17 (0.74–1.85) | 0.89 (0.75–1.05) |
| Current or ex-smokers (ref never smokers) | 0.89 (0.70–1.13) | 0.50 (0.24–1.05) | 1.04 (0.82–1.35) |
| Self-assessed health status | 1.59 (1.21–2.08) | 2.56 (1.23–5.36) | 1.49 (1.13–1.97) |
| Pollutants *,# | |||
| PM2.5 | 1.07 (0.94–1.22) | ||
| Benzene | 1.04 (0.87–1.24) | ||
| Phenol | 1.22 (0.84–1.76) | ||
| Social and psychological factors * | |||
| Working in oil shale sector | 1.36 (0.86–2.15) | 0 | 6.13 (2.31–16.28) |
| Ethnicity (ref Estonian) | 1.19 (0.85–1.67) | 0.87 (0.31–2.44) | 1.56 (1.03–2.36) |
| Perceived risk | 0.35 (0.28–0.44) | 0.34 (0.2–0.58) | 0.39 (0.32–0.49) |
| Symptoms during the last 12 months * | |||
| Wheezing without a cold | 2.30 (1.31–4.04) | 0.11 (0.01–0.92) | 0 |
| Chest tightness | 2.88 (1.91–4.33) | 3.19 (1.02–9.92) | 2.26 (1.36–3.74) |
| Shortness of breath | 1.60 (0.92–2.79) | 94.83 (3.35–2680.68) | 3.24 (1.88–5.57) |
| Attack of coughing | 1.99 (1.34–2.95) | 2.10 (0.75–5.84) | 1.57 (1.03–2.38) |
| Asthma attack | 1.48 (0.79–2.77) | 4.83 (0.79–29.35) | 2.16 (0.98–4.75) |
| Ever had chronic diseases * | |||
| Wheezing | 1.98 (1.31–2.99) | 1.52 (0.48–4.82) | 1.81 (1.13–2.90) |
| Long-term cough | 1.29 (0.86–1.94) | 3.04 (1.01–9.16) * | 1.92 (1.21–3.05) |
| Allergic rhinitis | 1.40 (0.82–2.37) | 1.36 (0.34–5.45) | 1.34 (0.78–2.27) |
| Asthma | 1.18 (0.60–2.32) | 2.85 (0.6–13.61) | 1.36 (0.65–2.85) |
| COPD | 1.69 (0.56–5.14) | 6.21 (0.16–246.71) | 3.18 (0.78–12.8) |
| Hypertension | 1.05 (0.68–1.63) | 1.13 (0.35–3.69) | 1.12 (0.51–2.47) |
| Heart disease | 1.22 (0.61–2.42) | 7.81 (1.41–43.16) | 0.47 (0.16–1.39) |
| Myocardial infarction | 1.22 (0.61–2.42) | 17.32 (1.47–203.29) | 0 |
| Stroke | 0.69 (0.21–2.24) | 0 | 0 |
| Diabetes | 0.67 (0.35–1.29) | 0.47 (0.04–4.84) | 0.83 (0.09–6.96) |
© 2018 by the authors. Licensee MDPI, Basel, Switzerland. This article is an open access article distributed under the terms and conditions of the Creative Commons Attribution (CC BY) license (http://creativecommons.org/licenses/by/4.0/).
Share and Cite
Orru, H.; Idavain, J.; Pindus, M.; Orru, K.; Kesanurm, K.; Lang, A.; Tomasova, J. Residents’ Self-Reported Health Effects and Annoyance in Relation to Air Pollution Exposure in an Industrial Area in Eastern-Estonia. Int. J. Environ. Res. Public Health 2018, 15, 252. https://doi.org/10.3390/ijerph15020252
Orru H, Idavain J, Pindus M, Orru K, Kesanurm K, Lang A, Tomasova J. Residents’ Self-Reported Health Effects and Annoyance in Relation to Air Pollution Exposure in an Industrial Area in Eastern-Estonia. International Journal of Environmental Research and Public Health. 2018; 15(2):252. https://doi.org/10.3390/ijerph15020252
Chicago/Turabian StyleOrru, Hans, Jane Idavain, Mihkel Pindus, Kati Orru, Kaisa Kesanurm, Aavo Lang, and Jelena Tomasova. 2018. "Residents’ Self-Reported Health Effects and Annoyance in Relation to Air Pollution Exposure in an Industrial Area in Eastern-Estonia" International Journal of Environmental Research and Public Health 15, no. 2: 252. https://doi.org/10.3390/ijerph15020252
APA StyleOrru, H., Idavain, J., Pindus, M., Orru, K., Kesanurm, K., Lang, A., & Tomasova, J. (2018). Residents’ Self-Reported Health Effects and Annoyance in Relation to Air Pollution Exposure in an Industrial Area in Eastern-Estonia. International Journal of Environmental Research and Public Health, 15(2), 252. https://doi.org/10.3390/ijerph15020252