Air Pollution and Otitis Media in Children: A Systematic Review of Literature

 ,
,  ,
,  ,
, 

Abstract
:1. Introduction
2. Methods
2.1. Search Strategy
2.2. Eligibility Criteria
2.3. Quality Assessment/Risk of Bias in Included Studies
2.4. Data Extraction
3. Results
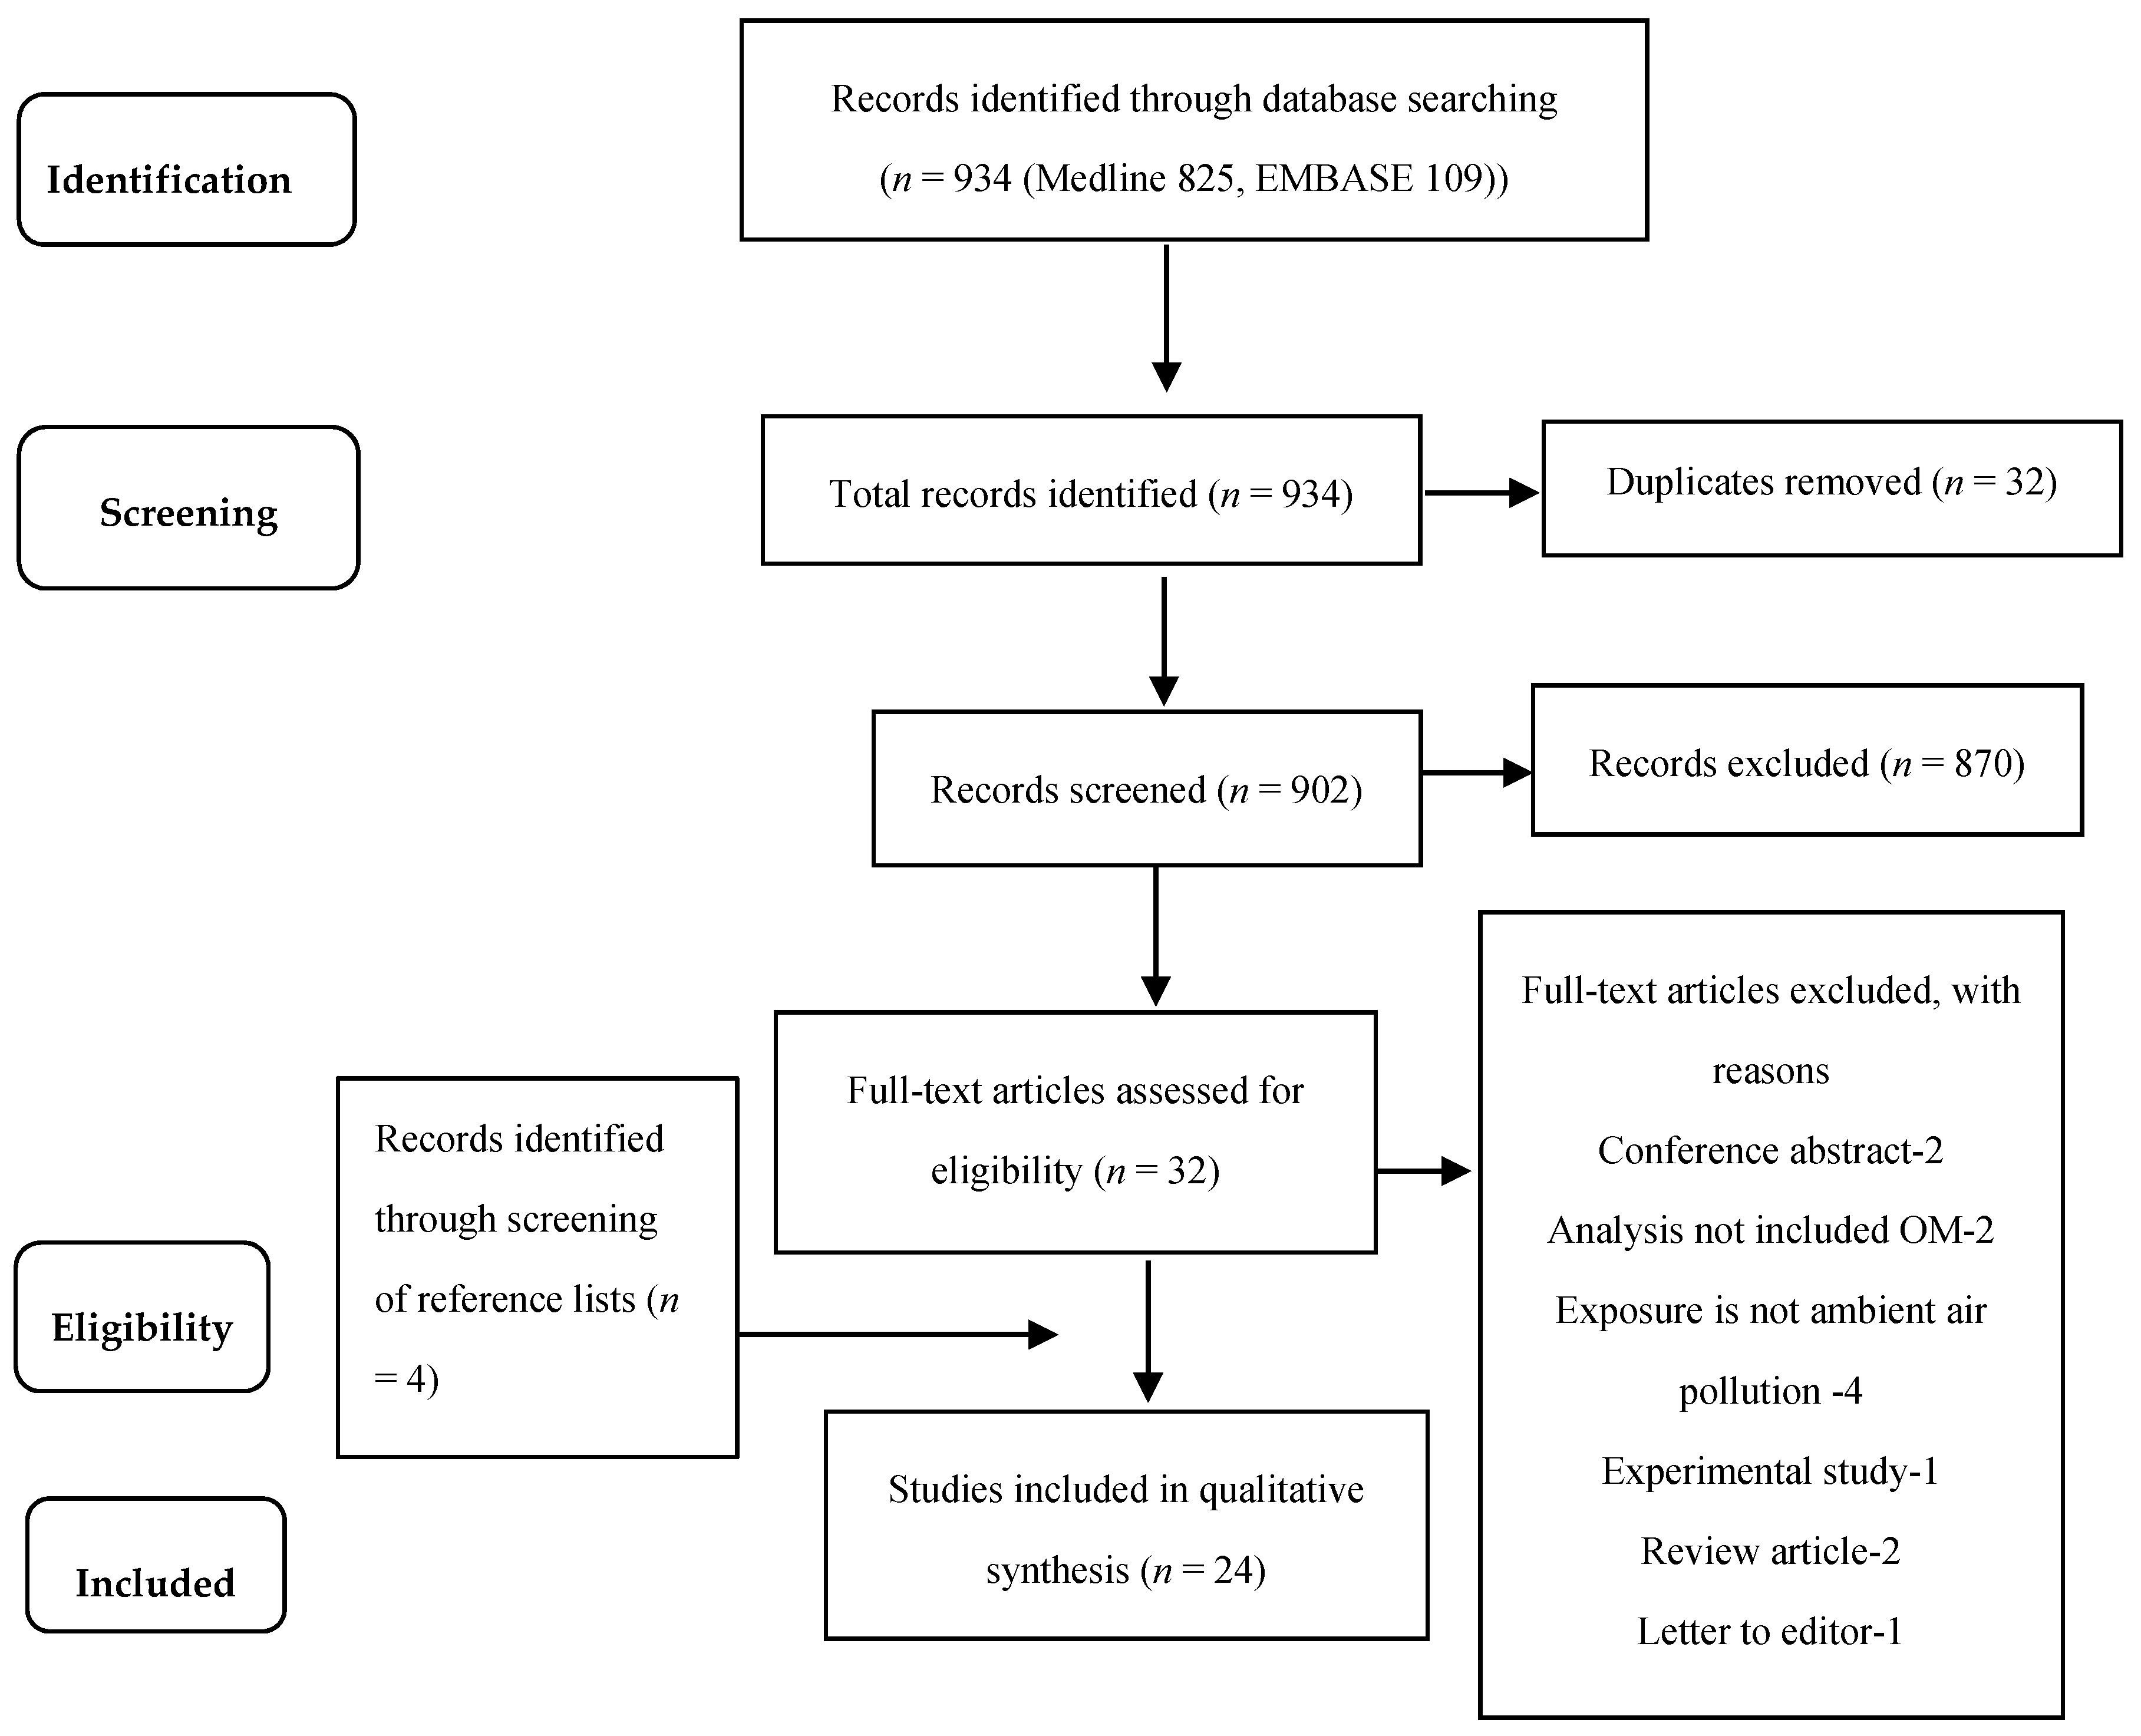
3.1. Search Results
3.2. Characteristics of Included Studies
3.3. Long-Term Studies
3.3.1. Cohort Studies
Birth Cohort Studies of Outdoor Air Pollution Exposure and OM
Birth Cohort Studies of Indoor Air Pollution Exposure and OM
Other Cohort Studies of Outdoor and Indoor Air Pollution
3.4. Studies Investigating Lag Effects of Air Pollution Exposure and OM
3.4.1. Case-Crossover Studies of Outdoor Air Pollution Exposure
3.4.2. Time-Series Studies of Outdoor Air Pollution Studies
3.5. Studies Investigating cross Sectional Associations between Air Pollution and OM
3.5.1. Case Control Studies of Indoor Air Pollution
3.5.2. Cross Sectional Studies of Outdoor Air Pollution Exposure
4. Discussion
4.1. Outdoor Air Pollution Exposure and OM
4.2. Indoor Air Pollution Exposure and OM
4.3. Evidence from Long-Term, Lag and Cross Sectional Studies
4.4. Biologic Mechanisms
4.5. Strengths and Limitations
5. Conclusions
Supplementary Materials
Acknowledgments
Author Contributions
Conflicts of Interest
References
- Berman, S. Otitis media in children. N. Engl. J. Med. 1995, 332, 1560–1565. [Google Scholar] [CrossRef] [PubMed]
- Preciado, D. Otitis Media: State of the Art Concepts and Treatment; Springer International Publishing: Cham, Switzerland, 2015. [Google Scholar]
- Klein, J.O.; Bluestone, C.D. Textbook of Pediatric Infectious Diseases, 5th ed.; Lippincott Williams & Wilkins: Philadelphia, PA, USA, 1999; pp. 215–234. [Google Scholar]
- Bennett, K.E.; Haggard, M.P.; Silva, P.A.; Stewart, I.A. Behaviour and developmental effects of otitis media with effusion into the teens. Arch. Dis. Child. 2001, 85, 91–95. [Google Scholar] [CrossRef] [PubMed]
- Leung, A.K.C.; Wong, A.H.C. Acute otitis media in children. Recent Pat. Inflamm. Allergy Drug Discov. 2017, 11, 32–40. [Google Scholar] [CrossRef] [PubMed]
- Monasta, L.; Ronfani, L.; Marchetti, F.; Montico, M.; Vecchi Brumatti, L.; Bavcar, A.; Grasso, D.; Barbiero, C.; Tamburlini, G. Burden of disease caused by otitis media: Systematic review and global estimates. PLoS ONE 2012, 7. [Google Scholar] [CrossRef] [PubMed]
- Ahmed, S.; Shapiro, N.L.; Bhattacharyya, N. Incremental health care utilization and costs for acute otitis media in children. Laryngoscope 2014, 124, 301–305. [Google Scholar] [CrossRef] [PubMed]
- Kujala, T.; Alho, O.P.; Kristo, A.; Uhari, M.; Renko, M.; Pokka, T.; Koivunen, P. Recurrent acute otitis media detracts from health-related quality of life. J. Laryngol. Otol. 2017, 131, 128–137. [Google Scholar] [CrossRef] [PubMed]
- Shusterman, D. The effects of air pollutants and irritants on the upper airway. Proc. Am. Thorac. Soc. 2011, 8, 101–105. [Google Scholar] [CrossRef] [PubMed]
- Jones, L.L.; Hassanien, A.; Cook, D.G.; Britton, J.; Leonardi-Bee, J. Parental smoking and the risk of middle ear disease in children: A systematic review and meta-analysis. Arch. Pediatr. Adolesc. Med. 2012, 166, 18–27. [Google Scholar] [CrossRef] [PubMed]
- Kong, S.K.; Chon, K.M.; Goh, E.K.; Lee, I.W.; Lee, J.W.; Wang, S.G. Histologic changes in the auditory tube mucosa of rats after long-term exposure to cigarette smoke. Am. J. Otolaryngol. 2009, 30, 376–382. [Google Scholar] [CrossRef] [PubMed]
- Heinrich, J.; Raghuyamshi, V.S. Air pollution and otitis media: A review of evidence from epidemiologic studies. Curr. Allergy Asthma Rep. 2004, 4, 302–309. [Google Scholar] [CrossRef] [PubMed]
- MacIntyre, E.A.; Gehring, U.; Molter, A.; Fuertes, E.; Klumper, C.; Kramer, U.; Quass, U.; Hoffmann, B.; Gascon, M.; Brunekreef, B.; et al. Air pollution and respiratory infections during early childhood: An analysis of 10 European birth cohorts within the ESCAPE project. Environ. Health Perspect. 2014, 122, 107–113. [Google Scholar] [CrossRef] [PubMed]
- Brauer, M.; Karr, C.; MacIntyre, E.; Clark, N.; Su, J.; Baribeau, A.M.; Tamburic, L.; Lencar, C.; Demers, P.; Buzzelli, M.; et al. Woodsmoke and children’s health: Findings from the border air quality study. Epidemiology 2011, 22. [Google Scholar] [CrossRef]
- Kim, H.J.; Kim, S.Y.; Kwon, J.Y.; Kim, Y.J.; Kang, S.H.; Jang, W.H.; Lee, J.H.; Seo, M.W.; Song, J.J.; Seo, Y.R.; et al. Identification of potential novel biomarkers and signaling pathways related to otitis media induced by diesel exhaust particles using transcriptomic analysis in an in vivo system. PLoS ONE 2016, 11. [Google Scholar] [CrossRef] [PubMed]
- Song, J.J.; Kwon, J.Y.; Park, M.K.; Seo, Y.R. Microarray analysis of gene expression alteration in human middle ear epithelial cells induced by micro particle. Int. J. Pediatr. Otorhinolaryngol. 2013, 77, 1760–1764. [Google Scholar] [CrossRef] [PubMed]
- Bowatte, G.; Lodge, C.; Lowe, A.J.; Erbas, B.; Perret, J.; Abramson, M.J.; Matheson, M.; Dharmage, S.C. The influence of childhood traffic-related air pollution exposure on asthma, allergy and sensitization: A systematic review and a meta-analysis of birth cohort studies. Allergy 2015, 70, 245–256. [Google Scholar] [CrossRef] [PubMed]
- Ohashi, Y.; Nakai, Y.; Ikeoka, H.; Koshimo, H.; Esaki, Y. Acute effects of sulfur dioxide exposure on the middle ear mucosa. Ann. Otol. Rhinol. Laryngol. 1989, 98, 301–307. [Google Scholar] [CrossRef] [PubMed]
- Wells, G.A.; Shea, B.; O’Connell, D.; Peterson, J.; Welch, V.; Losos, M.; Tugwell, P. The Newcastle-Ottawa Scale (NOS) for Assessing the Quality of Nonrandomised Studies in Meta-Analyses; Ottawa Hospital Research Institute: Ottawa, ON, Canada, 2009. [Google Scholar]
- Zaza, S.; Wright-De Aguero, L.K.; Briss, P.A.; Truman, B.I.; Hopkins, D.P.; Hennessy, M.H.; Sosin, D.M.; Anderson, L.; Carande-Kulis, V.G.; Teutsch, S.M.; et al. Data collection instrument and procedure for systematic reviews in the Guide to Community Preventive Services. Task Force on Community Preventive Services. Am. J. Prev. Med. 2000, 18, 44–74. [Google Scholar] [CrossRef]
- Lambert, K.A.; Bowatte, G.; Tham, R.; Lodge, C.; Prendergast, L.; Heinrich, J.; Abramson, M.J.; Dharmage, S.C.; Erbas, B. Residential greenness and allergic respiratory diseases in children and adolescents—A systematic review and meta-analysis. Environ. Res. 2017, 159, 212–221. [Google Scholar] [CrossRef] [PubMed]
- Tham, R.; Dharmage, S.C.; Taylor, P.E.; Katelaris, C.H.; Vicendese, D.; Abramson, M.J.; Erbas, B. Outdoor fungi and child asthma health service attendances. Pediatr. Allergy Immunol. Off. Publ. Eur. Soc. Pediatr. Allergy Immunol. 2014, 25, 439–449. [Google Scholar] [CrossRef] [PubMed]
- Aguilera, I.; Pedersen, M.; Garcia-Esteban, R.; Ballester, F.; Basterrechea, M.; Esplugues, A.; Fernandez-Somoano, A.; Lertxundi, A.; Tardon, A.; Sunyer, J. Early-Life exposure to outdoor air pollution and respiratory health, ear infections, and eczema in infants from the INMA study. Environ. Health Perspect. 2013, 121, 387–392. [Google Scholar] [CrossRef] [PubMed]
- Brauer, M.; Gehring, U.; Brunekreef, B.; de Jongste, J.; Gerritsen, J.; Rovers, M.; Wichmann, H.E.; Wijga, A.; Heinrich, J. Traffic-related air pollution and otitis media. Environ. Health Perspect. 2006, 114, 1414–1418. [Google Scholar] [CrossRef] [PubMed]
- Dostal, M.; Prucha, M.; Rychlikova, E.; Pastorkova, A.; Sram, R.J. Differences between the spectra of respiratory illnesses in children living in urban and rural environments. Cent. Eur. J. Public Health 2014, 22, 3–11. [Google Scholar] [PubMed]
- Jedrychowski, W.; Galas, A.; Pac, A.; Flak, E.; Camman, D.; Rauh, V.; Perera, F. Prenatal ambient air exposure to polycyclic aromatic hydrocarbons and the occurrence of respiratory symptoms over the first year of life. Eur. J. Epidemiol. 2005, 20, 775–782. [Google Scholar] [CrossRef] [PubMed]
- Pettigrew, M.M.; Gent, J.F.; Triche, E.W.; Belanger, K.D.; Bracken, M.B.; Leaderer, B.P. Infant otitis media and the use of secondary heating sources. Epidemiology 2004, 15, 13–20. [Google Scholar] [CrossRef] [PubMed]
- MacIntyre, E.A.; Karr, C.J.; Koehoorn, M.; Demers, P.A.; Tamburic, L.; Lencar, C.; Brauer, M. Residential air pollution and otitis media during the first two years of life. Epidemiology 2011, 22, 81–89. [Google Scholar] [CrossRef] [PubMed]
- Deng, Q.; Lu, C.; Jiang, W.; Zhao, J.; Deng, L.; Xiang, Y. Association of outdoor air pollution and indoor renovation with early childhood ear infection in China. Chemosphere 2017, 169, 288–296. [Google Scholar] [CrossRef] [PubMed]
- Daigler, G.E.; Markello, S.J.; Cummings, K.M. The effect of indoor air pollutants on otitis media and asthma in children. Laryngoscope 1991, 101, 293–296. [Google Scholar] [CrossRef] [PubMed]
- da Costa, J.L.; Navarro, A.; Neves, J.B.; Martin, M. Household wood and charcoal smoke increases risk of otitis media in childhood in Maputo. Int. J. Epidemiol. 2004, 33, 573–578. [Google Scholar] [CrossRef] [PubMed]
- Bhattacharyya, N.; Shapiro, N.L. Air quality improvement and the prevalence of frequent ear infections in children. Otolaryngol. Head Neck Surg. 2010, 142, 242–246. [Google Scholar] [CrossRef] [PubMed]
- Bhopal, R.S.; Phillimore, P.; Moffatt, S.; Foy, C. Is living near a coking works harmful to health? A study of industrial air pollution. J. Epidemiol. Community Health 1994, 48, 237–247. [Google Scholar] [CrossRef] [PubMed]
- Harvey, R.M. Environmental factors in glue ear. J. Laryngol. Otol. 1975, 89, 73–77. [Google Scholar] [CrossRef] [PubMed]
- Heinrich, J.; Hoelscher, B.; Wichmann, H.E. Decline of ambient air pollution and respiratory symptoms in children. Am. J. Respir. Crit. Care Med. 2000, 161, 1930–1936. [Google Scholar] [CrossRef] [PubMed]
- Holtby, I.; Elliott, K.; Kumar, U. Is there a relationship between proximity to industry and the occurrence of otitis media with effusion in school entrant children? Public Health 1997, 111, 89–91. [Google Scholar] [CrossRef]
- Sprem, N.; Branica, S. Effects of sulphur dioxide and smoke on the incidence of secretory otitis media. Arh. Hig. Rada Toksikol. 1993, 44, 229–232. [Google Scholar] [PubMed]
- Heinrich, J.; Hoelscher, B.; Frye, C.; Meyer, I.; Pitz, M.; Cyrys, J.; Wjst, M.; Neas, L.; Wichmann, H.E. Improved air quality in reunified Germany and decreases in respiratory symptoms. Epidemiology 2002, 13, 394–401. [Google Scholar] [CrossRef] [PubMed]
- Ribeiro, H.; Cardoso, M.R.A. Air pollution and children’s health in São Paulo (1986–1998). Soc. Sci. Med. 2003, 57, 2013–2022. [Google Scholar] [CrossRef]
- Gestro, M.; Condemi, V.; Bardi, L.; Fantino, C.; Solimene, U. Meteorological factors, air pollutants, and emergency department visits for otitis media: A time series study. Int. J. Biometeorol. 2017, 61, 1749–1764. [Google Scholar] [CrossRef] [PubMed]
- Kousha, T.; Castner, J. The air quality health index and emergency department visits for Otitis Media. J. Nurs. Scholarsh. 2016, 48, 163–171. [Google Scholar] [CrossRef] [PubMed]
- Strickland, M.J.; Hao, H.; Hu, X.; Chang, H.H.; Darrow, L.A.; Liu, Y. Pediatric Emergency Visits and Short-Term Changes in PM2.5 Concentrations in the U.S. State of Georgia. Environ. Health Perspect. 2016, 124, 690–696. [Google Scholar] [CrossRef] [PubMed]
- Xiao, Q.; Liu, Y.; Mulholland, J.A.; Russell, A.G.; Darrow, L.A.; Tolbert, P.E.; Strickland, M.J. Pediatric emergency department visits and ambient Air pollution in the U.S. State of Georgia: A case-crossover study. Environ. Health Glob. Access Sci. Source 2016, 15, 1–8. [Google Scholar] [CrossRef] [PubMed]
- Zemek, R.; Szyszkowicz, M.; Rowe, B.H. Air pollution and emergency department visits for otitis media: A case-crossover study in edmonton, Canada. Environ. Health Perspect. 2010, 118, 1631–1636. [Google Scholar] [CrossRef] [PubMed]
- Deng, Q.; Lu, C.; Li, Y.; Chen, L.; He, Y.; Sundell, J.; Norback, D. Association between prenatal exposure to industrial air pollution and onset of early childhood ear infection in China. Atmos. Environ. 2017, 157, 18–26. [Google Scholar] [CrossRef]
- Dilger, M.; Orasche, J.; Zimmermann, R.; Paur, H.R.; Diabate, S.; Weiss, C. Toxicity of wood smoke particles in human A549 lung epithelial cells: The role of PAHs, soot and zinc. Arch. Toxicol. 2016, 90, 3029–3044. [Google Scholar] [CrossRef] [PubMed]
- Arif, A.T.; Maschowski, C.; Garra, P.; Garcia-Käufer, M.; Petithory, T.; Trouvé, G.; Dieterlen, A.; Mersch-Sundermann, V.; Khanaqa, P.; Nazarenko, I.; et al. Cytotoxic and genotoxic responses of human lung cells to combustion smoke particles of Miscanthus straw, softwood and beech wood chips. Atmos. Environ. 2017, 163, 138–154. [Google Scholar] [CrossRef]
- Song, J.J.; Lee, J.D.; Lee, B.D.; Chae, S.W.; Park, M.K. Effect of diesel exhaust particles on human middle ear epithelial cells. Int. J. Pediatr. Otorhinolaryngol. 2012, 76, 334–338. [Google Scholar] [CrossRef] [PubMed]
- Park, M.K.; Chae, S.W.; Kim, H.B.; Cho, J.G.; Song, J.J. Middle ear inflammation of rat induced by urban particles. Int. J. Pediatr. Otorhinolaryngol. 2014, 78, 2193–2197. [Google Scholar] [CrossRef] [PubMed]
- Andrianifahanana, M.; Moniaux, N.; Batra, S.K. Regulation of mucin expression: Mechanistic aspects and implications for cancer and inflammatory diseases. Biochim. Biophys. Acta 2006, 1765, 189–222. [Google Scholar] [CrossRef] [PubMed]
- Thornton, D.J.; Rousseau, K.; McGuckin, M.A. Structure and function of the polymeric mucins in airways mucus. Annu. Rev. Physiol. 2008, 70, 459–486. [Google Scholar] [CrossRef] [PubMed]
- Cho, J.G.; Woo, J.S.; Lee, H.M.; Jung, H.H.; Hwang, S.J.; Chae, S. Effects of cigarette smoking on mucin production in human middle ear epithelial cells. Int. J. Pediatr. Otorhinolaryngol. 2009, 73, 1447–1451. [Google Scholar] [CrossRef] [PubMed]
- Brauer, M. How much, how long, what, and where: Air pollution exposure assessment for epidemiologic studies of respiratory disease. Proc. Am. Thorac. Soc. 2010, 7, 111–115. [Google Scholar] [CrossRef] [PubMed]

| Cohort Studies | Study, Country and Sample | Study Design | Exposure Assessment & Age | Outcome Assessment & Age | Time between Exposure and Outcome | Results | Adjustment for Confounders | |||||||
|---|---|---|---|---|---|---|---|---|---|---|---|---|---|---|
| Aguilera [23] INMA study, Spain—2199 infants | General population birth cohort study, recruited 2003–2008 | NO2 and benzene assigned using temporally adjusted LUR during pregnancy and 1st year of life. For those who changed residential address an average weighted exposure was determined | Parent reported physician diagnosed ear infections (AOM) during the first 12–18 months of life. (one or more—not differentiated) | Cumulative exposure 12–27 months | Exposure to ambient air pollution and risk of OM | Birth season, child care attendance, siblings at birth, parental asthma and allergy, BMI-pre-pregnancy, ETS exposure during pregnancy, and postnatal parental smoking | ||||||||
| Exposure period | RR 95% CI NO2 (per 10 μgm−3) | RR 95% CI Benzene (per 1 μgm−3) | ||||||||||||
| Entire prenatal | 1.18 (0.98, 1.41) | 1.13 (0.95, 1.34) | ||||||||||||
| 1st trimester | 1.11 (0.99, 1.24) | 1.08 (1.02, 1.15) | ||||||||||||
| 2nd trimester | 1.16 (0.98, 1.37) | 1.13 (1.00, 1.27) | ||||||||||||
| 3rd trimester | 1.12 (0.98, 1.29) | 1.02 (0.92, 1.13) | ||||||||||||
| 1st year of life | 1.15 (1.01, 1.31) | 1.08 (0.99, 1.18) | ||||||||||||
| Brauer [24] PIAMA study, Netherlands —2984 infants (1st year) —2970 infants (2nd year) LISA study, Germany —620 infants (1st year) —605 infants (2nd year) | General population birth cohort studies, PIAMA: recruited 1997–1998 LISA, recruited: December 1997–January 1999 | NO2, PM2.5 and black carbon levels at the birth address using LUR. Long term average concentrations were calculated for home address at time of birth | Parent reported physician diagnosed infectious OM during the first 2 years of life (any episode) | 2 years | Exposure to ambient air pollution and odds of OM | Maternal smoking during pregnancy, ETS exposure, maternal/paternal education, sex, gas use for cooking/heating, siblings, breastfeeding, moulds, pets, parental allergy, maternal age. In the Netherlands only, adjusted for ethnicity, study arm (intervention/natural history), and use of allergen-impermeable mattress cover. | ||||||||
| Exposure period & pollutant (per µg/m−3) | OR (95% CI) Netherlands | OR (95% CI) Germany | ||||||||||||
| 1st year of life | n = 2984 | n = 620 | ||||||||||||
| PM2.5 (10) | 1.13 (0.98, 1.32) | 1.19 (0.73, 1.92) | ||||||||||||
| Black carbon (0.5) | 1.11 (0.98, 1.26) | 1.12 (0.83, 1.51) | ||||||||||||
| NO2 (3) | 1.17 (1.03, 1.34) | 1.09 (0.78, 1.54) | ||||||||||||
| Cumulative 2nd year of life | n = 2970 | n = 605 | ||||||||||||
| PM2.5 (10) | 1.13 (1.00, 1.27) | 1.24 (0.84, 1.83) | ||||||||||||
| Black carbon (0.5) | 1.10 (1.00, 1.22) | 1.10 (0.86, 1.41) | ||||||||||||
| NO2 (3) | 1.14 (1.03, 1.27) | 1.14 (0.87, 1.49) | ||||||||||||
| Deng [29] Children attending kindergartens in Changsha, Hunan Province in south-central, China—1617 children | Retrospective cohort study, 2011–2012 | NO2, PM10 and SO2 measured using fixed site monitors. Exposure to indoor air Pollution related to home renovation activities were surveyed by a questionnaire. Air pollution during prenatal and (postnatal) first year to the past year | Parent reported physician diagnosed life-time prevalence of infectious OM, reported at age 3–4 years | Cumulative exposure 3–4 years | Exposure to air pollution and OM | Child’s sex, birth season, breastfeeding, day-care-attendance age, parental atopy, parental SES by house size, ETS at home, visible mould/damp stains, window condensation, dogs in house, and cockroaches in house | ||||||||
| Single Pollutant (per µgm−3) | OR (95% CI) Prenatal | OR (95% CI) Postnatal & past year | ||||||||||||
| PM10 (prenatal: 7 µgm−3; postnatal: 6 µgm−3) | 0.95 (0.73, 1.23) | 1.36 (0.95, 1.94) | ||||||||||||
| SO2 (prenatal: 27 µgm−3; postnatal: 13 µgm−3) | 1.44 (1.09, 1.88) | 1.32 (0.95, 1.84) | ||||||||||||
| NO2 (prenatal: 12 µgm−3; postnatal: 13 µgm−3) | 1.10 (0.76, 1.60) | 1.16 (0.73, 1.83) | ||||||||||||
Postnatal exposure to new furniture and redecoration were significantly associated with OM respectively OR 1.62 (95% CI 1.05, 2.49) and OR 1.81 (95% CI 1.12, 2.91). Prenatal exposure to outdoor SO2 and postnatal exposure to indoor renovations was associated only with 1–2 episodes of OM [SO2 OR = 1.46 (95% CI 1.09, 1.95); new furniture OR = 1.76 (95% CI 1.14, 2.72); Redecoration OR = 1.93 (95% CI 1.18, 3.16)] but not with ≥3 episodes. | ||||||||||||||
| Deng [45] Children attending kindergartens in Changsha, Hunan Province in south-central, China—1617 children | Retrospective cohort study, 2011–2012 | NO2, PM10 and SO2 measured using fixed site monitors. Exposure to indoor air pollution related to home renovation activities were surveyed by a questionnaire. Air pollution exposure during 1st, 2nd and 3rd trimester | Parent reported physician diagnosed life-time prevalence of infectious OM reported at age 3–4 years | Cumulative exposure 3–4 years | Exposure to air pollution and otitis media | Child’s sex, birth season, breastfeeding, antibiotic use, parental atopy, parental SES by house size, ETS, new furniture, house redecoration, visible mould/damp stains, window condensation, household pets, and cockroaches in house | ||||||||
| Single Pollutant (per µgm−3) | OR (95% CI) 1st trimester | OR (95% CI) 2nd trimester | OR (95% CI) 3rd trimester | |||||||||||
| PM10 (15, 14, 16, respectively) | 0.91 (0.67, 1.26) | 1.03 (0.77, 1.39) | 0.89 (0.65, 1.22) | |||||||||||
| SO2 (42, 32, 38, respectively) | 1.46 (1.04, 2.03) | 1.40 (1.06, 1.84) | 1.44 (1.02, 2.03) | |||||||||||
| NO2 (17, 15, 14, respectively) | 0.89 (0.57, 1.37) | 1.20 (0.83, 1.74) | 1.10 (0.77, 1.56) | |||||||||||
Prenatal SO2 exposure was not associated with the repeated attacks, but with onset of OM, OR 1.47 (1.10, 1.96); association was stronger in females and children with parental atopy; children living in houses with window condensation and noticeable cockroaches | ||||||||||||||
| Dostal [25] Teplice and Prachatice, Czech Republic—960 children | Birth cohort followed up to 10 years, Recruited 1994–1999 (NB: only first 2 years’ results were reported) | Compared participants living in more polluted industrial district of Teplice with those in the less polluted rural district of Prachatice Exposure data—town of birth | Used ICD-10 codes H65–67 and H92 which covers serous and infectious OM along with complications like perforation and mastoiditis | 2 years | In the first two years, the children living in the urban and industrial environment of Teplice district had a significantly higher incidence of OM compared to children living in the rural district of Prachatice, Rate ratio 2.3 (95% CI 1.7–4.1). Beyond 2 years of age the differences were not significant. | Gender, ethnicity, maternal age and education, the two parts of the study (at 3 and 4.5 years), season of birth, maternal history of allergy, preterm birth and/or low birth weight, and atopic dermatitis of children | ||||||||
| Jedrychowski [26] Krakow, Poland —333 infants | Birth cohort up to 1 year. Recruited November 2000–August 2002 | Polycyclic aromatic hydrocarbons (PAHs) assigned using prenatal personal air monitoring of mothers in the second trimester of pregnancy over a 48-h period | Parent reported ear infections (OM). Number of episodes and duration reported during 3 months in the first year of life. | 6 months | Increased risk for prenatal PAH exposure and number and duration of ear infections during the first year of life, per log unit of PAH concentration (ngm−3) RR 1.82 (95% CI 1.03, 3.23) and RR 1.64 (95% CI 1.34–2.00), respectively Prenatal PAH exposure and number and duration of ear infections during the first year of life (dichotomized by median values of PAH distribution) RR 2.00 (95% CI 1.09–3.65) and RR 2.05 (95% CI 1.66–2.52), respectively | Increased risk for prenatal PAH exposure and number and duration of ear infections during the first year of life, per log unit of PAH concentration (ngm−3) RR 1.82 (95% CI 1.03, 3.23) and RR 1.64 (95% CI 1.34–2.00), respectively Prenatal PAH exposure and number and duration of ear infections during the first year of life (dichotomized by median values of PAH distribution) RR 2.00 (95% CI 1.09–3.65) and RR 2.05 (95% CI 1.66–2.52), respectively | Child’s sex, birth weight, season of birth, ETS in postnatal period, mother’s allergy, mother’s education level, moulds at home | |||||||
| MacIntyre [13] 10 European birth cohorts within the ESCAPE Project: BAMSE (Sweden), GASPII (Italy), GINIplus and LISAplus (Germany), MAAS (United Kingdom), PIAMA (Netherlands), and four INMA cohorts (Spain), —16,059 children | Follow up from birth to 2 years (6 months–3 years depending on cohort) | Assigned NO2, NOX, PM2.5, PM2.5 absorbance, PM10, and PM2.5–10 exposure at birth using LUR models | Parent report of physician-diagnosed OM (not specified) | 6 months–3 years depending on included cohort | Combined results for air pollution exposure during birth and OM from birth to 2nd year of life | Municipality (BAMSE), sex, older siblings, breastfeeding at 6 months, parental atopy, child-care, maternal smoking during pregnancy, any ETS in the child’s home, visible mould or dampness in the home, use of gas stove, birth season, parental SES, and intervention (GINIplus, MAAS, PIAMA). | ||||||||
| Pollutant | OR (95% CI) | |||||||||||||
| NO2 (per 10 µgm−3) | 1.09 (1.02, 1.16) | |||||||||||||
| NOX (per 5 μgm−3) | 1.05 (0.98, 1.12) | |||||||||||||
| PM2.5 (per 5 µgm−3) | 1.06 (0.75, 1.49) | |||||||||||||
| PM2.5 absorbance (per 1 unit) | 1.08 (0.83, 1.39) | |||||||||||||
| PM2.5–10 (per 5 µgm−3) | 0.97 (0.88, 1.08) | |||||||||||||
| PM10 (per 10 µgm−3) | 0.98 (0.84, 1.14) | |||||||||||||
| MacIntyre [28] South-west British Columbia, Canada—45,513 infants (a retrospective cohort) | Follow up from birth to 2 years. 1999–2000 | (1) Inverse-distance weighting of monitor data (CO, NO, NO2, O3, PM2.5, PM10, SO2); (2) LUR model (NO, NO2, PM2.5, black carbon, wood smoke); (3) proximity to roads and point sources. Estimated 24 months of life | Outpatient physician visits codes for infectious and serous OM from a series of linked administrative datasets obtained from the BC Ministries of Health, Vital Statistics Agency, and Perinatal Database Registry. | Cumulative exposure 24 months | Air pollution exposure during birth and OM from birth to 2nd year of life (pollutants from LUR) | * sex, Aboriginality, older siblings, maternal smoking during pregnancy, maternal age, neighbourhood income, neighbourhood female education. | ||||||||
| Adjusted for * | Adjusted for * + OM season | |||||||||||||
| Pollutant | OR (95% CI) | OR (95% CI) | ||||||||||||
| NO2 (per 10 µg/m−3) | 1.09 (1.07–1.12) | 0.97 (0.95, 0.99) | ||||||||||||
| NO (per 24.1 µgm−3) | 1.18 (1.16–1.21) | 1.10 (1.07, 1.12) | ||||||||||||
| PM2.5 (per 1.8 µgm−3) | 0.91 (0.89–0.93) | 0.99 (0.97, 1.01) | ||||||||||||
| Black carbon (per 1.1 µgm−3) | 0.94 (0.93–0.96) | 0.99 (0.97, 1.01) | ||||||||||||
| Wood smoke (per 16 days) | 1.51 (1.47–1.55) | 1.32 (1.27, 1.36) | ||||||||||||
| Pettigrew [27] Virginia, U.S.—904 infants | Birth cohort study, 3 months to 1 year follow up. Participants were selected based on use of regular kerosene heater or gas stove. Non-smoking mother and households. 1993–1996 | Self-reported number of hours each secondary heating source was used in the home during that reporting period | Mother reported physician diagnosed ear infections during telephone interviews every 14–19 days for the 1st year of life. | 9 months | Association of indoor secondary heating sources and OM | Heating season, gas appliances in the home, infant sex, season of birth, race, mother’s education, other children in the household, duration of breastfeeding, mother’s allergies, mother’s asthma, reported mold in the home, pet cat or dog | ||||||||
| Average daily use—unadjusted | Average daily use—adjusted | |||||||||||||
| Type of heating—per 8-h/day increase | OR (95% CI) | OR (95% CI) | ||||||||||||
| Fireplace | 1.51 (1.17–1.93) | 1.25 (0.92–1.69) | ||||||||||||
| Wood stove | 1.14 (1.00–1.29) | 1.01 (0.52–1.23) | ||||||||||||
| Kerosene heater | 1.05 (0.92–1.21) | 1.07 (0.92–1.26) | ||||||||||||
| Case Crossover studies | Study, Country and Sample | Study Design | Exposure Assessment & Age | Outcome Assessment & Age | Time between Exposure and Outcome | Results | Adjustment for Confounders | |||
|---|---|---|---|---|---|---|---|---|---|---|
| Strickland, Hao [42] Georgia, USAChildren aged 0–18 years attending ED (n = 8,252,559) | Time-stratified, ecological case crossover 1 January 2002 to 30 June 2010 | Aerosol Optical Depth derived from MODIS satellite | ED visits to 150 hospitals extracted from Georgia Hospital Association. OM was identified by discharge diagnosis of OM using ICD—9 codes (381 or 382)—both non-suppurative and suppurative and not specified OM | Air pollution and OM measured at same time (cross-sectionally lag 1) | Odds ratios per 10-μgm−3 increase in same-day PM2.5 and OM ED visits Lag 0 OR = 1.005 (95% CI 0.996, 1.014) Lag 1 OR = 0.995 (95% CI 0.985, 1.004) | Temperature, mean humidity, day of year, day of week, warm season, holiday, lag holiday | ||||
| Xiao, Liu [43] Georgia, USA Children aged 0–18 years attending ED (n = 422,268) | Time-stratified, ecological case crossover 1 January 2002 to 31 December 2008 | Daily pollutant concentration at 12 km spatial resolution, estimated from CMAQ model simulations: CO, NO2, SO2, O3, PM10, PM2.5, SO4=, NO3−, NH4+, EC, OC | ED visits to 150 hospitals for OM extracted from Georgia Hospital Association. OM was identified by discharge diagnosis of OM using ICD-9 codes (381 or 382). | Up to 3 day 3-day lag between air pollution measurement and ED presentations for OM | ORs for interquartile range increases in 3-day moving average ambient air pollutant concentrations. Traffic pollutants (CO, NO2, EC, and OC) associated with increased risk of OM Joint effects (with interactions) OR = 1.025 (95% CI 1.012, 1.039) Joint effects (without interactions) OR = 1.018 (95% CI 1.010, 1.026) | Temperature, humidity, warm season, holiday, lag holiday | ||||
| Zemek [44] Canada—14,527 children (aged 1–3 years, over 10 year period) who attended ED for OM | Time-stratified ecological case crossover study | Data for CO, NO2, O3, SO2, and PM10 and PM2.5 were obtained from fixed site monitoring stations. | OM was identified by discharge diagnosis of OM using ICD-9 rubric (code 382.9 only) | Up to 4-day lag between air pollution measurement and ED presentations for OM | Associations between IQR increase in pollutants and OM ED visits based on lag times (days) | Temperature, and relative humidity | ||||
| Pollutan | Lag | Warm months OR (95% CI) | Cold months OR (95% CI) | |||||||
| CO | 1 | 1.08 (1.00, 1.17) | 0.98 (0.96, 1.00) | |||||||
| 2 | 1.14 (1.06, 1.23) | 1.02 (0.99, 1.04) | ||||||||
| 3 | 1.08 (1.00, 1.16) | 1.00 (0.98, 1.02) | ||||||||
| NO2 | 2 | 1.10 (1.02, 1.19) | 1.03 (1.00, 1.07) | |||||||
| 3 | 1.08 (1.00, 1.17) | 0.99 (0.96, 1.03) | ||||||||
| O3 | 1 | 1.01 (0.93, 1.09) | 1.07 (1.01, 1.14) | |||||||
| PM10 | 2 | 1.05 (1.00, 1.10) | 1.01 (0.97, 1.05) | |||||||
| 4 | 1.05 (1.00, 1.10) | 1.00 (0.96, 1.04) | ||||||||
Overall the strongest associations were during the warm months compared to cold months | ||||||||||
| Kousha [41] Ontario, Canada —4815 children aged ≤3 years | Time-stratified, ecological case crossover study of ED visits for OM | Air Quality Health Index (AQHI) | ED visits with ICD-10 codes H65 (nonsuppurative OM) and H66 (suppurative and unspecified OM) used to identify visits for conditions related to acute and chronic middle ear inflammation. | Up to 15-day lag between air pollution measurement and ED presentations for OM | Odds ratio for 16.5 ppb (IQR) increase in O3 and 8.2 µgm−3 (IQR) increase in PM2.5 and OM ED visits | Humidity, temperature | ||||
| Pollutant | Lag days | OR (95% CI) | ||||||||
| O3 (8 h) | 6 | 1.16 (1.02, 1.31) | ||||||||
| 7 | 1.20 (1.05, 1.34) | |||||||||
| PM2.5 | 3 | 1.07 (1.01,1.13) | ||||||||
| 4 | 1.07 (1.01, 1.13) | |||||||||
For every 1 unit increase in the AQHI, discharge diagnosis of OM increased 5% to 6% three days post exposure Distributed Lag Nonlinear Model ResultsThe overall risk for OM, in the first 15 days after an increase in the AQHI, was 1.22 times the risk of OM on days following no increase in exposures | ||||||||||
| Time-Series | Gestro [40] Cuneo, Italy —2532 children and adolescents aged 0–18 years attending ED with OM. | Hospital based time series analysis 2007–2010 | PM10, NO2, O3, CO from a fixed site monitoring station | Diagnoses were coded according to the ICD-9 coding for OM (1st and 2nd diagnosis) | Modest association between increased NO2 and attending ED with OM, RR 1.03 (95% CI 1.01,1.05) with a lag time range from 0–8 h per 10 μgm−3 of NO2 | Upper respiratory tract infections, influenza, seasonality | ||||
| Case Control Studies | Study, Country and Sample | Study Design | Exposure Assessment | Outcome Assessment | Results | Adjustment for Confounders | ||||
|---|---|---|---|---|---|---|---|---|---|---|
| Daigler [30], USA —371 children attending 4 private paediatricians | Case-control study 1986–1987 | Parental questionnaire about housing conditions, type of heating fuel used and type of cooking stove used. | Cases defined as children with ≥2 visits for separate OM episodes diagnosed using pneumatoscopy. Controls were children seen for routine health maintenance without acute diseases. | Wood burning stove associated with OM children OR 1.73 (95% CI 1.03–2.89) | None | |||||
| da Costa [31], Maputo, Mozambique —750 children <6 years old from a hospital and its catchment area. | Case-control study | Research nurse administered questionnaire to parents: exposure to wood smoke, charcoal smoke and other covariates. | Cases were the children having type B tympanograms in one or both ears, and classified as having middle ear effusion. Controls were recruited from the same village or neighbourhood as the cases, and matched by age (±4 months) and sex. | Charcoal or wood use in home associated with OM in children <2 years of age OR 3.09 (95% CI 2.0, 4.78). Charcoal or wood use in home associated with OM in children >2 years of age OR 3.18 (95% CI 2.01, 5.01). | Sex and age | |||||
| Cross sectional analysis | Harvey [34], UK —4949 school children aged 8–16 years | Cross-sectional analysis of a cohort during 8 years. 1964–1971 | Living in rural or urban area | Secretory OM diagnosed at a clinic—“cases where aspiration under general anaesthetic resulted in a fluid ranging from a thin, easily-evacuated fluid to the “glue” of the so-called glue ear.” | Incidence of secretory OM = 13.1 per 1000 school children in the rural area; and 19.8 per 1000 school children in the city area. No statistical tests were reported | None | ||||
| Bhattacharyya [32] The National Health Interview Survey (USA) —126,060 children | Cross sectional samples from 1997–2006 | CO, NO2, SO2 and PM data from fixed site monitors | Parent reported 12-month prevalence of ≥3 ear infection episodes | Lower prevalence of ear infection was found to be related to the lower levels of ambient criteria pollutants (i.e., improvements in air quality). Regression coefficient p-value < 0.001 for all pollutants. | None | |||||
| Bhopal [33] UK—“green field” coking works sites —685 children (ages not reported) | Cross sectional—participants living closer and farther away from a coking works site, during 1990–1991 | Exposure to coking works categorized into inner, outer and control groups. | Prevalence of “Glue Ear” was collected using a postal survey | Living closer to coking works and reported “Glue Ear” in children 0–15 years | None | |||||
| Inner (%) | Outer (%) | Control (%) | Chi2 trend p | |||||||
| “Glue Ear” | 15.2 | 8.6 | 9.0 | <0.02 | ||||||
| Heinrich [38] former East Germany —4949 children aged 5–14 years | Three repeated cross sectional surveys: 1992–1993, 1995–1996, and 1998–1999 | SO2 and Total Suspended Particles (TSP) measured using a mobile and fixed monitoring stations | Parent reported child ever diagnosed with OM by a physician | Increasing air pollution exposure and OM in children | Age, sex, parental education, parental atopy, home dampness or moulds, gas cooking, ETS at home and contact with cats | |||||
| TSP (50 µgm−3 Increment) OR (95% CI) | SO2 (100 µgm−3 Increment) OR (95% CI) | |||||||||
| Prevalence of OM | 1.45 (0.89, 2.37) | 1.42 (0.94, 2.15) | ||||||||
| Heinrich [35] former East Germany —3785 children aged 5–14 years | Two repeated cross sectional surveys: 1992–1993 and 1995–1996 | Air pollution measured using fixed monitoring stations and specific monitors placed for the study | Parent reported child ever diagnosed with OM by a physician | Decreased prevalence of OM (30.9% versus 26.3%) was found between the 1992–1993 survey and the 1995–1996 surveys Decreased prevalence of OM was observed between the two surveys OR: 0.83; (95% CI: 0.73 to 0.96). Associations with changing levels of air pollutants not reported | Area, age, parent education, birth weight, breastfeeding, parental atopy, house status, house living space, bedroom share, dampness, type of heating, presence of carpet, ETS exposure, mother’s smoking during pregnancy, contact with cats and day care attendance | |||||
| Holtby [36], UK —1116 School entrant children | Cross sectional analysis 1988–1992 | Distance between children’s home address and industrial emission source | OME defined by clinical examination using pure tone audiometry and auto admittance | Statistically significant higher proportion of children with OME lived within a 1000-m buffer from an industrial pollution source than >1000-m from an industrial pollution source. | None | |||||
| Ribeiro [39] Sao Paulo, Brazil —323 children aged 11–13 years, living in 3 areas with different air pollution levels: low, intermediate and very high. | Cross sectional analysis 1998 | Air pollution data obtained from fixed site monitoring stations, mainly for SO2 and PM | Parent reported ear infections | Higher prevalence of ear infections in the more polluted areas than in the less polluted areas | None | |||||
| Sprem [37], Zagreb, Croatia —297 children aged 1–10 years admitted to one hospital for Secretory OM (SOM) | Hospital based cross sectional study 1981–1990 | Observations for SO2 and smoke obtained from a single monitoring station | Surgical confirmation of SOM | No statistically significant correlations between air pollutant levels and SOM hospital admissions | None | |||||
© 2018 by the authors. Licensee MDPI, Basel, Switzerland. This article is an open access article distributed under the terms and conditions of the Creative Commons Attribution (CC BY) license (http://creativecommons.org/licenses/by/4.0/).
Share and Cite
Bowatte, G.; Tham, R.; Perret, J.L.; Bloom, M.S.; Dong, G.; Waidyatillake, N.; Bui, D.; Morgan, G.G.; Jalaludin, B.; Lodge, C.J.; et al. Air Pollution and Otitis Media in Children: A Systematic Review of Literature. Int. J. Environ. Res. Public Health 2018, 15, 257. https://doi.org/10.3390/ijerph15020257
Bowatte G, Tham R, Perret JL, Bloom MS, Dong G, Waidyatillake N, Bui D, Morgan GG, Jalaludin B, Lodge CJ, et al. Air Pollution and Otitis Media in Children: A Systematic Review of Literature. International Journal of Environmental Research and Public Health. 2018; 15(2):257. https://doi.org/10.3390/ijerph15020257
Chicago/Turabian StyleBowatte, Gayan, Rachel Tham, Jennifer L. Perret, Michael S. Bloom, Guanghui Dong, Nilakshi Waidyatillake, Dinh Bui, Geoffrey G. Morgan, Bin Jalaludin, Caroline J. Lodge, and et al. 2018. "Air Pollution and Otitis Media in Children: A Systematic Review of Literature" International Journal of Environmental Research and Public Health 15, no. 2: 257. https://doi.org/10.3390/ijerph15020257
APA StyleBowatte, G., Tham, R., Perret, J. L., Bloom, M. S., Dong, G., Waidyatillake, N., Bui, D., Morgan, G. G., Jalaludin, B., Lodge, C. J., & Dharmage, S. C. (2018). Air Pollution and Otitis Media in Children: A Systematic Review of Literature. International Journal of Environmental Research and Public Health, 15(2), 257. https://doi.org/10.3390/ijerph15020257