An Integrative, Systematic Review Exploring the Research, Effectiveness, Adoption, Implementation, and Maintenance of Interventions to Reduce Sedentary Behaviour in Office Workers


Abstract
1. Introduction
2. Methods
2.1. Search Strategy
2.2. Screening Process
2.3. Data Extraction
2.3.1. Reach
2.3.2. Efficacy/Effectiveness
2.3.3. Adoption
2.3.4. Implementation
2.3.5. Maintenance
2.4. Quality Assessment
3. Results
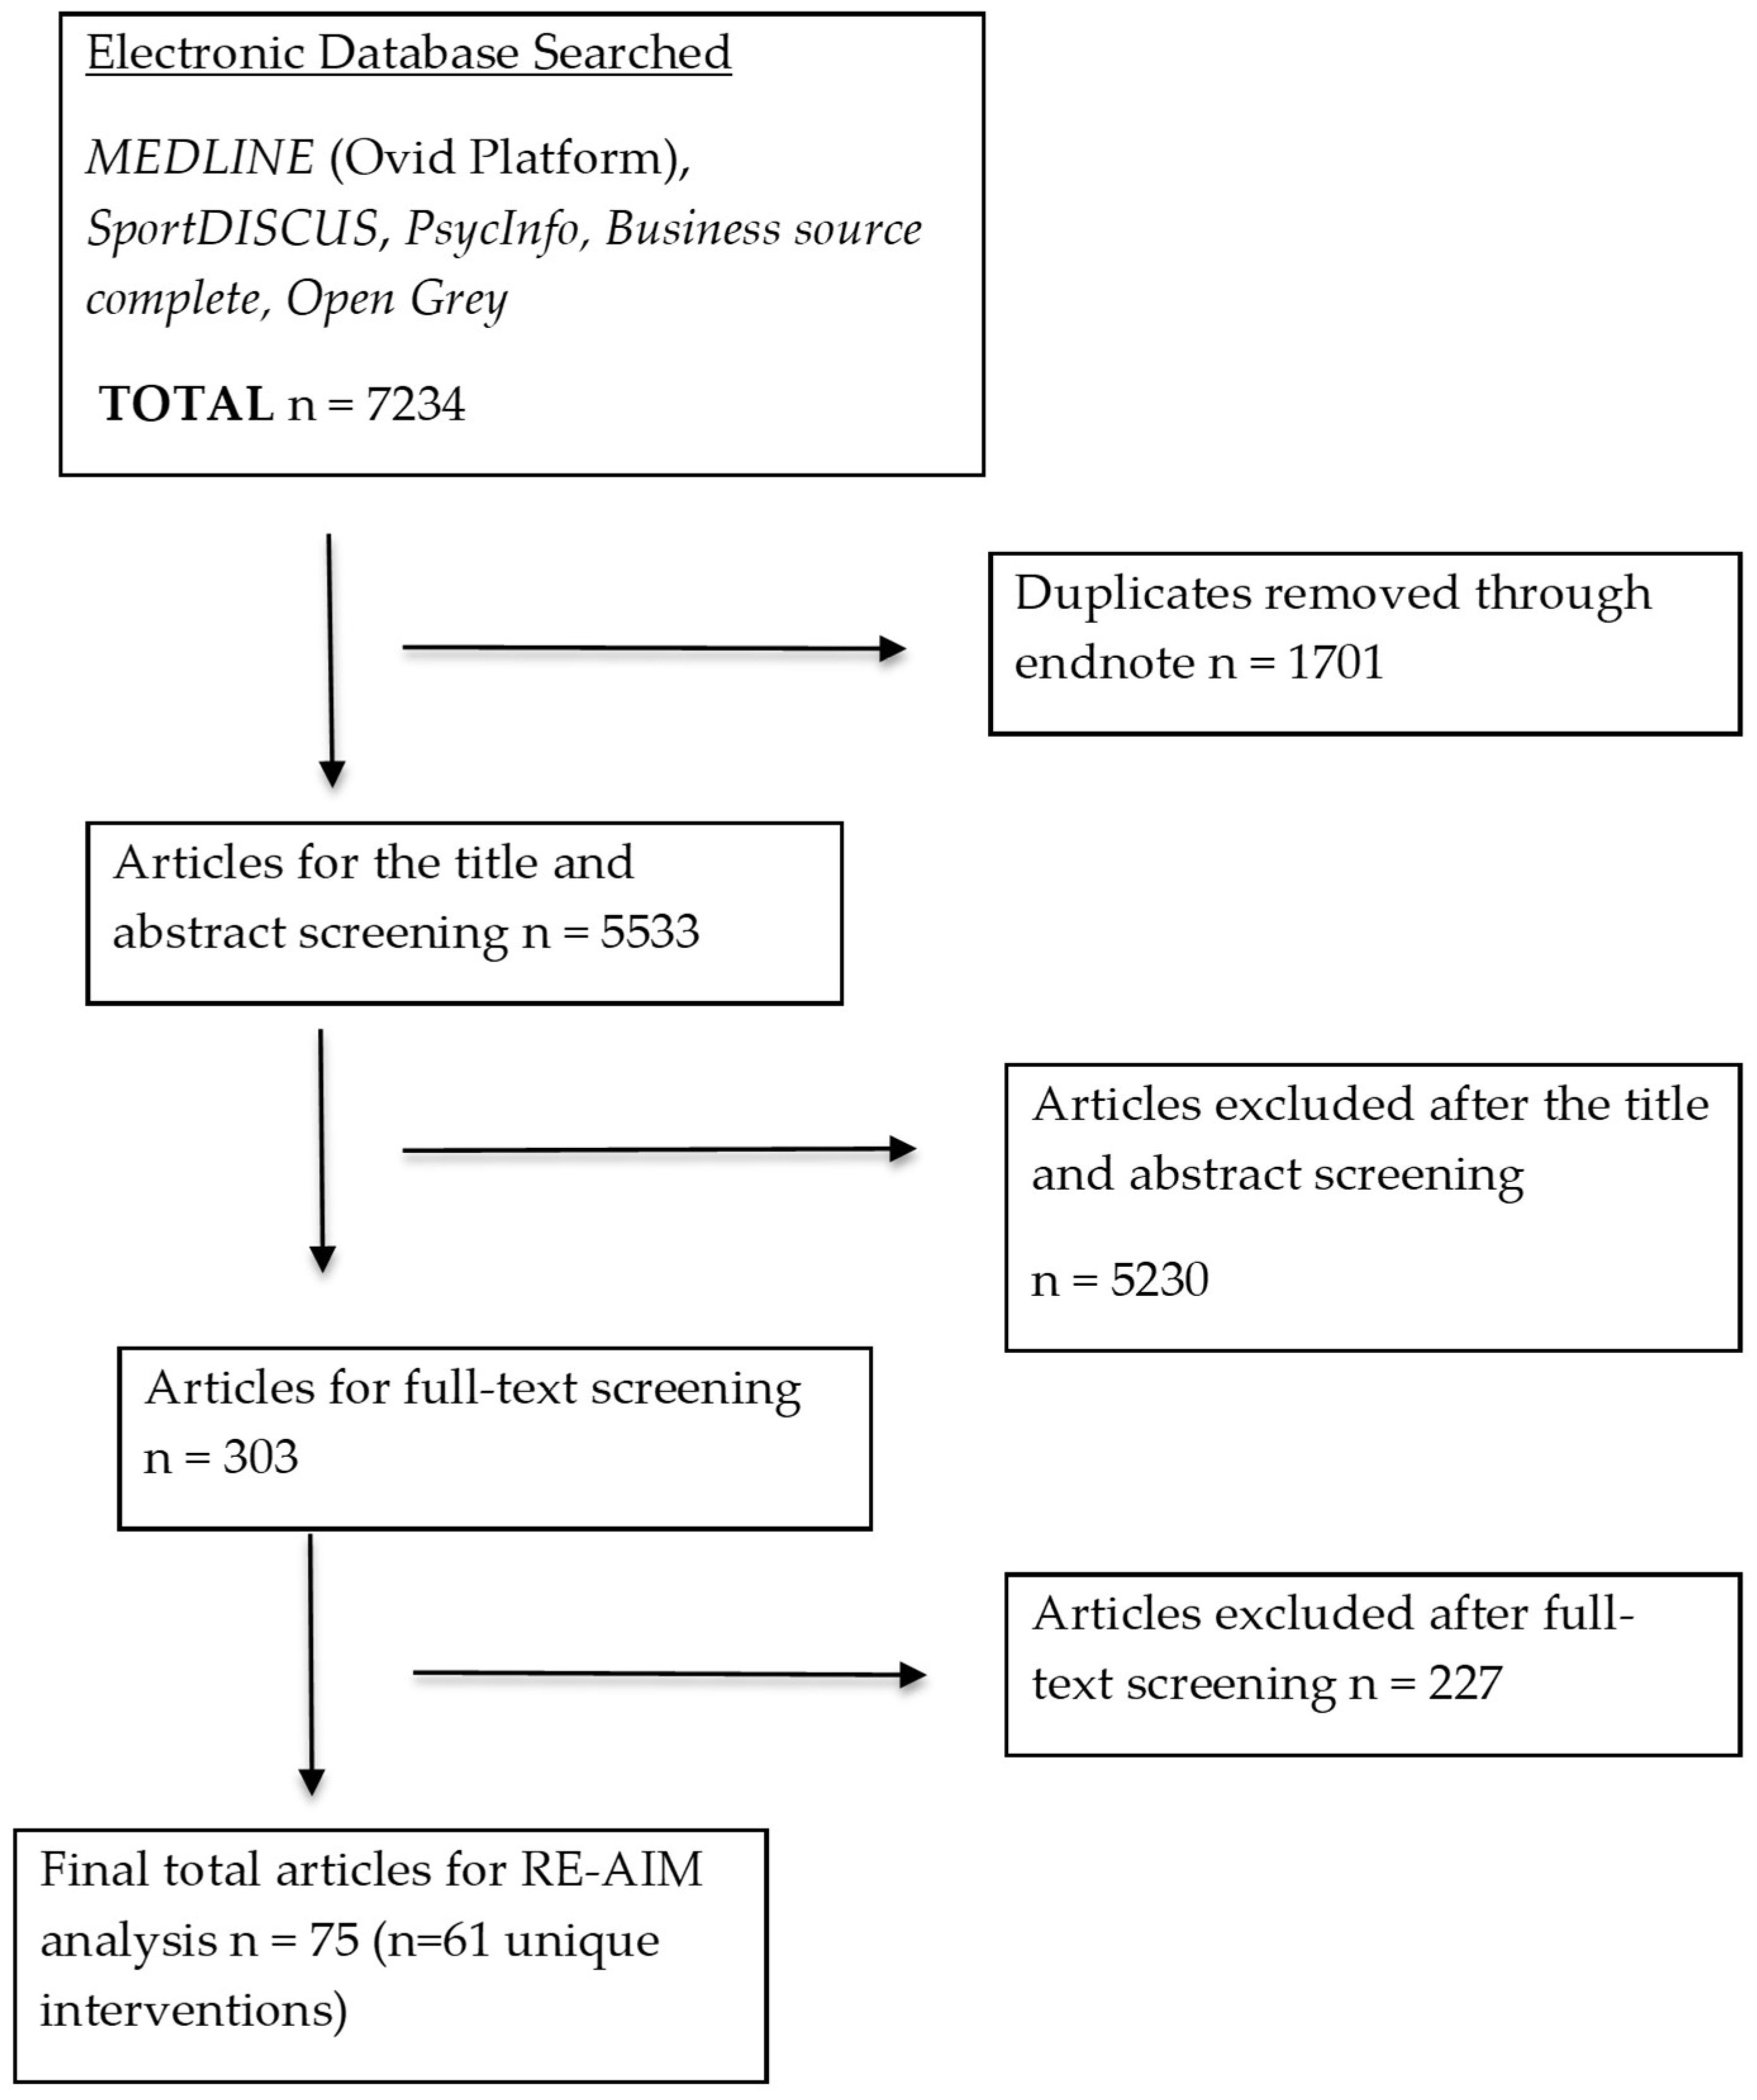
3.1. Study Selection
3.2. Characteristics of Identified Articles
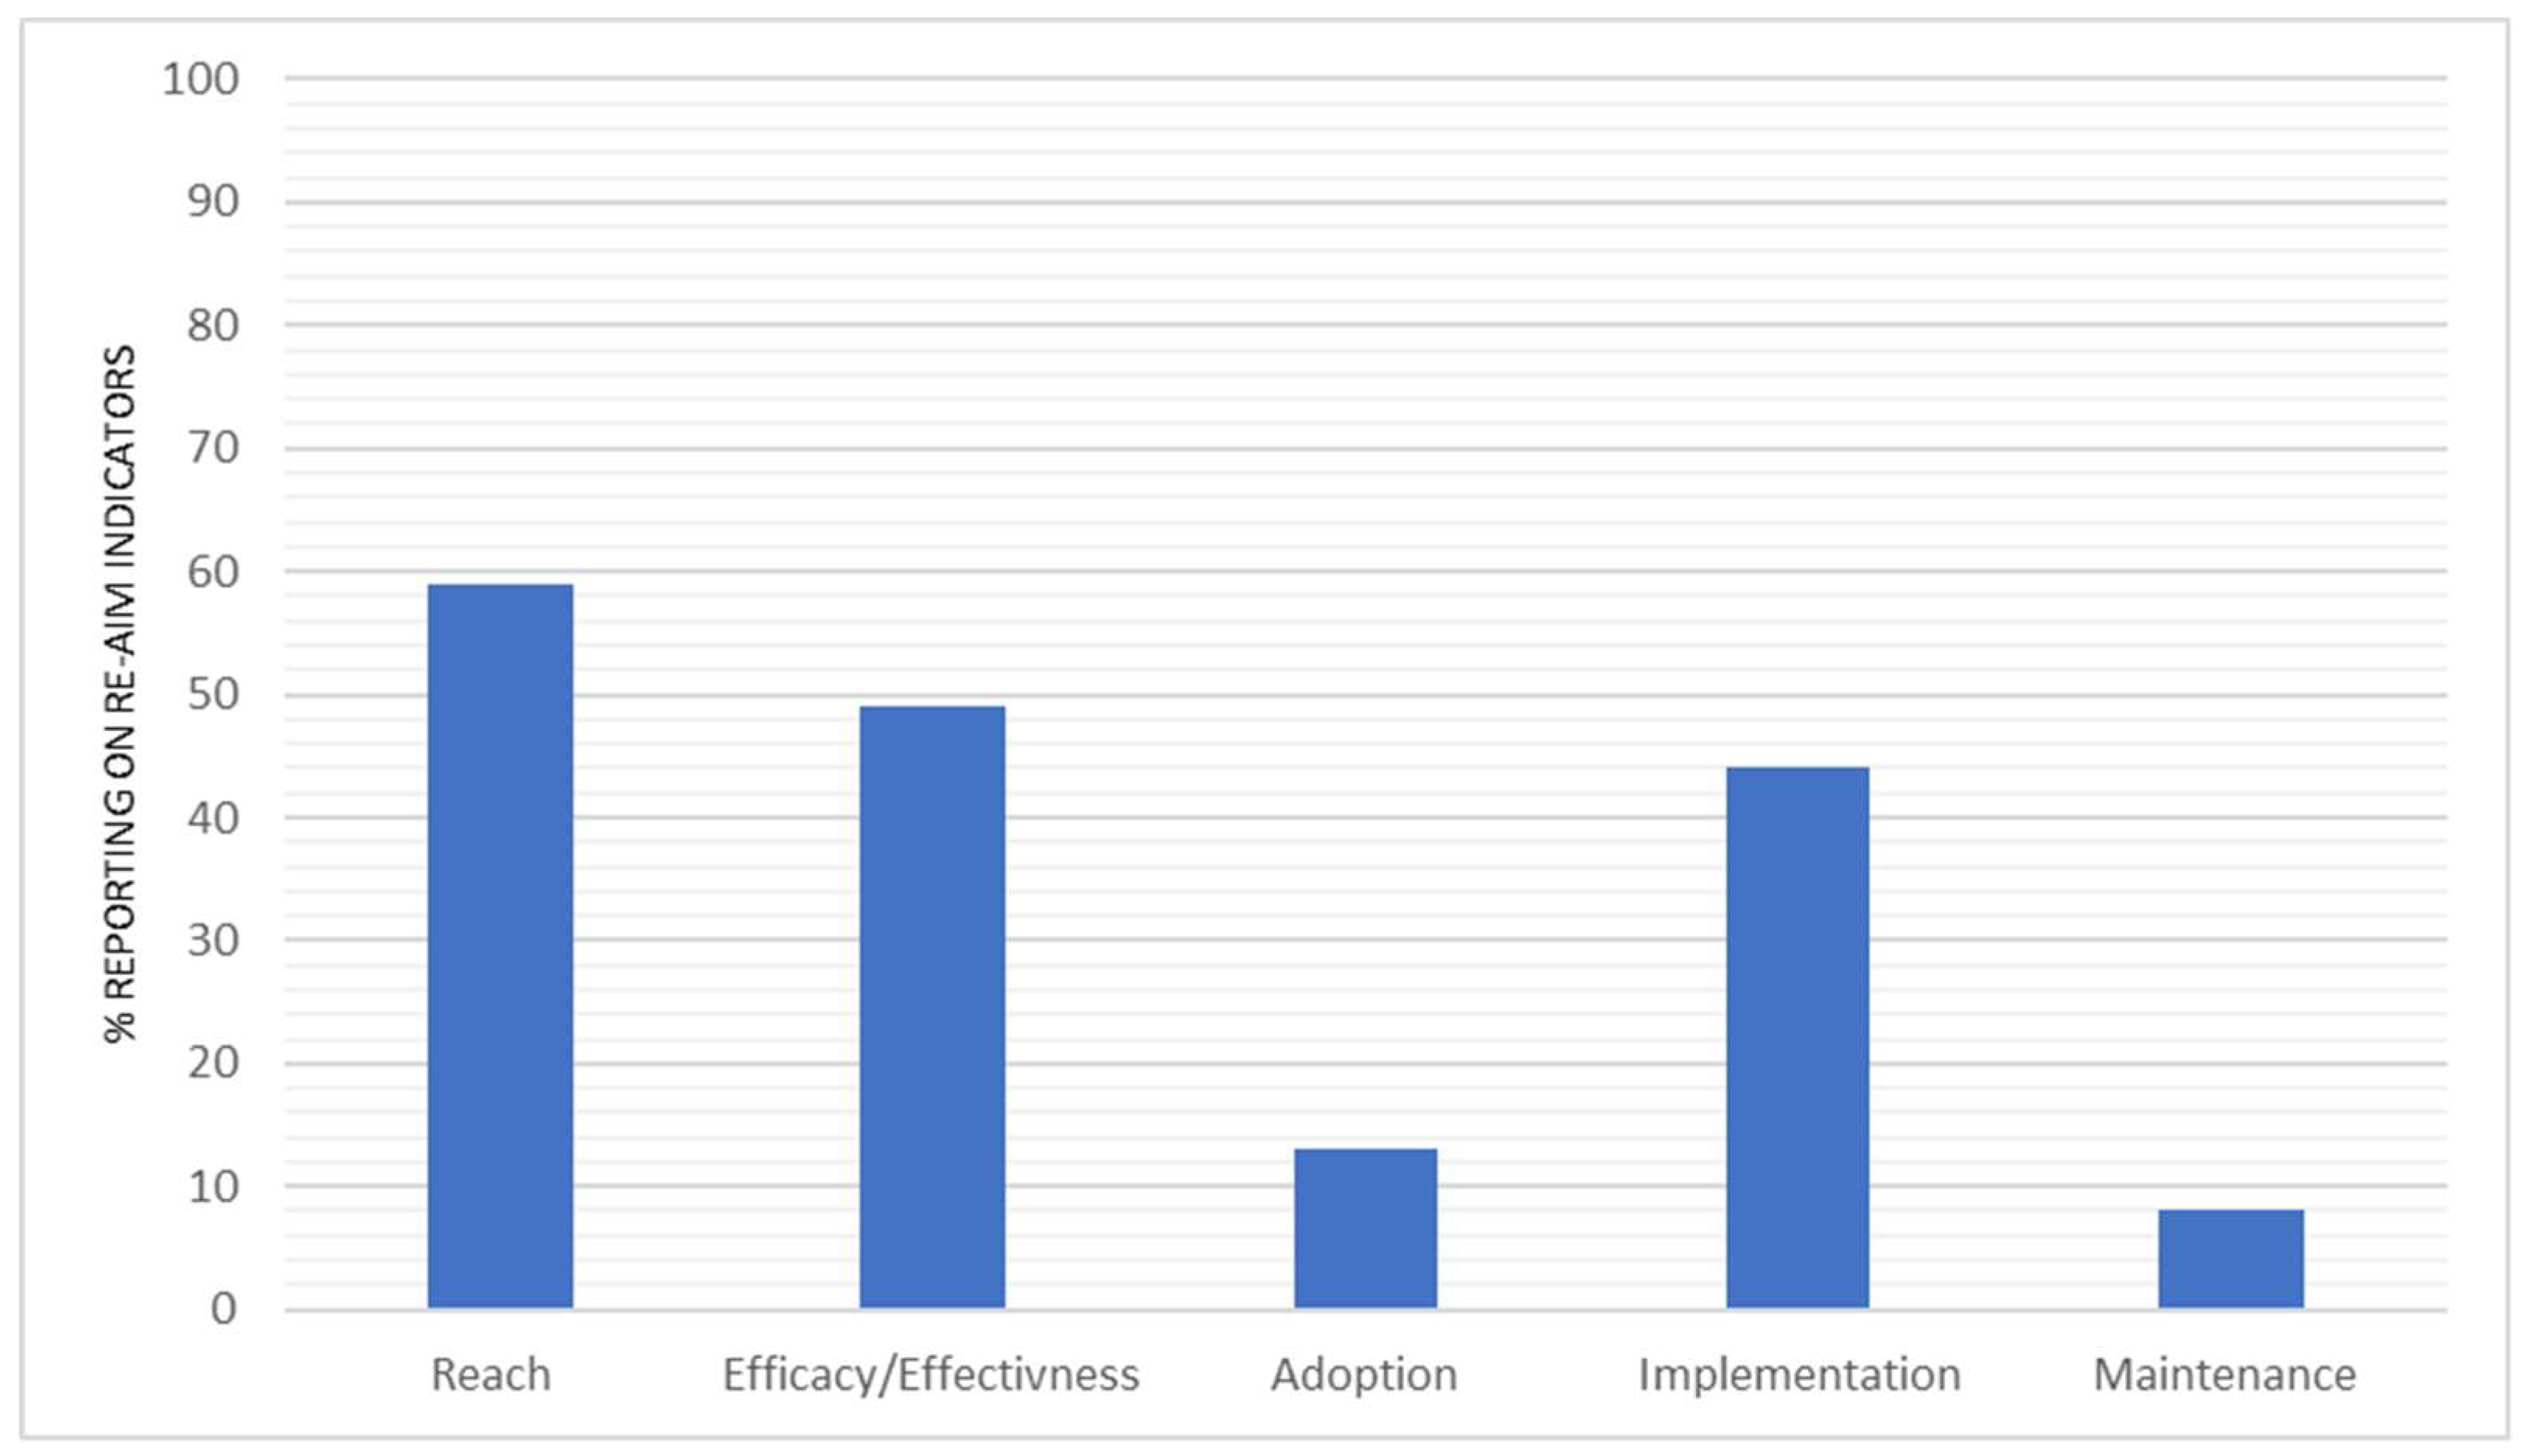
3.3. Percentage Reporting across RE-AIM Dimensions
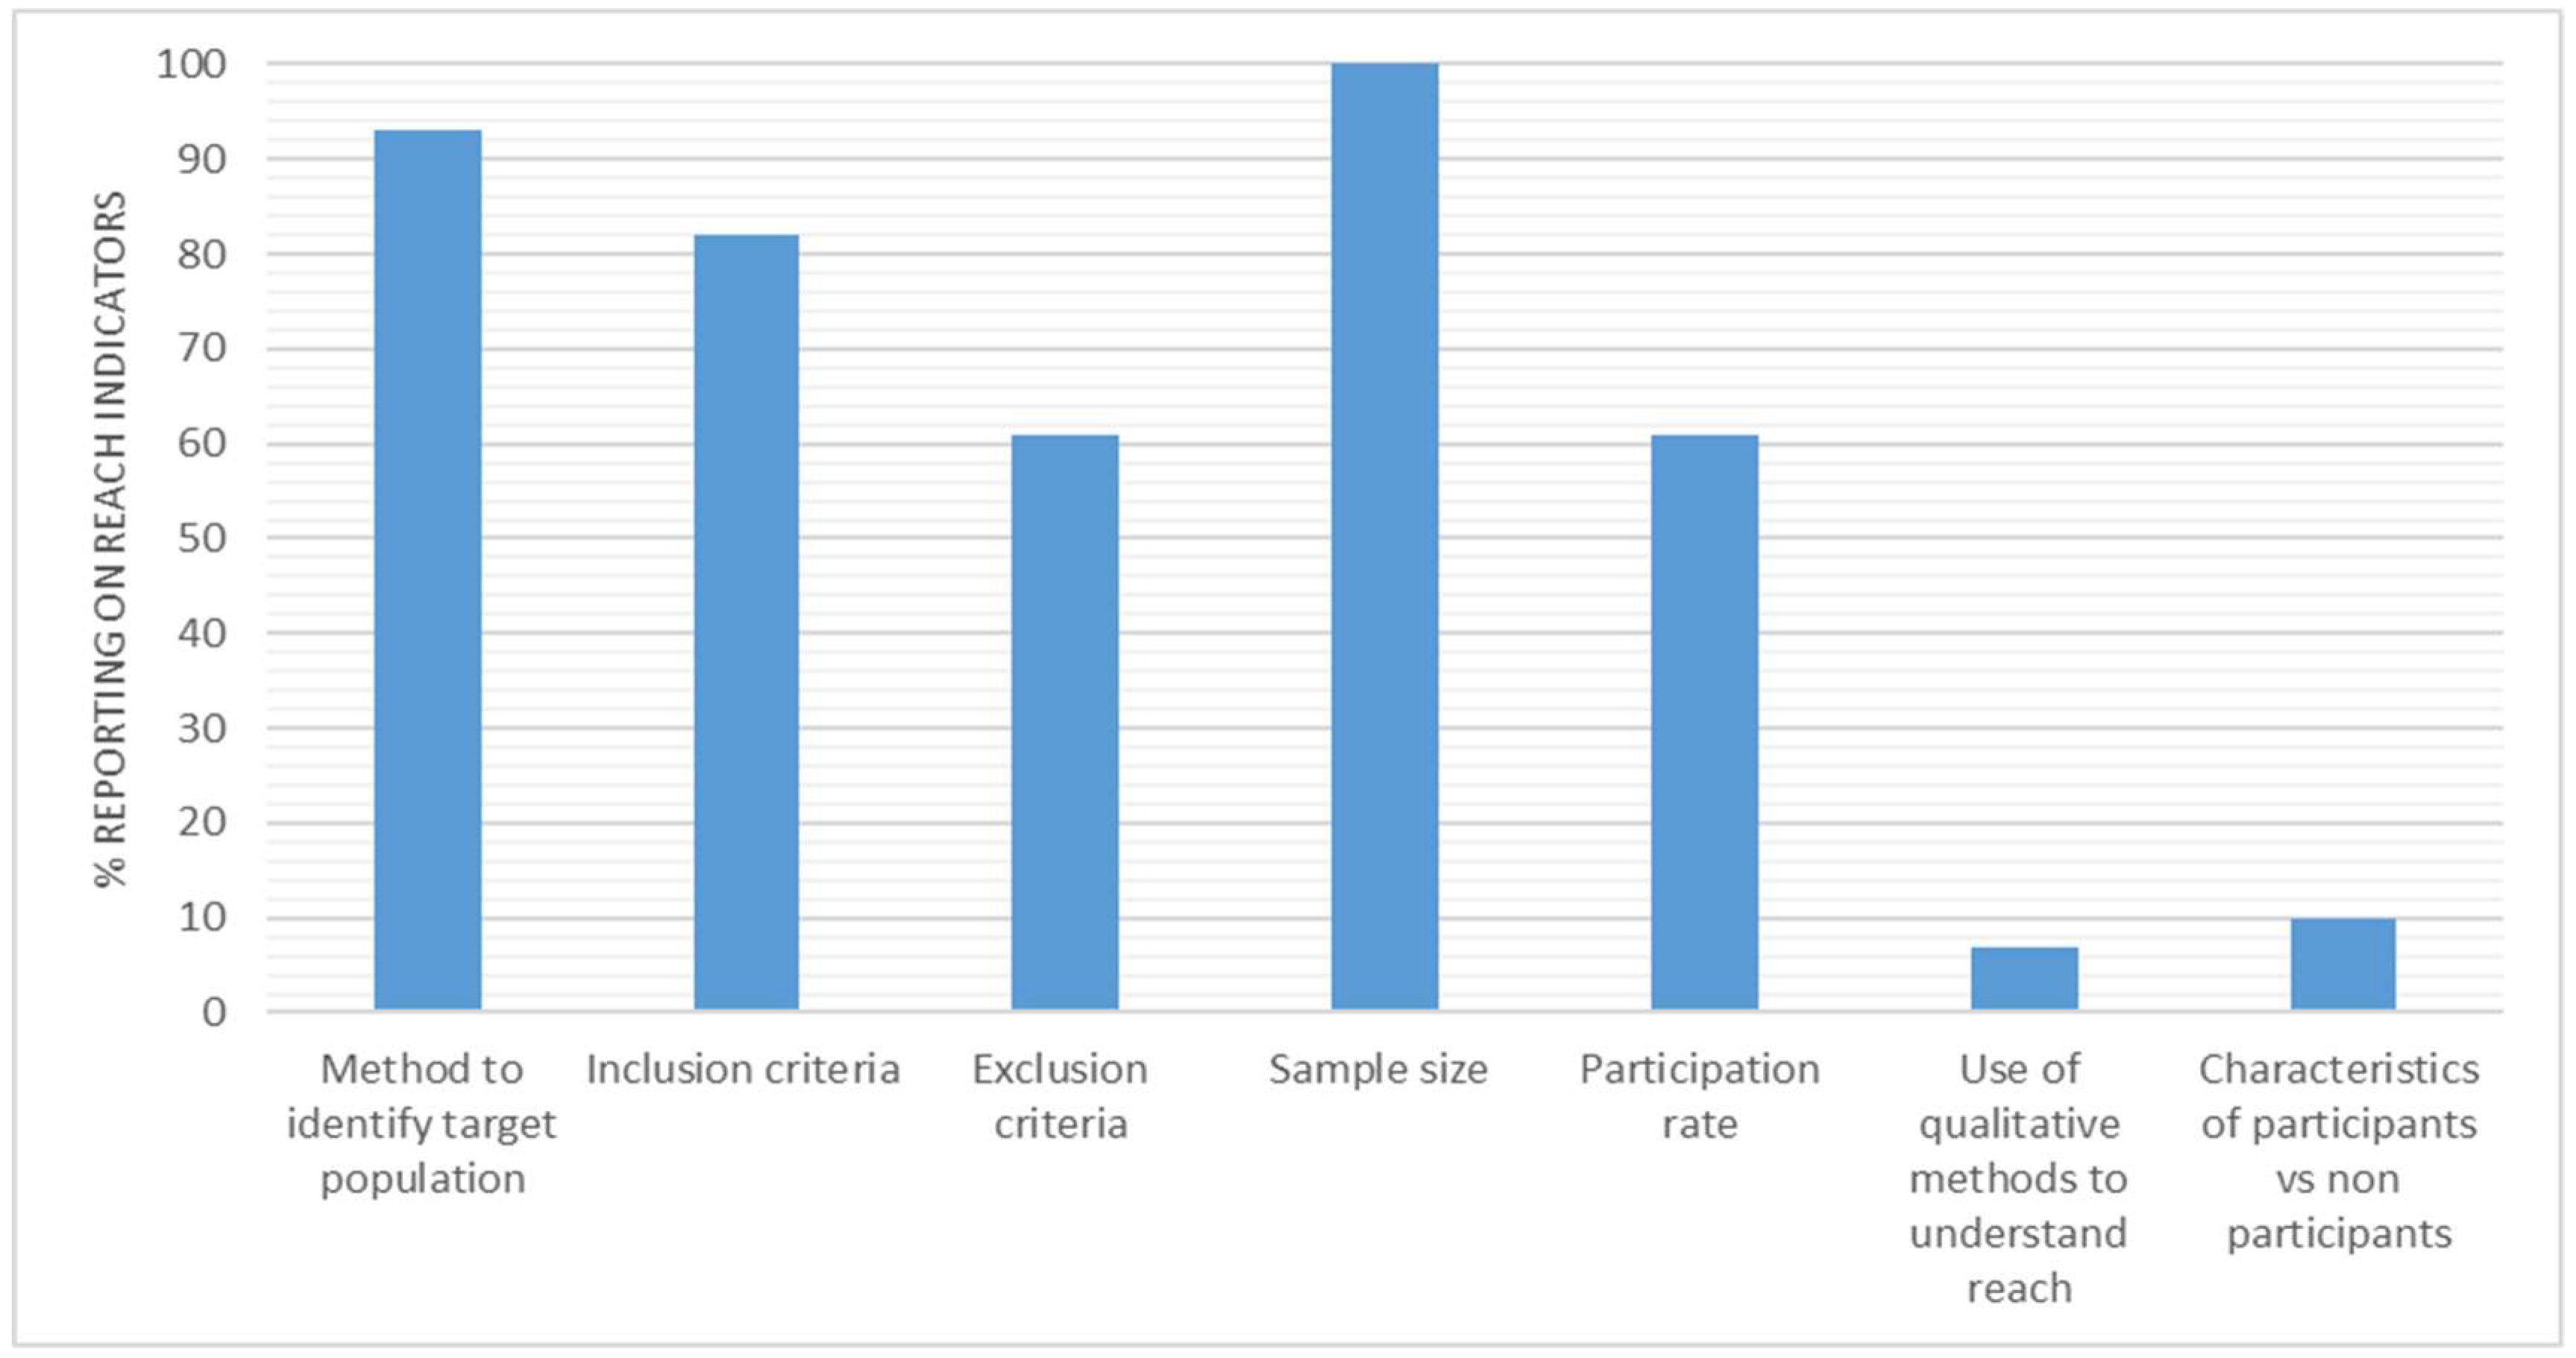
3.4. Reach
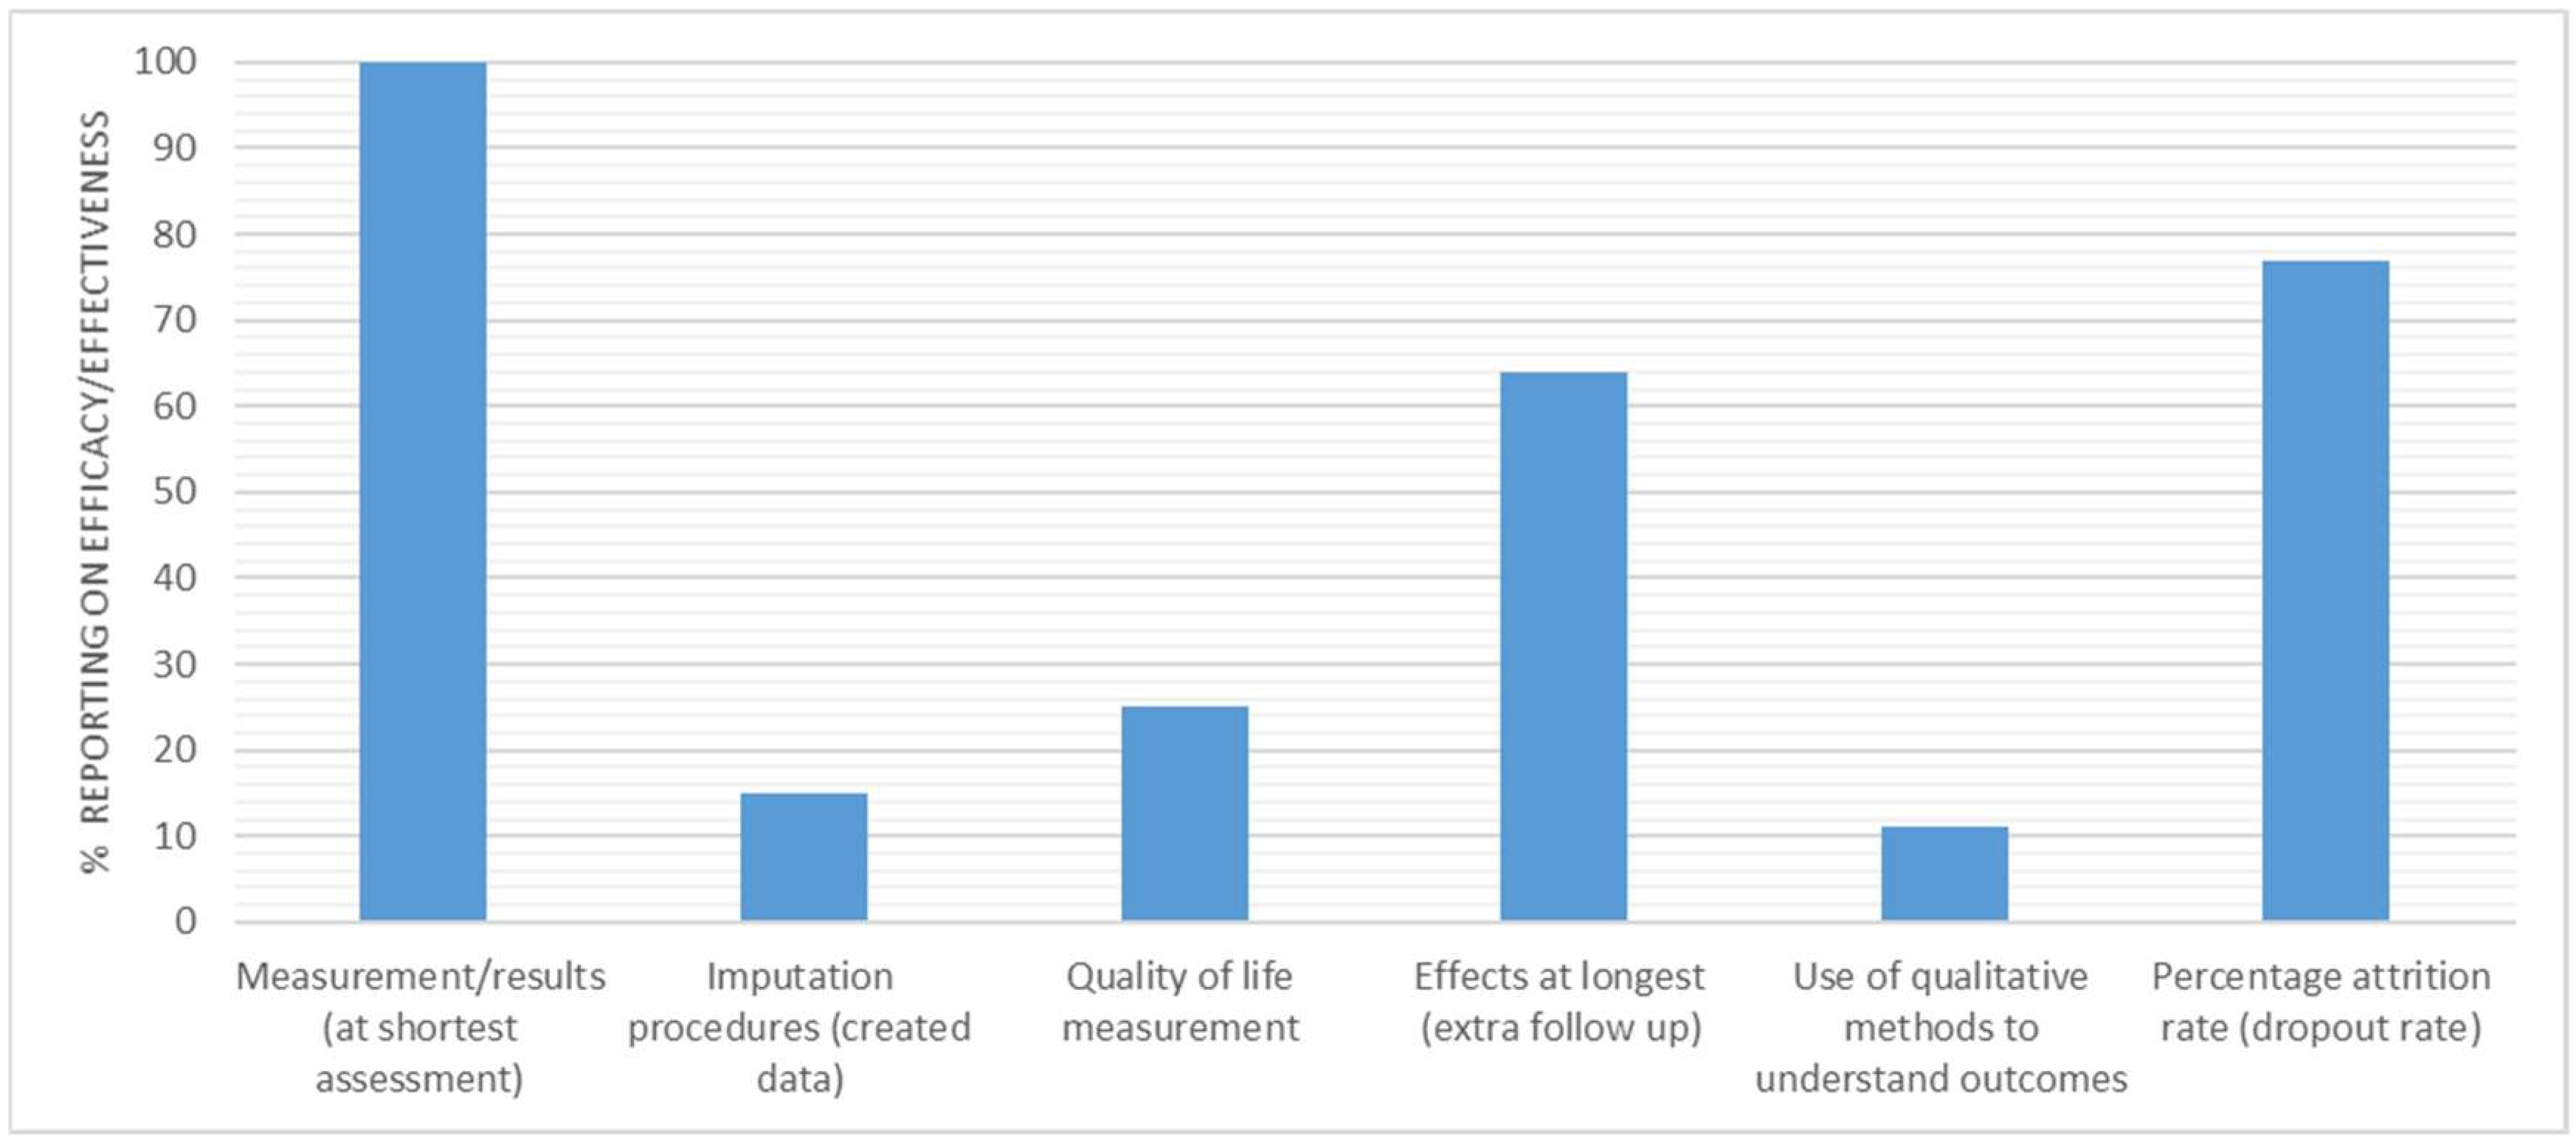
3.5. Efficacy/Effectiveness
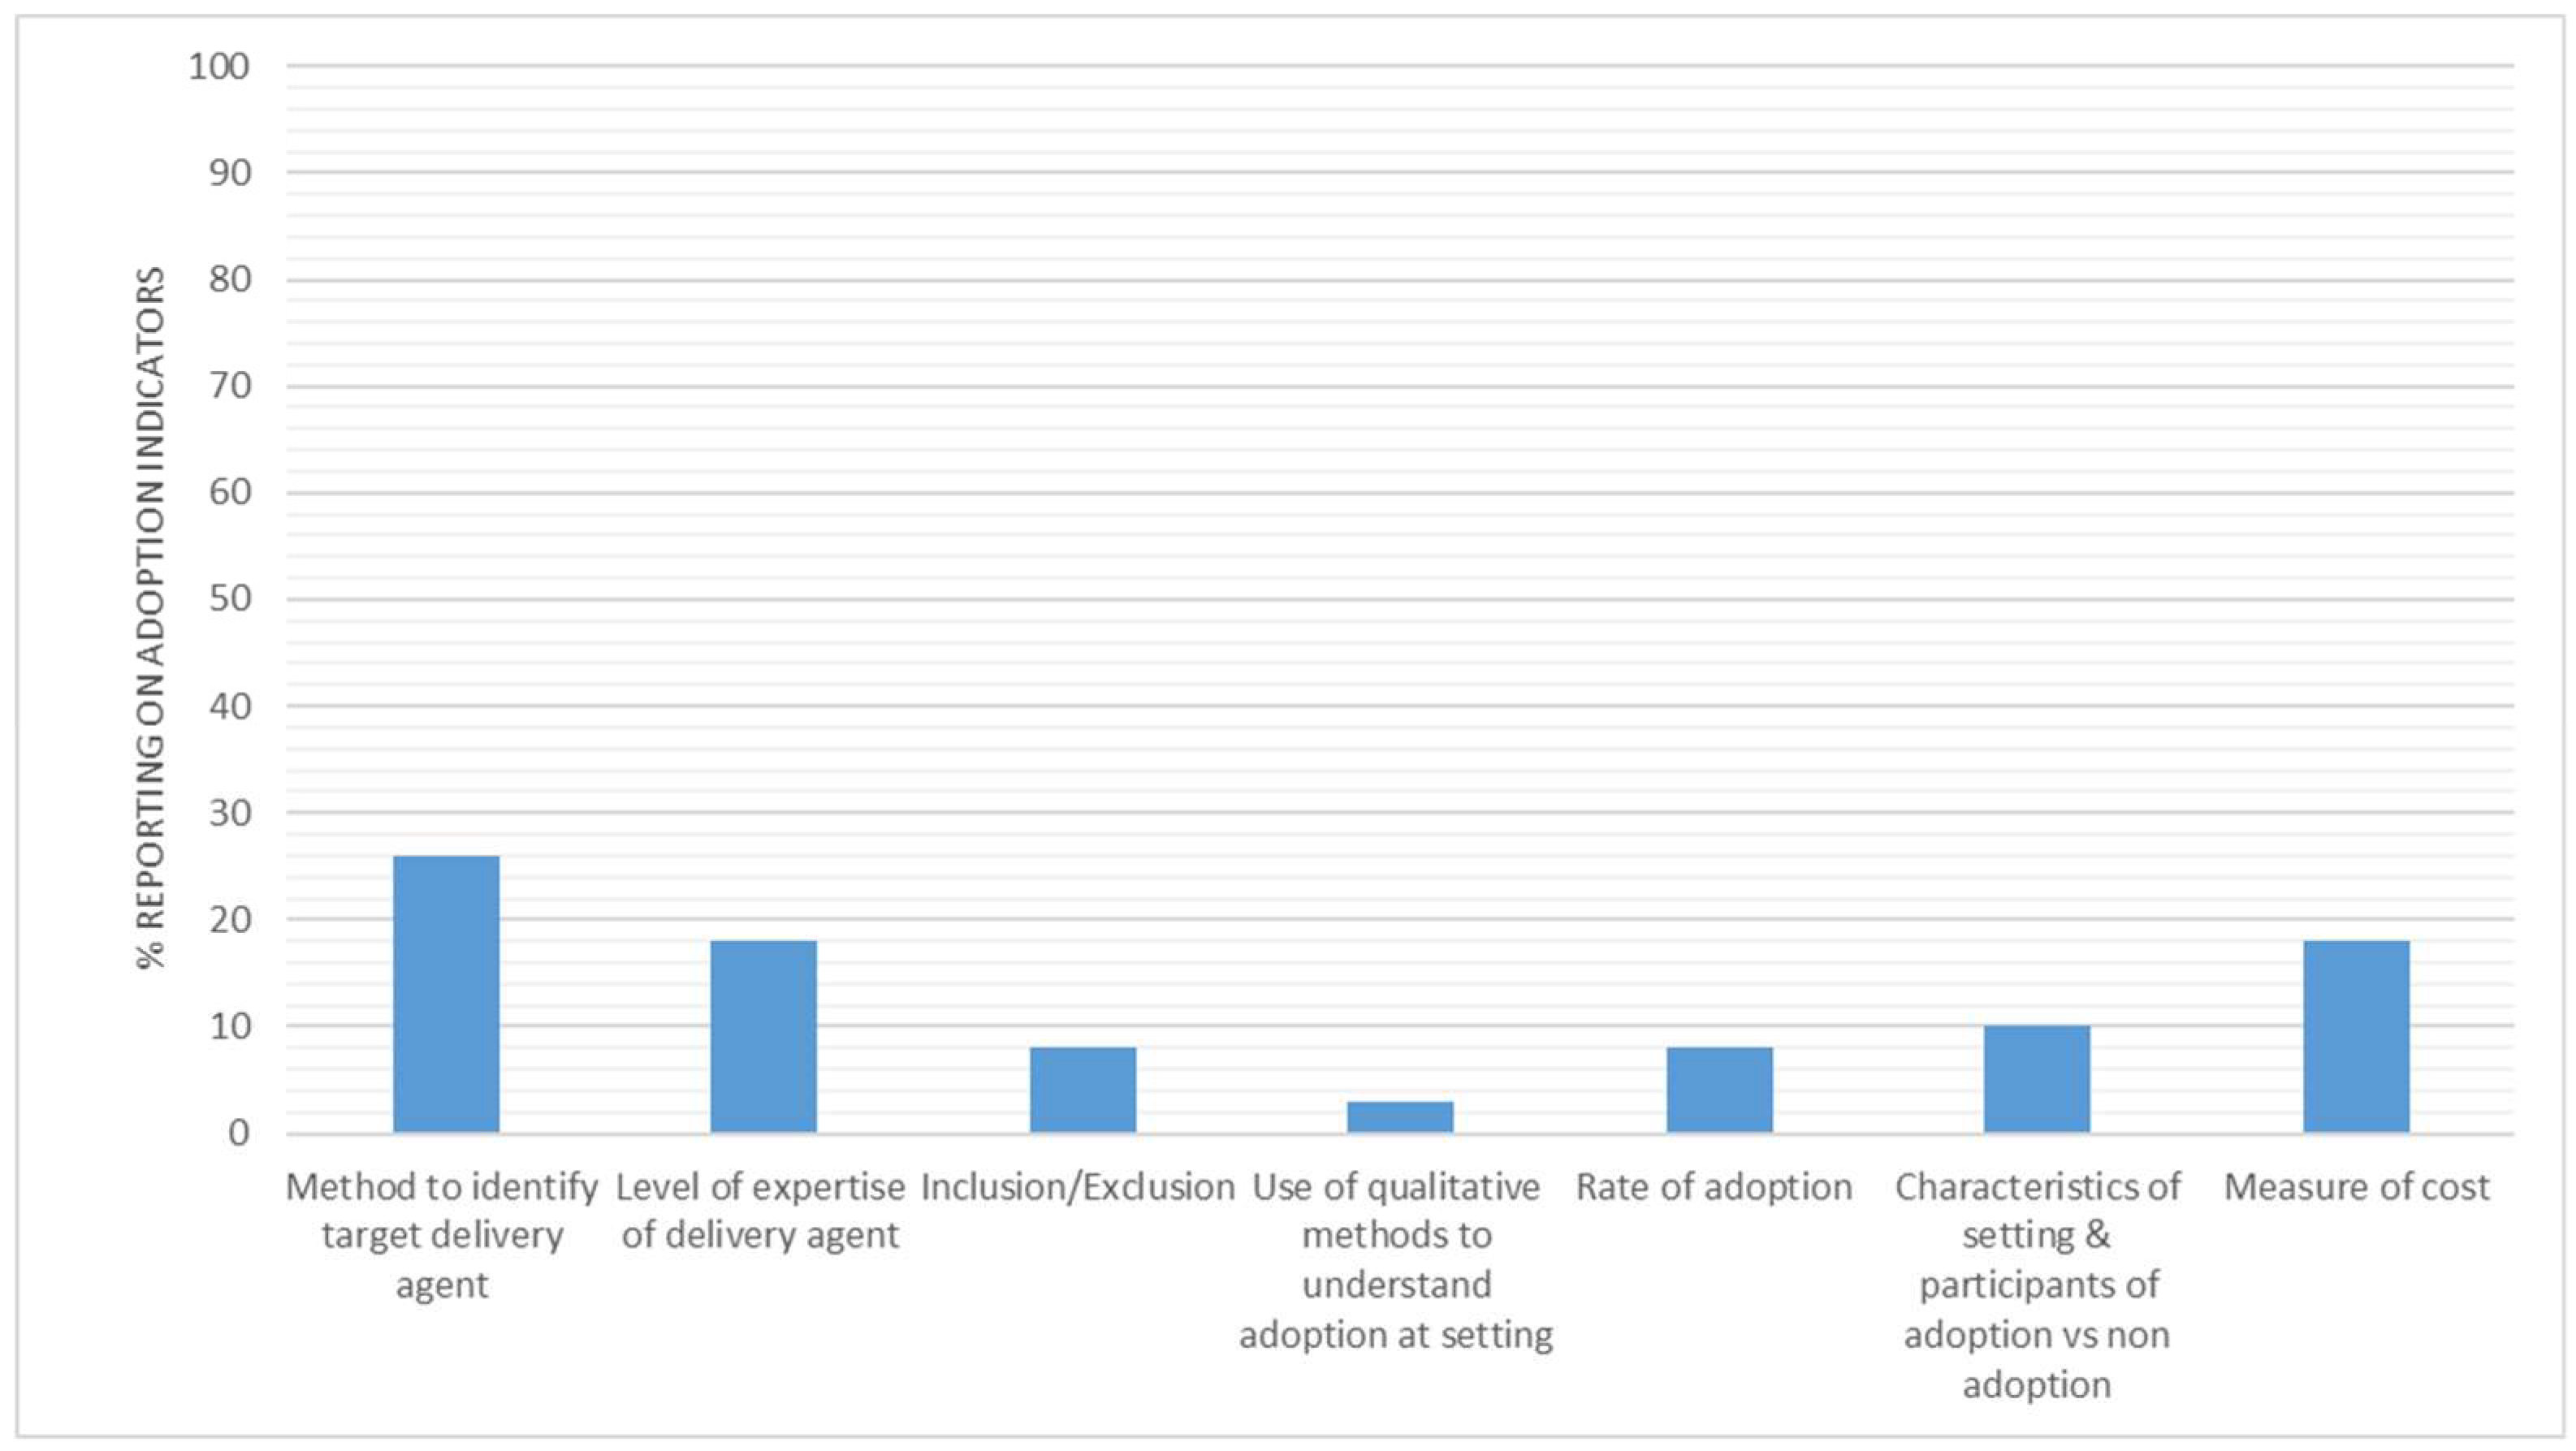
3.6. Adoption
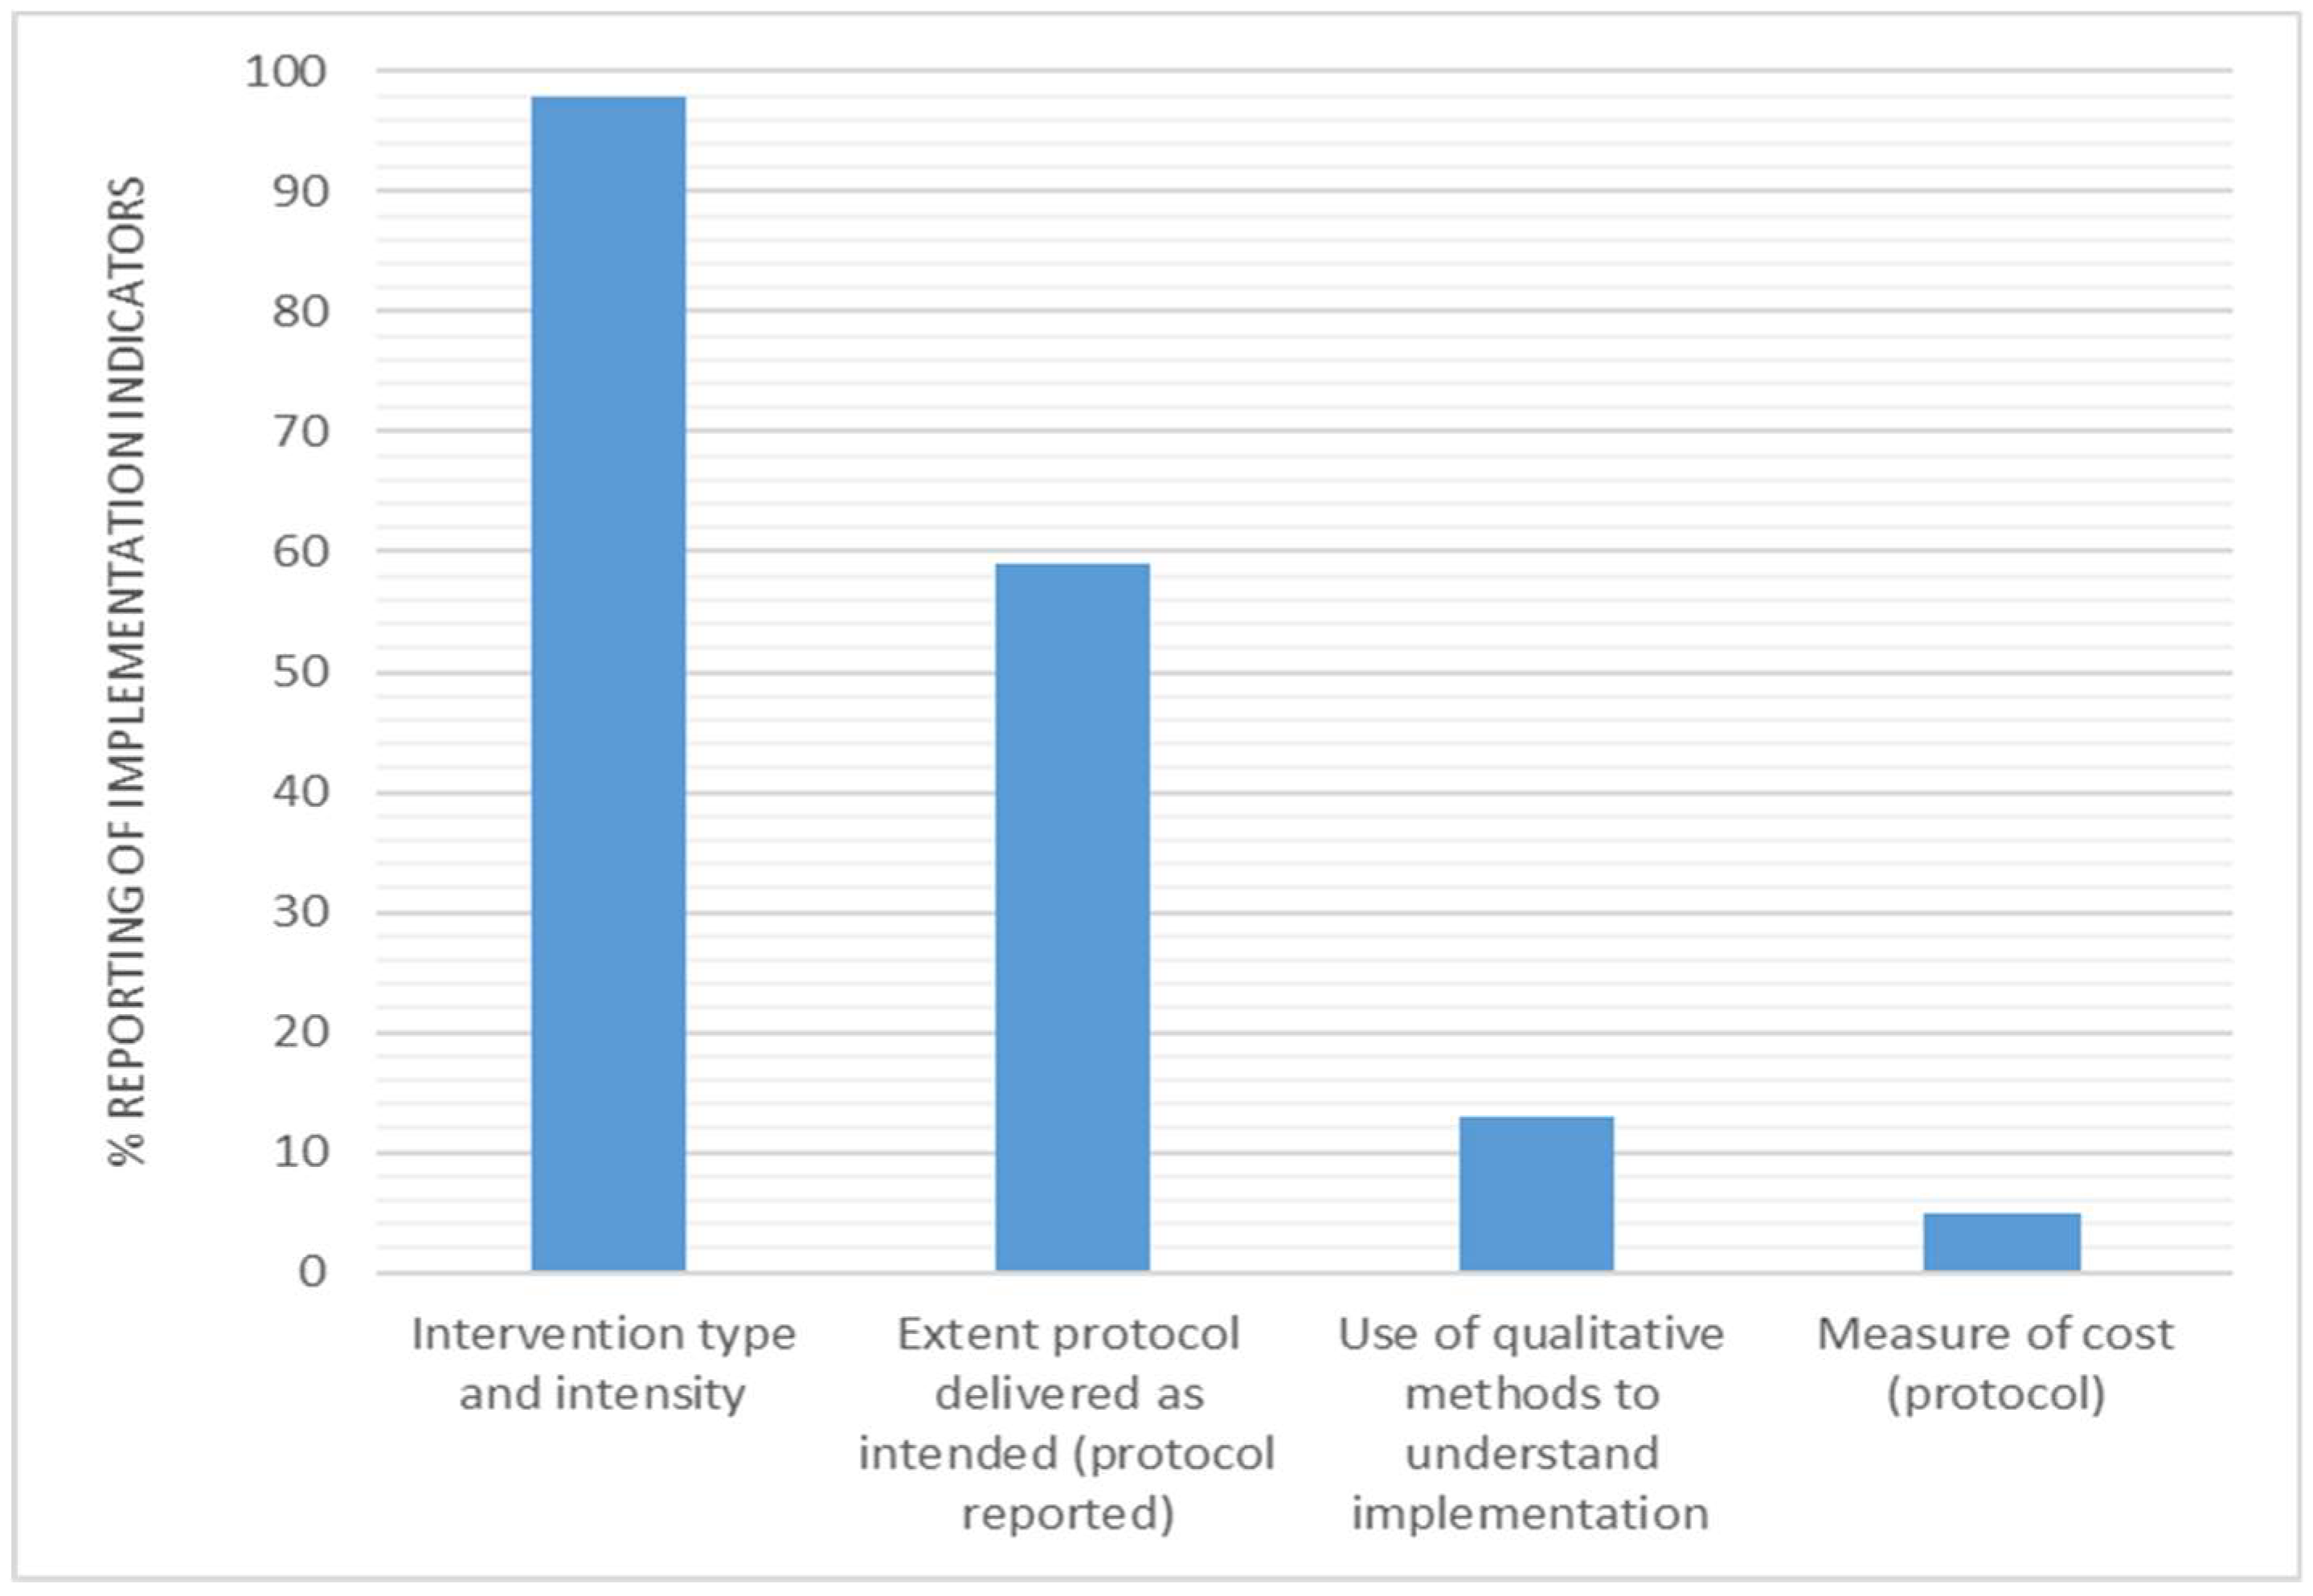
3.7. Implementation
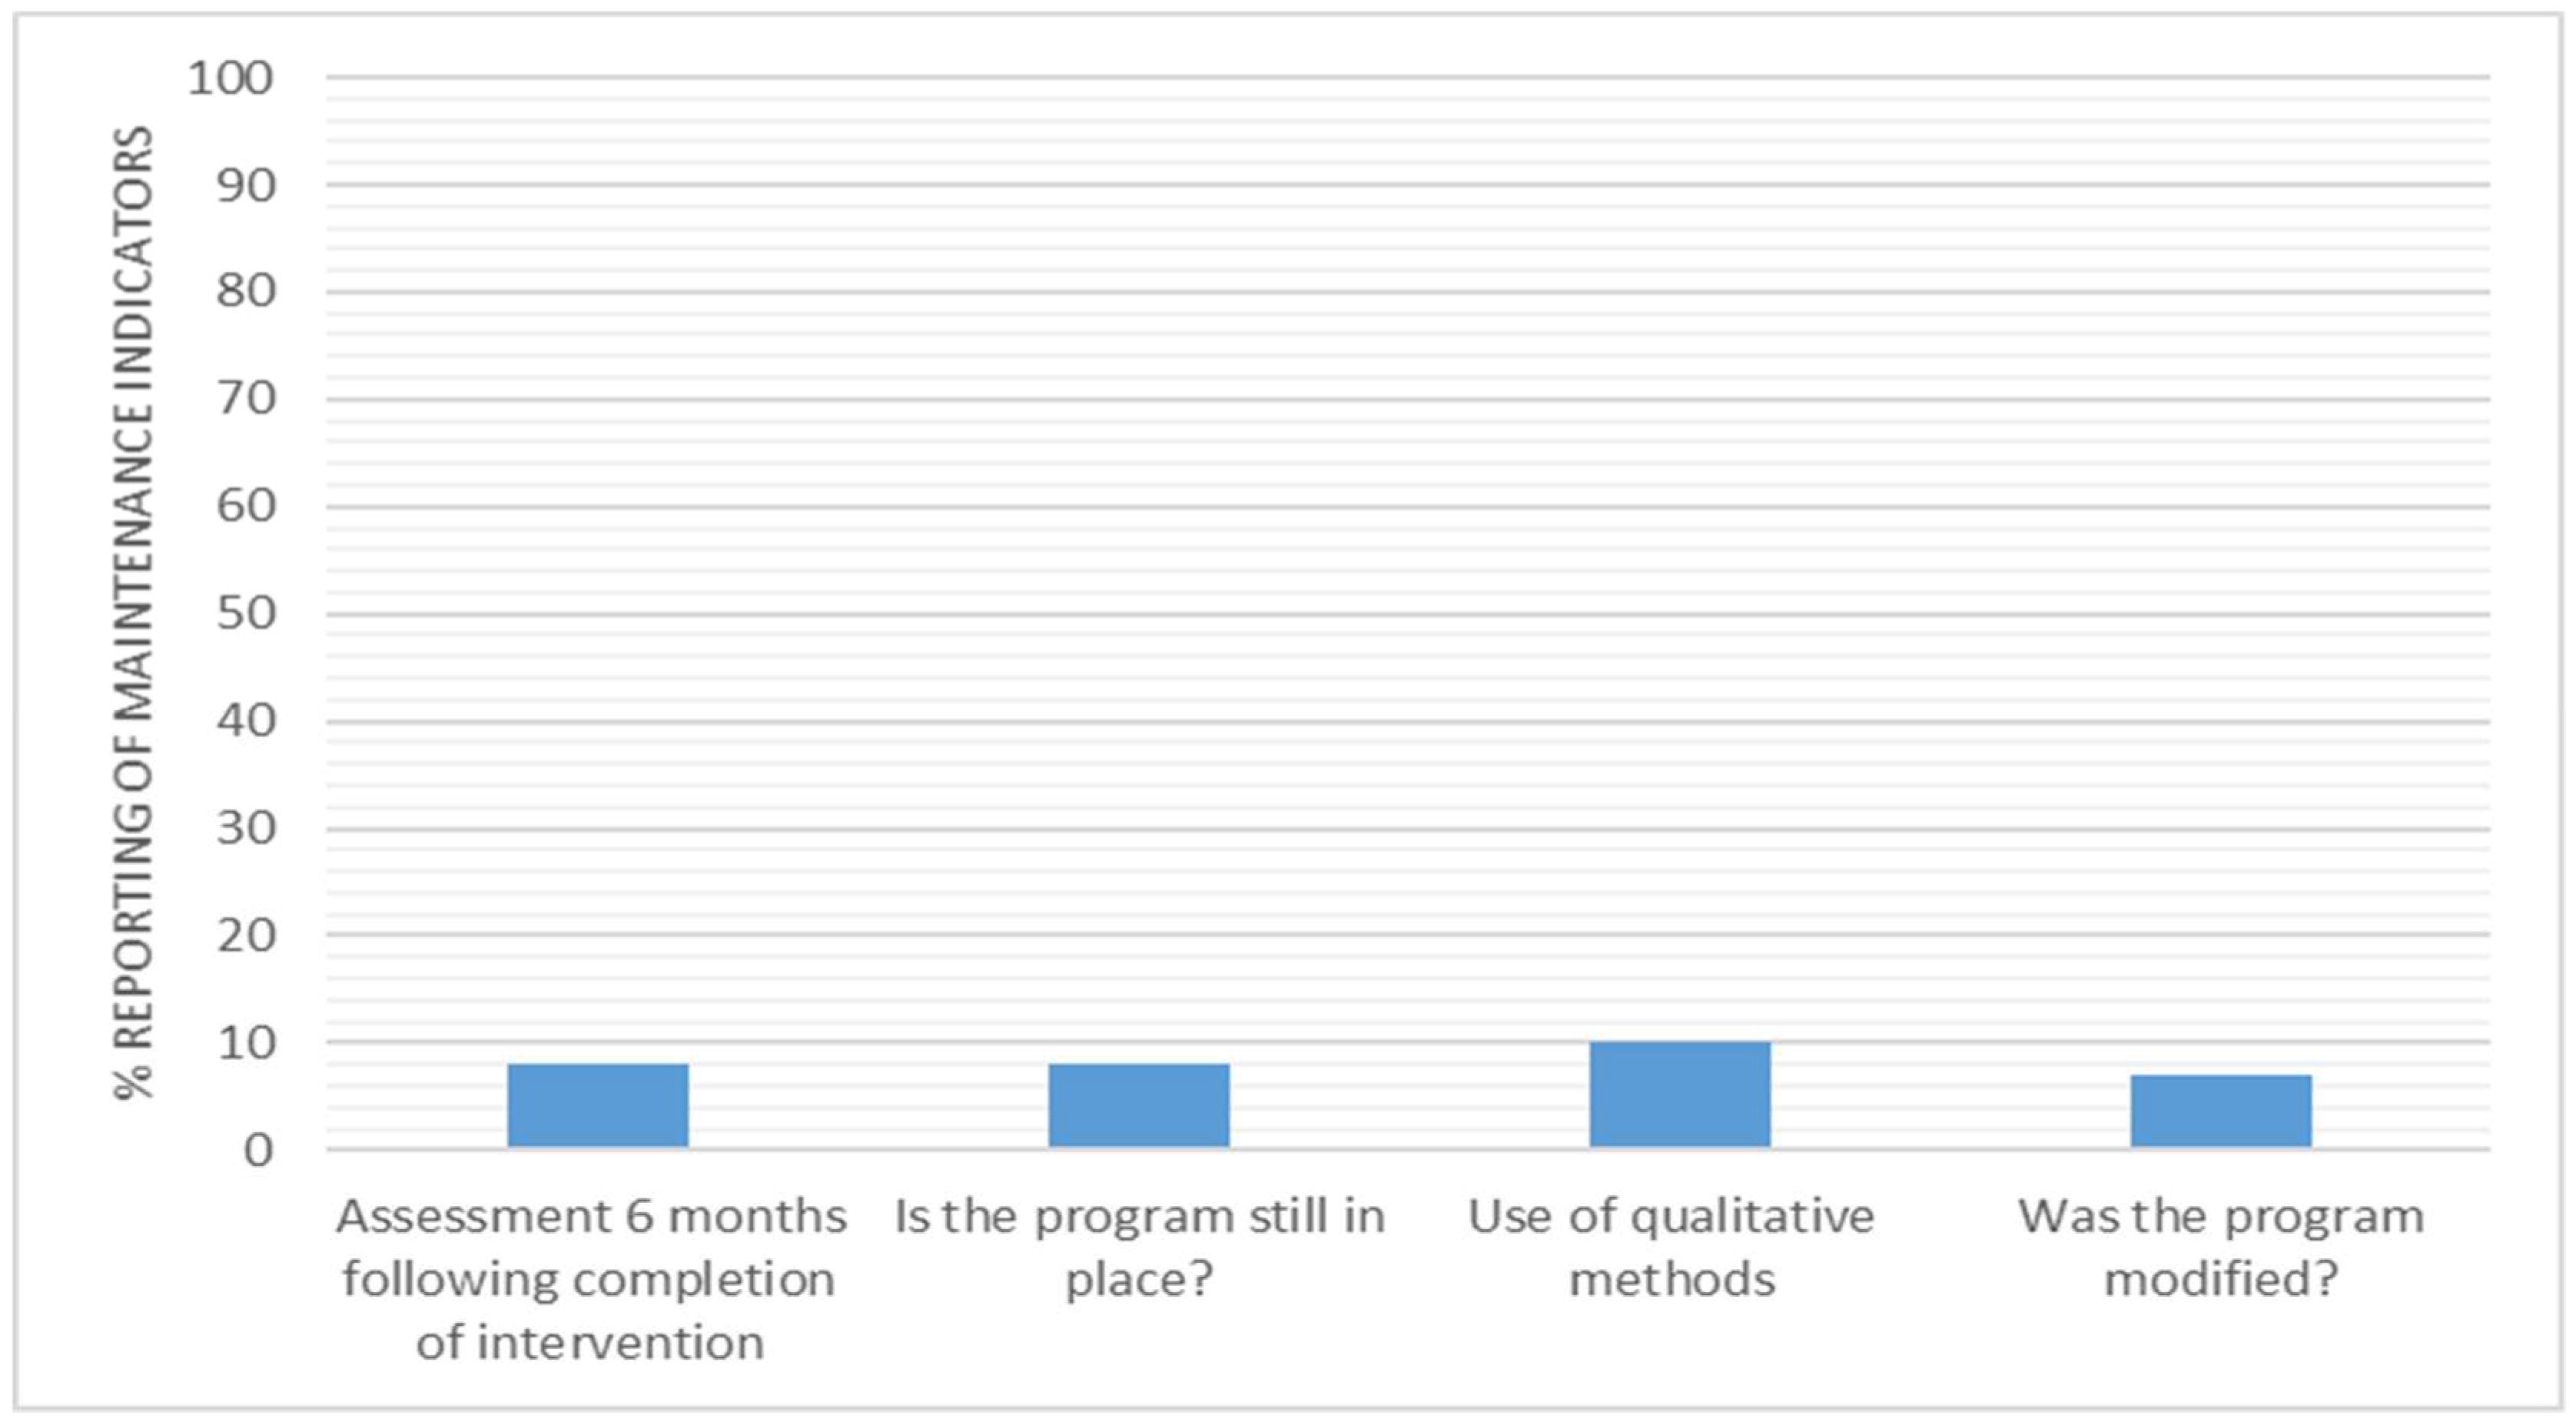
3.8. Maintenance
4. Discussion
4.1. Reach
4.2. Efficacy/Effectiveness
4.3. Adoption
4.4. Implementation
4.5. Maintenance
4.6. Indicators of Cost
4.7. Recommendations for Future Reporting
5. Strengths and Limitations
6. Conclusions
Supplementary Materials
Author Contributions
Funding
Conflicts of Interest
References
- Wilmot, E.G.; Edwardson, C.L.; Achana, F.A.; Davies, M.J.; Gorely, T.; Gray, L.J. Sedentary time in adults and the association with diabetes; cardiovascular disease and death: Systematic review and meta-analysis. Diabetologia 2012, 55, 2895–2905. [Google Scholar] [CrossRef] [PubMed]
- De Rezende, L.F.M.; Lopes, M.R.; Rey-López, J.P.; Matsudo, V.K.R.; do Carmo, L.O.J. Sedentary behavior and health outcomes: An overview of systematic reviews. PLoS ONE 2014, 9, e105620. [Google Scholar] [CrossRef] [PubMed]
- Owen, N.; Healy, G.N.; Matthews, C.E.; Dunstan, D.W. Too much sitting: The population-health science of sedentary behavior. Exerc. Sport Sci. Rev. 2010, 38, 105–113. [Google Scholar] [CrossRef] [PubMed]
- Colley, R.C.; Garriguet, D.; Janssen, I.; Craig, C.L.; Clarke, J.; Tremblay, M. Physical activity of Canadian adults: Accelerometer results from the 2007 to 2009 Canadian Health Measures Survey. Heath Rep. 2011, 22, 7–14. [Google Scholar]
- Bennie, J.A.; Chau, J.Y.; van der Ploeg, H.P.; Stamatakis, E.; Do, A.; Bauman, A. The prevalence and correlates of sitting in European adults—A comparison of 32 Eurobarometer-participating countries. Int. J. Behav. Nutr. Phys. Act. 2013, 10, 107. [Google Scholar] [CrossRef] [PubMed]
- Matthews, C.E.; Chen, K.Y.; Freedson, P.S.; Buchowski, M.S.; Beech, B.M.; Pate, R. Amount of time spent in sedentary behaviors in the United States; 2003–2004. Am. J. Epidemiol. 2008, 167, 875–881. [Google Scholar] [CrossRef] [PubMed]
- Parry, S.; Straker, L. The contribution of office work to sedentary behaviour associated risk. BMC Public Health 2013, 13, 296. [Google Scholar] [CrossRef]
- Thorp, A.A.; Healy, G.N.; Winkler, E.; Clark, B.K.; Gardiner, P.A.; Owen, N. Prolonged sedentary time and physical activity in workplace and non-work contexts: A cross-sectional study of office; customer service and call centre employees. Int. J. Behav. Nutr. Phys. Act. 2012, 9, 128. [Google Scholar] [CrossRef]
- Toomingas, A.; Forsman, M.; Mathiassen, S.E.; Heiden, M.; Nilsson, T. Variation between seated and standing/walking postures among male and female call centre operators. BMC Public Helath 2012, 12, 154. [Google Scholar] [CrossRef]
- Frey, C.B.; Osborne, M.A. The future of employment: How susceptible are jobs to computerisation? Technol. Forecast. Soc. Chang. 2017, 114, 254–280. [Google Scholar] [CrossRef]
- Buckley, J.P.; Hedge, A.; Yates, T.; Copeland, R.J.; Loosemore, M.; Hamer, M. The sedentary office: A growing case for change towards better health and productivity. Expert statement commissioned by Public Health England and the Active Working Community Interest Company. Br. J. Sports Med. 2015, 49, 094618. [Google Scholar] [CrossRef] [PubMed]
- Barbieri, D.F.; Srinivasan, D.; Mathiassen, S.E.; Oliveira, A.B. Comparison of sedentary behaviors in office workers using sit-stand tables with and without semiautomated position changes. Hum. Factors 2017, 59, 782–795. [Google Scholar] [CrossRef] [PubMed]
- Hutchinson, J.; Headley, S.; Matthews, T.; Spicer, G.; Dempsey, K.; Wooley, S.; Janssen, X. Changes in sitting time and sitting fragmentation after a workplace sedentary behaviour intervention. Int. J. Environ. Res. Public Health 2018, 15, 1148. [Google Scholar] [CrossRef] [PubMed]
- Cooley, D.; Pedersen, S.; Mainsbridge, C.J. Assessment of the impact of a workplace intervention to reduce prolonged occupational sitting time. J. Qual. Health Res. 2014, 24, 90–101. [Google Scholar] [CrossRef] [PubMed]
- Neuhaus, M.; Healy, G.N.; Dunstan, D.W.; Owen, N.; Eakin, E.G. Workplace sitting and height-adjustable workstations: A randomized controlled trial. Am. J. Prev. Med. 2014, 46, 30–40. [Google Scholar] [CrossRef] [PubMed]
- Shrestha, N.; Kukkonen-Harjula, K.T.; Verbeek, J.H.; Ijaz, S.; Hermans, V.; Pedisic, Z. Workplace interventions for reducing sitting at work. Cochrane Database Syst. Rev. 2018, 6, CD010912. [Google Scholar] [CrossRef] [PubMed]
- Tew, G.; Posso, M.; Arundel, C.; McDaid, C. Systematic review: Height-adjustable workstations to reduce sedentary behaviour in office-based workers. Occup. Med. 2015, 65, 357–366. [Google Scholar] [CrossRef]
- Neuhaus, M.; Eakin, E.G.; Straker, L.; Owen, N.; Dunstan, D.W.; Reid, N. Reducing occupational sedentary time: A systematic review and meta-analysis of evidence on activity-permissive workstations. Obes. Rev. 2014, 15, 822–838. [Google Scholar] [CrossRef]
- Chau, J.Y.; van der Ploeg, H.P.; Van Uffelen, J.G.; Wong, J.; Riphagen, I.; Healy, G.N. Are workplace interventions to reduce sitting effective? A systematic review. Br. J. Sports Med. 2010, 51, 352–356. [Google Scholar] [CrossRef]
- Bauman, A.; Nutbeam, D. Evaluation in a Nutshell: A Practical Guide to the Evaluation of Health Promotion Programs, 2nd ed.; Mcgraw Hill: Sydney, Austrailia, 2013. [Google Scholar]
- Green, L.W.; Glasgow, R.E. Evaluating the relevance; generalization; and applicability of research: Issues in external validation and translation methodology. Eval. Health Prof. 2006, 29, 126–153. [Google Scholar] [CrossRef]
- Glasgow, R.E.; Vogt, T.M.; Boles, S.M. Evaluating the public health impact of health promotion interventions: The RE-AIM framework. Am. J. Prev. Med. 1999, 89, 1322–1327. [Google Scholar] [CrossRef]
- Glasgow, R.E.; Klesges, L.M.; Dzewaltowski, D.A.; Bull, S.S.; Estabrooks, P. The future of health behavior change research: What is needed to improve translation of research into health promotion practice? Annu. Behav. Med. 2004, 27, 3–12. [Google Scholar] [CrossRef] [PubMed]
- Whittemore, R.; Knafl, K.J. The integrative review: Updated methodology. J. Adv. Nurs. 2005, 52, 546–553. [Google Scholar] [CrossRef] [PubMed]
- Harden, S.M.; Gaglio, B.; Shoup, J.A.; Kinney, K.A.; Johnson, S.; Brito, F.; Blackman, K.C.A.; Zoellner, J.M.; Hill, J.L.; Almeida, F.A.; et al. Fidelity to and comparative results across behavioral interventions evaluated through the RE-AIM framework: A systematic review. Syst. Rev. 2015, 4, 155. [Google Scholar] [CrossRef] [PubMed]
- Allen, K.; Zoellner, J.; Motley, M.; Estabrooks, P.A. Understanding the internal and external validity of health literacy interventions: A systematic literature review using the RE-AIM framework. J. Health Commun. 2011, 16, 55–72. [Google Scholar] [CrossRef] [PubMed]
- Estabrooks, P.; Dzewaltowski, D.; Glasgow, R.; Klesges, L. School-based health promotion: Issues related to translating research into practice. J. Sch. Health 2002, 73, 21–28. [Google Scholar] [CrossRef]
- McGoey, T.; Root, Z.; Bruner, M.W.; Law, B. Evaluation of physical activity interventions in youth via the Reach, Efficacy/Effectiveness, Adoption, Implementation, and Maintenance (RE-AIM) framework: A systematic review of randomised and non-randomised trials. Prev. Med. 2015, 76, 58–67. [Google Scholar] [CrossRef] [PubMed]
- Aittasalo, M.; Livson, M.; Lusa, S.; Romo, A.; Vähä-Ypyä, H.; Tokola, K. Moving to business–changes in physical activity and sedentary behavior after multilevel intervention in small and medium-size workplaces. BMC Public Health 2017, 17, 319. [Google Scholar] [CrossRef]
- Alkhajah, T.A.; Reeves, M.M.; Eakin, E.G.; Winkler, E.A.; Owen, N.; Healy, G.N. Sit–stand workstations: A pilot intervention to reduce office sitting time. Am. J. Prev. Med. 2012, 43, 298–303. [Google Scholar] [CrossRef]
- Arrogi, A.; Schotte, A.; Bogaerts, A.; Boen, F.; Seghers, J. Short-and long-term effectiveness of a three-month individualized need-supportive physical activity counseling intervention at the workplace. BMC Public Health 2017, 17, 52. [Google Scholar] [CrossRef]
- Ben-Ner, A.; Hamann, D.J.; Koepp, G.; Manohar, C.U.; Levine, J. Treadmill workstations: The effects of walking while working on physical activity and work performance. PLoS ONE 2014, 9, e88620. [Google Scholar] [CrossRef] [PubMed]
- Bort-Roig, J.; Martin, M.; Puig-Ribera, A.; González-Suárez, Á.M.; Martínez-Lemos, I.; Martori, J.C. Uptake and factors that influence the use of ‘sit less; move more’occupational intervention strategies in Spanish office employees. Int. J. Behav. Nutr. Phys. Act. 2014, 11, 152. [Google Scholar] [CrossRef] [PubMed]
- Puig-Ribera, A.; Bort-Roig, J.; Giné-Garriga, M.; González-Suárez, A.M.; Martínez-Lemos, I.; Fortuño, J.; Martori, J.C.; Munoz-Ortiz, L.; Mila, R.; Gilson, N.; et al. Impact of a workplace ‘sit less; move more’program on efficiency-related outcomes of office employees. BMC Public Health 2017, 17, 455. [Google Scholar] [CrossRef] [PubMed]
- Puig-Ribera, A.; Bort-Roig, J.; González-Suárez, A.M.; Martínez-Lemos, I.; Giné-Garriga, M.; Fortuño, J.; Martori, J.C.; Munoz-Ortiz, L.; Mila, R.; McKenna, J.; et al. Patterns of impact resulting from a ‘sit less; move more’web-based program in sedentary office employees. PLoS ONE 2015, 10, e0122474. [Google Scholar] [CrossRef] [PubMed]
- Brakenridge, C.L.; Fjeldsoe, B.; Young, D.; Winkler, E.; Dunstan, D.; Straker, L. Evaluating the effectiveness of organisational-level strategies with or without an activity tracker to reduce office workers’ sitting time: A cluster-randomised trial. Int. J. Behav. Nutr. Phys. Act. 2016, 13, 115. [Google Scholar] [CrossRef] [PubMed]
- Brakenridge, C.L.; Healy, G.N.; Hadgraft, N.T.; Young, D.C.; Fjeldsoe, B.S. Australian employee perceptions of an organizational-level intervention to reduce sitting. Health Promot. Int. 2017. [Google Scholar] [CrossRef] [PubMed]
- Carr, L.J.; Leonhard, C.; Tucker, S.; Fethke, N.; Benzo, R.; Gerr, F. Total worker health intervention increases activity of sedentary workers. Am. J. Prev. Med. 2016, 50, 9–17. [Google Scholar] [CrossRef] [PubMed]
- Carr, L.J.; Karvinen, K.; Peavler, M.; Smith, R.; Cangelosi, K. Multicomponent intervention to reduce daily sedentary time: A randomised controlled trial. BMJ Open 2013, 3, e003261. [Google Scholar] [CrossRef]
- Carr, L.J.; Walaska, K.A.; Marcus, B.H. Feasibility of a portable pedal exercise machine for reducing sedentary time in the workplace. Br. J. Sports Med. 2012, 46, 430–435. [Google Scholar] [CrossRef] [PubMed]
- Chau, J.Y.; Daley, M.; Srinivasan, A.; Dunn, S.; Bauman, A.E.; van der Ploeg, H.P. Desk-based workers’ perspectives on using sit-stand workstations: A qualitative analysis of the Stand@ Work study. BMC Public Health 2014, 14, 752. [Google Scholar] [CrossRef] [PubMed]
- Chau, J.Y.; Daley, M.; Dunn, S.; Srinivasan, A.; Do, A.; Bauman, A.E. The effectiveness of sit-stand workstations for changing office workers’ sitting time: Results from the Stand@ Work randomized controlled trial pilot. Int. J. Behav. Nutr. Phys. Act. 2014, 11, 127. [Google Scholar] [CrossRef] [PubMed]
- Chau, J.Y.; Sukala, W.; Fedel, K.; Do, A.; Engelen, L.; Kingham, M. More standing and just as productive: Effects of a sit-stand desk intervention on call center workers’ sitting; standing; and productivity at work in the Opt to Stand pilot study. Prev. Med. 2016, 3, 68–74. [Google Scholar] [CrossRef] [PubMed]
- Cifuentes, M.; Qin, J.; Fulmer, S.; Bello, A. Facilitators and barriers to using treadmill workstations under real working conditions: A qualitative study in female office workers. Am. J. Prev. Med. 2015, 30, 93–100. [Google Scholar] [CrossRef] [PubMed]
- Coenen, P.; Healy, G.N.; Winkler, E.A.; Dunstan, D.W.; Owen, N.; Moodie, M.; LaMontagne, A.D.; Eakin, E.A.; Straker, L.M. Pre-existing low-back symptoms impact adversely on sitting time reduction in office workers. Int. Arch. Occop. Environ. Health 2017, 90, 609–618. [Google Scholar] [CrossRef] [PubMed]
- Hadgraft, N.T.; Winkler, E.A.; Healy, G.N.; Lynch, B.M.; Neuhaus, M.; Eakin, E.G.; Dunstan, D.W.; Owen, N.; Fjeldoe, B.S. Intervening to reduce workplace sitting: Mediating role of social-cognitive constructs during a cluster randomised controlled trial. Int. J. Behav. Nutr. Phys. Act. 2017, 14, 27. [Google Scholar] [CrossRef]
- Hadgraft, N.T.; Willenberg, L.; LaMontagne, A.D.; Malkoski, K.; Dunstan, D.W.; Healy, G.N.; Moodie, M.; Eakin, E.G.; Owen, N.; Lawler, P.S. Reducing occupational sitting: Workers’ perspectives on participation in a multi-component intervention. Int. J. Behav. Nutr. Phys. Act. 2017, 14, 73. [Google Scholar] [CrossRef]
- Healy, G.N.; Winkler, E.A.; Eakin, E.G.; Owen, N.; Lamontagne, A.D.; Moodie, M.; Dunstan, D.W. A Cluster RCT to Reduce Workers’ Sitting Time: Impact on Cardiometabolic Biomarkers. Med. Sci. Sport Exerc. 2017, 49, 2032–2039. [Google Scholar] [CrossRef]
- Healy, G.N.; Eakin, E.G.; Owen, N.; Lamontagne, A.D.; Moodie, M.; Winkler, E.; Fjeldsoe, B.S.; Wiesner, G.; Willenberg, L.; Dunstan, D.W. A Cluster Randomized Controlled Trial to Reduce Office Workers’ Sitting Time: Effect on Activity Outcomes. Med. Sci. Sport Exerc. 2016, 48, 1787–1797. [Google Scholar] [CrossRef]
- Coffeng, J.K.; Boot, C.R.; Duijts, S.F.; Twisk, J.W.; van Mechelen, W.; Hendriksen, I.J. Effectiveness of a worksite social & physical environment intervention on need for recovery; physical activity and relaxation; results of a randomized controlled trial. PLoS ONE 2014, 9, e114860. [Google Scholar]
- Pedersen, S.J.; Cooley, P.D.; Mainsbridge, C.J. An e-health intervention designed to increase workday energy expenditure by reducing prolonged occupational sitting habits. Work 2014, 49, 289–295. [Google Scholar]
- Danquah, I.H.; Kloster, S.; Holtermann, A.; Aadahl, M.; Tolstrup, J.S. Effects on musculoskeletal pain from “Take a Stand!”—A cluster-randomized controlled trial reducing sitting time among office workers. Scand. J. Work Environ. Health 2017, 43, 350–357. [Google Scholar] [CrossRef] [PubMed]
- Danquah, I.H.; Kloster, S.; Holtermann, A.; Aadahl, M.; Bauman, A.; Ersbøll, A.K.; Tolstrup, J.S. Take a Stand!—A multi-component intervention aimed at reducing sitting time among office workers–a cluster randomized trial. Int. J. Epidemiol. 2017, 46, 128–140. [Google Scholar] [CrossRef] [PubMed]
- Davis, K.G.; Kotowski, S.E. Postural variability: An effective way to reduce musculoskeletal discomfort in office work. Hum. Fact. 2014, 56, 1249–1261. [Google Scholar] [CrossRef]
- De Cocker, K.; De Bourdeaudhuij, I.; Cardon, G.; Vandelanotte, C. Theory-driven; web-based; computer-tailored advice to reduce and interrupt sitting at work: Development; feasibility and acceptability testing among employees. BMC Public Health 2015, 15, 959. [Google Scholar] [CrossRef] [PubMed]
- De Cocker, K.; De Bourdeaudhuij, I.; Cardon, G.; Vandelanotte, C. The effectiveness of a web-based computer-tailored intervention on workplace sitting: A randomized controlled trial. J. Med. Internet Res. 2016, 8, 5. [Google Scholar] [CrossRef] [PubMed]
- De Cocker, K.; De Bourdeaudhuij, I.; Cardon, G.; Vandelanotte, C. What are the working mechanisms of a web-based workplace sitting intervention targeting psychosocial factors and action planning? BMC Public Health 2017, 17, 382. [Google Scholar] [CrossRef]
- Dewa, C.S.; deRuiter, W.; Chau, N.; Karioja, K.J. Walking for wellness: Using pedometers to decrease sedentary behaviour and promote mental health. Int. J. Ment. Health Promot. 2009, 11, 24–28. [Google Scholar] [CrossRef]
- Donath, L.; Faude, O.; Schefer, Y.; Roth, R.; Zahner, L. Repetitive daily point of choice prompts and occupational sit-stand transfers; concentration and neuromuscular performance in office workers: An RCT. Int. J. Environ. Res. Public Health 2015, 12, 4340–4353. [Google Scholar] [CrossRef] [PubMed]
- Ellegast, R.; Weber, B.; Mahlberg, R. Method inventory for assessment of physical activity at VDU workplaces. Work 2012, 41, 2355–2359. [Google Scholar]
- Engelen, L.; Dhillon, H.M.; Chau, J.Y.; Hespe, D.; Bauman, A.E. Do active design buildings change health behaviour and workplace perceptions? Occup. Med. 2016, 66, 408–411. [Google Scholar] [CrossRef]
- Evans, R.E.; Fawole, H.O.; Sheriff, S.A.; Dall, P.M.; Grant, P.M.; Ryan, C.G. Point-of-choice prompts to reduce sitting time at work: A randomized trial. Am. J. Prev. Med. 2012, 43, 293–297. [Google Scholar] [CrossRef] [PubMed]
- Fennell, C.G. The Effects of a 16-Week Exercise Program and Cell Phone Use on Physical Activity; Sedentary Behavior; and Health-related Outcomes. Ph.D. Thesis, Kent State University, Kent, OH, USA, 2016. Available online: http://rave.ohiolink.edu/etdc/view?acc_num = kent1468331801 (accessed on 14 March 2018).
- Ganesan, A.N.; Louise, J.; Horsfall, M.; Bilsborough, S.A.; Hendriks, J.; McGavigan, A.D.; Selvanayagam, J.B.; Chew, D.P. International mobile-health intervention on physical activity; sitting; and weight: The Stepathlon cardiovascular health study. J. Am. Coll. Cardiol. 2016, 67, 2453–2463. [Google Scholar] [CrossRef]
- Gao, Y.; Nevala, N.; Cronin, N.J.; Finni, T. Effects of environmental intervention on sedentary time; musculoskeletal comfort and work ability in office workers. Eur. J. Sport Sci. 2016, 16, 747–754. [Google Scholar] [CrossRef] [PubMed]
- Gilson, N.D.; Puig-Ribera, A.; McKenna, J.; Brown, W.J.; Burton, N.W.; Cooke, C.B. Do walking strategies to increase physical activity reduce reported sitting in workplaces: A randomized control trial. Int. J. Behav. Nutr. Phys. Act. 2009, 6, 43. [Google Scholar] [CrossRef] [PubMed]
- Gilson, N.D.; Ng, N.; Pavey, T.G.; Ryde, G.C.; Straker, L.; Brown, W. Project Energise: Using participatory approaches and real time computer prompts to reduce occupational sitting and increase work time physical activity in office workers. J. Sci. Med. Sport 2016, 19, 926–930. [Google Scholar] [CrossRef]
- Gorman, E.; Ashe, M.C.; Dunstan, D.W.; Hanson, H.M.; Madden, K.; Winkler, E.A. Does an ‘activity-permissive’ workplace change office workers’ sitting and activity time? PLoS ONE 2013, 8, e76723. [Google Scholar] [CrossRef]
- Graves, L.; Murphy, R.; Shepherd, S.O.; Cabot, J.; Hopkins, N.D. Evaluation of sit-stand workstations in an office setting: A randomised controlled trial. PMC Public Health 2015, 15, 1145. [Google Scholar] [CrossRef]
- Green, N.; Sigurdsson, S.; Wilder, D.A. Decreasing bouts of prolonged sitting among office workers. J. Appl. Behav. Anal. 2016, 49, 717–722. [Google Scholar] [CrossRef]
- Healy, G.N.; Eakin, E.G.; LaMontagne, A.D.; Owen, N.; Winkler, E.A.; Wiesner, G.; Gunning, L.; Neuhaus, M.; Lawler, S.; Fieldsoe, B.S.; et al. Reducing sitting time in office workers: Short-term efficacy of a multicomponent intervention. Prev. Med. 2013, 57, 43–48. [Google Scholar] [CrossRef]
- Stephens, S.K.; Winkler, E.A.; Trost, S.G.; Dunstan, D.W.; Eakin, E.G.; Chastin, S.F.; Healy, N.G. Intervening to reduce workplace sitting time: How and when do changes to sitting time occur? Br. J. Sport Med. 2014, 48, e93524. [Google Scholar] [CrossRef]
- Hendriksen, I.J.; Bernaards, C.M.; Steijn, W.M.; Hildebrandt, V.H. Longitudinal relationship between sitting time on a working day and vitality; work performance; presenteeism; and sickness absence. J. Occup. Environ. Med. 2016, 58, 784–789. [Google Scholar] [CrossRef] [PubMed]
- Jancey, J.M.; McGann, S.; Creagh, R.; Blackford, K.D.; Howat, P.; Tye, M. Workplace building design and office-based workers’ activity: A study of a natural experiment. Aust. N. Z. J. Public Health 2016, 40, 78–82. [Google Scholar] [CrossRef] [PubMed]
- John, D.; Thompson, D.L.; Raynor, H.; Bielak, K.; Rider, B.; Bassett, D.R. Treadmill workstations: A worksite physical activity intervention in overweight and obese office workers. J. Phys. Act. Health 2011, 8, 1034–1043. [Google Scholar] [CrossRef]
- Jones, C.A. Examining the Efficacy and Feasibility of Digital Activity Monitors and Shared Active Desks to Reduce Employee Sedentary Behavior. Ph.D. Thesis, The University of North Carolina, Chapel Hill, NC, USA, 2016. [Google Scholar]
- Júdice, P.B.; Hamilton, M.T.; Sardinha, L.B.; Silva, A.M. Randomized controlled pilot of an intervention to reduce and break-up overweight/obese adults’ overall sitting-time. Trials 2015, 16, 490. [Google Scholar] [CrossRef] [PubMed]
- Kerr, J.; Takemoto, M.; Bolling, K.; Atkin, A.; Carlson, J.; Rosenberg, D.; Crist, K.; Godbole, S.; Lewars, B.; Pena, C.; et al. Two-arm randomized pilot intervention trial to decrease sitting time and increase sit-to-stand transitions in working and non-working older adults. PLoS ONE 2016, 11, e0145427. [Google Scholar] [CrossRef] [PubMed]
- Kozey-Keadle, S.; Libertine, A.; Staudenmayer, J.; Freedson, P. The feasibility of reducing and measuring sedentary time among overweight; non-exercising office workers. J. Obes. 2012, 2012, 282303. [Google Scholar] [CrossRef] [PubMed]
- Kress, M.M. The Use of Stand-Capable Workstations for Reducing Sedentary Time in Office Employees. Ph.D. Thesis, Texas A & M University, College Station, TX, USA, 2015. [Google Scholar]
- Li, I.; Mackey, M.G.; Foley, B.; Pappas, E.; Edwards, K.; Chau, J.Y.; Engelen, L.; Voukelatos, A.; Whelan, A.; Bauman, A.; et al. Reducing office workers’ sitting time at work using sit-stand protocols: Results from a pilot randomized controlled trial. J. Occup. Envirno. Med. 2017, 59, 543–549. [Google Scholar] [CrossRef]
- MacEwen, B.T.; Saunders, T.J.; MacDonald, D.J.; Burr, J. Sit-stand desks to reduce workplace sitting time in office workers with abdominal obesity: A randomized controlled trial. J. Phys. Act. Health 2017, 14, 710–715. [Google Scholar] [CrossRef]
- Mackenzie, K.; Goyder, E.; Eves, F. Acceptability and feasibility of a low-cost; theory-based and co-produced intervention to reduce workplace sitting time in desk-based university employees. BMC Public Health 2015, 15, 1294. [Google Scholar] [CrossRef]
- Mailey, E.L.; Rosenkranz, S.K.; Casey, K.; Swank, A. Comparing the effects of two different break strategies on occupational sedentary behavior in a real world setting: A randomized trial. Prev. Med. 2016, 4, 423–428. [Google Scholar] [CrossRef]
- Mailey, E.L.; Rosenkranz, S.K.; Ablah, E.; Swank, A.; Casey, K. Effects of an Intervention to Reduce Sitting at Work on Arousal; Fatigue; and Mood Among Sedentary Female Employees. J. Occup. Environ. Med. 2017, 59, 1166–1171. [Google Scholar] [CrossRef] [PubMed]
- Mansoubi, M.; Pearson, N.; Biddle, S.J.; Clemes, S.A. Using sit-to-stand workstations in offices: Is there a compensation effect? Med. Sci. Sports Exerc. 2016, 48, 720–725. [Google Scholar] [CrossRef] [PubMed]
- Parry, S.; Straker, L.; Gilson, N.D.; Smith, A. Participatory workplace interventions can reduce sedentary time for office workers—A randomised controlled trial. PLoS ONE 2013, 8, e78957. [Google Scholar] [CrossRef] [PubMed]
- Priebe, C.S.; Spink, K.S. Less sitting and more moving in the office: Using descriptive norm messages to decrease sedentary behavior and increase light physical activity at work. Psychol. Sport Exerc. 2015, 19, 76–84. [Google Scholar] [CrossRef]
- Pronk, N.P.; Katz, A.S.; Lowry, M.; Payfer, J.R. Reducing occupational sitting time and improving worker health: The take-a-stand project. Prev. Chronic Dis. 2012, 9, e154. [Google Scholar] [CrossRef] [PubMed]
- Reece, J.D. Reduce Your Sit And be More Fit: An Examination of Sedentary Behavior. Ph.D. Thesis, Middle Tennessee State University, Murfreesboro, TN, USA, 2013. [Google Scholar]
- Schuna, J.J.M.; Swift, D.L.; Hendrick, C.A.; Duet, M.T.; Johnson, W.D.; Martin, C.K.; Martin, C.; Church, T.; Tudor-Locke, C. Evaluation of a workplace treadmill desk intervention: A randomized controlled trial. J. Occup. Environ. Med. 2014, 56, 1266–1276. [Google Scholar] [CrossRef] [PubMed]
- Tudor-Locke, C.; Hendrick, C.A.; Duet, M.T.; Swift, D.L.; Schuna, J.M., Jr.; Martin, C.K.; Johnson, W.D.; Church, T.S. Implementation and adherence issues in a workplace treadmill desk intervention. Appl. Ergon. 2014, 39, 1104–1111. [Google Scholar] [CrossRef]
- Straker, L.; Abbott, R.A.; Heiden, M.; Mathiassen, S.E.; Toomingas, A. Sit–stand desks in call centres: Associations of use and ergonomics awareness with sedentary behavior. Appl. Ergon. 2013, 44, 517–522. [Google Scholar] [CrossRef]
- Swartz, A.M.; Rote, A.E.; Welch, W.A.; Maeda, H.; Hart, T.L.; Cho, Y.I.; Strath, S.J. Peer Reviewed: Prompts to Disrupt Sitting Time and Increase Physical Activity at Work, 2011–2012. Prev. Chronic Dis. 2014, 11, E73. [Google Scholar] [CrossRef]
- Taylor, W.C.; Paxton, R.J.; Shegog, R.; Coan, S.P.; Dubin, A.; Page, T.F.; Rempel, D.M. Peer Reviewed: Impact of Booster Breaks and Computer Prompts on Physical Activity and Sedentary Behavior Among Desk-Based Workers: A Cluster-Randomized Controlled Trial. Prev. Chronic Dis. 2016, 13, E155. [Google Scholar] [CrossRef]
- Tobin, R.; Leavy, J.; Jancey, J. Uprising: An examination of sit-stand workstations; mental health and work ability in sedentary office workers; in Western Australia. Work 2016, 55, 359–371. [Google Scholar] [CrossRef] [PubMed]
- Urda, J.L.; Lynn, J.S.; Gorman, A.; Larouere, B. Health. Effects of a minimal workplace intervention to reduce sedentary behaviors and improve perceived wellness in middle-aged women office workers. J. Phys. Act. Health 2016, 13, 838–844. [Google Scholar] [CrossRef] [PubMed]
- Van Berkel, J.; Boot, C.R.; Proper, K.I.; Bongers, P.M.; van der Beek, A.J. Effectiveness of a worksite mindfulness-based multi-component intervention on lifestyle behaviors. Int. J. Behav. Nutr. Phys. Act. 2014, 11, 9. [Google Scholar] [CrossRef] [PubMed]
- Venema, T.A.; Kroese, F.M.; De Ridder, D.T. I’m still standing: A longitudinal study on the effect of a default nudge. Psychol. Health 2018, 33, 669–681. [Google Scholar] [CrossRef] [PubMed]
- Verweij, L.M.; Proper, K.I.; Weel, A.N.; Hulshof, C.T.; van Mechelen, W. The application of an occupational health guideline reduces sedentary behaviour and increases fruit intake at work: Results from an RCT. Occup. Environ. Med. 2012, 69, 500–5007. [Google Scholar] [CrossRef] [PubMed]
- Biddle, S.J.; Bennie, J. Editorial for Special Issue: Advances in Sedentary Behavior Research and Translation. AIMS Public Health 2017, 4, 33. [Google Scholar] [CrossRef]
- Côté, P.; van der Velde, G.; Cassidy, J.D.; Carroll, L.J.; Hogg-Johnson, S.; Holm, L.W.; Carragee, E.J.; Haldemean, S.; Nordic, M.; Hurwitz, E.L.; et al. The burden and determinants of neck pain in workers. Eur. Spine J. 2008, 17, 60–74. [Google Scholar] [CrossRef]
- Ranasinghe, P.; Perera, Y.S.; Lamabadusuriya, D.A.; Kulatunga, S.; Jayawardana, N.; Rajapakse, S.; Katulanda, P. Work-related complaints of arm, neck and shoulder among computer office workers in an Asian country: Prevalence and validation of a risk-factor questionnaire. BMC Musculoskelet. Disord. 2011, 12, 68. [Google Scholar] [CrossRef]
- Brakenridge, C.; Chong, Y.; Winkler, E.; Hadgraft, N.; Fjeldsoe, B.; Johnston, V. Evaluating Short-Term Musculoskeletal Pain Changes in Desk-Based Workers Receiving a Workplace Sitting-Reduction Intervention. Int. J. Environ. Res. Public Health 2018, 15, 1975. [Google Scholar] [CrossRef]
- Zhai, L.; Zhang, Y.; Zhang, D. Sedentary behaviour and the risk of depression: A meta-analysis. Br. J. Sports Med. 2015, 49, 705–709. [Google Scholar] [CrossRef]
- Sloan, R.A.; Sawada, S.S.; Girdano, D.; Liu, Y.T.; Biddle, J.; Blair, S.N. Associations of sedentary behavior and physical activity with psychological distress: A cross-sectional study from Singapore. BMC Public Health 2013, 13, 885. [Google Scholar] [CrossRef] [PubMed]
- Kilpatrick, M.; Sanderson, K.; Blizzard, L.; Teale, B.; Venn, A. Cross-sectional associations between sitting at work and psychological distress: Reducing sitting time may benefit mental health. Ment. Health Phys. Act. 2013, 6, 103–109. [Google Scholar] [CrossRef]
- Simon, G.E.; Revicki, D.; Heiligenstein, J.; Grothaus, L.; VonKorff, M.; Katon, W.J.; Hylan, T.R. Recovery from depression, work productivity, and health care costs among primary care patients. Gen. Hosp. Psychiarty 2000, 22, 153–162. [Google Scholar] [CrossRef]
- Boles, M.; Pelletier, B.; Lynch, W.; Medicine, E. The relationship between health risks and work productivity. J. Occup. Environ. Med. 2004, 46, 737–745. [Google Scholar] [CrossRef] [PubMed]
- Goetzel, R.Z.; Ozminkowski, R.J.; Bruno, J.A.; Rutter, K.R.; Isaac, F.; Wang, S. The long-term impact of Johnson & Johnson’s Health & Wellness Program on employee health risks. J. Occup. Environ. Med. 2002, 44, 417–424. [Google Scholar] [PubMed]
- Goetzel, R.Z.; Henke, R.M.; Tabrizi, M.; Pelletier, K.R.; Loeppke, R.; Ballard, D.W.; Grossmeier, J.; Andreson, D.R.; Yach, D.; Kelly, R.K.; et al. Do workplace health promotion (wellness) programs work? J. Occup. Environ. Med. 2014, 56, 927–934. [Google Scholar] [CrossRef] [PubMed]
- Ajunwa, I.; Crawford, K.; Schultz, J. Limitless worker surveillance. Calif. Law Rev. 2017, 105, 735. [Google Scholar]
- Stieb, D.M.; Boot, C.R.; Turner, M.C. Promise and pitfalls in the application of big data to occupational and environmental health. BMC Public Health 2017, 17, 372. [Google Scholar] [CrossRef]
- Reich, M.R. Public-private partnerships for public health. In Public-Private Partnerships for Public Health; Harvard Center for Population and Development Studies: Cambridge, MA, USA, 2002; pp. 1–18. [Google Scholar]
- Glasgow, R.E.; Lichtenstein, E.; Marcus, A.C. Why don’t we see more translation of health promotion research to practice? Rethinking the efficacy-to-effectiveness transition. Am. J. Public Health 2003, 93, 1261–1267. [Google Scholar] [CrossRef]
- Adams, E.J.; Chalkley, A.E.; Esliger, D.W.; Sherar, L.B. Evaluation of the implementation of a whole-workplace walking programme using the RE-AIM framework. BMC Public Health 2017, 17, 466. [Google Scholar] [CrossRef]
- Gaglio, B.; Phillips, S.M.; Heurtin-Roberts, S.; Sanchez, M.A.; Glasgow, R.E. How pragmatic is it? Lessons learned using PRECIS and RE-AIM for determining pragmatic characteristics of research. Implement. Sci. 2014, 9, 96. [Google Scholar] [CrossRef] [PubMed]
- Schwingel, A.; Gálvez, P.; Linares, D.; Sebastião, E. Using a mixed-methods RE-AIM framework to evaluate community health programs for older Latinas. J. Ageing Health 2017, 29, 551–593. [Google Scholar] [CrossRef] [PubMed]
- Forman, J.; Heisler, M.; Damschroder, L.J.; Kaselitz, E.; Kerr, E.A. Development and application of the RE-AIM QuEST mixed methods framework for program evaluation. Prev. Med. Rep. 2017, 6, 322–328. [Google Scholar] [CrossRef] [PubMed]
- Draper, C.E.; Kolbe-Alexander, T.L.; Lambert, E.V. A retrospective evaluation of a community-based physical activity health promotion program. J. Phys. Act. Health 2009, 6, 578–588. [Google Scholar] [CrossRef]
- Schwartz, D.; Lellouch, J. Explanatory and pragmatic attitudes in therapeutical trials. J. Clin. Epidemiol. 2009, 62, 499–505. [Google Scholar] [CrossRef] [PubMed]


| PICOS Table | Inclusion Criteria | Exclusion Criteria | Search Terms |
|---|---|---|---|
| Participants/Population | Adult office workers | Children, non-working adults, workers outside of office setting, older adults | Office staff, worksite, work *, employ *, staff, adults, white collar |
| Intervention | All interventions targeting SB in the workplace experimental and quasi-experimental designs, natural experiment and qualitative | Systematic reviews, meta-analysis, commentaries, conference proceedings, methodology studies, validation studies, lab-based studies | Pragmatic evaluation, process evaluation, program evaluation, feasibility, pilot, health promotion, health program, program *, trial, program theory, theory of change, logic model, health behaviour change, intervention, sitting desk, sitting workstation, cycle * workstation, treadmill desk, treadmill workstation *, active * workstation *, active * permissive workstation *, sitting workstation *, seated workstation *, height adjusted workstation *, hot desk, sit-stand desk |
| Comparator | All comparison or self-comparison (pre-post design, natural experiment) | ||
| Outcome | SB measured & RE-AIM checklist elements | SB (sedentary, sedentary behave *, sedentary time, active *, sitting, sitting time, sitting behave *, screen time, screen based, chair based, deskbound, physical inactive *, inactive lifestyle, lack of activity) & RE-AIM-(Validity, external validity, internal validity, behaviour change, policy change, community change, participation, quality of life, reach, influence, effect *, success, usefulness, efficacy, adoption, acceptance, maintenance, preservation, acceptability, rate, appraise, analyses, implement, deliver *) | |
| Setting | Office setting |
| Study Author and Year | Continent (Country) | Number of Participants | Outcome Measurement | Measurement Method | Study Type | Intervention Duration |
|---|---|---|---|---|---|---|
| Aittasalo et al. (2012) [29] | Europe (Finland) | n = 295 | Primary—SB and PA Secondary—work ability and employee participation | Objective—accelerometer Subjective—workforce sitting questionnaire and additional questions on work ability | Pre- and post-longitudinal | 12 months |
| Alkhajah et al. (2012) [30] | Australia (Australia) | n = 32 | Primary—SB Secondary—body fat, fasting total cholesterol, HDL cholesterol, triglycerides, and glucose levels | Objective—ActivPAL, bioimpedance, and cholestech LDX analyzer | Quasi-experimental design | 3 months |
| Arrogi et al. (2017) [31] | Europe (Belgium) | n = 300 | Primary—SB and PA Secondary—change in health-related anthropometric measures and change in psycho-social variables | Objectively—sensewear accelerometer | Randomised control trial (RCT) | 3 months |
| Barbieri et al. (2017) [12] | South America (Brazil) | n = 24 | Primary—SB | Objective—monitoring sit–stand table positions | Randomised 2 group design | 2 months |
| Ben-Ner et al. (2014) [32] | North America (USA) | n = 43 | Primary—SB and PA Secondary—effects of work performance | Objective—Actical accelerometer Subjective—Likert scale questionnaire | RCT | 12 months |
| Bort-Roig et al. (2014) [33]; connected to [34,35] | Europe (Spain) | n = 100 | Primary—Update of strategies and Engagement | Subjective—semi-structured interviews and questionnaires | Mix methods | 21 weeks |
| Brakenridge et al. (2016) [36];connected to [37] | Australia (Australia) | n = 50 | Primary—SB Secondary—standing and moving time, reliability and validity of the LUMOback, and predictors of change. | Objective—ActivPAL | Cluster randomised trial | 3 months |
| Brakenridge et al. (2017) [37];connected to [36] | Australia (Australia) | n = 50 | Primary—participants perceptions of intervention | Subjective—interview and focus groups | Qualitative study | 12 months |
| Carr et al. (2016) [38] | North America (USA) | n = 54 | Primary—SB and PA Secondary—cardio metabolic health outcomes, musculoskeletal discomfort, and work productivity | Objective—GENEActiv accelerometer, sphygmomanometer, Subjective—WHO Health and Work Performance Questionnaire 3, Standardized Nordic Musculoskeletal Symptom Questionnaire | Two-group RCT | 4 months |
| Carr et al. (2013) [39] | North America (USA) | n = 49 | Primary—SB and PA Secondary—heart rate, blood pressure, height, weight, waist circumference, percent body fat, cardiorespiratory fitness, and fasting lipids | Objective—stepwatch, stethoscope, sphygmomanometer, and cholestech LDX analyzer | RCT | 3 months |
| Carr et al. (2012) [40] | North America (USA) | n = 18 | Primary—SB and PA | Subjective—questionnaire | Pre- and post-descriptive study | 1-month |
| Chau, Daley, and Srinivasan et al. (2014) [41]; connected to [42] | Australia (Australia) | n = 42 | Primary—evaluate the acceptability, feasibility, and perceptions of using sit–stand workstations | Subjective—focus groups | Qualitative | 1 month |
| Chau, Daley, and Dunn et al. (2014) [42];connected to [41] | Australia (Australia) | n = 49 | Primary—SB and PA | Objective—ActiGraph accelerometer Subjective—occupational sitting and physical activity questionnaire (OSPAQ) | RCT | 1 month |
| Chau et al. (2016) [43] | Australia (Australia) | n = 31 | Primary—SB and PA Secondary—productivity outcomes | Subjective—OSPAQ | Quasi-experimental with control | 2 weeks |
| Cifuentes et al. (2015) [44] | North America (USA) | n = 5 | Primary—usability, safety, comfort, and productivity using treadmill work stations in a real-world setting | Subjective—Interview and focus group | Qualitative | 6 months |
| Coenen et al. (2017) [45]; connected to [46,47,48,49] | Australia (Australia) | n = 231 | Primary—musculoskeletal symptoms | Subjective—27-item Nordic Musculoskeletal Questionnaire | Cross-sectional | No intervention |
| Coffeng et al. (2014) [50] | Europe (Netherlands) | n = 412 | Primary—recovery experience Secondary—work-related stress, small breaks, physical activity (i.e., stair climbing, active commuting, sport activities, light/moderate/vigorous physical activity), and sedentary behaviour. | Subjective—questionnaire | RCT | 12 months |
| Cooley et al. (2014) [14]; connected to [51] | Australia (Australia) | n = 47 | Primary—perceptions of the outcomes associated with a workplace health intervention designed to reduce prolonged occupational sitting time | Subjective—Semi-structured interviews | Qualitative | 13 weeks |
| Danquah IH, Kloster S, Holtermann A, Aadahl M, Tolstrup J et al. (2017) [52];connected to [53] | Europe (Denmark and Greenland) | n = 461 | Primary—SB Secondary—musculoskeletal pain | Objective—ActiGraph Subjective—three items on pain in neck-shoulders | Cluster RCT | 3 months |
| Danquah Danquah IH, Kloster S, Holtermann A, Aadahl M, Bauman A, Ersbøll AK, et al. (2017); [53] connected to [52] | Europe (Denmark and Greenland) | n = 461 | Primary—SB Secondary—waist circumference and body fat percentage | Objective—ActiGraph and bioimpedance | Cluster RCT | 3 months |
| Davis et al. (2014) [54] | North America (USA) | n = 37 | Primary—SB, productivity discomfort | Objective—video analysis | Quasi-experimental with cross over | 1 month |
| De Cocker et al., (2015) [55] | Europe (Belgium) | n = 47 | Primary—SB Secondary—feasibility and acceptability | Subjective—Questionnaires | Descriptive study | 2 weeks |
| De Cocker et al., (2016) [56]; connected to [57] | Europe (Belgium) | n = 213 | Primary—SB Secondary—psycho-social correlates of sitting | Objective—ActivPal | RCT | 3 months |
| De Cocker et al., (2017) [57]; connected to [56] | Europe (Belgium) | n = 213 | Primary—SB Secondary—psycho-social correlates of sitting | Subjective—Workforce Sitting Questionnaire (WSQ) | Cluster RCT | 1 month |
| Dewa et al. (2009) [58] | North America (Canada) | n = 28 | Primary—SB, PA, and mental health status | Subjective—international physical activity questionnaire (IPAQ) | Quasi-experimental with control | 1 month |
| Donath et al. (2015) [59] | Europe (Switzerland) | n = 38 | Primary—SB Secondary—concentration, postural sway, and lower limb strength endurance | Objectively—ActiGraph | RCT | 3 months |
| Ellegast (2012) [60] | Europe (Germany) | n = 25 | Primary—SB and PA Secondary—health outcomes | Subjectively—Activity logs | RCT | 3 months |
| Engelen et al. (2016) [61] | Australia (Australia) | n = 34 | Primary—SB and PA Secondary—perceptions and productivity | Objective—accelerometer Subjective—online activity logs, mood state questionnaire, and orthopaedic medical check-up (G-46) | Natural experiment | 2 months |
| Evans et al. (2012) [62] | Europe (U.K.) | n = 30 | Primary—SB | Objective—ActivPAL | RCT | 5 days |
| Fennel et al. (2016) [63] | North America (USA) | n = 62 | Primary—SB, PA, and fitness related variables Secondary—associated psychometric factors | Subjective—IPAQ questionnaire, international personality item pool, self-efficacy and exercise habits survey, behavioural regulation in exercise questionnaire-3 | RCT | 4 months |
| Ganesan et al. (2016) [64] | Australia (Australia) | n = 69,219 | Primary—SB and PA Secondary—weight change/BMI change and dietary change | Subjective—questionnaire | Natural experiment | 100 days |
| Gao et al. (2016) [65] | Europe (Finland) | n = 45 | Primary—SB Secondary—musculoskeletal discomfort and work ability | Subjective—questionnaire and Likert scale items | RCT | 6 months |
| Gilson et al. (2009) [66] | Europe (U.K.) | n = 179 | Primary—SB and PA | Subjective—log book | RCT | 10 weeks |
| Gilson et al. (2016) [67] | Australia (Australia) | n = 57 | Primary—SB | Objective—chair fitted sitting monitor | Quasi-experimental | 5 months |
| Gorman et al. (2013) [68] | North America (Canada) | n = 72 | Primary—SB and PA Secondary—body composition, fasting cardio-metabolic blood profile, job performance, and job satisfaction | Objective—ActivPAL | Natural experiment | 4 months |
| Graves et al. (2015) [69] | Europe (U.K.) | n = 47 | Primary—SB Secondary—behavioural, cardiometabolic, and musculoskeletal | Subjective—momentary assessment diary | RCT | 2 months |
| Green et al. (2016) [70] | North America (USA) | n = 3 | Primary—SB | Objective—ActivGraph | Pre- and post-design | NR |
| Hadgraft and Winkler et al. (2017) [46];connected to [45,47,48,49] | Australia (Australia) | n = 231 | Primary—perceived behavioural control, self-efficacy, perceived organisational norms, and knowledge | Subjective—questionnaire and Adapted Likert scale single items | Qualitative study | 12 months |
| Hadgraft and Willenberg et al. (2017) [47]; connected to [45,46,48,49] | Australia (Australia) | n = 136 | Primary—participants’ perspectives | Subjective—semi-structured interviews | Qualitative study | 12 months |
| Healy et al. (2017) [48];connected to [45,46,47,49] | Australia (Australia) | n = 231 | Primary—body composition, blood pressure, glucose metabolism, lipid metabolism, and a composite overall cardiometabolic risk score | Objective | Cluster RCT | 12 months |
| Healy et al. (2013) [71]; connected to [72] | Australia (Australia) | n = 43 | Primary—SB Secondary—standing and stepping | Objective—ActivPAL | Non-randomised controlled trial | 1 month |
| Healy et al. (2016) [49]; connected to [45,46,47,48] | Australia (Australia) | n = 231 | Primary—SB Secondary—standing and stepping | Objectively—ActivPAL | RCT | 12 months |
| Hendriksen et al. (2016) [73] | Europe (Netherlands) | n = 396 | Primary—PA, SB, and work-related outcomes | Subjective—self-report questionnaire | Pre- and post-design—longitudinal study | 5 months |
| Jancey et al. (2016) [74] | Australia (Australia) | n = 67 | Primary—SB and PA | Objective—ActiGraph | Natural experimental | 4 months |
| John et al. (2011) [75] | North America (USA) | n = 12 | Primary—SB and PA Secondary—Health outcomes | Objective—ActivPAL | Pre- and post- design—longitudinal study | 9 months |
| Jones et al. (2017) [76] | North America (USA) | n = 47 | Primary—SB | Objective—Fitbit | Pre- and post-prospective cluster intervention | 6 months |
| Judice et al. (2015) [77] | Europe (Portugal) | n = 10 | Primary—SB Secondary—Standing and stepping | Objective—ActivPAL | RCT | 1 week |
| Kerr et al. (2016) [78] | North America (USA) | n = 30 | Primary—SB | Objective—ActivPAL | RCT | 2 weeks |
| Kozey-Keadle et al. (2012) [79] | North America (USA) | n = 20 | Primary—SB | Objective—ActivPAL | Pre- and post-design—longitudinal study | 1 week |
| Kress et al. (2015) [80] | North America (USA) | n = 33 | Primary—SB Secondary—personal factors and perceptions of sit–stand workstations | Subjective—questionnaire | Natural experiment | 3 months |
| Li et al. (2017) [81] | Australia (Australia) | n = 33 | Primary—SB Secondary—PA | Objective—ActivPAL | RCT | 4 weeks |
| MacEwen et al. (2017) [82] | North America (Canada) | n = 28 | Primary—SB and cardio metabolic risk factors | Objective: SB—ActivPAL Subjective: SB—non-validated questions, Cosmed Quark, Cholestech LDX system, and glycosylated haemoglobin (HbA1c) diazyme SMART analyzer | RCT | 12 weeks |
| Mackenzie et al. (2015) [83] | Europe (U.K.) | n = 24 | Primary—SB, and participant views | Subjective—self report sitting log, open ended question | Pre- and post-design | 5 weeks |
| Mailey et al. (2016) [84]; connected to [85] | North America (USA) | n = 49 | Primary—SB and cardio metabolic health | Objective SB—ActiGraph automated blood pressure cuff and Cholestech LDX | Parallel-group randomized trial | 8 weeks |
| Mailey et al. (2017) [85];connected to [85] | North America (USA) | n = 49 | Primary—arousal, mood, and fatigue | Subjective—activation–deactivation adjective checklist (ADACL), the positive and negative affect schedule (PANAS), and fatigue symptom inventory (FSI) | Parallel-group randomized trial | 8 weeks |
| Mansoubi et al. (2016) [86] | Europe (U.K.) | n = 40 | Primary—SB and PA | Objective—ActivPAL and ActiGraph accelerometer | Pre- and post- design | 3 months |
| Neuhaus et al. (2014) [15] | Australia (Australia) | n = 44 | Primary—SB | Objective—ActivPAL | RCT | 3 months |
| Parry et al. (2013) [87] | Australia (Australia) | n = 133 | Primary—SB Secondary—PA | Objective—ActiGraph accelerometer | RCT | 12 weeks |
| Pedersen et al. (2014) [51]; connected to [14] | Australia (Australia) | n = 34 | Primary—SB and PA | Subjective—survey built upon the OPAQ and OSPAQ | RCT | 13 weeks |
| Priebe et al. (2015) [88] | North America (Canada) | n = 142 | Primary—SB and PA | Subjective—Not validated SB questionnaire | Pre- and post-design | NR |
| Pronk et al. (2012) [89] | North America (USA) | n = 34 | Primary—SB, health related outcomes, and work performance | Subjective—experience sampling methodology | Pre- and post-design—two groups | 7 weeks |
| Puig-Ribera et al. (2017) [34]; connected to [33,35] | Europe (Spain) | n = 264 | Primary—Presenteeism, productivity loss, mental well-being, and productivity | Subjective—work limitations questionnaire; Warwick–Edinburgh mental well-being scale; | Pre- and post-design—two groups | 21 weeks |
| Puig-Ribera et al. (2015) [35]; connected to [33,34] | Europe (Spain) | n = 264 | Primary—SB and physical risk factors for chronic disease | Subjective—self report diary log, blood pressure, weight, and waist measurement | Pre- and post- design—two groups | 21 weeks |
| Reece et al. (2014) [90] | North America (USA) | n = 34 | Primary—SB and PA | Objective—Sense Wear armband | RCT | 17 days |
| Schuna et al. (2014) [91]; connected to [92] | North America (USA) | n = 41 | Primary—SB and PA | Objective-Acti-graph | RCT | 3 months |
| Stephens et al. (2014) [72]; connected to [71] | Australia (Australia) | n = 43 | Primary—SB | Objective—ActivPAL | Non-randomised controlled trial | 4 weeks |
| Straker et al. (2013) [93] | Europe (Sweden) | n = 131 | Primary—SB | Objective—inclinometer and portable data logger | Natural experiment—cross sectional | 1 day analysis |
| Swartz et al. (2014) [94] | North America (USA) | n = 78 | Primary—SB and PA | Objective—ActivPAL | Randomised trial with parallel groups | 2 weeks |
| Taylor et al. 2016 [95] | North America (USA) | n = 185 | Primary—SB and PA | Subjective—IPAQ sitting items and self-reported seven-day checklist from the Neighbourhood Quality of Life StudyPA—pedometer and IPAQ | Cluster RCT | 6 months |
| Tobin et al. (2016) [96] | Australia (Australia) | n = 52 | Primary—SB Secondary—psychological distress, self-perceived physical and mental health, workability, and perceived benefits | Objective—ActivPAL Subjective—K10, SF8, and work ability index questionnaire | Pre- and post-design—two groups | 5 weeks |
| Tudor-Lock et al. (2014) [92]; connected to [91] | North America (USA) | n = 41 | Primary—perceptions of feasibility and acceptability | Subjective—focus groups | Qualitative | 3 months |
| Urda et al. (2016) [97] | North America (USA) | n = 48 | Primary—SB and perceived wellness | Objective—ActivPAL Subjective—perceived wellness survey | RCT | 2 weeks |
| vanBerkel et al. (2014) [98] | Europe (Netherlands) | n = 257 | Primary—SB | Subjective—non-validated SB at work questionnaire | RCT | 6 months. |
| Venema et al. 2017 [99] | Europe (Netherlands) | n = 606 | Primary—SB | Objective—direct observation and survey | Pre- and post-design | 2 months |
| Verweij at al. (20d12) [100] | Europe (Netherlands) | n = 185 | Primary—SB Secondary—PA, waist circumference, body weight, and BMI | Subjective—non-validated SB item, IPAQ Secondary outcomes—PA–(SQUASH) and BMI-calculated | RCT | 6 months |
| RE-AIM Dimension | Recommendations for Improved Reporting across the RE-AIM Framework for Interventions Targeting Sedentary Behaviour in Office Workers |
|---|---|
| Reach |
|
| Effectiveness |
|
| Adoption |
|
| Implementation |
|
| Maintenance |
|
© 2018 by the authors. Licensee MDPI, Basel, Switzerland. This article is an open access article distributed under the terms and conditions of the Creative Commons Attribution (CC BY) license (http://creativecommons.org/licenses/by/4.0/).
Share and Cite
MacDonald, B.; Janssen, X.; Kirk, A.; Patience, M.; Gibson, A.-M. An Integrative, Systematic Review Exploring the Research, Effectiveness, Adoption, Implementation, and Maintenance of Interventions to Reduce Sedentary Behaviour in Office Workers. Int. J. Environ. Res. Public Health 2018, 15, 2876. https://doi.org/10.3390/ijerph15122876
MacDonald B, Janssen X, Kirk A, Patience M, Gibson A-M. An Integrative, Systematic Review Exploring the Research, Effectiveness, Adoption, Implementation, and Maintenance of Interventions to Reduce Sedentary Behaviour in Office Workers. International Journal of Environmental Research and Public Health. 2018; 15(12):2876. https://doi.org/10.3390/ijerph15122876
Chicago/Turabian StyleMacDonald, Bradley, Xanne Janssen, Alison Kirk, Mhairi Patience, and Ann-Marie Gibson. 2018. "An Integrative, Systematic Review Exploring the Research, Effectiveness, Adoption, Implementation, and Maintenance of Interventions to Reduce Sedentary Behaviour in Office Workers" International Journal of Environmental Research and Public Health 15, no. 12: 2876. https://doi.org/10.3390/ijerph15122876
APA StyleMacDonald, B., Janssen, X., Kirk, A., Patience, M., & Gibson, A.-M. (2018). An Integrative, Systematic Review Exploring the Research, Effectiveness, Adoption, Implementation, and Maintenance of Interventions to Reduce Sedentary Behaviour in Office Workers. International Journal of Environmental Research and Public Health, 15(12), 2876. https://doi.org/10.3390/ijerph15122876