Relationships between Microbial Indicators and Pathogens in Recreational Water Settings

Abstract
1. Introduction
2. Relationships between Indicators and Pathogens in Recreational Waters
3. FIB and Pathogens in Freshwater
4. FIB and Pathogens in Marine and Brackish Water
5. Alternative Indicators and Pathogens in Marine, Brackish and Freshwater
6. MST Markers and Pathogens in Marine, Brackish and Freshwater
7. Various Indicators and Pathogens in Swimming Pools
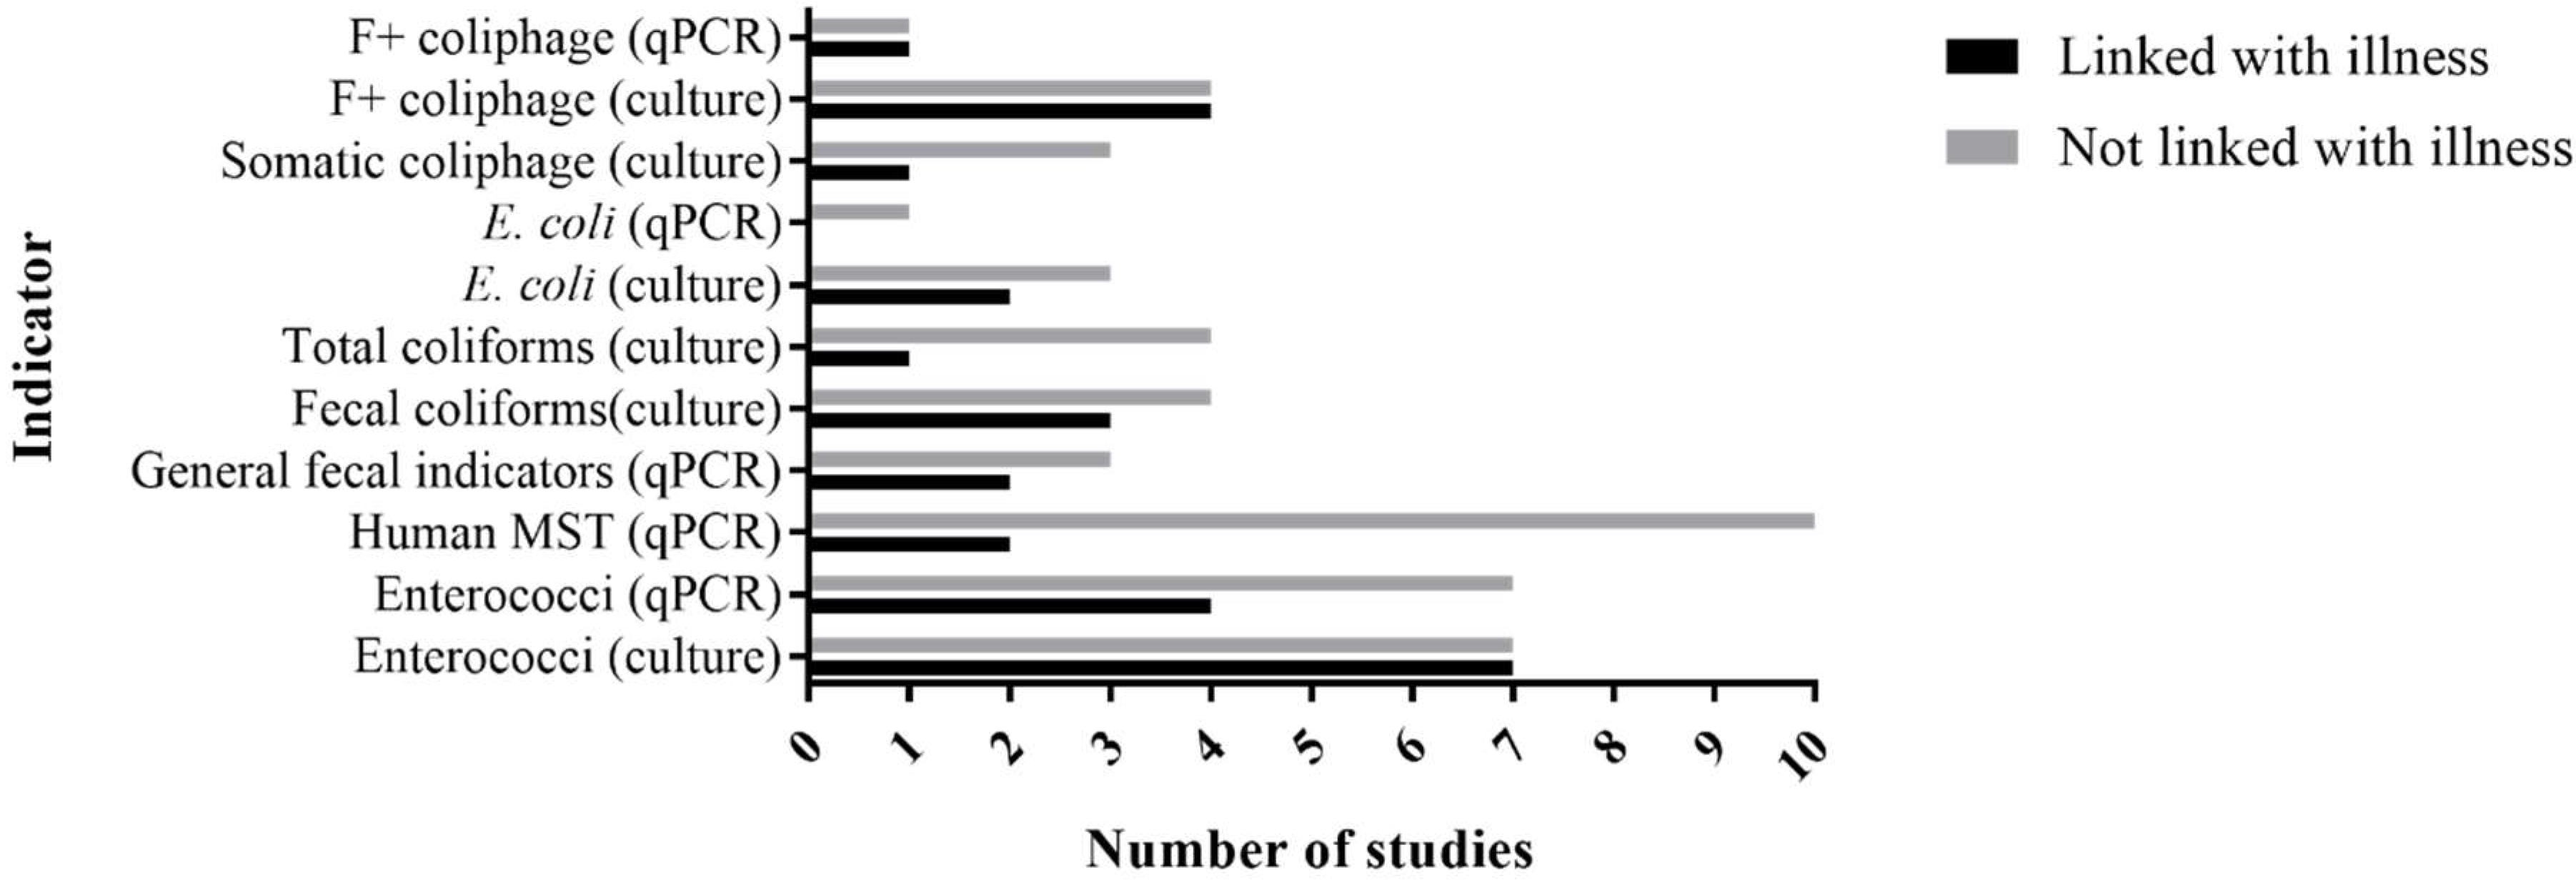
8. Relationship of Indicators with Illness
9. Factors that Influence Indicator and Pathogen Relationships
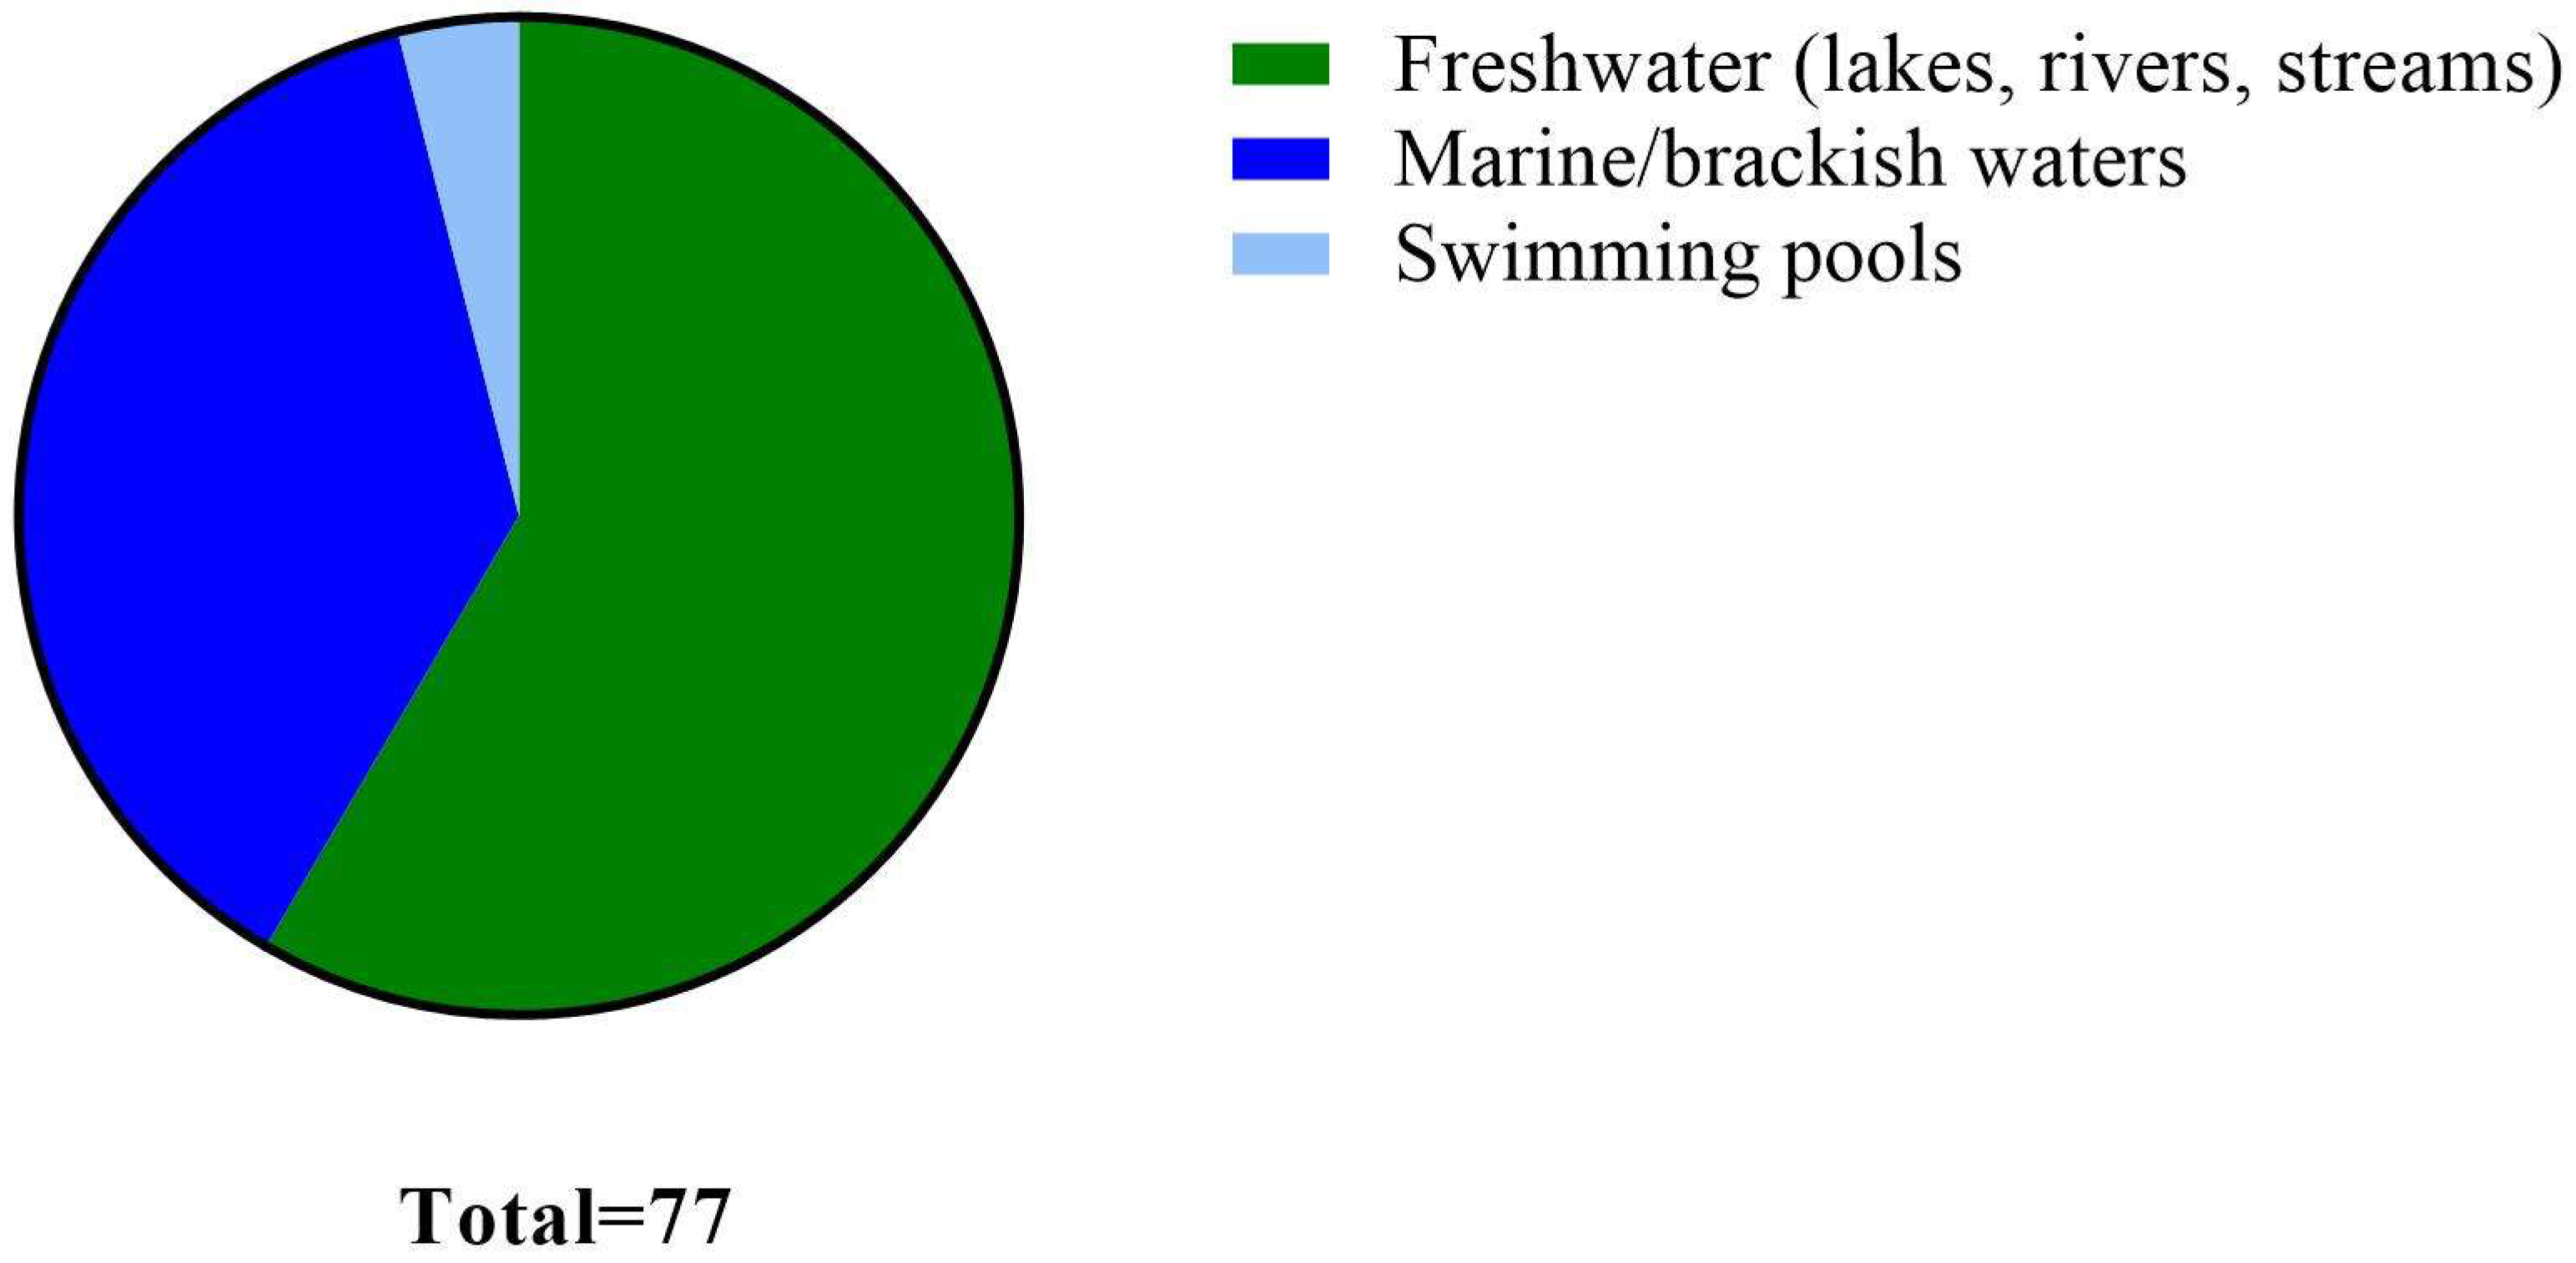
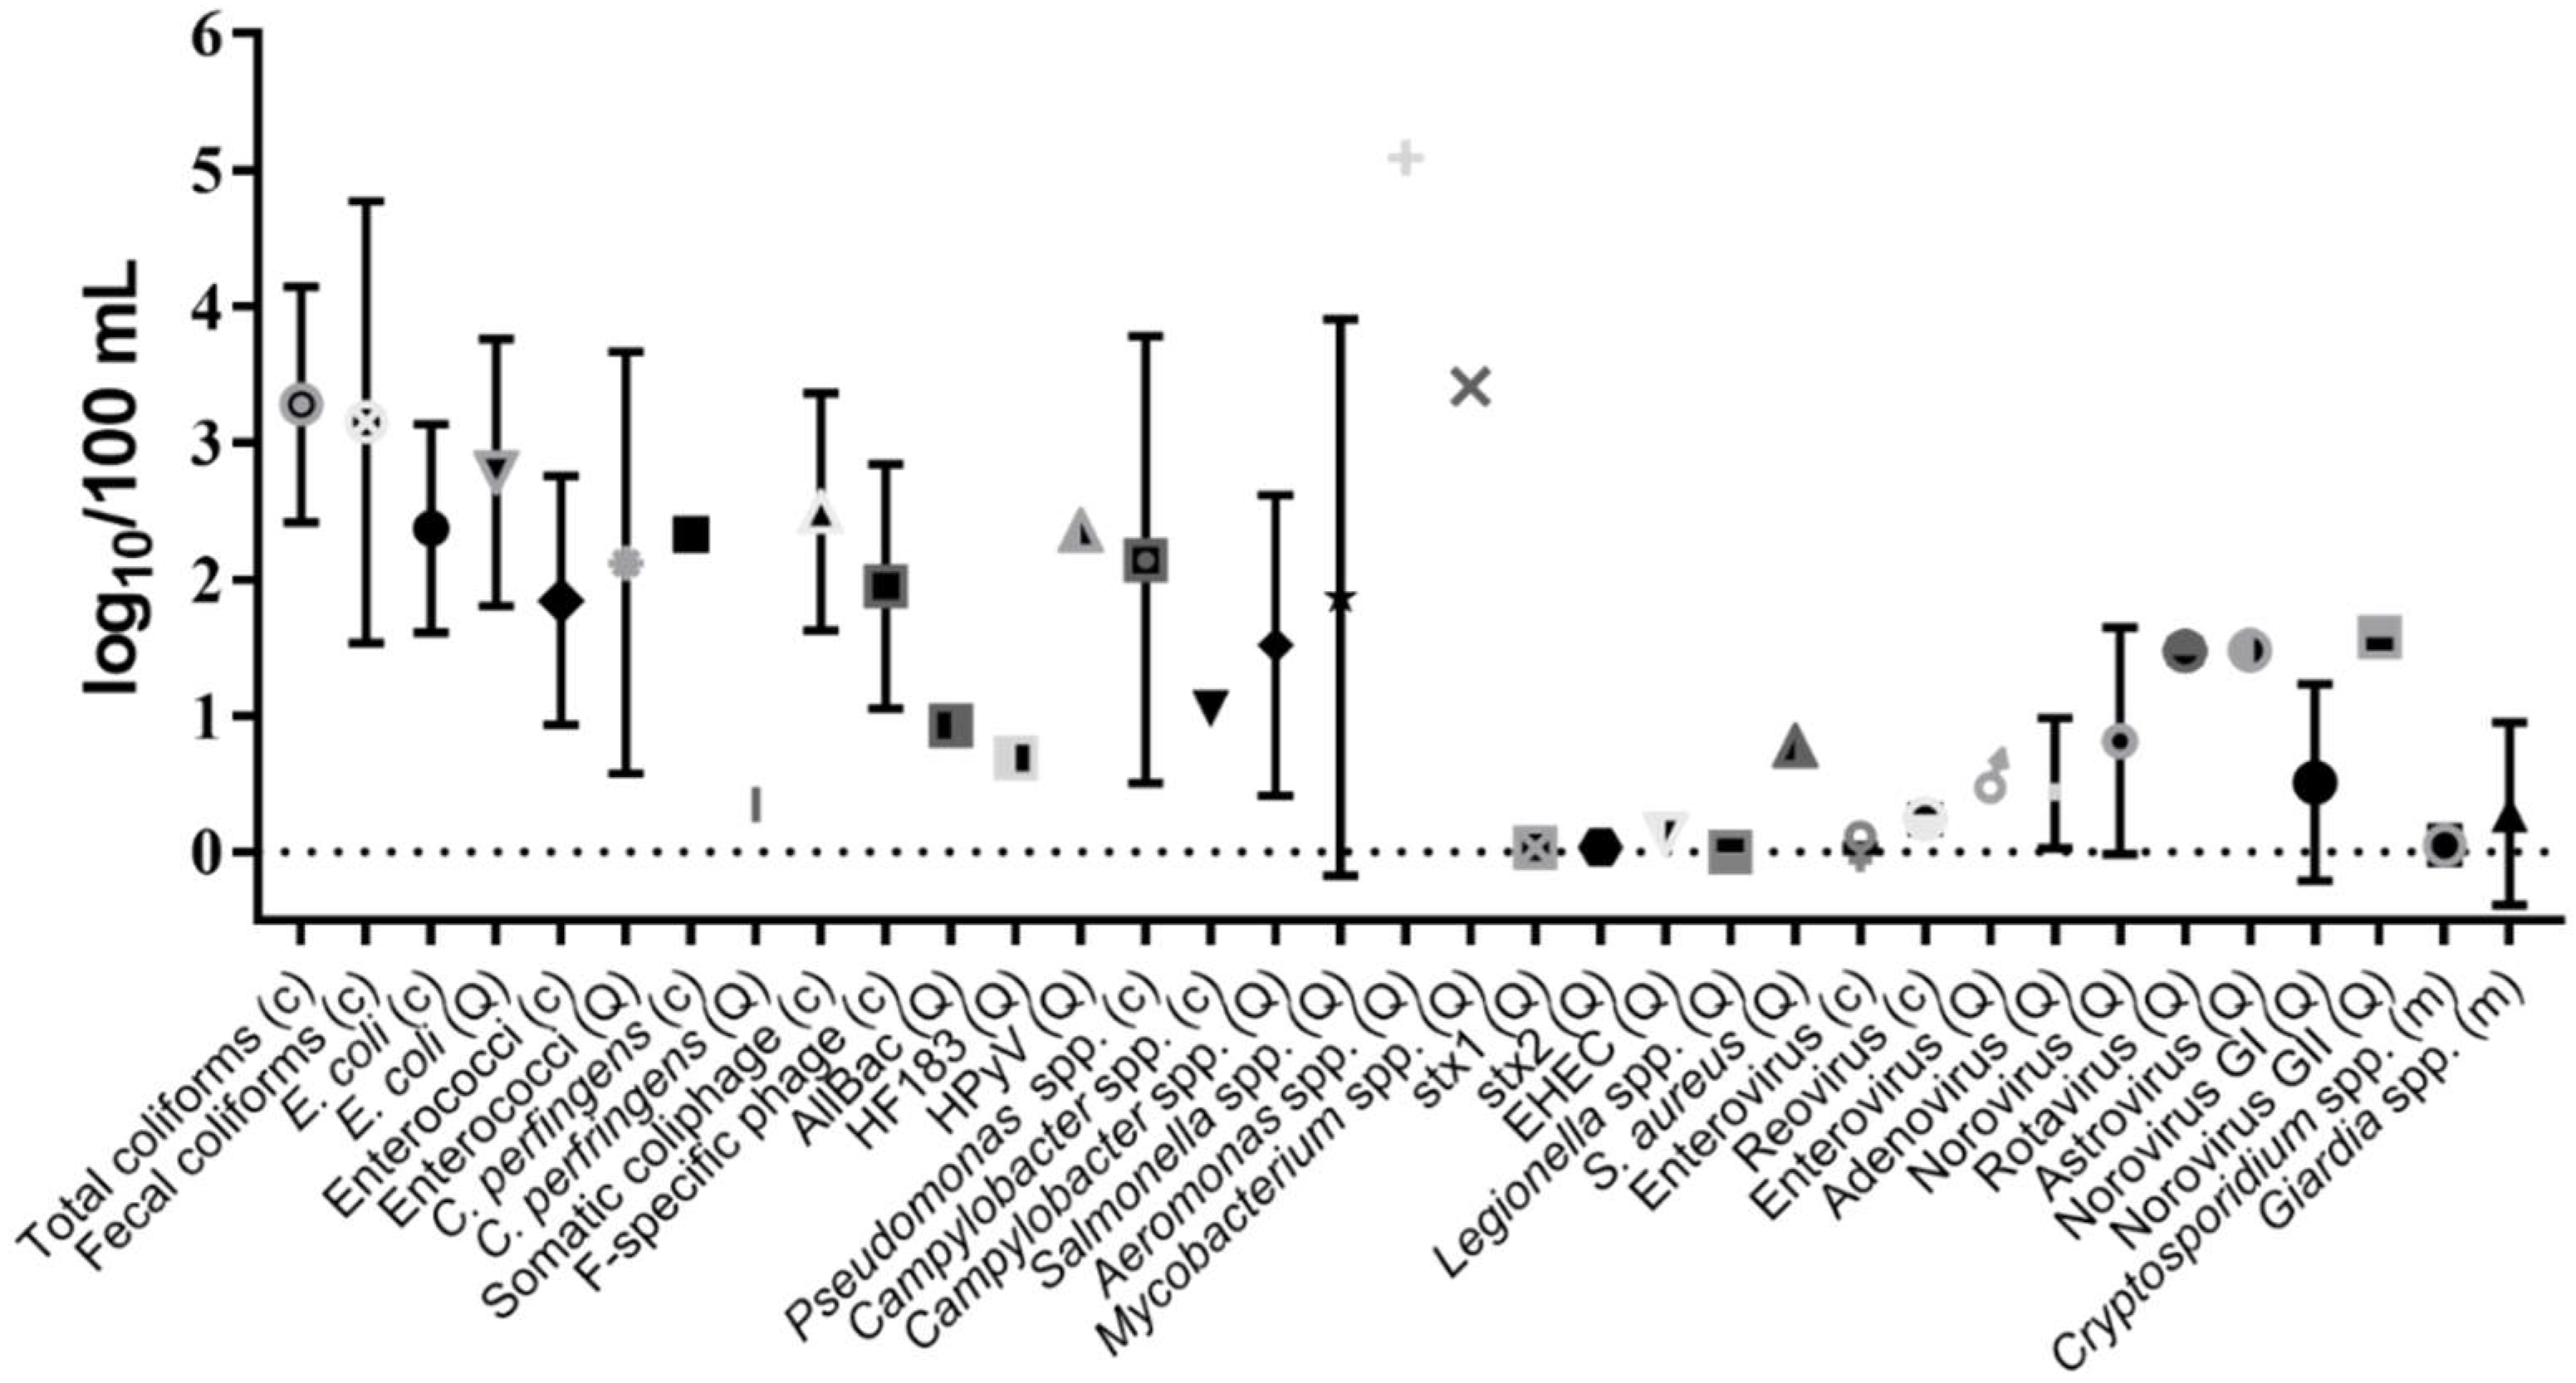
10. Detection Frequency and Concentrations of Indicators and Pathogens in Marine, Brackish and Freshwaters
11. Microbial Levels in Fecal Material
12. Susceptibility to Environmental Stressors
13. Conclusions
Author Contributions
Funding
Conflicts of Interest
Disclaimer
References
- Kummu, M.; de Moel, H.; Ward, P.J.; Varis, O. How close do we live to water? A global analysis of population distance to freshwater bodies. PLoS ONE 2011, 6, e20578. [Google Scholar] [CrossRef] [PubMed]
- National Oceanic and Atmospheric Administration. State of the Coast: National Coastal Population Report. Population Trends from 1970 to 2020; National Oceanic and Atmospheric Administration: Silver Springs, MD, USA, 2013.
- Dorfman, M.H.; Stoner, N.; Rosselot, K.S. Testing the Waters: A Guide to Water Quality at Vacation Beaches; Natural Resources Defense Council: New York, NY, USA, 2014. [Google Scholar]
- Rabinovici, S.J.; Bernknopf, R.L.; Wein, A.M.; Coursey, D.L.; Whitman, R.L. Economic and health risk trade-offs of swim closures at a lake Michigan beach. Environ. Sci. Technol. 2004, 38, 2737–2745. [Google Scholar] [CrossRef] [PubMed]
- Devine, J. The Impacts of Beach Pollution; Natural Resources Defense Council: New York, NY, USA, 2014. [Google Scholar]
- Penn, J.; Hu, W.; Cox, L.; Kozloff, L. Values for recreational beach quality in Oahu, Hawaii. Mar. Resour. Econ. 2016, 31, 47–62. [Google Scholar] [CrossRef]
- European Environment Agency. European Bathing Water Quality in 2017; European Environment Agency: Luxembourg, Luxembourg, 2018. [Google Scholar]
- American Water Works Association. Water Quality and Treatment: A Handbook of Community Water Supplies, 4th ed.; McGraw-Hill: New York, NY, USA, 1990. [Google Scholar]
- World Health Organization. Guidelines for Safe Recreational Water Environments—Volume 2 Swimming Pools and Similar Environments; World Health Organization: Geneva, Switzerland, 2006. [Google Scholar]
- World Health Organization. Gudelines for Safe Recreational Water Environments, Volume 1: Coastal and Fresh Waters; World Health Organization: Geneva, Switzerland, 2003. [Google Scholar]
- Environmental Protection Department. Water Quality Criteria/Standards Adopted in the Asia Pacific Region; Asia Pacific Economic Cooperation Secretariat: Singapore, 2003. [Google Scholar]
- European Environment Agency. Directive 2006/7/EC of the European Parliament and of the Council of February 2006 Concerning the Management of Bathing Water Quality and Repealing Directive 76/160/EEC; European Environment Agency: Geneva, Switzerland, 2006. [Google Scholar]
- Harwood, V.; Shanks, O.; Korajkic, A.; Verbyla, M.; Ahmed, W.; Iriate, M. General and Host-Associated Bacterial Indicators of Faecal Pollution; Global Water Pathogen Project; Michigan State University: E. Lansing, MI, USA, 2017. [Google Scholar]
- Harwood, V.J.; Staley, C.; Badgley, B.D.; Borges, K.; Korajkic, A. Microbial source tracking markers for detection of fecal contamination in environmental waters: Relationships between pathogens and human health outcomes. FEMS Microbiol. Rev. 2014, 38, 1–40. [Google Scholar] [CrossRef] [PubMed]
- Department of Environment and Conservation. Western Australian Guidelines for Biosolids Management; European Environment Agency: Geneva, Switzerland; Perth, Australia, 2012. [Google Scholar]
- North Carolina Environmental Quality. North Carolina Adm. Code 15A NCAC 2U Reclaimed Water; North Carolina Department of Environment and Natural Resources: Raleigh, NC, USA, 2011.
- Queensland Government Environmental Protection Agency. Queensland Water Recycling Guidelines; Queensland Government Environmental Protection Agency: Brisbane, Australia, 2005.
- United States Environmental Protection Agency. Review of Coliphages as Possible Indicators of Fecal Contamination for Ambient Water Quality; United States Environmental Protection Agency: Washington, DC, USA, 2015.
- United States Environmental Protection Agency. 2016 Coliphage Experts Workshop: Discussion Topics and Findings; United States Environmental Protection Agency: Washington, DC, USA, 2016.
- Nguyen, K.H.; Senay, C.; Young, S.; Nayak, B.; Lobos, A.; Conrad, J.; Harwood, V.J. Determination of wild animal sources of fecal indicator bacteria by microbial source tracking (MST) influences regulatory decisions. Water Res. 2018, 144, 424–434. [Google Scholar] [CrossRef] [PubMed]
- Soller, J.A.; Schoen, M.E.; Varghese, A.; Ichida, A.M.; Boehm, A.B.; Eftim, S.; Ashbolt, N.J.; Ravenscroft, J.E. Human health risk implications of multiple sources of faecal indicator bacteria in a recreational waterbody. Water Res. 2014, 66, 254–264. [Google Scholar] [CrossRef] [PubMed]
- Forni, D.; Cagliani, R.; Clerici, M.; Sironi, M. Origin and dispersal of hepatitis E virus. Emerg. Microbes Infect. 2018, 7, 11. [Google Scholar] [CrossRef] [PubMed]
- Salines, M.; Andraud, M.; Rose, N. Combining network analysis with epidemiological data to inform risk-based surveillance: Application to hepatitis E virus (HEV) in pigs. Prev. Vet. Med. 2018, 149, 125–131. [Google Scholar] [CrossRef] [PubMed]
- Lama, J.K.; Bachoon, D.S. Detection of Brucella suis, Campylobacter jejuni, and Escherichia coli strains in feral pig (Sus scrofa) communities of Georgia. Vector-Borne Zoonot. Dis. 2018, 18, 350–355. [Google Scholar] [CrossRef]
- Migura-Garcia, L.; Ramos, R.; Cerda-Cuellar, M. Antimicrobial resistance of salmonella serovars and campylobacter spp. Isolated from an opportunistic gull species, yellow-legged gull (Larus michahellis). J. Wildl. Dis. 2017, 53, 148–152. [Google Scholar] [CrossRef] [PubMed]
- Valeriani, F.; Giampaoli, S.; Romano Spica, V. The molecular enrichment approach for the identification of microbiological indicators in recreational waters. Microchem. J. 2014, 112, 70–74. [Google Scholar] [CrossRef]
- Graciaa, D.S.; Cope, J.R.; Roberts, V.A.; Cikesh, B.L.; Kahler, A.M.; Vigar, M.; Hilborn, E.D.; Wade, T.J.; Backer, L.C.; Montgomery, S.P.; et al. Outbreaks associated with untreated recreational water—United States, 2000–2014. Am. J. Transplant. 2018, 18, 2083–2087. [Google Scholar] [CrossRef] [PubMed]
- Hlavsa, M.C.; Roberts, V.A.; Anderson, A.R.; Hill, V.R.; Kahler, A.M.; Orr, M.; Garrison, L.E.; Hicks, L.A.; Newton, A.; Hilborn, E.D.; et al. Surveillance for waterborne disease outbreaks and other health events associated with recreational water—United States, 2007–2008. MMWR Surveill. Summ. 2011, 60, 1–32. [Google Scholar] [PubMed]
- Hlavsa, M.C.; Roberts, V.A.; Kahler, A.M.; Hilborn, E.D.; Wade, T.J.; Backer, L.C.; Yoder, J.S. Recreational water-associated disease outbreaks—United States, 2009–2010. MMWR Morb. Mortal. Wkly. Rep. 2014, 63, 6–10. [Google Scholar] [PubMed]
- Hlavsa, M.C.; Roberts, V.A.; Kahler, A.M.; Hilborn, E.D.; Mecher, T.R.; Beach, M.J.; Wade, T.J.; Yoder, J.S. Outbreaks of illness associated with recreational water—United States, 2011–2012. MMWR Morb. Mortal. Wkly. Rep. 2015, 64, 668–672. [Google Scholar] [PubMed]
- Dale, K.; Kirk, M.; Sinclair, M.; Hall, R.; Leder, K. Reported waterborne outbreaks of gastrointestinal disease in Australia are predominantly associated with recreational exposure. Aust. N. Z. J. Public Health 2010, 34, 527–530. [Google Scholar] [CrossRef]
- Guzman-Herrador, B.; Carlander, A.; Ethelberg, S.; Freiesleben de Blasio, B.; Kuusi, M.; Lund, V.; Lofdahl, M.; MacDonald, E.; Nichols, G.; Schonning, C.; et al. Waterborne outbreaks in the Nordic countries, 1998 to 2012. Eurosurveillance 2015, 20, 21160. [Google Scholar] [CrossRef]
- Sinclair, R.G.; Jones, E.L.; Gerba, C.P. Viruses in recreational water-borne disease outbreaks: A review. J. Appl. Microbiol. 2009, 107, 1769–1780. [Google Scholar] [CrossRef]
- Ahmed, W.; Goonetilleke, A.; Gardner, T. Alternative indicators for detection and quantification of faecal pollution. Water 2008, 39, 46–49. [Google Scholar]
- Abia, A.L.K.; Ubomba-Jaswa, E.; Genthe, B.; Momba, M.N.B. Quantitative microbial risk assessment (QMRA) shows increased public health risk associated with exposure to river water under conditions of riverbed sediment resuspension. Sci. Total Environ. 2016, 566–567, 1143–1151. [Google Scholar] [CrossRef]
- Diallo, M.B.; Anceno, A.J.; Tawatsupa, B.; Houpt, E.R.; Wangsuphachart, V.; Shipin, O.V. Infection risk assessment of diarrhea-related pathogens in a tropical canal network. Sci. Total Environ. 2008, 407, 223–232. [Google Scholar] [CrossRef] [PubMed]
- Fernandez, C.; Salerno, C.M.; Paoloni, J.D.; Laurent, G.C. Water quality in a lagoon in the southeast pampa region of Argentina. Rev. Argent. Microbiol. 2007, 39, 51–56. [Google Scholar] [PubMed]
- Gemmell, M.E.; Schmidt, S. Is the microbiological quality of the Msunduzi River (KwaZulu-Natal, South Africa) suitable for domestic, recreational, and agricultural purposes? Environ. Sci. Pollut. Res. Int. 2013, 20, 6551–6562. [Google Scholar] [CrossRef] [PubMed]
- Hot, D.; Legeay, O.; Jacques, J.; Gantzer, C.; Caudrelier, Y.; Guyard, K.; Lange, M.; Andreoletti, L. Detection of somatic phages, infectious enteroviruses and enterovirus genomes as indicators of human enteric viral pollution in surface water. Water Res. 2003, 37, 4703–4710. [Google Scholar] [CrossRef]
- Hsu, B.M.; Chen, C.H.; Wan, M.T.; Cheng, H.W. Legionella prevalence in hot spring recreation areas of Taiwan. Water Res. 2006, 40, 3267–3273. [Google Scholar] [CrossRef] [PubMed]
- Jacob, P.; Henry, A.; Meheut, G.; Charni-Ben-Tabassi, N.; Ingrand, V.; Helmi, K. Health risk assessment related to waterborne pathogens from the river to the tap. Int. J. Environ. Res. Public Health 2015, 12, 2967–2983. [Google Scholar] [CrossRef] [PubMed]
- Kern, A.; Kadar, M.; Szomor, K.; Berencsi, G.; Kapusinszky, B.; Vargha, M. Detection of enteric viruses in hungarian surface waters: First steps towards environmental surveillance. J. Water Health 2013, 11, 772–782. [Google Scholar] [CrossRef]
- Marucci, P.L.; Olivera, N.L.; Brugnoni, L.I.; Sica, M.G.; Cubitto, M.A. The occurrence of Shiga toxin-producing Escherichia coli in bathing water of the Sierra de la Ventana region, Buenos Aires Province, Argentina. Environ. Monit. Assess. 2011, 175, 1–8. [Google Scholar] [CrossRef]
- Mwanamoki, P.M.; Devarajan, N.; Thevenon, F.; Atibu, E.K.; Tshibanda, J.B.; Ngelinkoto, P.; Mpiana, P.T.; Prabakar, K.; Mubedi, J.I.; Kabele, C.G.; et al. Assessment of pathogenic bacteria in water and sediment from a water reservoir under tropical conditions (Lake Ma Vallee), Kinshasa Democratic Republic of Congo. Environ. Monit. Assess. 2014, 186, 6821–6830. [Google Scholar] [CrossRef]
- Roser, D.J.; Davies, C.M.; Ashbolt, N.J.; Morison, P. Microbial exposure assessment of an urban recreational lake: A case study of the application of new risk-based guidelines. Water Sci. Technol. 2006, 54, 245–252. [Google Scholar] [CrossRef]
- Sales-Ortells, H.; Agostini, G.; Medema, G. Quantification of waterborne pathogens and associated health risks in urban water. Environ. Sci. Technol. 2015, 49, 6943–6952. [Google Scholar] [CrossRef] [PubMed]
- Schets, F.M.; van Wijnen, J.H.; Schijven, J.F.; Schoon, H.; de Roda Husman, A.M. Monitoring of waterborne pathogens in surface waters in Amsterdam, the Netherlands, and the potential health risk associated with exposure to Cryptosporidium and Giardia in these waters. Appl. Environ. Microbiol. 2008, 74, 2069–2078. [Google Scholar] [CrossRef] [PubMed]
- Staley, C.; Reckhow, K.H.; Lukasik, J.; Harwood, V.J. Assessment of sources of human pathogens and fecal contamination in a florida freshwater lake. Water Res. 2012, 46, 5799–5812. [Google Scholar] [CrossRef] [PubMed]
- Strathmann, M.; Horstkott, M.; Koch, C.; Gayer, U.; Wingender, J. The River Ruhr—An urban river under particular interest for recreational use and as a raw water source for drinking water: The collaborative research project “Safe Ruhr”—Microbiological aspects. Int. J. Hyg. Environ. Health 2016, 219, 643–661. [Google Scholar] [CrossRef] [PubMed]
- Thorolfsdottir, B.O.; Marteinsson, V.T. Microbiological analysis in three diverse natural geothermal bathing pools in iceland. Int. J. Environ. Res. Public Health 2013, 10, 1085–1099. [Google Scholar] [CrossRef]
- Weidhaas, J.; Anderson, A.; Jamal, R. Elucidating waterborne pathogen presence and aiding source apportionment in an impaired stream. Appl. Environ. Microbiol. 2018, 84, AEM-02510. [Google Scholar] [CrossRef]
- Wyn-Jones, A.P.; Carducci, A.; Cook, N.; D’Agostino, M.; Divizia, M.; Fleischer, J.; Gantzer, C.; Gawler, A.; Girones, R.; Holler, C.; et al. Surveillance of adenoviruses and noroviruses in European recreational waters. Water Res. 2011, 45, 1025–1038. [Google Scholar] [CrossRef]
- Burnet, J.B.; Penny, C.; Ogorzaly, L.; Cauchie, H.M. Spatial and temporal distribution of Cryptosporidium and Giardia in a drinking water resource: Implications for monitoring and risk assessment. Sci. Total Environ. 2014, 472, 1023–1035. [Google Scholar] [CrossRef]
- Devane, M.L.; Moriarty, E.M.; Wood, D.; Webster-Brown, J.; Gilpin, B.J. The impact of major earthquakes and subsequent sewage discharges on the microbial quality of water and sediments in an urban river. Sci. Total Environ. 2014, 485–486, 666–680. [Google Scholar] [CrossRef]
- Dorevitch, S.; Doi, M.; Hsu, F.C.; Lin, K.T.; Roberts, J.D.; Liu, L.C.; Gladding, R.; Vannoy, E.; Li, H.; Javor, M.; et al. A comparison of rapid and conventional measures of indicator bacteria as predictors of waterborne protozoan pathogen presence and density. J. Environ. Monit. 2011, 13, 2427–2435. [Google Scholar] [CrossRef]
- Duris, J.W.; Reif, A.G.; Krouse, D.A.; Isaacs, N.M. Factors related to occurrence and distribution of selected bacterial and protozoan pathogens in pennsylvania streams. Water Res. 2013, 47, 300–314. [Google Scholar] [CrossRef] [PubMed]
- Haack, S.K.; Duris, J.W.; Fogarty, L.R.; Kolpin, D.W.; Focazio, M.J.; Furlong, E.T.; Meyer, M.T. Comparing wastewater chemicals, indicator bacteria concentrations, and bacterial pathogen genes as fecal pollution indicators. J. Environ. Qual. 2009, 38, 248–258. [Google Scholar] [CrossRef]
- Ji, W.T.; Hsu, B.M.; Chang, T.Y.; Hsu, T.K.; Kao, P.M.; Huang, K.H.; Tsai, S.F.; Huang, Y.L.; Fan, C.W. Surveillance and evaluation of the infection risk of free-living amoebae and Legionella in different aquatic environments. Sci. Total Environ. 2014, 499, 212–219. [Google Scholar] [CrossRef] [PubMed]
- Mansilha, C.R.; Coelho, C.A.; Reinas, A.; Moutinho, A.; Ferreira, S.; Pizarro, C.; Tavares, A. Salmonella: The forgotten pathogen: Health hazards of compliance with European bathing water legislation. Mar. Pollut. Bull. 2010, 60, 819–826. [Google Scholar] [CrossRef] [PubMed]
- Oster, R.J.; Wijesinghe, R.U.; Haack, S.K.; Fogarty, L.R.; Tucker, T.R.; Riley, S.C. Bacterial pathogen gene abundance and relation to recreational water quality at seven Great Lakes beaches. Environ. Sci. Technol. 2014, 48, 14148–14157. [Google Scholar] [CrossRef] [PubMed]
- Poma, V.; Mamani, N.; Iniguez, V. Impact of urban contamination of the La Paz River basin on thermotolerant coliform density and occurrence of multiple antibiotic resistant enteric pathogens in river water, irrigated soil and fresh vegetables. Springerplus 2016, 5, 499. [Google Scholar] [CrossRef] [PubMed]
- Shen, S.M.; Chou, M.Y.; Hsu, B.M.; Ji, W.T.; Hsu, T.K.; Tsai, H.F.; Huang, Y.L.; Chiu, Y.C.; Kao, E.S.; Kao, P.M.; et al. Assessment of Legionella pneumophila in recreational spring water with quantitative PCR (Taqman) assay. Pathog. Glob. Health 2015, 109, 236–241. [Google Scholar] [CrossRef] [PubMed]
- Wilkes, G.; Edge, T.; Gannon, V.; Jokinen, C.; Lyautey, E.; Medeiros, D.; Neumann, N.; Ruecker, N.; Topp, E.; Lapen, D.R. Seasonal relationships among indicator bacteria, pathogenic bacteria, Cryptosporidium oocysts, Giardia cysts, and hydrological indices for surface waters within an agricultural landscape. Water Res. 2009, 43, 2209–2223. [Google Scholar] [CrossRef] [PubMed]
- Wyer, M.D.; Wyn-Jones, A.P.; Kay, D.; Au-Yeung, H.K.; Girones, R.; Lopez-Pila, J.; de Roda Husman, A.M.; Rutjes, S.; Schneider, O. Relationships between human adenoviruses and faecal indicator organisms in European recreational waters. Water Res. 2012, 46, 4130–4141. [Google Scholar] [CrossRef] [PubMed]
- Xiao, G.; Wang, Z.; Chen, J.; Qiu, Z.; Li, Y.; Qi, J.; Liu, W.; Shu, W. Occurrence and infection risk of waterborne pathogens in Wanzhou watershed of the Three Gorges Reservoir, China. J. Environ. Sci. 2013, 25, 1913–1924. [Google Scholar] [CrossRef]
- Cui, Q.; Fang, T.; Huang, Y.; Dong, P.; Wang, H. Evaluation of bacterial pathogen diversity, abundance and health risks in urban recreational water by amplicon next-generation sequencing and quantitative PCR. J. Environ. Sci. 2017, 57, 137–149. [Google Scholar] [CrossRef] [PubMed]
- Duris, J.W.; Haack, S.K.; Fogarty, L.R. Gene and antigen markers of Shiga-toxin producing E. coli from Michigan and Indiana river water: Occurrence and relation to recreational water quality criteria. J. Environ. Qual. 2009, 38, 1878–1886. [Google Scholar] [CrossRef] [PubMed]
- Fang, T.; Cui, Q.; Huang, Y.; Dong, P.; Wang, H.; Liu, W.T.; Ye, Q. Distribution comparison and risk assessment of free-floating and particle-attached bacterial pathogens in urban recreational water: Implications for water quality management. Sci. Total Environ. 2018, 613–614, 428–438. [Google Scholar] [CrossRef] [PubMed]
- Fong, T.T.; Griffin, D.W.; Lipp, E.K. Molecular assays for targeting human and bovine enteric viruses in coastal waters and their application for library-independent source tracking. Appl. Environ. Microbiol. 2005, 71, 2070–2078. [Google Scholar] [CrossRef] [PubMed]
- Hellein, K.N.; Battie, C.; Tauchman, E.; Lund, D.; Oyarzabal, O.A.; Lepo, J.E. Culture-based indicators of fecal contamination and molecular microbial indicators rarely correlate with Campylobacter spp. in recreational waters. J. Water Health 2011, 9, 695–707. [Google Scholar] [CrossRef] [PubMed]
- Ishii, S.; Nakamura, T.; Ozawa, S.; Kobayashi, A.; Sano, D.; Okabe, S. Water quality monitoring and risk assessment by simultaneous multipathogen quantification. Environ. Sci. Technol. 2014, 48, 4744–4749. [Google Scholar] [CrossRef] [PubMed]
- Lee, C.S.; Lee, C.; Marion, J.; Wang, Q.H.; Saif, L.; Lee, J. Occurrence of human enteric viruses at freshwater beaches during swimming season and its link to water inflow. Sci. Total Environ. 2014, 472, 757–766. [Google Scholar] [CrossRef]
- Miagostovich, M.P.; Ferreira, F.F.; Guimaraes, F.R.; Fumian, T.M.; Diniz-Mendes, L.; Luz, S.L.; Silva, L.A.; Leite, J.P. Molecular detection and characterization of gastroenteritis viruses occurring naturally in the stream waters of manaus, central Amazonia, Brazil. Appl. Environ. Microbiol. 2008, 74, 375–382. [Google Scholar] [CrossRef] [PubMed]
- Smith, C.J.; Olszewski, A.M.; Mauro, S.A. Correlation of shiga toxin gene frequency with commonly used microbial indicators of recreational water quality. Appl. Environ. Microbiol. 2009, 75, 316–321. [Google Scholar] [CrossRef]
- Xiao, S.; Zhang, Y.; Zhao, X.; Sun, L.; Hu, S. Presence and molecular characterization of Cryptosporidium and Giardia in recreational lake water in Tianjin, China: A preliminary study. Sci. Rep. 2018, 8, 2353. [Google Scholar] [CrossRef]
- Abdelzaher, A.M.; Wright, M.E.; Ortega, C.; Hasan, A.R.; Shibata, T.; Solo-Gabriele, H.M.; Kish, J.; Withum, K.; He, G.; Elmir, S.M.; et al. Daily measures of microbes and human health at a non-point source marine beach. J. Water Health 2011, 9, 443–457. [Google Scholar] [CrossRef] [PubMed]
- Abdelzaher, A.M.; Wright, M.E.; Ortega, C.; Solo-Gabriele, H.M.; Miller, G.; Elmir, S.; Newman, X.; Shih, P.; Bonilla, J.A.; Bonilla, T.D.; et al. Presence of pathogens and indicator microbes at a non-point source subtropical recreational marine beach. Appl. Environ. Microbiol. 2010, 76, 724–732. [Google Scholar] [CrossRef] [PubMed]
- Goyal, S.M.; Gerba, C.P.; Melnick, J.L. Occurrence and distribution of bacterial indicators and pathogens in canal communities along the Texas coast. Appl. Environ. Microbiol. 1977, 34, 139–149. [Google Scholar] [PubMed]
- Griffith, J.F.; Weisberg, S.B.; Arnold, B.F.; Cao, Y.; Schiff, K.C.; Colford, J.M., Jr. Epidemiologic evaluation of multiple alternate microbial water quality monitoring indicators at three California beaches. Water Res. 2016, 94, 371–381. [Google Scholar] [CrossRef] [PubMed]
- Korajkic, A.; Brownell, M.J.; Harwood, V.J. Investigation of human sewage pollution and pathogen analysis at Florida Gulf coast beaches. J. Appl. Microbiol. 2011, 110, 174–183. [Google Scholar] [CrossRef] [PubMed]
- Lipp, E.K.; Farrah, S.A.; Rose, J.B. Assessment and impact of microbial fecal pollution and human enteric pathogens in a coastal community. Mar. Pollut. Bull. 2001, 42, 286–293. [Google Scholar] [CrossRef]
- Moce-Llivina, L.; Lucena, F.; Jofre, J. Enteroviruses and bacteriophages in bathing waters. Appl. Environ. Microbiol. 2005, 71, 6838–6844. [Google Scholar] [CrossRef] [PubMed]
- Rosario, K.; Symonds, E.M.; Sinigalliano, C.; Stewart, J.; Breitbart, M. Pepper mild mottle virus as an indicator of fecal pollution. Appl. Environ. Microbiol. 2009, 75, 7261–7267. [Google Scholar] [CrossRef] [PubMed]
- Shaw, K.S.; Rosenberg Goldstein, R.E.; He, X.; Jacobs, J.M.; Crump, B.C.; Sapkota, A.R. Antimicrobial susceptibility of Vibrio vulnificus and Vibrio parahaemolyticus recovered from recreational and commercial areas of Chesapeake Bay and Maryland Coastal Bays. PLoS ONE 2014, 9, e89616. [Google Scholar] [CrossRef]
- Shaw, K.S.; Sapkota, A.R.; Jacobs, J.M.; He, X.; Crump, B.C. Recreational swimmers’ exposure to Vibrio vulnificus and Vibrio parahaemolyticus in the Chesapeake Bay, Maryland, USA. Environ. Int. 2015, 74, 99–105. [Google Scholar] [CrossRef]
- Sinigalliano, C.D.; Fleisher, J.M.; Gidley, M.L.; Solo-Gabriele, H.M.; Shibata, T.; Plano, L.R.; Elmir, S.M.; Wanless, D.; Bartkowiak, J.; Boiteau, R.; et al. Traditional and molecular analyses for fecal indicator bacteria in non-point source subtropical recreational marine waters. Water Res. 2010, 44, 3763–3772. [Google Scholar] [CrossRef] [PubMed]
- Wetz, J.J.; Lipp, E.K.; Griffin, D.W.; Lukasik, J.; Wait, D.; Sobsey, M.D.; Scott, T.M.; Rose, J.B. Presence, infectivity, and stability of enteric viruses in seawater: Relationship to marine water quality in the Florida keys. Mar. Pollut. Bull. 2004, 48, 698–704. [Google Scholar] [CrossRef] [PubMed]
- Betancourt, W.Q.; Duarte, D.C.; Vasquez, R.C.; Gurian, P.L. Cryptosporidium and Giardia in tropical recreational marine waters contaminated with domestic sewage: Estimation of bathing-associated disease risks. Mar. Pollut. Bull. 2014, 85, 268–273. [Google Scholar] [CrossRef] [PubMed]
- Henry, R.; Schang, C.; Kolotelo, P.; Coleman, R.; Rooney, G.; Schmidt, J.; Deletic, A.; McCarthy, D.T. Effect of environmental parameters on pathogen and faecal indicator organism concentrations within an urban estuary. Estuar. Coast. Shelf Sci. 2016, 174, 18–26. [Google Scholar] [CrossRef]
- Jiang, S.; Noble, R.; Chu, W. Human adenoviruses and coliphages in urban runoff-impacted coastal waters of southern California. Appl. Environ. Microbiol. 2001, 67, 179–184. [Google Scholar] [CrossRef] [PubMed]
- Jiang, S.C.; Chu, W. Pcr detection of pathogenic viruses in southern California urban rivers. J. Appl. Microbiol. 2004, 97, 17–28. [Google Scholar] [CrossRef]
- Jiang, S.C.; Chu, W.; He, J.W. Seasonal detection of human viruses and coliphage in Newport Bay, California. Appl. Environ. Microbiol. 2007, 73, 6468–6474. [Google Scholar] [CrossRef]
- McQuaig, S.; Griffith, J.; Harwood, V.J. Association of fecal indicator bacteria with human viruses and microbial source tracking markers at coastal beaches impacted by nonpoint source pollution. Appl. Environ. Microbiol. 2012, 78, 6423–6432. [Google Scholar] [CrossRef]
- Ortega, C.; Solo-Gabriele, H.M.; Abdelzaher, A.; Wright, M.; Deng, Y.; Stark, L.M. Correlations between microbial indicators, pathogens, and environmental factors in a subtropical estuary. Mar. Pollut. Bull. 2009, 58, 1374–1381. [Google Scholar] [CrossRef]
- Silva, A.M.; Vieira, H.; Martins, N.; Granja, A.T.; Vale, M.J.; Vale, F.F. Viral and bacterial contamination in recreational waters: A case study in the Lisbon bay area. J. Appl. Microbiol. 2010, 108, 1023–1031. [Google Scholar] [CrossRef]
- Efstratiou, M.A.; Tsirtsis, G. Do 2006/7/EC European Union Bathing Water Standards exclude the risk of contact with Salmonella or Candida albicans? Mar. Pollut. Bull. 2009, 58, 1039–1044. [Google Scholar] [CrossRef] [PubMed]
- Graczyk, T.K.; Sunderland, D.; Awantang, G.N.; Mashinski, Y.; Lucy, F.E.; Graczyk, Z.; Chomicz, L.; Breysse, P.N. Relationships among bather density, levels of human waterborne pathogens, and fecal coliform counts in marine recreational beach water. Parasitol. Res. 2010, 106, 1103–1108. [Google Scholar] [CrossRef] [PubMed]
- McQuaig, S.M.; Scott, T.M.; Harwood, V.J.; Farrah, S.R.; Lukasik, J.O. Detection of human-derived fecal pollution in environmental waters by use of a PCR-based human polyomavirus assay. Appl. Environ. Microbiol. 2006, 72, 7567–7574. [Google Scholar] [CrossRef] [PubMed]
- McQuaig, S.M.; Scott, T.M.; Lukasik, J.O.; Paul, J.H.; Harwood, V.J. Quantification of human polyomaviruses JC virus and BK virus by taqman quantitative pcr and comparison to other water quality indicators in water and fecal samples. Appl. Environ. Microbiol. 2009, 75, 3379–3388. [Google Scholar] [CrossRef] [PubMed]
- Viau, E.J.; Goodwin, K.D.; Yamahara, K.M.; Layton, B.A.; Sassoubre, L.M.; Burns, S.L.; Tong, H.I.; Wong, S.H.; Lu, Y.; Boehm, A.B. Bacterial pathogens in Hawaiian coastal streams—Associations with fecal indicators, land cover, and water quality. Water Res. 2011, 45, 3279–3290. [Google Scholar] [CrossRef] [PubMed]
- Graczyk, T.K.; Sunderland, D.; Tamang, L.; Shields, T.M.; Lucy, F.E.; Breysse, P.N. Quantitative evaluation of the impact of bather density on levels of human-virulent microsporidian spores in recreational water. Appl. Environ. Microbiol. 2007, 73, 4095–4099. [Google Scholar] [CrossRef] [PubMed]
- Lodder, W.J.; de Roda Husman, A.M. Presence of noroviruses and other enteric viruses in sewage and surface waters in the Netherlands. Appl. Environ. Microbiol. 2005, 71, 1453–1461. [Google Scholar] [CrossRef] [PubMed]
- Rezaeinejad, S.; Vergara, G.G.; Woo, C.H.; Lim, T.T.; Sobsey, M.D.; Gin, K.Y. Surveillance of enteric viruses and coliphages in a tropical urban catchment. Water Res. 2014, 58, 122–131. [Google Scholar] [CrossRef]
- Fung, D.Y.C.; Fujioka, R.; Vijayavel, K.; Sato, D.; Bishop, D. Evaluation of fung double tube test for Clostridium perfringens and Easyphage test for F-specific RNA coliphages as rapid screening tests for fecal contamination in recreational waters of Hawaii (vol 15, pg 217, 2007). J. Rapid Methods Autom. Microbiol. 2007, 15, 411. [Google Scholar] [CrossRef]
- Wong, M.; Kumar, L.; Jenkins, T.M.; Xagoraraki, I.; Phanikumar, M.S.; Rose, J.B. Evaluation of public health risks at recreational beaches in Lake Michigan via detection of enteric viruses and a human-specific bacteriological marker. Water Res. 2009, 43, 1137–1149. [Google Scholar] [CrossRef]
- Walters, S.P.; Gannon, V.P.; Field, K.G. Detection of Bacteroidales fecal indicators and the zoonotic pathogens E. coli 0157:H7, Salmonella, and Campylobacter in river water. Environ. Sci. Technol. 2007, 41, 1856–1862. [Google Scholar] [CrossRef] [PubMed]
- Donati, M.; Cremonini, E.; Di Francesco, A.; Dallolio, L.; Biondi, R.; Muthusamy, R.; Leoni, E. Prevalence of Simkania negevensis in chlorinated water from spa swimming pools and domestic supplies. J. Appl. Microbiol. 2015, 118, 1076–1082. [Google Scholar] [CrossRef] [PubMed]
- La Rosa, G.; Della Libera, S.; Petricca, S.; Iaconelli, M.; Briancesco, R.; Paradiso, R.; Semproni, M.; Di Bonito, P.; Bonadonna, L. First detection of papillomaviruses and polyomaviruses in swimming pool waters: Unrecognized recreational water-related pathogens? J. Appl. Microbiol. 2015, 119, 1683–1691. [Google Scholar] [CrossRef] [PubMed]
- Maunula, L.; Kalso, S.; Von Bonsdorff, C.H.; Ponka, A. Wading pool water contaminated with both noroviruses and astroviruses as the source of a gastroenteritis outbreak. Epidemiol. Infect. 2004, 132, 737–743. [Google Scholar] [CrossRef] [PubMed]
- Wade, T.J.; Calderon, R.L.; Brenner, K.P.; Sams, E.; Beach, M.; Haugland, R.; Wymer, L.; Dufour, A.P. High sensitivity of children to swimming-associated gastrointestinal illness: Results using a rapid assay of recreational water quality. Epidemiology 2008, 19, 375–383. [Google Scholar] [CrossRef]
- Yau, V.M.; Schiff, K.C.; Arnold, B.F.; Griffith, J.F.; Gruber, J.S.; Wright, C.C.; Wade, T.J.; Burns, S.; Hayes, J.M.; McGee, C.; et al. Effect of submarine groundwater discharge on bacterial indicators and swimmer health at Avalon Beach, CA, USA. Water Res. 2014, 59, 23–36. [Google Scholar] [CrossRef]
- Napier, M.D.; Haugland, R.; Poole, C.; Dufour, A.P.; Stewart, J.R.; Weber, D.J.; Varma, M.; Lavender, J.S.; Wade, T.J. Exposure to human-associated fecal indicators and self-reported illness among swimmers at recreational beaches: A cohort study. Environ. Health 2017, 16, 103. [Google Scholar] [CrossRef]
- Benjamin-Chung, J.; Arnold, B.F.; Wade, T.J.; Schiff, K.; Griffith, J.F.; Dufour, A.P.; Weisberg, S.B.; Colford, J.M., Jr. Coliphages and gastrointestinal illness in recreational waters: Pooled analysis of six coastal beach cohorts. Epidemiology 2017, 28, 644–652. [Google Scholar] [CrossRef]
- Arnold, B.F.; Wade, T.J.; Benjamin-Chung, J.; Schiff, K.C.; Griffith, J.F.; Dufour, A.P.; Weisberg, S.B.; Colford, J.M., Jr. Acute gastroenteritis and recreational water: Highest burden among young US children. Am. J. Public Health 2016, 106, 1690–1697. [Google Scholar] [CrossRef]
- Wade, T.J.; Sams, E.A.; Beach, M.J.; Collier, S.A.; Dufour, A.P. The incidence and health burden of earaches attributable to recreational swimming in natural waters: A prospective cohort study. Environ. Health 2013, 12, 67. [Google Scholar] [CrossRef]
- Colford, J.M., Jr.; Schiff, K.C.; Griffith, J.F.; Yau, V.; Arnold, B.F.; Wright, C.C.; Gruber, J.S.; Wade, T.J.; Burns, S.; Hayes, J.; et al. Using rapid indicators for enterococcus to assess the risk of illness after exposure to urban runoff contaminated marine water. Water Res. 2012, 46, 2176–2186. [Google Scholar] [CrossRef] [PubMed]
- Wade, T.J.; Sams, E.; Brenner, K.P.; Haugland, R.; Chern, E.; Beach, M.; Wymer, L.; Rankin, C.C.; Love, D.; Li, Q.; et al. Rapidly measured indicators of recreational water quality and swimming-associated illness at marine beaches: A prospective cohort study. Environ. Health 2010, 9, 66. [Google Scholar] [CrossRef] [PubMed]
- Colford, J.M., Jr.; Wade, T.J.; Schift, K.C.; Wright, C.; Griffith, J.F.; Sandhu, S.K.; Weisberg, S.B. Recreational Water Contact and Illness in Mission Bay, California; Southern California Coastal Water Research Project: Costa Mesa, CA, USA, 2005. [Google Scholar]
- Colford, J.M., Jr.; Wade, T.J.; Schiff, K.C.; Wright, C.C.; Griffith, J.F.; Sandhu, S.K.; Burns, S.; Sobsey, M.; Lovelace, G.; Weisberg, S.B. Water quality indicators and the risk of illness at beaches with nonpoint sources of fecal contamination. Epidemiology 2007, 18, 27–35. [Google Scholar] [CrossRef] [PubMed]
- Wade, T.J.; Calderon, R.L.; Sams, E.; Beach, M.; Brenner, K.P.; Williams, A.H.; Dufour, A.P. Rapidly measured indicators of recreational water quality are predictive of swimming-associated gastrointestinal illness. Environ. Health Perspect. 2006, 114, 24–28. [Google Scholar] [CrossRef]
- Arnold, B.F.; Schiff, K.C.; Ercumen, A.; Benjamin-Chung, J.; Steele, J.A.; Griffith, J.F.; Steinberg, S.J.; Smith, P.; McGee, C.D.; Wilson, R.; et al. Acute illness among surfers after exposure to seawater in dry- and wet-weather conditions. Am. J. Epidemiol. 2017, 186, 866–875. [Google Scholar] [CrossRef] [PubMed]
- Vonschirnding, Y.E.R.; Kfir, R.; Cabelli, V.; Franklin, L.; Joubert, G. Morbidity among bathers exposed to polluted seawater—A prospective epidemiologic-study. S. Afr. Med. J. 1992, 81, 543–546. [Google Scholar]
- Lee, J.V.; Dawson, S.R.; Ward, S.; Surman, S.B.; Neal, K.R. Bacteriophages are a better indicator of illness rates than bacteria amongst users of a white water course fed by a lowland river. Water Sci. Technol. 1997, 35, 165–170. [Google Scholar] [CrossRef]
- Van Asperen, I.A.; Medema, G.; Borgdorff, M.W.; Sprenger, M.J.W.; Havelaar, A.H. Risk of gastroenteritis among triathletes in relation to faecal pollution of fresh waters. Int. J. Epidemiol. 1998, 27, 309–315. [Google Scholar] [CrossRef]
- Schets, F.M.; Schijven, J.F.; de Roda Husman, A.M. Exposure assessment for swimmers in bathing waters and swimming pools. Water Res. 2011, 45, 2392–2400. [Google Scholar] [CrossRef]
- Schets, F.M.; De Roda Husman, A.M.; Havelaar, A.H. Disease outbreaks associated with untreated recreational water use. Epidemiol. Infect. 2011, 139, 1114–1125. [Google Scholar] [CrossRef]
- Grenier, J.L.; Davis, J.A. Water quality in south San Francisco Bay, California: Current condition and potential issues for the South Bay Salt Pond Restoration Project. Rev. Environ. Contam. Toxicol. 2010, 206, 115–147. [Google Scholar] [PubMed]
- McMinn, B.R.; Ashbolt, N.J.; Korajkic, A. Bacteriophages as indicators of faecal pollution and enteric virus removal. Lett. Appl. Microbiol. 2017, 65, 11–26. [Google Scholar] [CrossRef] [PubMed]
- McMinn, B.R.; Korajkic, A.; Ashbolt, N.J. Evaluation of Bacteroides fragilis GB-124 bacteriophages as novel human-associated faecal indicators in the United States. Lett. Appl. Microbiol. 2014, 59, 115–121. [Google Scholar] [CrossRef] [PubMed]
- Eftim, S.E.; Hong, T.; Soller, J.; Boehm, A.; Warren, I.; Ichida, A.; Nappier, S.P. Occurrence of norovirus in raw sewage—A systematic literature review and meta-analysis. Water Res. 2017, 111, 366–374. [Google Scholar] [CrossRef]
- Li, J.; Wang, H.; Wang, R.; Zhang, L. Giardia duodenalis infections in humans and other animals in China. Front. Microbiol. 2017, 8, 2004. [Google Scholar] [CrossRef]
- Rose, J.B.; Huffman, D.E.; Gennaccaro, A. Risk and control of waterborne cryptosporidiosis. FEMS Microbiol. Rev. 2002, 26, 113–123. [Google Scholar] [CrossRef]
- Sinclair, R.G.; Choi, C.Y.; Riley, M.R.; Gerba, C.P. Pathogen surveillance through monitoring of sewer systems. Adv. Appl. Microbiol. 2008, 65, 249–269. [Google Scholar]
- Ganesh, A.; Lin, J. Waterborne human pathogenic viruses of public health concern. Int. J. Environ. Health Res. 2013, 23, 544–564. [Google Scholar] [CrossRef]
- Matthews, L.; Low, J.C.; Gally, D.L.; Pearce, M.C.; Mellor, D.J.; Heesterbeek, J.A.; Chase-Topping, M.; Naylor, S.W.; Shaw, D.J.; Reid, S.W.; et al. Heterogeneous shedding of Escherichia coli O157 in cattle and its implications for control. Proc. Natl. Acad. Sci. USA 2006, 103, 547–552. [Google Scholar] [CrossRef]
- Daniels, M.E.; Shrivastava, A.; Smith, W.A.; Sahu, P.; Odagiri, M.; Misra, P.R.; Panigrahi, P.; Suar, M.; Clasen, T.; Jenkins, M.W. Cryptosporidium and Giardia in humans, domestic animals, and village water sources in rural india. Am. J. Trop. Med. Hyg. 2015, 93, 596–600. [Google Scholar] [CrossRef]
- Oates, S.C.; Miller, M.A.; Hardin, D.; Conrad, P.A.; Melli, A.; Jessup, D.A.; Dominik, C.; Roug, A.; Tinker, M.T.; Miller, W.A. Prevalence, environmental loading, and molecular characterization of Cryptosporidium and Giardia isolates from domestic and wild animals along the central California Coast. Appl. Environ. Microbiol. 2012, 78, 8762–8772. [Google Scholar] [CrossRef] [PubMed]
- Vonberg, R.P.; Hohle, M.; Aepfelbacher, M.; Bange, F.C.; Campos, C.B.; Claussen, K.; Christner, M.; Cramer, J.P.; Haller, H.; Hornef, M.; et al. Duration of fecal shedding of shiga toxin-producing Escherichia coli O104:H4 in patients infected during the 2011 outbreak in Germany: A multicenter study. Clin. Infect. Dis. 2013, 56, 1132–1140. [Google Scholar] [CrossRef] [PubMed]
- Lanzas, C.; Warnick, L.D.; James, K.L.; Wright, E.M.; Wiedmann, M.; Grohn, Y.T. Transmission dynamics of a multidrug-resistant Salmonella typhimurium outbreak in a dairy farm. Foodborne Pathog. Dis. 2010, 7, 467–474. [Google Scholar] [CrossRef]
- Venegas-Vargas, C.; Henderson, S.; Khare, A.; Mosci, R.E.; Lehnert, J.D.; Singh, P.; Ouellette, L.M.; Norby, B.; Funk, J.A.; Rust, S.; et al. Factors associated with Shiga toxin-producing Escherichia coli shedding by dairy and beef cattle. Appl. Environ. Microb. 2016, 82, 5049–5056. [Google Scholar] [CrossRef]
- Procter, T.D.; Pearl, D.L.; Finley, R.L.; Leonard, E.K.; Janecko, N.; Reid-Smith, R.J.; Weese, J.S.; Peregrine, A.S.; Sargeant, J.M. A cross-sectional study examining Campylobacter and other zoonotic enteric pathogens in dogs that frequent dog parks in three cities in south-western ontario and risk factors for shedding of Campylobacter spp. Zoonoses Public Health 2014, 61, 208–218. [Google Scholar] [CrossRef] [PubMed]
- Xu, Y.; Dugat-Bony, E.; Zaheer, R.; Selinger, L.; Barbieri, R.; Munns, K.; McAllister, T.A.; Selinger, L.B. Escherichia coli O157:H7 super-shedder and non-shedder feedlot steers harbour distinct fecal bacterial communities. PLoS ONE 2014, 9, e98115. [Google Scholar] [CrossRef]
- Leclerc, H.; Schwartzbrod, L.; Dei-Cas, E. Microbial agents associated with waterborne diseases. Crit. Rev. Microbiol. 2002, 28, 371–409. [Google Scholar] [CrossRef] [PubMed]
- Hara-Kudo, Y.; Takatori, K. Contamination level and ingestion dose of foodborne pathogens associated with infections. Epidemiol. Infect. 2011, 139, 1505–1510. [Google Scholar] [CrossRef] [PubMed]
- Harwood, V.J.; Levine, A.D.; Scott, T.M.; Chivukula, V.; Lukasik, J.; Farrah, S.R.; Rose, J.B. Validity of the indicator organism paradigm for pathogen reduction in reclaimed water and public health protection. Appl. Environ. Microbiol. 2005, 71, 3163–3170. [Google Scholar] [CrossRef]
- Hijnen, W.A.; Beerendonk, E.F.; Medema, G.J. Inactivation credit of uv radiation for viruses, bacteria and protozoan (oo)cysts in water: A review. Water Res. 2006, 40, 3–22. [Google Scholar] [CrossRef]
- Nasser, A.M. Removal of Cryptosporidium by wastewater treatment processes: A review. J. Water Health 2016, 14, 1–13. [Google Scholar] [CrossRef] [PubMed]
- Eischeid, A.C.; Meyer, J.N.; Linden, K.G. Uv disinfection of adenoviruses: Molecular indications of DNA damage efficiency. Appl. Environ. Microbiol. 2009, 75, 23–28. [Google Scholar] [CrossRef] [PubMed]
- Nelson, K.L.; Boehm, A.B.; Davies-Colley, R.J.; Dodd, M.C.; Kohn, T.; Linden, K.G.; Liu, Y.; Maraccini, P.A.; McNeill, K.; Mitch, W.A.; et al. Sunlight-mediated inactivation of health-relevant microorganisms in water: A review of mechanisms and modeling approaches. Environ. Sci. Process. Impacts 2018, 20, 1089–1122. [Google Scholar] [CrossRef] [PubMed]
- Bae, S.; Wuertz, S. Decay of host-associated bacteroidales cells and DNA in continuous-flow freshwater and seawater microcosms of identical experimental design and temperature as measured by PMA-qPCR and qPCR. Water Res. 2015, 70, 205–213. [Google Scholar] [CrossRef] [PubMed]
- Bae, S.; Wuertz, S. Survival of host-associated bacteroidales cells and their relationship with Enterococcus spp., Campylobacter jejuni, Salmonella enterica serovar typhimurium, and adenovirus in freshwater microcosms as measured by propidium monoazide-quantitative pcr. Appl. Environ. Microbiol. 2012, 78, 922–932. [Google Scholar] [CrossRef] [PubMed]
- Wanjugi, P.; Sivaganesan, M.; Korajkic, A.; Kelty, C.A.; McMinn, B.; Ulrich, R.; Harwood, V.J.; Shanks, O.C. Differential decomposition of bacterial and viral fecal indicators in common human pollution types. Water Res. 2016, 105, 591–601. [Google Scholar] [CrossRef]
- Korajkic, A.; McMinn, B.R.; Shanks, O.C.; Sivaganesan, M.; Fout, G.S.; Ashbolt, N.J. Biotic interactions and sunlight affect persistence of fecal indicator bacteria and microbial source tracking genetic markers in the upper Mississippi River. Appl. Environ. Microbiol. 2014, 80, 3952–3961. [Google Scholar] [CrossRef]
- Kreader, C.A. Persistence of pcr-detectable bacteroides distasonis from human feces in river water. Appl. Environ. Microbiol. 1998, 64, 4103–4105. [Google Scholar]
- Dick, L.K.; Stelzer, E.A.; Bertke, E.E.; Fong, D.L.; Stoeckel, D.M. Relative decay of bacteroidales microbial source tracking markers and cultivated Escherichia coli in freshwater microcosms. Appl. Environ. Microbiol. 2010, 76, 3255–3262. [Google Scholar] [CrossRef]
- Booncharoen, N.; Mongkolsuk, S.; Sirikanchana, K. Comparative persistence of human sewage-specific enterococcal bacteriophages in freshwater and seawater. Appl. Microbiol. Biotechnol. 2018, 102, 6235–6246. [Google Scholar] [CrossRef]
- Chauret, C.; Nolan, K.; Chen, P.; Springthorpe, S.; Sattar, S. Aging of Cryptosporidium parvum oocysts in river water and their susceptibility to disinfection by chlorine and monochloramine. Can. J. Microbiol. 1998, 44, 1154–1160. [Google Scholar] [CrossRef] [PubMed]
- McCrary, K.J.; Case, C.L.H.; Gentry, T.J.; Aitkenhead-Peterson, J.A. Escherichia coli regrowth in disinfected sewage effluent: Effect of doc and nutrients on regrowth in laboratory incubations and urban streams. Water Air Soil Pollut. 2013, 224, 1412. [Google Scholar] [CrossRef]
- Shelton, D.R.; Pachepsky, Y.A.; Kiefer, L.A.; Blaustein, R.A.; McCarty, G.W.; Dao, T.H. Response of coliform populations in streambed sediment and water column to changes in nutrient concentrations in water. Water Res. 2014, 59, 316–324. [Google Scholar] [CrossRef] [PubMed]
- Gregory, L.F.; Karthikeyan, R.; Aitkenhead-Peterson, J.A.; Gentry, T.J.; Wagner, K.L.; Harmel, R.D. Nutrient loading impacts on culturable E. coli and other heterotrophic bacteria fate in simulated stream mesocosms. Water Res. 2017, 126, 442–449. [Google Scholar] [CrossRef] [PubMed]
- Wanjugi, P.; Fox, G.A.; Harwood, V.J. The interplay between predation, competition, and nutrient levels influences the survival of Escherichia coli in aquatic environments. Microb. Ecol. 2016, 72, 526–537. [Google Scholar] [CrossRef] [PubMed]
- Sinton, L.W.; Davies-Colley, R.J.; Bell, R.G. Inactivation of enterococci and fecal coliforms from sewage and meatworks effluents in seawater chambers. Appl. Environ. Microbiol. 1994, 60, 2040–2048. [Google Scholar] [PubMed]
- Sinton, L.W.; Finlay, R.K.; Lynch, P.A. Sunlight inactivation of fecal bacteriophages and bacteria in sewage-polluted seawater. Appl. Environ. Microbiol. 1999, 65, 3605–3613. [Google Scholar]
- Sokolova, E.; Astrom, J.; Pettersson, T.J.; Bergstedt, O.; Hermansson, M. Decay of bacteroidales genetic markers in relation to traditional fecal indicators for water quality modeling of drinking water sources. Environ. Sci. Technol. 2012, 46, 892–900. [Google Scholar] [CrossRef]
- Ngazoa, E.S.; Fliss, I.; Jean, J. Quantitative study of persistence of human norovirus genome in water using TaqMan real-time RT-PCR. J. Appl. Microbiol. 2008, 104, 707–715. [Google Scholar] [CrossRef]
- Wait, D.A.; Sobsey, M.D. Comparative survival of enteric viruses and bacteria in Atlantic ocean seawater. Water Sci. Technol. 2001, 43, 139–142. [Google Scholar] [CrossRef]
- Whitman, R.; Harwood, V.J.; Edge, T.A.; Nevers, M.; Byappanahalli, M.; Vijayavel, K.; Brandao, J.; Sadowsky, M.J.; Alm, E.W.; Crowe, A.; et al. Microbes in beach sands: Integrating environment, ecology and public health. Rev. Environ. Sci. Biotechnol. 2014, 13, 329–368. [Google Scholar] [CrossRef] [PubMed]
- Green, H.C.; Shanks, O.C.; Sivaganesan, M.; Haugland, R.A.; Field, K.G. Differential decay of human faecal bacteroides in marine and freshwater. Environ. Microbiol. 2011, 13, 3235–3249. [Google Scholar] [CrossRef] [PubMed]
- Korajkic, A.; McMinn, B.R.; Harwood, V.J.; Shanks, O.C.; Fout, G.S.; Ashbolt, N.J. Differential decay of enterococci and Escherichia coli originating from two fecal pollution sources. Appl. Environ. Microbiol. 2013, 79, 2488–2492. [Google Scholar] [CrossRef] [PubMed]
- Jeanneau, L.; Solecki, O.; Wery, N.; Jarde, E.; Gourmelon, M.; Communal, P.Y.; Jadas-Hecart, A.; Caprais, M.P.; Gruau, G.; Pourcher, A.M. Relative decay of fecal indicator bacteria and human-associated markers: A microcosm study simulating wastewater input into seawater and freshwater. Environ. Sci. Technol. 2012, 46, 2375–2382. [Google Scholar] [CrossRef] [PubMed]
- Nayak, B.; Weidhaas, J.; Harwood, V.J. LA35 poultry fecal marker persistence is correlated with that of indicators and pathogens in environmental waters. Appl. Environ. Microbiol. 2015, 81, 4616–4625. [Google Scholar] [CrossRef]
- Hurst, C.J.; Gerba, C.P. Stability of simian rotavirus in fresh and estuarine water. Appl. Environ. Microbiol. 1980, 39, 1–5. [Google Scholar]
- Lo, S.; Gilbert, J.; Hetrick, F. Stability of human enteroviruses in estuarine and marine waters. Appl. Environ. Microbiol. 1976, 32, 245–249. [Google Scholar]
- Fayer, R.; Graczyk, T.K.; Lewis, E.J.; Trout, J.M.; Farley, C.A. Survival of infectious cryptosporidium parvum oocysts in seawater and eastern oysters (Crassostrea virginica) in the chesapeake bay. Appl. Environ. Microbiol. 1998, 64, 1070–1074. [Google Scholar]
- Korajkic, A.; McMinn, B.R.; Ashbolt, N.J.; Sivaganesan, M.; Harwood, V.J.; Shanks, O.C. Extended persistence of general and cattle-associated fecal indicators in marine and freshwater environment. Sci. Total Environ. 2019, 65, 1292–1302. [Google Scholar] [CrossRef]
- Perkins, T.L.; Perrow, K.; Rajko-Nenow, P.; Jago, C.F.; Jones, D.L.; Malham, S.K.; McDonald, J.E. Decay rates of faecal indicator bacteria from sewage and ovine faeces in brackish and freshwater microcosms with contrasting suspended particulate matter concentrations. Sci. Total Environ. 2016, 572, 1645–1652. [Google Scholar] [CrossRef]
- Curtis, K.; Michael Trapp, J. Examining the colonization and survival of E. coli from varying host sources in drainage basin sediments and stormwater. Arch. Environ. Contam. Toxicol. 2016, 71, 183–197. [Google Scholar] [CrossRef] [PubMed]
- Cloutier, D.D.; McLellan, S.L. Distribution and differential survival of traditional and alternative indicators of fecal pollution at freshwater beaches. Appl. Environ. Microbiol. 2017, 83, e02881-16. [Google Scholar] [CrossRef] [PubMed]
- Anderson, K.L.; Whitlock, J.E.; Harwood, V.J. Persistence and differential survival of fecal indicator bacteria in subtropical waters and sediments. Appl. Environ. Microbiol. 2005, 71, 3041–3048. [Google Scholar] [CrossRef] [PubMed]
- Jenkins, M.B.; Fisher, D.S.; Endale, D.M.; Adams, P. Comparative die-off of Escherichia coli O157:H7 and fecal indicator bacteria in pond water. Environ. Sci. Technol. 2011, 45, 1853–1858. [Google Scholar] [CrossRef] [PubMed]
- Wanjugi, P.; Harwood, V.J. The influence of predation and competition on the survival of commensal and pathogenic fecal bacteria in aquatic habitats. Environ. Microbiol. 2013, 15, 517–526. [Google Scholar] [CrossRef] [PubMed]


| Indicator(s) 1 | Pathogen(s) 1 | Location | Relationship 2 | Comments | Reference |
|---|---|---|---|---|---|
| E. colia | V. choleraeb, Salmonella spp. b, Shigella spp. b | Apies River and tributaries, South Africa | NR | All three pathogens frequently co-detected. Concentrations of E. coli and pathogens higher during wet season. | [35] |
| E. colia | Cryptosporidium and Giardia (oo)cysts c | Sure River and tributaries, Luxembourg | Cryptosporidium and Giardia oo(cysts) correlated with each other and with E. coli. | Cryptosporidium and Giardia oo(cysts) frequently co-detected. Concentrations highest during the wet season. | [53] |
| E. colid | M. aviumd, P. aeruginosad, Salmonella spp. d | “Aohai See” Lake, China | No significant correlation. | All three pathogens frequently co-detected. Different seasonal patterns observed for E. coli and all three pathogens. | [66] |
| E. colie | Campylobacter spp. a, Giardia and Cryptosporidium (oo)cysts c | Avon River, New Zealand | E. coli strongly correlated with the all three pathogens. | All three pathogens frequently detected in samples where E. coli > 550 CFU. Higher concentrations of all pathogens found in samples during a large sewage discharge due to earthquake. | [54] |
| E. colia | Giardia and Cryptosporidium (oo)cysts c | Canals connecting Rapipat and Rangsit canals, Thailand | NR | Highest levels of FIB and pathogens found in the most populated area. | [36] |
| E. colie,d, enterococci e,d | Cryptosporidium and Giardia (oo)cysts c | Chicago area waterways system, various rivers and lakes, USA states | Stronger correlations between FIB and Giardia spp. than Cryptosporidium spp. | Correlations generally stronger in samples not impacted by the wastewater effluent. Associations between pathogens and enterococci generally stronger than with E. coli | [55] |
| Fecal coliforms e, E. coli e and enterococci e | Pathogenic E. coli b | St Joseph River and Galien River watersheds in Michigan and Indiana, USA | No significant correlation. | Two or more virulence genes frequently co-detected. Samples with lower FIB levels, typically had a lower proportion of virulence genes. | [67] |
| E. colie, enterococci e | Pathogenic E. coli b, Cryptosporidium and Giardia (oo)cysts c | Various streams in Pennsylvania, USA | FIB correlated with all pathogens. | Samples exceeding recreational water quality guidelines more likely to contain pathogenic E. coli genes but not Cryptosporidium and Giardia (oo)cysts. Affected by non-point source and run-off following snow melt and rain events as well. | [56] |
| E. colid | S. entericad, Aeromonas spp. d, M. avium d, P. aeruginosa d | Ao, Hong and Tao lakes in Beijing, China | No significant correlation. | E. coli and Aeromonas spp. co-detected in all samples. Higher concentrations of E. coli and pathogens in particle attached fraction of the sample. | [68] |
| Total coliforms a, E. colia, enterococci a | P. aeruginosaa | Sauce Grande lagoon, Argentina | NR | Pseudomonas aeruginosa was co-detected with all FIB in all samples. All FIB positively correlated with temperature. | [37] |
| Total coliforms a, fecal coliforms a | Human enteroviruses b, adenoviruses b | Altamaha River, USA | No significant correlation. | Viruses co-detected in 26% of samples. Presence of viruses directly related to dissolved oxygen and streamflow, but inversely related to temperature, rainfall in the last 30 days. | [69] |
| Total coliforms a, fecal coliforms a, E. coli a, enterococci e | Salmonella spp. b, S. aureus b | Msunduzi River, South Africa | NR | Presence of Salmonella spp., Staphylococcus aureus and enterococci frequently coincided with fecal coliform and E. coli levels above 1000 MPN/100 mL. Salmonella spp. not detected in drier, colder months when fecal coliform and E. coli levels were below 1000 MPN/100 mL. | [38] |
| Fecal coliforms e, E. colie, enterococci e | Pathogenic E. coli b | Various rivers in Georgia, Kansas, Michigan, North Carolina, New Jersey, Ohio, South Dakota, Tennessee, Texas and Virginia, USA | Only eaeA gene positively correlated with FIB. | Multiple pathogenic genes co-detected in samples meeting and exceeding FIB guidelines. Some pathogenic genes also detected in three samples that met FIB guidelines. All sites known to be impacted by human fecal pollution and agricultural operations (upstream). | [57] |
| Enterococci e | Campylobacter spp. d | Various ponds, rivers and creeks in Florida, USA | No significant correlation. | Enterococci and Campylobacter spp. frequently co-detected, but enterococci were also detected in samples negative for Campylobacter. Florida DOH guidelines would not indicate Campylobacter spp. presence. | [70] |
| Fecal coliforms e, enterococci e | Infectious enteroviruses a, total enteroviruses d, hepatitis A d, Norwalk I and II d, astroviruses d, rotaviruses d | Rivers in France | NR | Infectious enteroviruses were not detected in samples with elevated fecal coliforms concentrations. Fecal coliforms, but not enterococci fluctuated seasonally. | [39] |
| Total coliforms e | Legionella spp. d | Hot spring recreational facilities, Taiwan | NR | Most samples failed to meet Taiwan CDC guidelines of 0 total coliforms per 100 mL. No Legionella spp. detected in two samples that met Taiwan CDC coliform guidelines. | [40] |
| E. colia | Pathogenic E. coli d, Shigella spp. d, Salmonella spp. d, C. jejuni d, L. pneumophila d, L. monocytogenes d, V. cholerae d, and V. parahaemolyticus d | Various streams around Lake Miyajimanuma, Japan | No significant correlation. | Various pathogen genes frequently co-detected. Temporal variation in pathogen concentration was observed with higher levels detected in colder months and when geese were present (not significant). | [71] |
| E. colid | Human adenovirus d, Giardia and Cryptosporidium (oo)cystsc | Rivers in France | NR | Highest concentration of adenovirus found at two urban sites. Generally higher concentration of Giardia compared to Cryptosporidium. | [41] |
| Total coliforms e | Acanthamoeba spp. b,d, Naegleria spp. b,d, Legionella spp. b,d | Puzih River and two hot springs recreational facilities, Taiwan | Acanthamoeba spp. and Legionella spp. significantly associated with total coliforms in hot spring samples but not river. No significant correlation for Naegleria spp. | Legionella detection was significantly correlated with water temperature and more likely in the presence of Vermamoeba vermiformis. | [58] |
| E. colia, enterococci a | Human adenoviruses b,d, noroviruses GII b, and enteroviruses b | Danube, Berettyo, Koros and Tisza Rivers and two rivulets (Koloska and Keki), Hungary | NR | In ~1/3 of samples at least two viral targets were co-detected. ~42%, 12% and 14% of designated recreational waters contained adenoviruses, enteroviruses and noroviruses. | [42] |
| E. colia, enterococci e | Salmonella spp. b | Transitional and inland waters, Portugal | Significant correlation commonly observed in waters classified as “poor” and “sufficient” but also seen in waters classified as “good” or “excellent” | Higher geometric mean of FIB in Salmonella spp. positive samples than in Salmonella spp. negative samples. Even though significant correlation was reported, Salmonella was also detected in water samples with “good” and “excellent” water quality. | [59] |
| Total coliforms e, E. coli e | Pathogenic E. coli b | Sauce Chico River, El Belisario Stream and San Bernardo Stream, Argentina | NR | Shiga-toxin producing E. coli found in samples where E. coli counts generally exceeded or were close to the US EPA recommended limits. High E. coli counts correlated with rainy season. | [43] |
| Total coliforms a, fecal coliforms e | Rotavirus b, human Adenovirus b, human Astrovirus b, Norovirus b | Rivers and streams, Brazil | No significant correlation. | Rotaviruses detected most frequently, followed by adenoviruses. The majority of samples exceeded recommendations for recreational waters from the standard methods used for the examination of water and wastewater of 5000 and 1000 MPN per 100 mL for total and fecal coliforms. | [73] |
| E. colie, enterococci e | Pseudomonas spp. e | Lake Ma Vallee, Democratic Republic of Congo | NR | Samples met European Directive 2006/7/CE for E. coli and enterococci. Pseudomonas spp. detected at only one site which coincidentally had the highest E. coli and enterococci concentrations. | [44] |
| E. colia | Pathogenic E. coli d, C. jejuni d, Shigella spp. d, Salmonella spp. d | Michigan, Superior, Huron and Erie lakes, USA | Beach seasonal mean C, jejuni abundance correlated with beach seasonal E. coli concentration and at one beach pathogenic E. coli abundance was positively correlated with daily E. coli concentrations | High degree of beach specific temporal variability in pathogenic gene concentrations. | [60] |
| Fecal coliforms a | Pathogenic E. coli b, Shigella spp. b and Salmonella spp. b | La Paz River basin, Bolivia | The occurrence of pathogenic bacteria associated with fecal coliform densities. | Approximately 50% of pathogenic bacteria resistant to at least two antibiotics. Pathogens were frequently detected during rainy season at sites impacted by anthropogenic activities. | [61] |
| E. colia, enterococci a, fecal coliforms a | Cryptosporidium spp. c, Salmonella spp. b, Campylobacter spp. a | Lake Parramatta, Australia | NR | Only Salmonella spp., detected sporadically in waters with relatively low FIB concentrations. FIB concentration higher during wet weather. | [45] |
| E. colie | Campylobacter spp. d, Legionella spp. d, adenovirus d, Cryptosporidium spp. d | River, lake ponds and a wadi in Netherlands | NR | Campylobacter spp. detected in all samples, Cryptosporidium spp. never detected, other pathogens detected sporadically. | [46] |
| Fecal coliforms e, E. colie, enterococci e | Campylobacter spp. b, Salmonella spp. b, E. coli O157:H7 d, Cryptosporidium and Giardia (oo)cysts c, astroviruses b, hepatitis A b and E b viruses, rotavirus b, norovirus b, enterovirus b | Canals and lakes, Netherlands | NR | Arboviruses, hepatitis A and E viruses and E. coli O157:H7 were not detected in any of the samples. Rotavirus, norovirus, enterovirus Salmonella and Campylobacter spp. detected sporadically. Infectious enteroviruses found in one sample. Low concentration of Cryptosporidium and Giardia (oo)cysts detected in samples that complied with the European bathing water legislation. | [47] |
| Total coliforms e | L. pneumophilad | Puzih River and hot spring recreational areas, Taiwan | Total coliforms and L. pneumophila significantly correlated. | L. pneumophila detected in > 90% of samples. L. pneumophila and total coliforms also correlated with turbidity. | [62] |
| E. colie, enterococci e | Shiga toxin genes d | Lake Erie and tributaries, USA | No significant correlation. | Abundance and distributions of shiga-toxin genes highly variable. The majority of samples positive for shiga toxin genes were below the advisory threshold levels for E. coli and enterococci. | [74] |
| E. colie, enterococci e, fecal coliforms e | Cryptosporidium and Giardia (oo)cysts c, infectious enteroviruses a, Salmonella spp a | Lake Carroll, Tampa, FL | NR | Higher concentrations of indicators and more frequent pathogen detection following rain events. | [48] |
| E. colie | Human adenovirus d, human enterovirus d, Norovirus GI and GII d | Delaware Lake, Madison Lake and East Fork Lake, USA | No significant correlation. | Adenoviruses detected more frequently than enteroviruses, followed by noroviruses. Human adenovirus and enterovirus correlated. | [72] |
| E. colia, total coliforms a, enterococci e | Campylobacter spp. a, Salmonella spp. a, P. aeruginosa a, Cryptosporidium and Giardia (oo)cysts c, Aeromonas spp. e | River Ruhr and barrier lakes, Germany | NR | All sampling sites achieved “sufficient” bathing water quality for enterococci but not E. coli. With the exception of Aeromonas spp., detection of all other pathogens was sporadic. Precipitation preceding sampling event resulted in elevated concentration of total coliforms, E. coli, enterococci, Aeromonas spp. and Cryptosporidium and Giardia (oo)cysts. | [49] |
| E. colie, enterococci e | Pseudomonas spp. e, Norovirus d | Geothermal pools, Iceland | NR | High concentrations of Pseudomonas spp. detected in samples that also contained high FIB counts. Norovirus was not detected. | [50] |
| E. colid, enterococci d | S. aureusd, Salmonella spp. d, noroviruses d | Prickett Creek, USA | NR | No correlation between E. coli and enterococci. | [51] |
| Total coliforms e, fecal coliforms e, E. coli e, enterococci e | L. monocytogenesb, Salmonella spp. b, E. coli O157:H7 b, Campylobacter spp. b, Cryptosporidium and Giardia (oo)cysts c | South Nation River basin, Canada | Weak relationships, but mostly positive (except L. monocytogenes). | The fraction of samples that contained an indicator when pathogen was detected was highest for the protozoan parasites. Relationships dependent on season and site. | [63] |
| E. colia, enterococci a | Human adenoviruses b | Various rivers and lakes in France, Germany, Italy, Netherlands, Poland, United Kingdom | Concentrations of all indicators correlated with frequency of adenovirus detection. | > 50% of samples positive for adenovirus.E. coli concentrations higher than enterococci. | [64] |
| E. colia, enterococci a | Adenoviruses d,f, norovirus GI b and GII b | Various rivers and lakes in France, Germany, Italy, Netherlands, Poland, United Kingdom | NR | Both viruses frequently detected in samples that met “good” water quality guidelines for both E. coli and enterococci. Adenoviruses detected more frequently than noroviruses. | [52] |
| Total coliforms a, fecal coliforms a, E. coli a, enterococci e | Salmonella spp. f, pathogenic E. coli f, Cryptosporidium and Giardia (oo)cysts c | Wanzhou watershed, China | Significant but weak correlations between indicators and Salmonella spp. and pathogenic E. coli. | Cryptosporidium and Giardia (oo)cysts detected in samples with low indicator concentrations. Concentrations of indicators influenced by rainfall. | [65] |
| Total coliforms a | Cryptosporidium and Giardia (oo)cysts c | Lake Tianjin, China | No significant correlation | Significant correlation between Cryptosporidium and Giardia (oocysts). Giardia detected more frequently. | [75] |
| Indicator(s) 1 | Pathogen(s) 1 | Location | Relationship 2 | Comments | Reference |
|---|---|---|---|---|---|
| Fecal coliforms e, E. coli e, enterococci a,d,e | V. vulnificusb, S. aureuse, enterovirus d, norovirus d, hepatitis A virus d, Cryptosporidium and Giardia (oo)cysts c | Virginia Key Beach, Florida, USA | NR | When HPyV, V. vulnificus, and Giardia spp. were detected so were all indicators and alternative indicators. When FIB levels exceeded regulatory standards, HPyVs and pathogens also detected. | [77] |
| Fecal coliforms e, E. coli e, enterococci d,e | V. vulnificusb, S. aureuse, enterovirus d, norovirus d, hepatitis A virus d, Cryptosporidium and Giardia (oo)cysts c | Coastal Beaches, Miami Dade County, Florida, USA | NR | When enterococci levels by qPCR and CS exceeded MDL, Cryptospordium, Giardia, enteroviruses and V. vulnificus were co-detected. | [76] |
| Enterococci e | Cryptosporidium and Giardia (oo)cysts c | Coastal beaches, Venezuela | No significant correlation. | Presence of Cryptosporidium and Giardia were significantly correlated. | [88] |
| E. coli e, enterococci e | C. albicansb, Salmonella spp. b | Saronicos Gulf, Athens, Greece | Enterococci but not E. coli correlated with Salmonella spp., but not C. albicans. | Pathogens detected in waters of “good” and “excellent” quality. | [96] |
| Total coliforms a, fecal coliforms a | Salmonella spp. b | Canals around Galveston Bay, TX, USA | NR | Salmonella spp. detection occurred (nearly 100%) when FC concentrations >2000/100 mL. | [78] |
| Enterococci a | C. parvumc, G. lambliac, G. duodenaliscE. bieneusic | Maryland, US Chesapeake Bay, USA | C. parvum, G. duodenalis and E. bieneusi correlated with enterococci counts. | Correlations observed especially apparent with high bather numbers in water. | [97] |
| Enterococci a,d, E. coli a,d, fecal coliforms a, total coliforms a | L. pneumophilab, S. aureusb, MRSA b, adenovirus b, enterovirus d, Hepatitis A d, Norovirus d | Malibu beach, California USA | NR | No indicator used had a significant correlation with GI illness in swimmers or any reference pathogen. | [79] |
| Enterococci e | Campylobacter spp. d, | Florida, Quietwater Beach, USA | No significant correlation. | Enterococci co-detected with pathogenic Campylobacter spp., but levels of enterococci were not indicative of levels of Campylobacter present. | [70] |
| E. colia, enterococci a | Salmonella spp. b, Campylobacter spp. a, Cryptosporidium and Giardia (oo)cysts c, adenoviruses a enteroviruses a | Estuaries, Melbourne Australia | No significant correlation. | Changes in FIB concentrations associated with changes in temperature, flow, humidity and rainfall. | [89] |
| Total coliforms e, fecal coliforms e, E. coli e, enterococci e | Adenoviruses a | Southern California coastal waters, USA | No significant correlation. | 5 of 12 sites, FIB exceeded CA recreational water quality limits. | [90] |
| Total coliforms e, fecal coliforms e, enterococci e | Adenoviruses b, enteroviruses b, hepatitis A b | Rivers and creeks in California, USA | No significant correlation. | FIB and viral pathogen detection associated with storm events. Total and fecal coliforms correlated with each other but not enterococci. | [91] |
| Total coliforms a, fecal coliforms a, enterococci a | Enterovirus b, adenoviruses b | Newport Bay, California, USA | No significant correlation | FIB concentrations showed strong seasonal pattern, associated with winter storms Total and fecal coliforms correlated with each other but not enterococci. | [92] |
| Fecal coliforms e, E. coli e, enterococci e | Salmonella spp. b, enteric viruses b | Ben T. Davis and Bahia beaches, Florida, USA | NR | Salmonella spp. not detected. Coxsackie B4 detected following major sewage spill FIB correlated with rainfall. | [80] |
| Fecal coliforms e, enterococci e | Cryptosporidium and Giardia (oo)cysts c enteroviruses a | Sarasota Bay, Florida, USA | NR | FIB co-detected with all samples positive for enteric pathogens. | [81] |
| E. colie, enterococci e | Salmonella spp. e | Coastal Waters, Portugal | Levels of FIB correlated with presence of Salmonella spp., especially in waters deemed “poor” or “sufficient” compared to “excellent”. | Salmonella spp. also detected in samples classified as “Good” or “Excellent”. | [59] |
| Fecal coliforms e E. coli e, enterococci e | Adenovirus b | Hillsborough River and St. Johns River, Florida, USA | Presence of adenovirus strongly correlated with concentrations of all three FIB. | Samples collected in waters with known human fecal pollution, all FIB exceeded regulatory standards. | [98] |
| E. colie, fecal coliforms e, enterococci e | Adenovirus b | Hillsborough River, FL Tampa Bay Beach, Florida, USA | E. coli, enterococci and fecal coliforms correlated with adenovirus. | All FIB concentrations exceeded regulatory standards in samples. | [99] |
| Enterococci e, fecal coliforms e, total coliforms e, E. coli e | Adenovirus b | Avalon and Doheny Beaches, California | No significant correlation. | FIB concentrations frequently exceeded recreational water quality guidelines. Adenoviruses frequently detected at Doheny beach, but not Avalon. | [93] |
| Total coliforms e, fecal coliforms e, enterococci e, E. coli e | Enteroviruses e | Coastal beaches, Barcelona, Spain | NR | All samples with elevated FIB levels also had high levels of somatic and F-specific phage present. 55% of samples having infectious virus beach quality was within EU standards for levels of FIB. | [82] |
| Enterococci e, fecal coliforms a, E. coli a, total coliforms a | Enterovirus a, Cryptosporidium and Giardia (oo)cysts c | St. Lucie Estuary, Florida, USA | No significant correlation. | Viruses detected in samples where FIB levels were within regulatory limits. | [94] |
| Enterococci a,d | Adenovirus b, Norovirus d, Cryptosporidium and Giardia (oo)cysts c, C. jejuni, Salmonella spp. b, S. aureus b, E. coli 0157-H7 b | Coastal beaches, Florida, USA | NR | FIB and pathogens co-detected Seawater samples taken near sewage discharges. | [83] |
| Enterococci e | V. vulnificuse, V. parahaemolyticuse | Chesapeake, Bay, MD, USA | NR | Enterococci were co-detected with V. vulnificus and V. parahaemolyticus. | [84] |
| Enterococci e | V. vulnificuse, V. parahaemolyticuse | Chesapeake, Bay MD, USA | NR | Enterococci were co-detected with V. vulnificus and V. parahaemolyticus. All V. vulnificus isolates susceptible to 14 of 26 antibiotics and V. parahaemolyticus to 11 of 26 antibiotics. All samples positive for enterococci and Vibrio spp. and within local recreational water quality guidelines. | [85] |
| Total coliforms e, fecal coliforms e, E. coli e, enterococci e | Hepatitis A b, Norovirus GI b | Coastal beaches, Lisbon, Portugal | No significant correlation. | All samples considered “good” quality based on local recreational water quality guidelines. | [95] |
| Enterococci a,e | S. aureuse | Coastal beaches, Miami, Florida, USA | NR | S. aureus was found in 37% of total samples, 1.1% positive for MRSA. Enterococci had a positive correlation with reports of skin illness. | [86] |
| E.colie, enterococci e | Salmonella spp. a, Campylobacter spp. a, S. aureus e, V. vulnificus e, V. parahaemolyticus e | Hawaii streams, USA | Salmonella, Campylobacter and C. jejuni positively associated with enterococci and marginally associated with S. aureus. V. vulnificus was positively associated with all FIB, V. parahaemolyticus with E. coli. | Detection of at least one pathogens occurred in 21 of 22 streams tested. | [100] |
| Fecal coliforms e, enterococci e | Enteroviruses b | Florida Keys, Florida, USA | NR | Enterovirus co-detected with fecal coliforms, enterococci. No sites in violation of water quality standards. | [87] |
| E. colia, enterococci a | Human Adenovirus b | Coastal beaches in Cyprus, Italy, Portugal, Spain and United Kingdom | No significant correlation. | FIB levels significantly lower in seawater than in freshwater samples. | [64] |
| E. colie, enterococci e | Human adenovirus b norovirus b GI and GII | Coastal beaches in Cyprus, Italy, Portugal, Spain and United Kingdom | NR | Beaches considered “clean” based on FIB levels were positive for both adenovirus and noroviruses. Freshwater sites had higher frequency of virus detection than marine sites. | [52] |
| Indicator(s) 1 | Pathogen(s) 1 | Location | Relationship 2 | Comments | Reference |
|---|---|---|---|---|---|
| Freshwater | |||||
| C. perfringense, F-RNA coliphage e | Campylobacter spp. a, Giardia and Cryptosporidium (oo)cysts c | Avon River, Christchurch, New Zealand | F-RNA more strongly correlated with all three pathogens than C. perfringens. | F-RNA concentrations typically higher than C. perfringens. Study conducted in river affected by sewage discharge. | [54] |
| Somatic coliphage e | Infectious enteroviruses a, total enteroviruses d, hepatitis Ad, Norwalk I and II d, astroviruses d, rotaviruses d | Rivers in France | No significant correlation. | Enterovirus genomes and somatic coliphage frequently co-detected. Infectious enteroviruses and hepatitis A, Norwalk I and II, astroviruses, rotaviruses detected in only one or two samples. | [39] |
| C. perfringense | Human adenovirus d, Giardia and Cryptosporidium (oo)cysts c | Rivers in France | NR | Highest concentration of protozoan parasites and C. perfringens found at the site with high proportion of agricultural operations, forests and semi-natural environments. | [41] |
| Somatic and F+ coliphage e | Noroviruses f, rotaviruses f, infectious reoviruses and enteroviruses a | Maas and Waal Rivers, Netherlands | NR | Both coliphages and all viruses co-detected in all samples. Coliphage concentrations higher than pathogenic virus concentrations. | [102] |
| Somatic and F+ coliphage e | Noroviruses d, adenoviruses d, astroviruses d, rotaviruses d | Marine Reservoir and tributaries, Singapore | F+ coliphage positively correlated with norovirus concentrations. | Higher statistical correlation observed between enteric viruses than between enteric viruses and coliphages. Noroviruses most abundant, followed by rotaviruses. Wet weather concentration of coliphage and viruses higher than dry weather concentration, but difference is not statistically significant. | [103] |
| C. perfringense | Cryptosporidium spp. c, Salmonella spp. b, Campylobacter spp. a | Lake Parramatta, Australia | NR | No Cryptosporidium detected which coincided with the low C. perfringens concentrations. C. perfringens concentration lower than FIB. | [45] |
| Somatic and F+ coliphages e | Campylobacter spp. a, Salmonella spp. b, E. coli O157:H7 d, Cryptosporidium and Giardia (oo)cysts c, astroviruses b, hepatitis A and E viruses b, rotavirus b, norovirus b, enterovirus a | Canals and lakes, Netherlands | NR | Somatic coliphage detected more frequently and at higher concentrations compared to F+ coliphage. Highest concentrations of bacteriophages occurred following a heavy rainfall. | [47] |
| C. perfringense | Campylobacter spp. a, Salmonella spp. a, P. aeruginosaa, Cryptosporidium and Giardia (oo)cysts c, Aeromonas spp. e | River Ruhr and barrier lakes, Germany | NR | Concentrations typically lower and less variable compared to the FIB. No association with precipitation. | [49] |
| C. perfringense | L. monocytogenesb, Salmonella spp. b, E. coli O157:H7 b, Campylobacter spp. b, Cryptosporidium and Giardia (oo)cysts c | South Nation River basin, Canada | Positive, but weak relationships with pathogens. | Correlations with FIB were also weak but positive. | [63] |
| Somatic coliphage e | Human adenoviruses b | Various rivers and lakes in France, Germany, Italy, Netherlands, Poland, United Kingdom | Concentrations of somatic coliphage correlated with frequency of adenovirus detection. | FIB showed better correlation with adenovirus than somatic coliphage. Somatic coliphage concentrations comparable to E. coli concentrations. | [64] |
| Marine, and brackish waters | |||||
| C. perfringense | V. vulnificusb, S. aureuse, enterovirus d, norovirus d, hepatitis A virus d, Cryptosporidium and Giardia (oo)cysts c | Virginia Key Beach, Florida, USA | NR | Higher concentrations in high tide samples as opposed to low tide. Not correlated with FIB. | [77] |
| C. perfringense, F+ coliphage e | V. vulnificusb, S. aureuse, enterovirus d, norovirus d, hepatitis A virus d, Cryptosporidium and Giardia (oo)cysts c | Coastal Beaches, Miami Dade County, Florida, USA | NR | High levels of C. perfringens also signaled high levels of all FIB. | [76] |
| C. perfringensa | Cryptosporidium and Giardia (oo)cysts c | Coastal beaches, Venezuela | No significant correlation. | Detection of C. perfringens coincided with human-associated MST markers. | [88] |
| F+ coliphage e | L. pneumophilab, S. aureusb, MRSA b, adenovirus b, enterovirus d, Hepatitis A d, Norovirus d | Malibu beach, California USA | F+ coliphage had strong association with MRSA and S. aureus presence. | F+ coliphage had strong association with GI illness. | [79] |
| C. perfringense and F+ coliphage e | Salmonella spp. b, Campylobacter spp. a, Cryptosporidium and Giardia (oo)cysts c, adenoviruses a, enteroviruses a | Docklands, South Yarra and Abbotsford estuaries, Melbourne Australia | NR | Positive correlation between the presence of C. perfringens and F+ coliphage. | [89] |
| Somatic e and F+ coliphage e | Adenoviruses a | Southern California coastal waters, USA | Presence of adenovirus was significantly correlated with F-specific coliphage. | No correlation between two coliphage types. | [90] |
| Somatic e and F+ coliphage e | Adenoviruses b, enteroviruses b, hepatitis A b | Rivers and creeks in California, USA | No significant correlation. | Somatic coliphages detected more frequently than F+. Somatic coliphage were not correlated with total coliforms, but F+ coliphage were positively correlated with total/fecal coliforms but not enterococci. | [91] |
| F+ coliphage a | Enterovirus b, adenoviruses b | Newport Bay, California, USA | No significant correlation. | Peak concentrations of FIB and F+ coliphage associated with winter storms. | [92] |
| C. perfringense and coliphage e | Cryptosporidium and Giardia (oo)cysts c, enteroviruses a | Sarasota Bay, Florida, USA | NR | Alternative indicators for co-detected in samples positive for enteric pathogens. Coliphage levels were significantly influenced by salinity and turbidity. | [81] |
| Somatic e and F+ coliphage e, phages infecting Bacteroides thetaiotaomicron GA17 e | Enteroviruses e | Coastal Waters, Portugal | NR | Enteroviruses were co-detected with FIB. Genogroup I and II F-specific RNA more common in samples the others. Densities of somatic coliphage were higher than FIB densities and did not correlate with them. | [82] |
| Somatic e and F+ coliphage e | Enterovirusa, Cryptosporidium and Giardia (oo)cysts c | St. Lucie Estuary, Florida, USA | No significant correlation. | Somatic coliphage concentrations higher than F+ coliphage. Somatic coliphage correlated with the total coliform concentrations. | [94] |
| C. perfringense and F+ coliphage e | Salmonella spp. a, Campylobacter spp. a, S. aureus e, V. vulnificus e, V. parahaemolyticus e | Hawaii streams, USA | C. perfringens was marginally associated with Campylobacter spp. and V. parahaemolyticus. | Concentrations of C. perfringens and F+ coliphage comparable. | [100] |
| C. perfringense, F+ coliphage e | Enteroviruses b | Florida Keys, Florida, USA | NR | Enteroviruses co-detected with C. perfringens and coliphage. | [87] |
| Somatic coliphage e | Human Adenovirus b | Coastal beaches in Cyprus, Italy, Portugal, Spain and United Kingdom | No significant correlation. | Somatic coliphage concentrations lower than FIB. | [64] |
| MST marker 1 | Pathogens 1 | Location | Relationship 2 | Comments | Reference |
|---|---|---|---|---|---|
| Freshwater | |||||
| espa, LTIIa a, STII a | Pathogenic E. coli spp. a, Cryptosporidium and Giardia (oo)cysts b | Various streams in Pennsylvania, USA | No significant correlation. | All MST markers detected more frequently in samples exceeding recreational water quality guidelines. | [56] |
| espa | Pathogenic E. coli spp. a | Various rivers in Georgia, Kansas, Michigan, North Carolina, New Jersey, Ohio, South Dakota, Tennessee, Texas and Virginia, USA | No significant correlation. | esp was present in nine samples that met exceeding recreational water quality guidelines. | [57] |
| HPyV a, nifH a, HF183 a | Campylobacter spp. c | Various ponds, rivers and creeks in Florida, USA | No significant correlation. | Campylobacter and MST markers co-detected at only one site. HPyV and nifH were not detected during the study. | [70] |
| gyrBc, g-Bfrac | Human adenovirus c, human enterovirus c, Norovirus GI and GII c, porcine sapovirus c | Delaware Lake, Madison Lake and East Fork Lake, USA | No significant correlation. | g-Bfra detected more frequently and at higher concentrations than gyrB. gyrB and g-Bfra frequently correlated. | [72] |
| esp a, HPyV a, HF183 a | Cryptosporidium and Giardia (oo)cysts b, infectious enteroviruses d, Salmonella spp. d | Lake Carroll, Tampa, FL | No significant correlation. | Higher concentrations of indicators and more frequent pathogen detection following rain events. esp, but not HPyV or HF183 correlated with FIB (E. coli, enterococci, fecal coliforms). | [48] |
| Bac32F a, CF128 a, CF193 a, HF134 a, HF183 a, PF163 a | E. coli O157:H7 a, Salmonella spp. a, Campylobacter spp. a | Little Bow and Oldman Rivers, Canada | Positive relationship between detection of Bac32F and all pathogens. Positive relationship between CF128/193 and E. coli O157:H7 and Salmonella spp. Positive relationship between HF183/134 and Campylobacter spp.. | Bac32F detected most frequently, followed by CF128/193, PF163 and HF183/134 Pathogens were detected infrequently with Campylobacter spp. most commonly detected. Water impacted by agricultural operations. | [106] |
| HPyV c, HF183 c, AllBac c | S. aureusc, Salmonella spp. c, noroviruses c | Prickett Creek, USA | NR | Salmonella spp. were most frequently detected pathogen. | [51] |
| espa | Infectious enteric viruses a | Lake Michigan, USA | NR | Precipitation and turbidity positively correlated with viruses. | [105] |
| Marine and brackish waters | |||||
| HPyV a, esp a | V. vulnificusc, S. aureusc, enterovirus c, norovirus c, hepatitis A c virus, Cryptosporidium and Giardia (oo)cysts b | Virginia Key Beach, Florida, USA | NR | HPyV, V. vulnificus, Giardia spp. were co-detected with all FIB and alternative indicators. When FIB levels exceeded regulatory standards, HPyVs and pathogens also detected. | [77] |
| HPyV a, esp a, Bacteroides thetaiotaomicron a, BacHum-UCD a and DogBac a | V. vulnificusc, S. aureusc, enterovirus c, norovirus c, hepatitis A c virus, Cryptosporidium and Giardia (oo)cysts b | Coastal Beaches, Miami Dade County, Florida, USA | NR | During rain event, DogBac was co-detected with Cryptospordium, Giardia, enteroviruses and V. vulnificus along with enterococci. | [76] |
| HF183 c, C. coccoides c | Cryptosporidium and Giardia (oo)cysts b | Coastal beaches, Venezuela | NR | The levels of (oo) cysts varied with the extent of sewage pollution and bather density. HF183 and C. coccoides correlated with C. perfringens. | [88] |
| GenBac3 c, HF183 a,c, BacHum-UCD c, B. dorei a,c, HumM2 c, HF134 a, HumM19 a, B. stericoris a, B. uniformis c, nifH a,c, esp c, HPyV a,c, Gull Bacteroides a, C. marimammalium c, BacCow-UCD c, BacCan-UCD c | L. pneumophilaa, S. aureusa, MRSA a, pathogenic E. coli a, adenovirus a, enterovirus c, Hepatitis A c, Norovirus a | Malibu beach, California USA | NR | Human-associated MST markers were only predictive of illness at the site known to be impacted by human sewage from faulty infrastructure. | [79] |
| HPyV a, nifH a, HF183 a | Campylobacter spp. c | Quietwater Beach, Florida, USA | No significant correlation. | In some instances, MST markers were co-detected with Campylobacter especially following rain events. | [70] |
| espa, HPyV a | Salmonella spp. a, enteric viruses d | Ben T. Davis and Bahia beaches, Florida, USA | NR | Coxsackie virus B4 and HPyVs were co-detected following a major sewage spill. Fecal coliform concentrations correlated with the esp marker HPyV did not correlate with FIB. | [80] |
| HPyV c, HF183 c, nifH a | Adenovirus a | Hillsborough River and St. Johns River, Florida, USA | No significant correlation with HPyV, NR for HF183, nifH. | Adenovirus co-detected with HF183 and nifH. | [98] |
| GenBac3 a, HPyVc, HF183 a, nifH a | Adenovirus a | Hillsborough River, St, Johns River, Ben T. Davis beach, Florida, USA | No significant relationship with HPyV, other MST markers NR | All FIB concentrations exceeded regulatory standards HF183 and nifH detected in 80% of samples, whereas adenoviruses were detected in 60% of the samples. | [99] |
| HPyV c, HF183 a, nifH a | Adenovirus a | Avalon and Doheny Beaches, California, USA | At Doheny Beach HPyV and HF183 presence correlated with adenovirus. | Adenovirus not detected at Avalon Beach, impacted by non-point source(s). | [93] |
| PMMoV c, HF183 c, BacHum-UCD c, esp a, nifH c | Adenovirus a, Norovirus, Cryptosporidium and Giardia (oo)cysts b, C. jejuni a, Salmonella spp. a, S. aureus a, E. coli 0157-H7 a | Coastal beaches, Florida, USA | NR | PMMoV co-occurred with FIB, other MST markers and pathogens. Seawater samples taken near sewage outfalls. | [83] |
| BacHum-UCD c, HF183 c, DogBac c, C. marimammalium c | S. aureuse | Coastal beaches, Miami, Florida, USA | NR | Co-occurrence with S. aureus detection. No correlation found with MST markers and skin illness. | [86] |
| Organism | Detection Frequency per Study (%) and n 2 | Detection Frequency per Sample 2 | Detection Frequency per Study (%) and n 2 | Detection Frequency per Sample 2 |
|---|---|---|---|---|
| Freshwater | Brackish/Marine | |||
| FIB | ||||
| Total coliforms (MPN) | 100% (4) | 100% (275) | N/A | N/A |
| Total coliforms (CFU) | 100% (3) | 97.2% (1988) | 100% (5) | 99.7% (317) |
| Fecal coliforms (MPN) | 100% (4) | 100% (147) | N/A | N/A |
| Fecal coliforms (CFU) | 100% (6) | 96.7% (1726) | 100% (11) | 98.3% (524) |
| E. coli (MPN) | 100% (8) | 97.7% (1846) | 100% (5) | 100% (55) |
| E. coli (CFU) | 100% (10) | 90% (2530) | 100% (8) | 94.1% (406) |
| E. coli (Q) | 100% (5) | 89.6% (221) | N/A | N/A |
| Enterococci (MPN) | 100% (2) | 81.7% (301) | 100% (5) | 61.7% (162) |
| Enterococci (CFU) | 100% (13) | 96.6% (2584) | 100% (13) | 97.6% (705) |
| Enterococci (Q) | 100% (2) | 100% (302) | 100% (3) | 100% (34) |
| Alternative indicators | ||||
| C. perfringens (CFU) | 100% (4) | 83.2% (1843) | 100% (5) | 61.6% (73) |
| C. perfringens (Q) | 100% (2) | 73.2% (56) | N/A | N/A |
| Somatic coliphage (PFU) | 100% (4) | 85.5% (394) | 100% (1) | 100% (20) |
| F+ coliphage (PFU) | 100% (2) | 93.2% (73) | 100% (7) | 34.4% (90) |
| F- coliphage (PFU) | N/A | N/A | 100% (3) | 28% (25) |
| B. fragilis phage (PFU) | N/A | N/A | 100% (1) | 16.7% (12) |
| B. thetaiotaomicron phage (PFU) | N/A | N/A | 100% (1) | 30% (20) |
| MST markers | ||||
| GenBac3 (Q) | 100% (1) | 75% (8) | N/A | N/A |
| HF183 (E) | N/A | N/A | 100% (3) | 31.8% (255) |
| HF183 (Q) | N/A | N/A | 100% (4) | 25.5% (105) |
| BacHum-UCD (Q) | N/A | N/A | 100% (1) | 95.45% (22) |
| HPyV (E) | 100% (1) | 0% (18) | 100% (4) | 51.08% (204) |
| HPyV (Q) | 100% (1) | 100% 98) | 100% (2) | 12.2% (255) |
| C. coccoides Human (Q) | N/A | N/A | 100% (1) | 69.2% (13) |
| B. thetaiotamicron (E) | N/A | N/A | 100% (1) | 26.7% (15) |
| nifH (E) | 100% (1) | 0% (18) | 100% (2) | 2.8% (255) |
| nifH (Q) | N/A | N/A | 100% (1) | 100% (7) |
| gyrB (Q) | 100% (1) | 50.8% (65) | N/A | N/A |
| g-Bfra | 100% (1) | 92.3% (65) | N/A | N/A |
| esp (E) | 100% (3) | 6.2% (649) | 80% (5) | 19.12% (204) |
| LTII (E) | 100% (1) | 7.4% (217) | N/A | N/A |
| STII (E) | 100% (1) | 4.6% (217) | N/A | N/A |
| DogBac (Q) | N/A | N/A | 100% (1) | 86.7% (15) |
| Bacterial pathogens | ||||
| E. coli O157:H7 (MPN) | 100% (1) | 0.6% (823) | N/A | N/A |
| E. coli O157:H7 (E) | 100% (1) | 13.4% (67) | 0% (1) | 0% (7) |
| Pathogenic E. coli (eae) (E) | 100% (4) | 53.7% (350) | N/A | N/A |
| Pathogenic E. coli (eae) (Q) | 100% (1) | 31.3% (32) | N/A | N/A |
| Pathogenic E. coli (stx1) (E) | 100% (4) | 7.9% (302) | N/A | N/A |
| Pathogenic E. coli (stx2) (E) | 100% (3) | 29.7% (350) | N/A | N/A |
| Salmonella spp. (MPN) | 100% (6) | 14% (1076) | 33% (3) | 8.7% (196) |
| Salmonella spp. (E) | N/A | N/A | 100% (1) | 28.6% (7) |
| Salmonella spp. (Q) | 100% (4) | 27.3% (1188) | N/A | N/A |
| S. aureus (MPN) | 100% (1) | 44.6% (112) | 100% (2) | 70.4% (27) |
| S. aureus (E) | N/A | N/A | 100% (1) | 57.1% (7) |
| S. aureus (Q) | 100% (1) | 37.5% (8) | N/A | N/A |
| Campylobacter spp. (MPN) | 100% (3) | 24.7% (1009) | 100% (1) | 30.9% (55) |
| Campylobacter spp. (E) | N/A | N/A | 100% (1) | 14.3% (7) |
| Campylobacter spp. (Q) | 100% (3) | 81.3% (80) | 100% (1) | 18.2% (11) |
| Pseudomonas spp. (MPN) | 100% (2) | 80.6% (191) | N/A | N/A |
| P. aeruginosa (Q) | 100% (2) | 39.6% (53) | N/A | N/A |
| Shigella spp. (E) | 100% (1) | 6.3% (48) | N/A | N/A |
| Shigella spp. (Q) | 100% (2) | 14.5% (1148) | N/A | N/A |
| Legionella spp. (E) | 100% (2) | 41.9% (217) | N/A | N/A |
| Legionella spp. (Q) | 100% (1) | 20% (30) | N/A | N/A |
| Listeria spp. (MPN) | 100% (1) | 18.7% (395) | N/A | N/A |
| V. cholerae (Q) | 100% (2) | 52.5% (1148) | N/A | N/A |
| V. vulnificus (Q) | N/A | N/A | 100% (2) | 44.4% (27) |
| Aeromonas spp. (Q) | 100% (3) | 100% (248) | N/A | N/A |
| M. avium (Q) | 100% (2) | 34.4% (64) | N/A | N/A |
| Viral pathogens | ||||
| Infectious enterovirus (MPN) | 100% (3) | 18.4% (158) | 100% (3) | 0% (27) |
| Enterovirus (E) | 100% (3) | 14.4% (222) | 100% (3) | 37.8% (45) |
| Enterovirus (Q) | 100% (4) | 29.1% (103) | 33% (3) | 14.8% (27) |
| Infectious reovirus (MPN) | 100% (1) | 21.9% (32) | N/A | N/A |
| Reovirus (Q) | 100% (1) | 100% (8) | N/A | N/A |
| Human adenovirus (MPN) | N/A | N/A | 100% (1) | 0% (27) |
| Human adenovirus (E) | 100% (4) | 42.2% (1118) | 100% (6) | 16.5% (309) |
| Human adenovirus (Q) | 100% (5) | 40.7% (214) | 100% (1) | 33.3% (12) |
| Astrovirus (E) | 100% (1) | 15.4% (52) | N/A | N/A |
| Astrovirus (Q) | 100% (2) | 17.3% (133) | N/A | N/A |
| Norovirus (E) | 100% (3) | 29.5% (112) | 100% (1) | 27.3% (22) |
| Norovirus (Q) | 100% (1) | 100% (8) | 50% (2) | 26.3% (19) |
| Norovirus GI (Q) | 50% (4) | 7.5% (213) | N/A | N/A |
| Norovirus GII (Q) | 66.7% (3) | 16.2% (198) | N/A | N/A |
| Rotavirus (E) | 100% (3) | 18.4% (141) | N/A | N/A |
| Rotavirus (Q) | 66.7% (3) | 33.8% (142) | N/A | N/A |
| Hepatitis A (E) | N/A | N/A | 100% (1) | 80% (10) |
| Hepatitis A (Q) | 100% (1) | 1.5% (68) | 0% (1) | 0% (12) |
| Bovine adenovirus (Q) | 100% (1) | 56.7% (30) | N/A | N/A |
| Protozoan pathogens | ||||
| Acanthamoeba spp. (E) | 100% (1) | 24.6% (126) | N/A | N/A |
| Naegleria spp. (E) | 100% (1) | 13.5% (126) | N/A | N/A |
| Cryptosporidium spp. (M) | 88.9% (9) | 36.5% (1456) | 60% (5) | 23.2% (112) |
| Cryptosporidium spp. (E) | N/A | N/A | 0% (1) | 0% (12) |
| Cryptosporidium spp. (Q) | N/A | N/A | 100% (1) | 26.7% (15) |
| Giardia spp. (M) | 100% (8) | 63.7% (1426) | 80% (5) | 22.3% (112) |
| Giardia spp. (E) | N/A | N/A | 100% (2) | 16.7% (12) |
| Giardia spp. (Q) | N/A | N/A | 100% (1) | 33.3% (15) |
| Fungal pathogens | ||||
| C. albicans (MPN) | N/A | N/A | 100% (1) | 45.4% (152) |
| Organism 1 | Range or Average per Study (log10 per 100 mL) 2,3 | Marine References 4 | Freshwater References 4 |
|---|---|---|---|
| FIB | |||
| Total coliforms (c) | 2.67–3.89 | N/A | [37,75] |
| Fecal coliforms (c) | 0.93–5.39 | [76,77,80,87,94] | [39,57,65,125] |
| E. coli (c) | 0.59–3.51 | [76,77,80,82,89,94,96,100] | [36,37,44,46,50,51,54,55,56,57,65,75,125] |
| E. coli (q) | 1.75–3.97 | N/A | [41,51,55,68] |
| Enterococci (c) | ND–3.62 | [70,76,77,80,82,83,84,85,87,88,89,94,96,100,101] | [37,39,44,47,50,51,55,56,57,65,70] |
| Enterococci (q) | 0.63–3.21 | [76,77,83] | [51,55] |
| Alternative indicators | |||
| C. perfringens (c) | 0.20–2.33 | [76,77,87,88,89,100] | [54] |
| C. perfringens (q) | 0.35 | N/A | [41] |
| Somatic coliphage (c) | 0.61–3.29 | [82,90,94] | [39,102,103,126] |
| F-specific coliphage (c) | ND–2.76 | [76,82,89,90,94,100] | [47,54,102,103] |
| MST markers | |||
| AllBac(q) | 0.93 | [83] | [51] |
| PMMoV (q) | ND | [83] | N/A |
| HF183 (q) | ND–0.69 | N/A | [51] |
| HBBac (q) | 0.72 | [83] | N/A |
| HPyV (q) | 2.36 | N/A | [51] |
| esp (q) | 0.06 | [76] | N/A |
| nifH (q) | ND | [83] | N/A |
| DogBac (q) | 2.50 | [76] | N/A |
| Bacterial pathogens | |||
| Campylobacter spp. (c) | 1.05 | N/A | [54] |
| Campylobacter spp. (q) | 0.74–2.29 | N/A | [46,70] |
| EHEC (q) | 0.13 | N/A | [65] |
| Salmonella spp. (c) | ND–2.36 | [80,84,89,100] | N/A |
| Salmonella spp. (q) | 0.06–4.08 | N/A | [51,65,68] |
| S. aureus (c) | 0.70–0.77 | [76,77] | N/A |
| S. aureus (q) | 0.78 | N/A | [51] |
| Aeromonas spp. (q) | 5.09 | N/A | [68] |
| Stx1 (q) | 0.03 | N/A | [57] |
| Stx2 (q) | 0.03 | N/A | [57] |
| Mycobacterium spp. (q) | 3.41 | N/A | [68] |
| Pseudomonas spp. (c) | 0.37–3.72 | N/A | N/A |
| Legionella spp (q) | ND | N/A | [46] |
| V. vulnificus (c) | 1.91–2.11 | [84,100] | N/A |
| V. parahaemolyticus (q) | 1.01 | [85] | N/A |
| Viral pathogens | |||
| Enterovirus (c) | ND–0.04 | [80,82,87,89,94] | [39,47,102] |
| Enterovirus (q) | ND–0.56 | [76,77] | [39] |
| Adenovirus (q) | 0.08–1.02 | N/A | [41,46,103] |
| Astrovirus (q) | 1.48 | N/A | [103] |
| Norovirus (q) | ND–1.40 | [77,94] | [51,102] |
| Norovirus GI (q) | ND–1.02 | N/A | [50,103] |
| Norovirus GII (q) | 1.58 | N/A | [103] |
| Rotavirus (q) | 1.41–1.53 | N/A | [102,103] |
| Reovirus (c) | 0.18–0.31 | N/A | [47,102] |
| Hepatitis A (q) | ND | [77] | N/A |
| Protozoan pathogens | |||
| E. bieneusi (m) | 0.12 | [101] | N/A |
| Giardia spp.(m) | ND–1.93 | [76,83,88,89,94,96,127] | [36,41,47,54,55,56,65,75] |
| Cryptosporidium spp. (m) | ND–0.73 | [76,77,83,88,89,94,96,127] | [36,41,47,54,55,56,65,75] |
© 2018 by the authors. Licensee MDPI, Basel, Switzerland. This article is an open access article distributed under the terms and conditions of the Creative Commons Attribution (CC BY) license (http://creativecommons.org/licenses/by/4.0/).
Share and Cite
Korajkic, A.; McMinn, B.R.; Harwood, V.J. Relationships between Microbial Indicators and Pathogens in Recreational Water Settings. Int. J. Environ. Res. Public Health 2018, 15, 2842. https://doi.org/10.3390/ijerph15122842
Korajkic A, McMinn BR, Harwood VJ. Relationships between Microbial Indicators and Pathogens in Recreational Water Settings. International Journal of Environmental Research and Public Health. 2018; 15(12):2842. https://doi.org/10.3390/ijerph15122842
Chicago/Turabian StyleKorajkic, Asja, Brian R. McMinn, and Valerie J. Harwood. 2018. "Relationships between Microbial Indicators and Pathogens in Recreational Water Settings" International Journal of Environmental Research and Public Health 15, no. 12: 2842. https://doi.org/10.3390/ijerph15122842
APA StyleKorajkic, A., McMinn, B. R., & Harwood, V. J. (2018). Relationships between Microbial Indicators and Pathogens in Recreational Water Settings. International Journal of Environmental Research and Public Health, 15(12), 2842. https://doi.org/10.3390/ijerph15122842