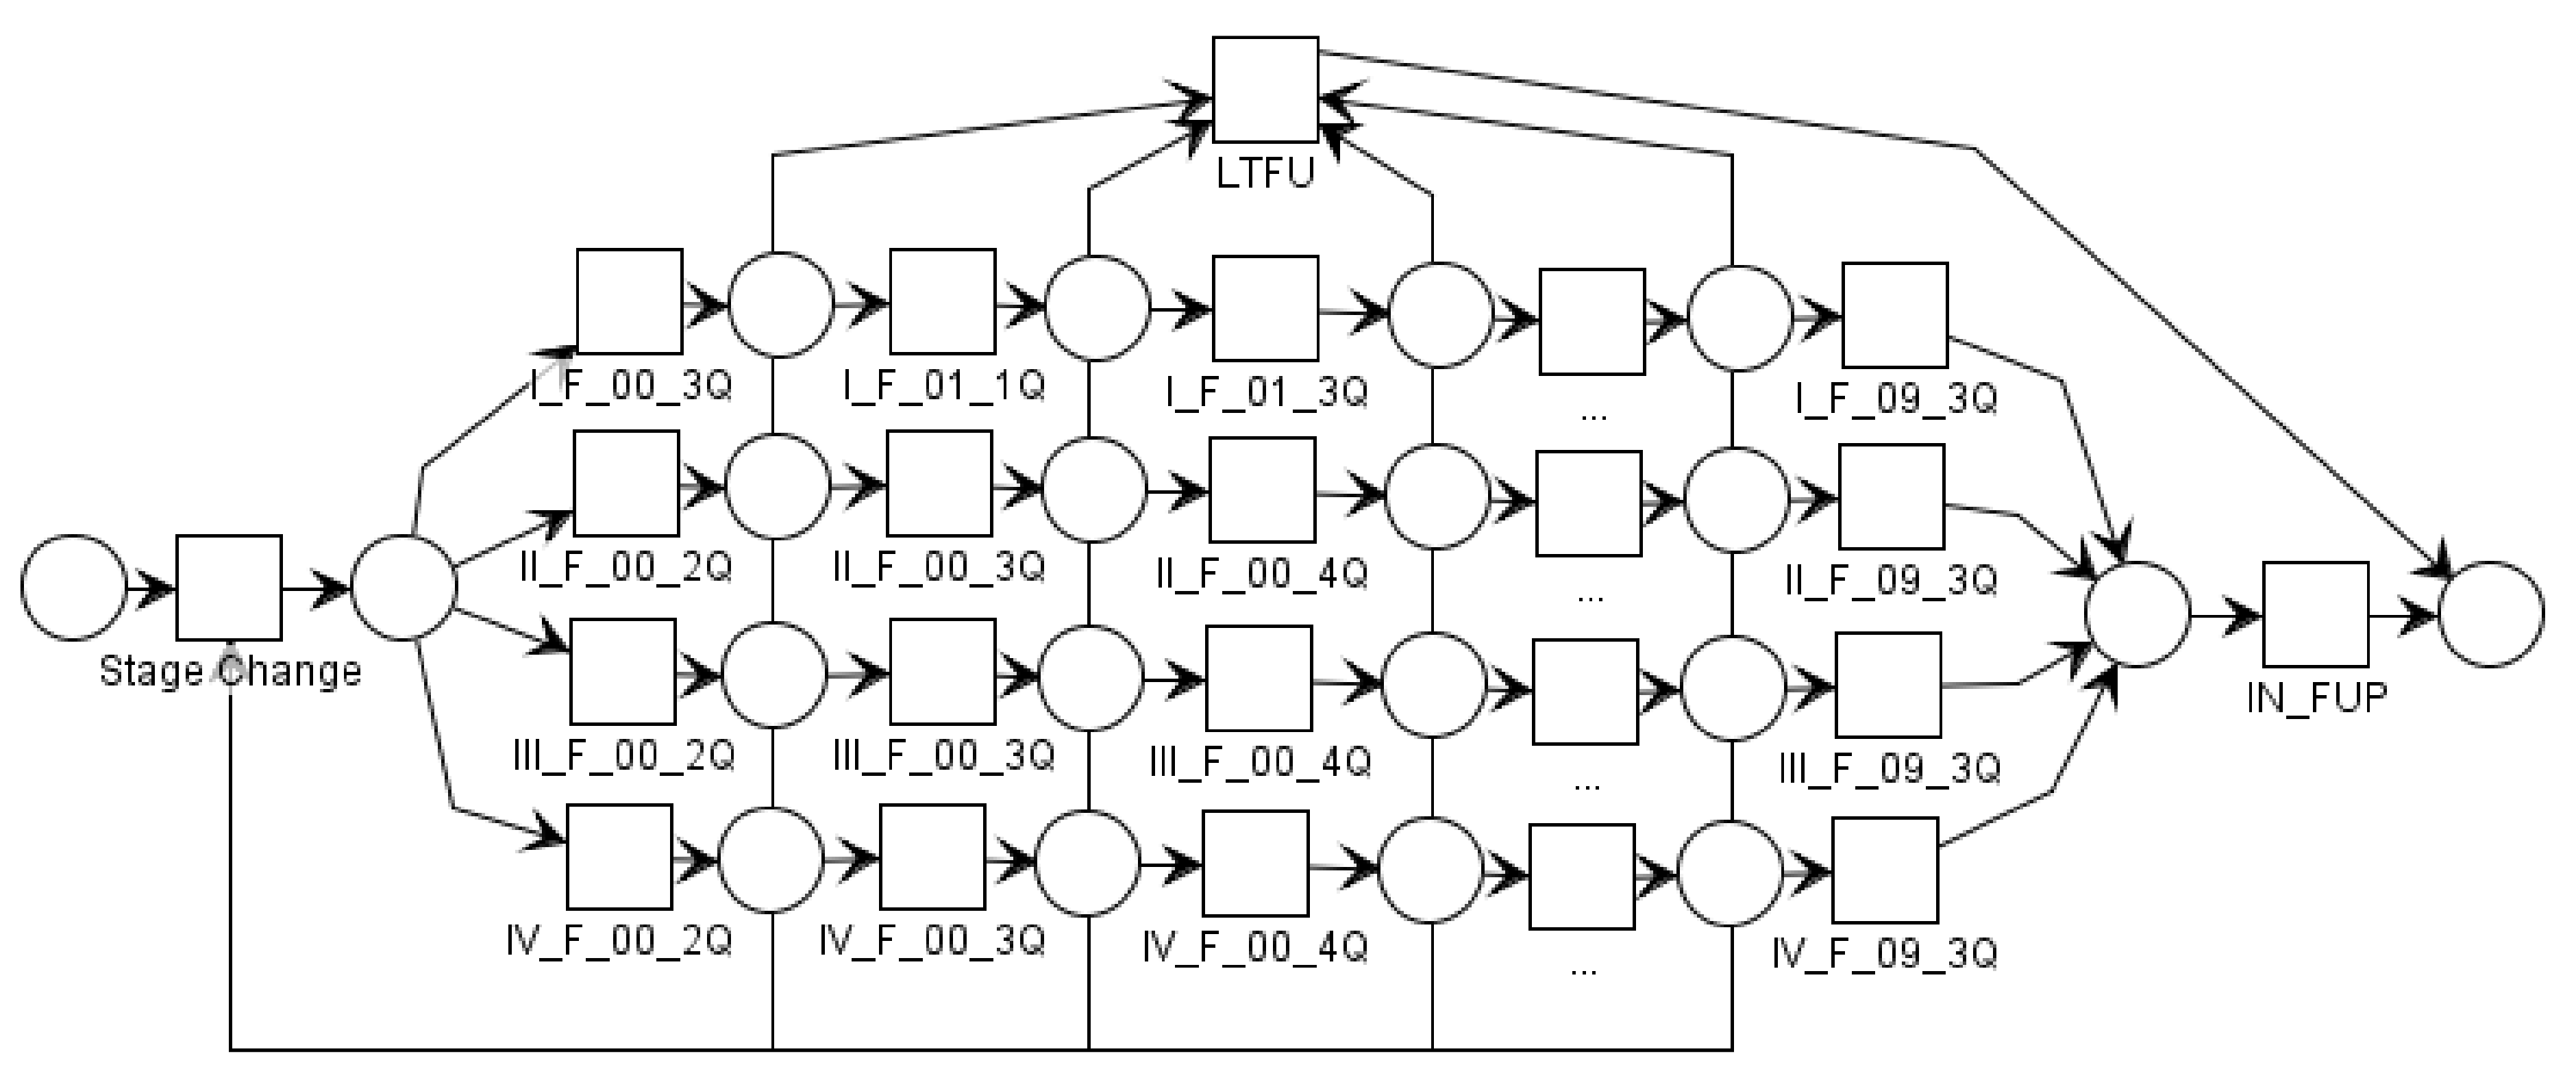
Process Mining and Conformance Checking of Long Running Processes in the Context of Melanoma Surveillance †
Abstract
1. Introduction
1.1. Motivation
1.2. Problem Statement
1.3. Research Questions
- How can existing clinical data be reused for the application of process mining?
- How can data of recurring events with time constraints that span a long period of time be prepared to apply process mining?
- How can we apply process mining to check guideline compliance?
- What can we learn from process mining in the context of surveillance of melanoma patients?
1.4. Contribution
2. Related Work
2.1. Process-Oriented Analysis
2.2. Positioning in the Field
3. Methods
3.1. Data Preparation and Time Boxing
3.2. Conformance Checking with ProM
3.3. Statistical Methods
4. Results
4.1. Conformance Checking of Melanoma Surveillance
4.2. Applied Process Mining
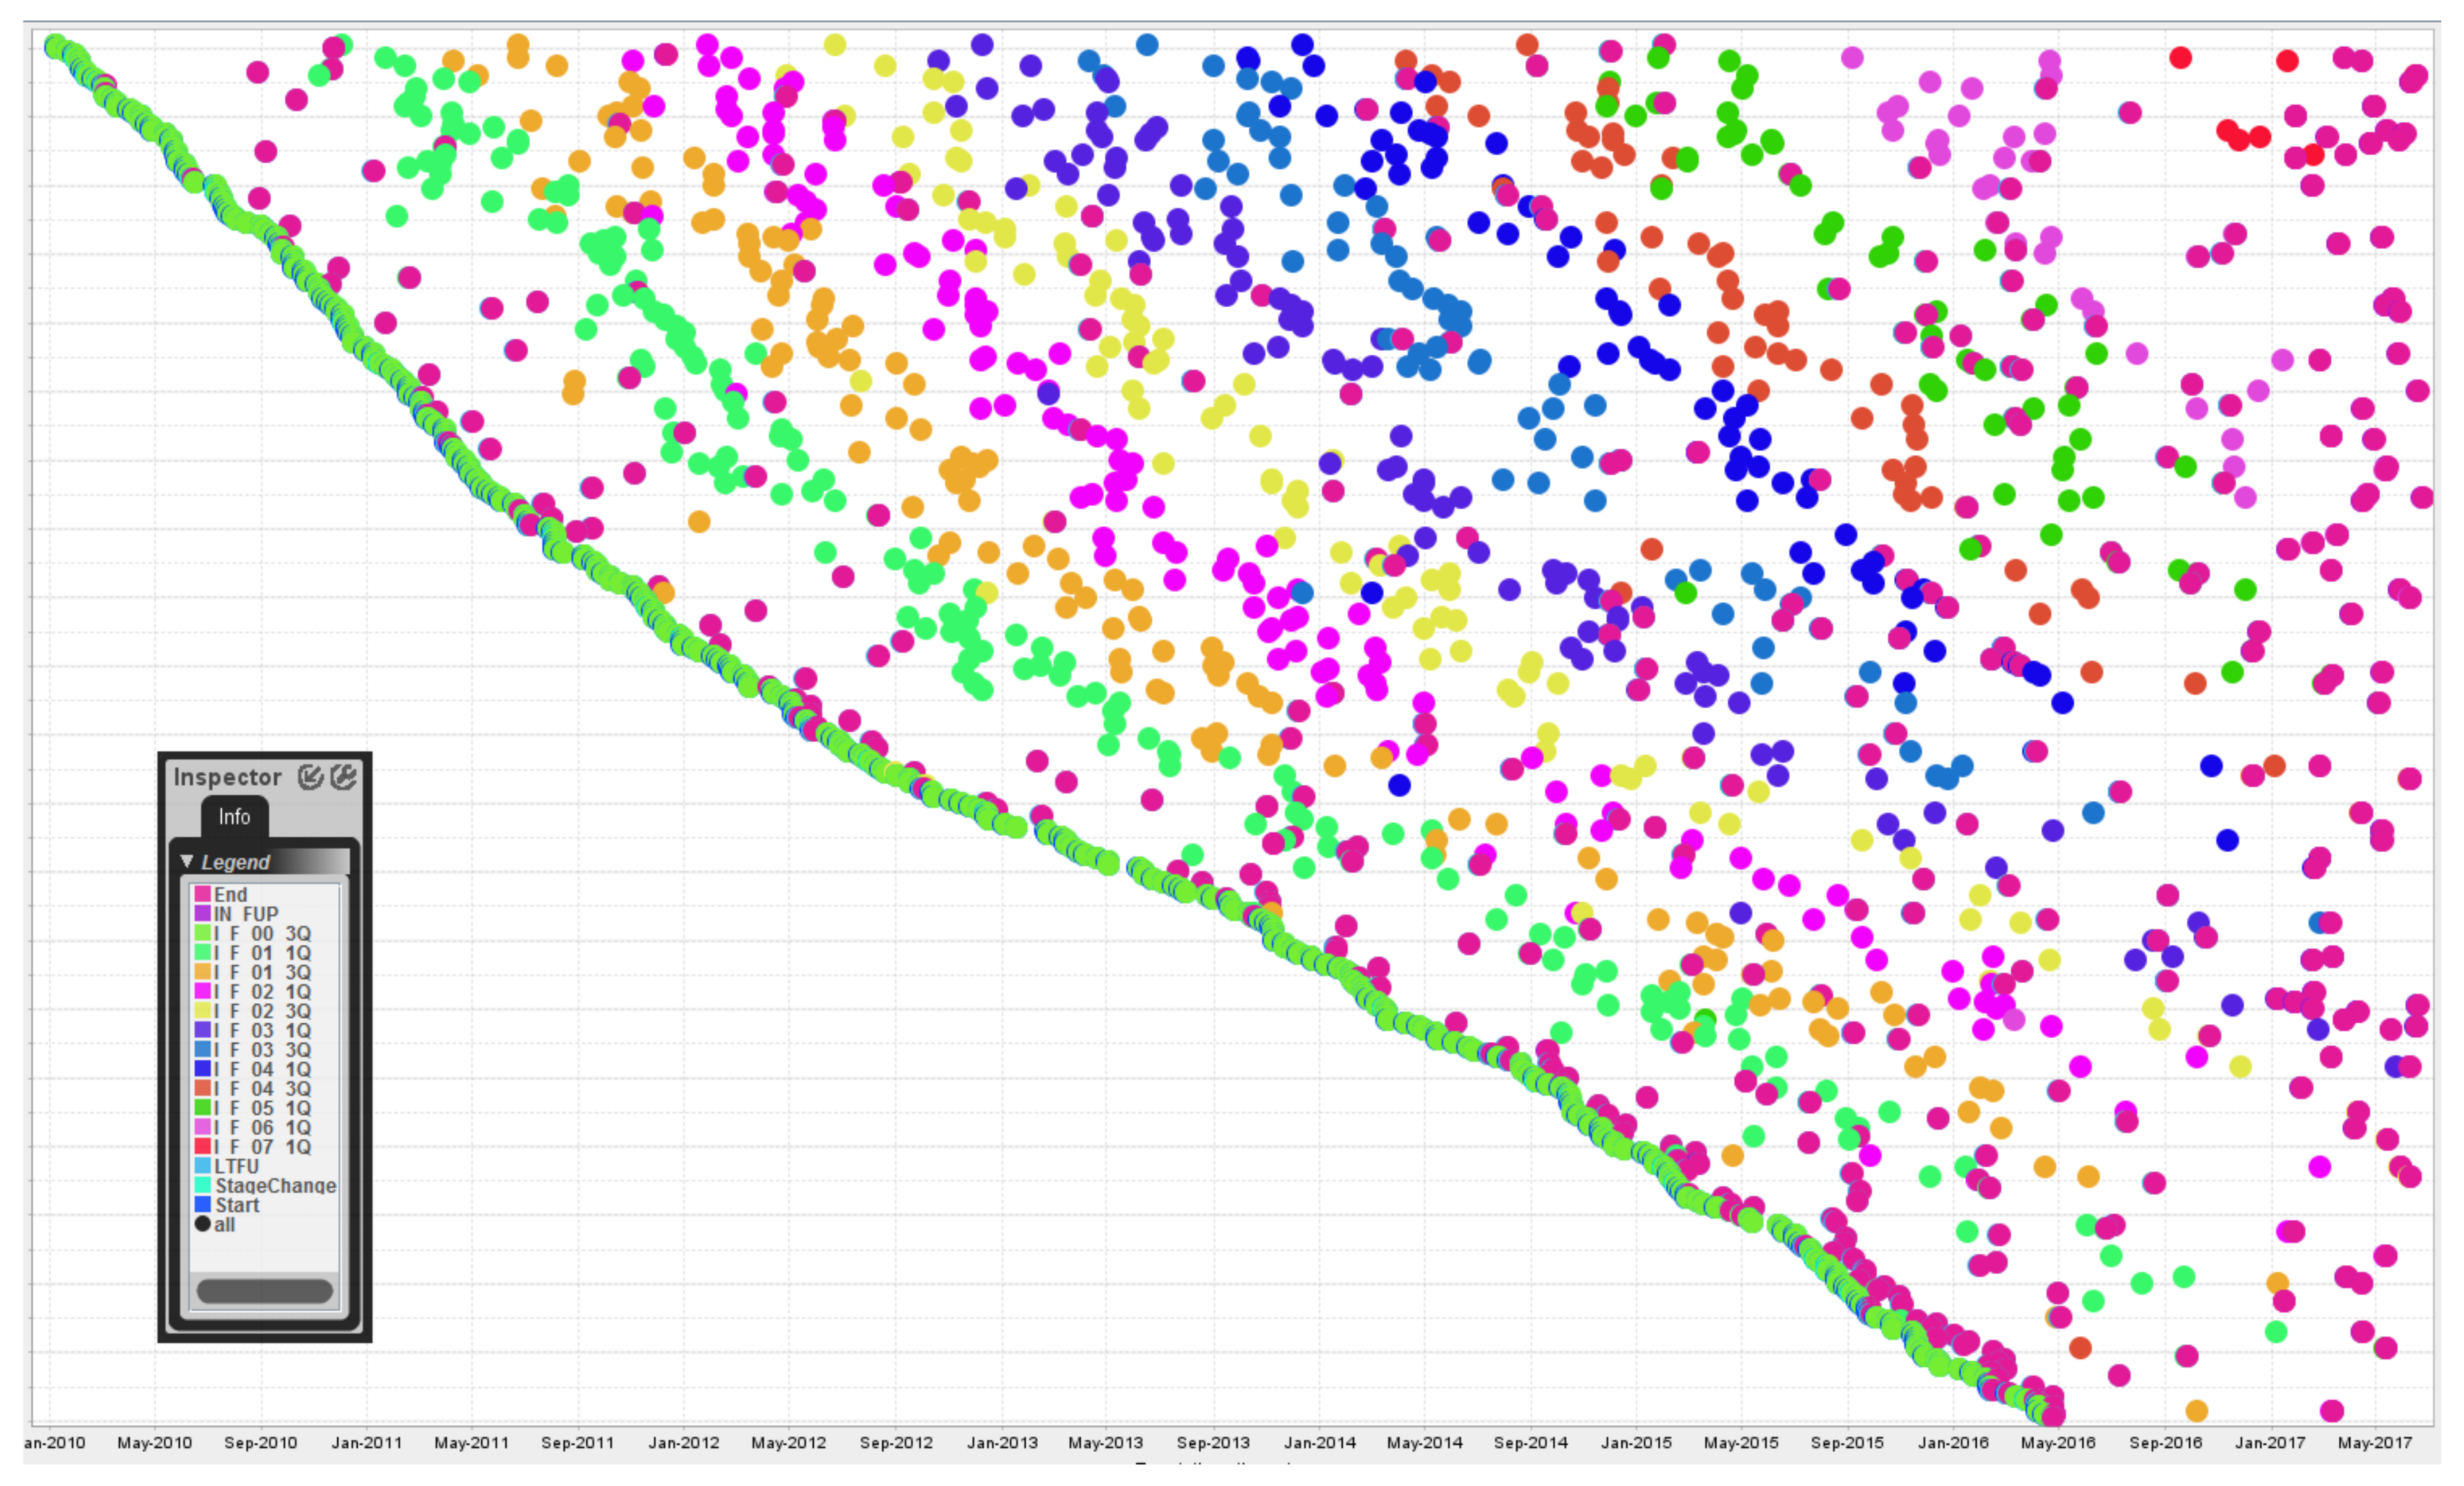
- A clear ‘rainbow’ pattern is visible since the sequence of events recorded for stage I is linear and follow-up visits occur at generally regular intervals.
- The outcome indicator (IN_FUP/LTFU event) is not visible since the End event occurs at the same timestamp +20 h and the latter dot overlaps the former one.
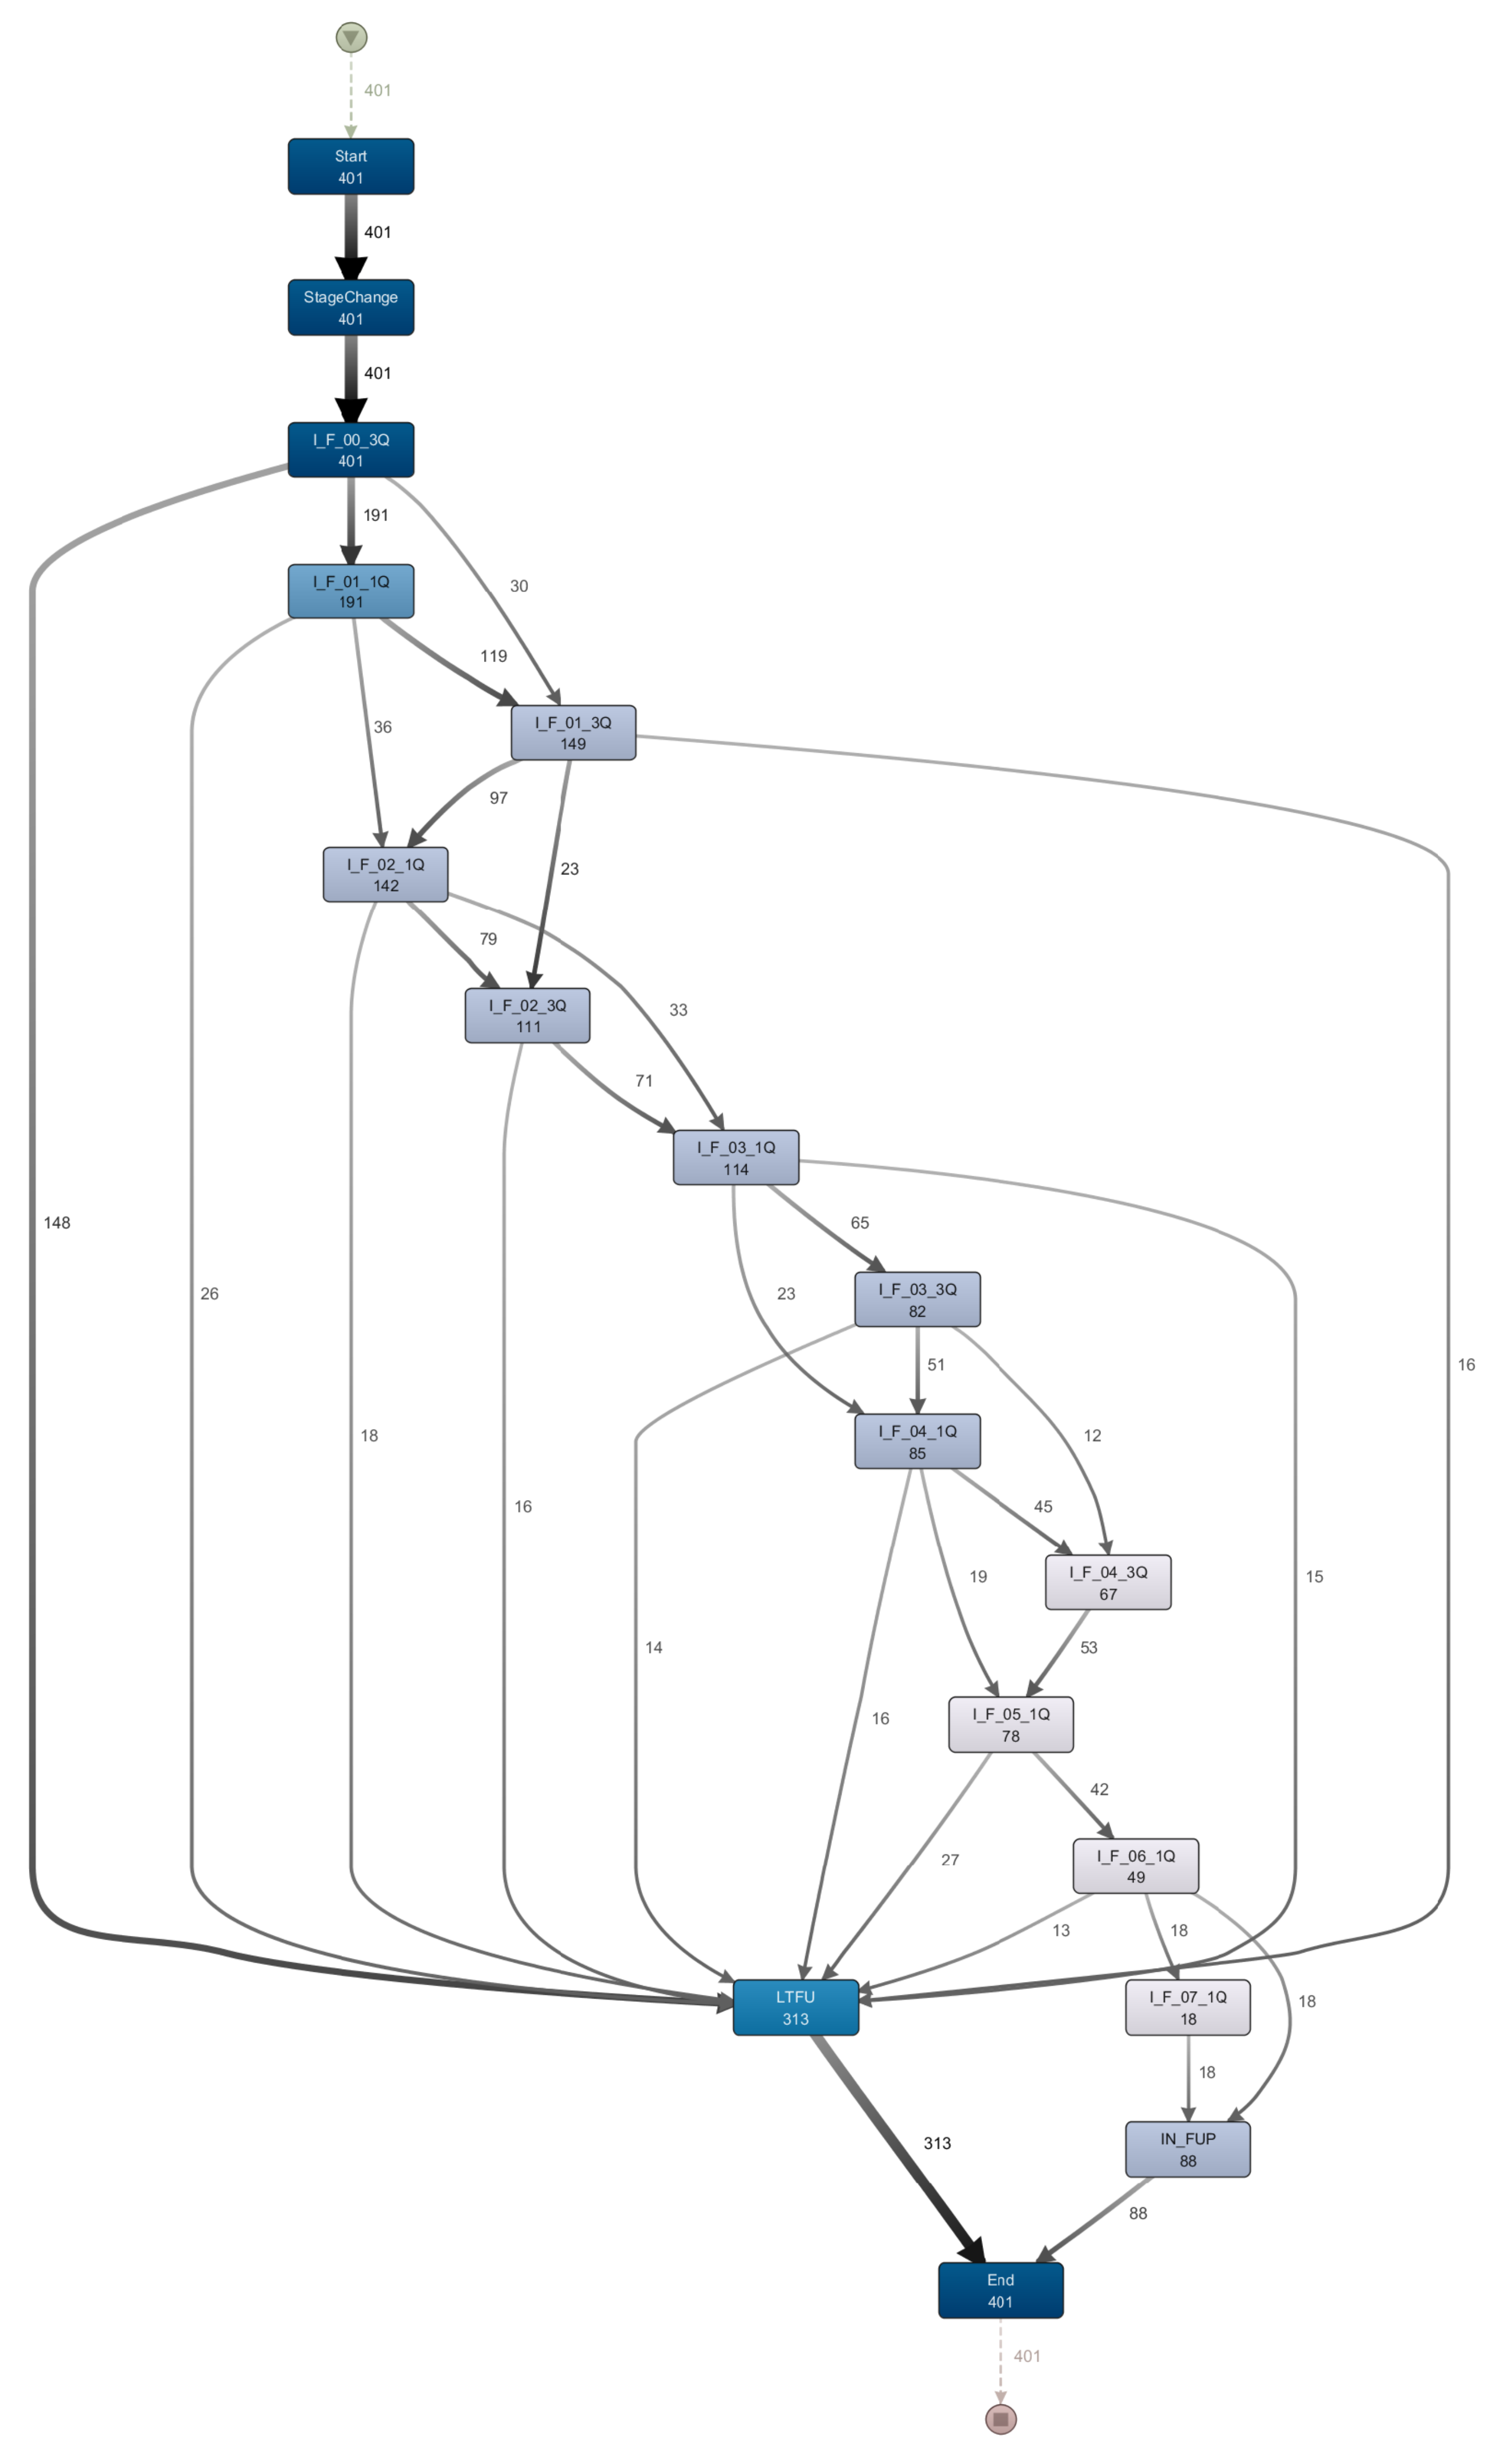
- The most frequent trace (i.e., ending the follow-up after the first visit in stage I—see Figure 3) can be observed due to the high number of End events that occur shortly after the Start and I_F_00_3Q events.
- All 401 patients in stage I start with the ‘I_F_00_3Q’ event. One hundred and forty-eight patients drop out (i.e., LTFU) after this step. This corresponds to the 148 patients of the most frequent trace in Figure 3.
- The frequency of following events declines steadily. There are fewer patients in later steps than at the beginning. There are two reasons for that. (1) Not all patients started at the same time, thus not all patients can reach the 7th years’ follow-up visits in the fixed time interval. (2) After each step some of the patients drop out.
- The sequence of follow-up events is not linear but makes a ‘braided’ impression due to the skipping of single follow-up visits (see also Figure 5).
4.3. Medical Implications
5. Discussion and Lessons Learnt
5.1. Reuse of Clinical Data for Process Mining
5.2. Events with Time Constraints Spanning a Long Period of Time
5.3. Guideline Compliance Checking
Author Contributions
Funding
Acknowledgments
Conflicts of Interest
Abbreviations
| AJCC | American Joint Committee on Cancer |
| BPMN | Business Process Modeling and Notation |
| DDMUV | Department of Dermatology at the Medical University Vienna |
| EBMC2 | Evidence-Based Medical Compliance Cluster |
| HIS | Hospital Information System |
| IN_FUP | in follow-up |
| LTFU | lost to follow-up |
| MPE | Multi-perspective Process Explorer |
| RDA | Research, Documentation and Analysis Platform |
References
- Safran, C.; Bloomrosen, M.; Hammond, W.E.; Labkoff, S.; Markel-Fox, S.; Tang, P.C.; Detmer, D.E. Toward a national framework for the secondary use of health data: An American Medical Informatics Association White Paper. J. Am. Med. Inform. Assoc. 2007, 14, 1–9. [Google Scholar] [CrossRef] [PubMed]
- Garbe, C.; Peris, K.; Hauschild, A.; Saiag, P.; Middleton, M.; Spatz, A.; Grob, J.-J.; Malvehy, J.; Newton-Bishop, J.; Stratigos, A.; et al. Diagnosis and treatment of melanoma: European consensus-based interdisciplinary guideline. Eur. J. Cancer 2010, 46, 270–283. [Google Scholar] [CrossRef] [PubMed]
- Jemal, A.; Saraiya, M.; Patel, P.; Cherala, S.S.; Barnholtz-Sloan, J.; Kim, J.; Wiggins, C.L.; Wingo, P.A. Recent trends in cutaneous melanoma incidence and death rates in the United States, 1992–2006. J. Am. Acad. Dermatol. 2011, 65, 17. [Google Scholar] [CrossRef] [PubMed]
- Francken, A.B.; Bastiaannet, E.; Hoekstra, H.J. Follow-up in patients with localised primary cutaneous melanoma. Lancet Oncol. 2005, 6, 608–621. [Google Scholar] [CrossRef]
- Van der Aalst, W.M. Process Mining: Discovery, Conformance and Enhancement of Business Processes; Springer Science & Business Media: Berlin/Heidelberg, Germany, 2011. [Google Scholar]
- Mannhardt, F.; De Leoni, M.; Reijers, H.A. The Multi-perspective Process Explorer. In Proceedings of the BPM (Demos), Innsbruck, Austria, 31 August–3 September 2015. [Google Scholar]
- Rozinat, A.; Van der Aalst, W.M. Conformance checking of processes based on monitoring real behavior. Inf. Syst. 2008, 33, 64–95. [Google Scholar] [CrossRef]
- Mans, R.S.; van der Aalst, W.M.; Vanwersch, R.J. Process Mining in Healthcare: Evaluating and Exploiting Operational Healthcare Processes; Springer: Cham, Switzerland, 2015. [Google Scholar]
- Binder, M.; Dorda, W.; Duftschmid, G.; Dunkl, R.; Fröschl, K.A.; Gall, W.; Grossmann, W.; Harmankaya, K.; Hronsky, M.; Rinderle-Ma, S.; et al. On analyzing process compliance in skin cancer treatment: An experience report from the evidence-based medical compliance cluster (EBMC 2). In Proceedings of the International Conference on Advanced Information Systems Engineering, Gdansk, Poland, 25–29 June 2012; Springer: Berlin/Heidelberg, Germany, 2012; pp. 398–413. [Google Scholar]
- Dunkl, R.; Fröschl, K.A.; Grossmann, W.; Rinderle-Ma, S. Assessing medical treatment compliance based on formal process modeling. In Proceedings of the Symposium of the Austrian HCI and Usability Engineering Group, Graz, Austria, 25–26 November 2011; Springer: Berlin/Heidelberg, Germany, 2011; pp. 533–546. [Google Scholar]
- Verbeek, H.M.W.; Buijs, J.C.; Van Dongen, B.F.; Van Der Aalst, W.M. Xes, xesame, and prom 6. In Proceedings of the Forum at the Conference on Advanced Information Systems Engineering (CAiSE), Hammamet, Tunisia, 7–9 June 2010; Springer: Berlin/Heidelberg, Germany, 2010; pp. 60–75. [Google Scholar]
- Adriansyah, A.; van Dongen, B.F.; van der Aalst, W.M. Towards robust conformance checking. In Proceedings of the International Conference on Business Process Management, Hoboken, NJ, USA, 13–16 September 2010; Springer: Berlin/Heidelberg, Germany, 2010; pp. 122–133. [Google Scholar]
- De Weerdt, J.; De Backer, M.; Vanthienen, J.; Baesens, B. A critical evaluation study of model-log metrics in process discovery. In Proceedings of the International Conference on Business Process Management, Clermont-Ferrand, France, 29 August–2 September 2011; Springer: Berlin/Heidelberg, Germany, 2011; pp. 158–169. [Google Scholar]
- Tax, N.; Lu, X.; Sidorova, N.; Fahland, D.; van der Aalst, W.M. The Imprecisions of Precision Measures in Process Mining. arXiv, 2017; arXiv:1705.03303. [Google Scholar]
- Rojas, E.; Munoz-Gama, J.; Sepúlveda, M.; Capurro, D. Process mining in healthcare: A literature review. J. Biomed. Inform. 2016, 61, 224–236. [Google Scholar] [CrossRef]
- Dorda, W.; Wrba, T.; Duftschmid, G.; Sachs, P.; Gall, W.; Rehnelt, C.; Boldt, G.; Premauer, W. ArchiMed: A Medical Information and Retrieval System. Methods Inf. Med. 1999, 38, 16–24. [Google Scholar] [PubMed]
- Günther, C.W.; Rozinat, A. Disco: Discover Your Processes. In Proceedings of the BPM (Demos), Tallinn, Estonia, 4 September 2012; Volume 940, pp. 40–44. [Google Scholar]
- Mannhardt, F.; De Leoni, M.; Reijers, H.A.; Van Der Aalst, W.M. Balanced multi-perspective checking of process conformance. Computing 2016, 98, 407–437. [Google Scholar] [CrossRef]
- Mannhardt, F.; De Leoni, M.; Reijers, H.A.; Van Der Aalst, W.M. Measuring the precision of multi-perspective process models. In Proceedings of the International Conference on Business Process Management, Rio de Janeiro, Brazil, 18–22 September 2016; Springer: Berlin/Heidelberg, Germany, 2016; pp. 113–125. [Google Scholar]
- Hackl, M.; Ihle, P. Krebserkrankungen in Österreich, 6th ed.; Statistik Austria: Vienna, Austria, 2018. [Google Scholar]
- Kittler, H.; Weitzdorfer, R.; Pehamberger, H.; Wolff, K.; Binder, M. Compliance with follow-up and prognosis among patients with thin melanomas. Eur. J. Cancer 2001, 37, 1504–1509. [Google Scholar] [CrossRef]
- Rinner, C.; Duftschmid, G.; Wrba, T.; Gall, W. Making the complex data model of a clinical research platform accessible for teaching. J. Innov. Health Inform. 2017, 24, 168. [Google Scholar]
- Murphy, S.N.; Weber, G.; Mendis, M.; Gainer, V.; Chueh, H.C.; Churchill, S.; Kohane, I. Serving the enterprise and beyond with informatics for integrating biology and the bedside (i2b2). J. Am. Med. Inform. Assoc. 2010, 17, 124–130. [Google Scholar] [CrossRef]
- Overhage, J.M.; Ryan, P.B.; Reich, C.G.; Hartzema, A.G.; Stang, P.E. Validation of a common data model for active safety surveillance research. J. Am. Med. Inform. Assoc. 2011, 19, 54–60. [Google Scholar] [CrossRef]
- Maggi, F.M. Declarative Process Mining with the Declare Component of ProM. In Proceedings of the BPM (Demos), Beijing, China, 26–30 August 2013. [Google Scholar]
- Rovani, M.; Maggi, F.M.; de Leoni, M.; van der Aalst, W.M. Declarative process mining in healthcare. Expert Syst. Appl. 2015, 42, 9236–9251. [Google Scholar] [CrossRef]
- Tschandl, P.; Rosendahl, C.; Akay, B.N.; Argenziano, G.; Blum, A.; Braun, R.P.; Cabo, H.; Gourhant, J.-Y.; Kreusch, J.; Lallas, A.; et al. Expert-Level Diagnosis of Nonpigmented Skin Cancer by Combined Convolutional Neural Networks. JAMA Dermatol. 2018. [Google Scholar] [CrossRef]
- Garbe, C. Increasing incidence of malignant melanoma. Hautarzt 2000, 51, 518. [Google Scholar] [CrossRef]


| Number of Patients | Number of Mean Events per Case | ||||||||||
|---|---|---|---|---|---|---|---|---|---|---|---|
| I–IV | I | II | III | IV | I–IV | I | II | III | IV | ||
| LTFU | 286 | 146 | 95 | 20 | 25 | 8.23 | 6.78 | 9.2 | 10.6 | 11.2 | |
| Female | IN_FUP | 153 | 45 | 50 | 17 | 41 | 12.8 | 10.1 | 14.9 | 13.4 | 13 |
| Total | 439 | 191 | 145 | 37 | 66 | 9.82 | 7.57 | 11.2 | 11.9 | 12.3 | |
| LTFU | 379 | 167 | 124 | 42 | 46 | 8.67 | 7.09 | 8.90 | 10.7 | 11.9 | |
| Male | IN_FUP | 205 | 43 | 70 | 33 | 59 | 13.3 | 10.7 | 13.9 | 15.1 | 13.4 |
| Total | 584 | 210 | 194 | 75 | 105 | 10.3 | 7.84 | 10.7 | 12.6 | 12.7 | |
| LTFU | 665 | 313 | 219 | 62 | 71 | 8.48 | 6.95 | 9.03 | 10.7 | 11.6 | |
| Total | IN_FUP | 358 | 88 | 120 | 50 | 100 | 13.1 | 10.4 | 14.3 | 14.5 | 13.2 |
| Total | 1023 | 401 | 339 | 112 | 171 | 10.1 | 7.71 | 10.9 | 12.4 | 12.6 | |
| AJCC Stage | No of Patients | Avg. Fitness % (Min–Max) | Precision % (#Observed / #Possible Behaviour) |
|---|---|---|---|
| I | 401 | 98.6% (91–100%) | 75.1% |
| II | 339 | 98.0% (82–100%) | 71.4% |
| III | 112 | 98.2% (85–100%) | 65.0% |
| IV | 171 | 98.7% (88–100%) | 63.1% |
| I–IV | 1023 | 98.4% (53–100%) | 87.0% |
© 2018 by the authors. Licensee MDPI, Basel, Switzerland. This article is an open access article distributed under the terms and conditions of the Creative Commons Attribution (CC BY) license (http://creativecommons.org/licenses/by/4.0/).
Share and Cite
Rinner, C.; Helm, E.; Dunkl, R.; Kittler, H.; Rinderle-Ma, S. Process Mining and Conformance Checking of Long Running Processes in the Context of Melanoma Surveillance. Int. J. Environ. Res. Public Health 2018, 15, 2809. https://doi.org/10.3390/ijerph15122809
Rinner C, Helm E, Dunkl R, Kittler H, Rinderle-Ma S. Process Mining and Conformance Checking of Long Running Processes in the Context of Melanoma Surveillance. International Journal of Environmental Research and Public Health. 2018; 15(12):2809. https://doi.org/10.3390/ijerph15122809
Chicago/Turabian StyleRinner, Christoph, Emmanuel Helm, Reinhold Dunkl, Harald Kittler, and Stefanie Rinderle-Ma. 2018. "Process Mining and Conformance Checking of Long Running Processes in the Context of Melanoma Surveillance" International Journal of Environmental Research and Public Health 15, no. 12: 2809. https://doi.org/10.3390/ijerph15122809
APA StyleRinner, C., Helm, E., Dunkl, R., Kittler, H., & Rinderle-Ma, S. (2018). Process Mining and Conformance Checking of Long Running Processes in the Context of Melanoma Surveillance. International Journal of Environmental Research and Public Health, 15(12), 2809. https://doi.org/10.3390/ijerph15122809


