A Novel Sampling Method to Measure Socioeconomic Drivers of Aedes albopictus Distribution in Mecklenburg County, North Carolina


Abstract
1. Introduction
2. Methods
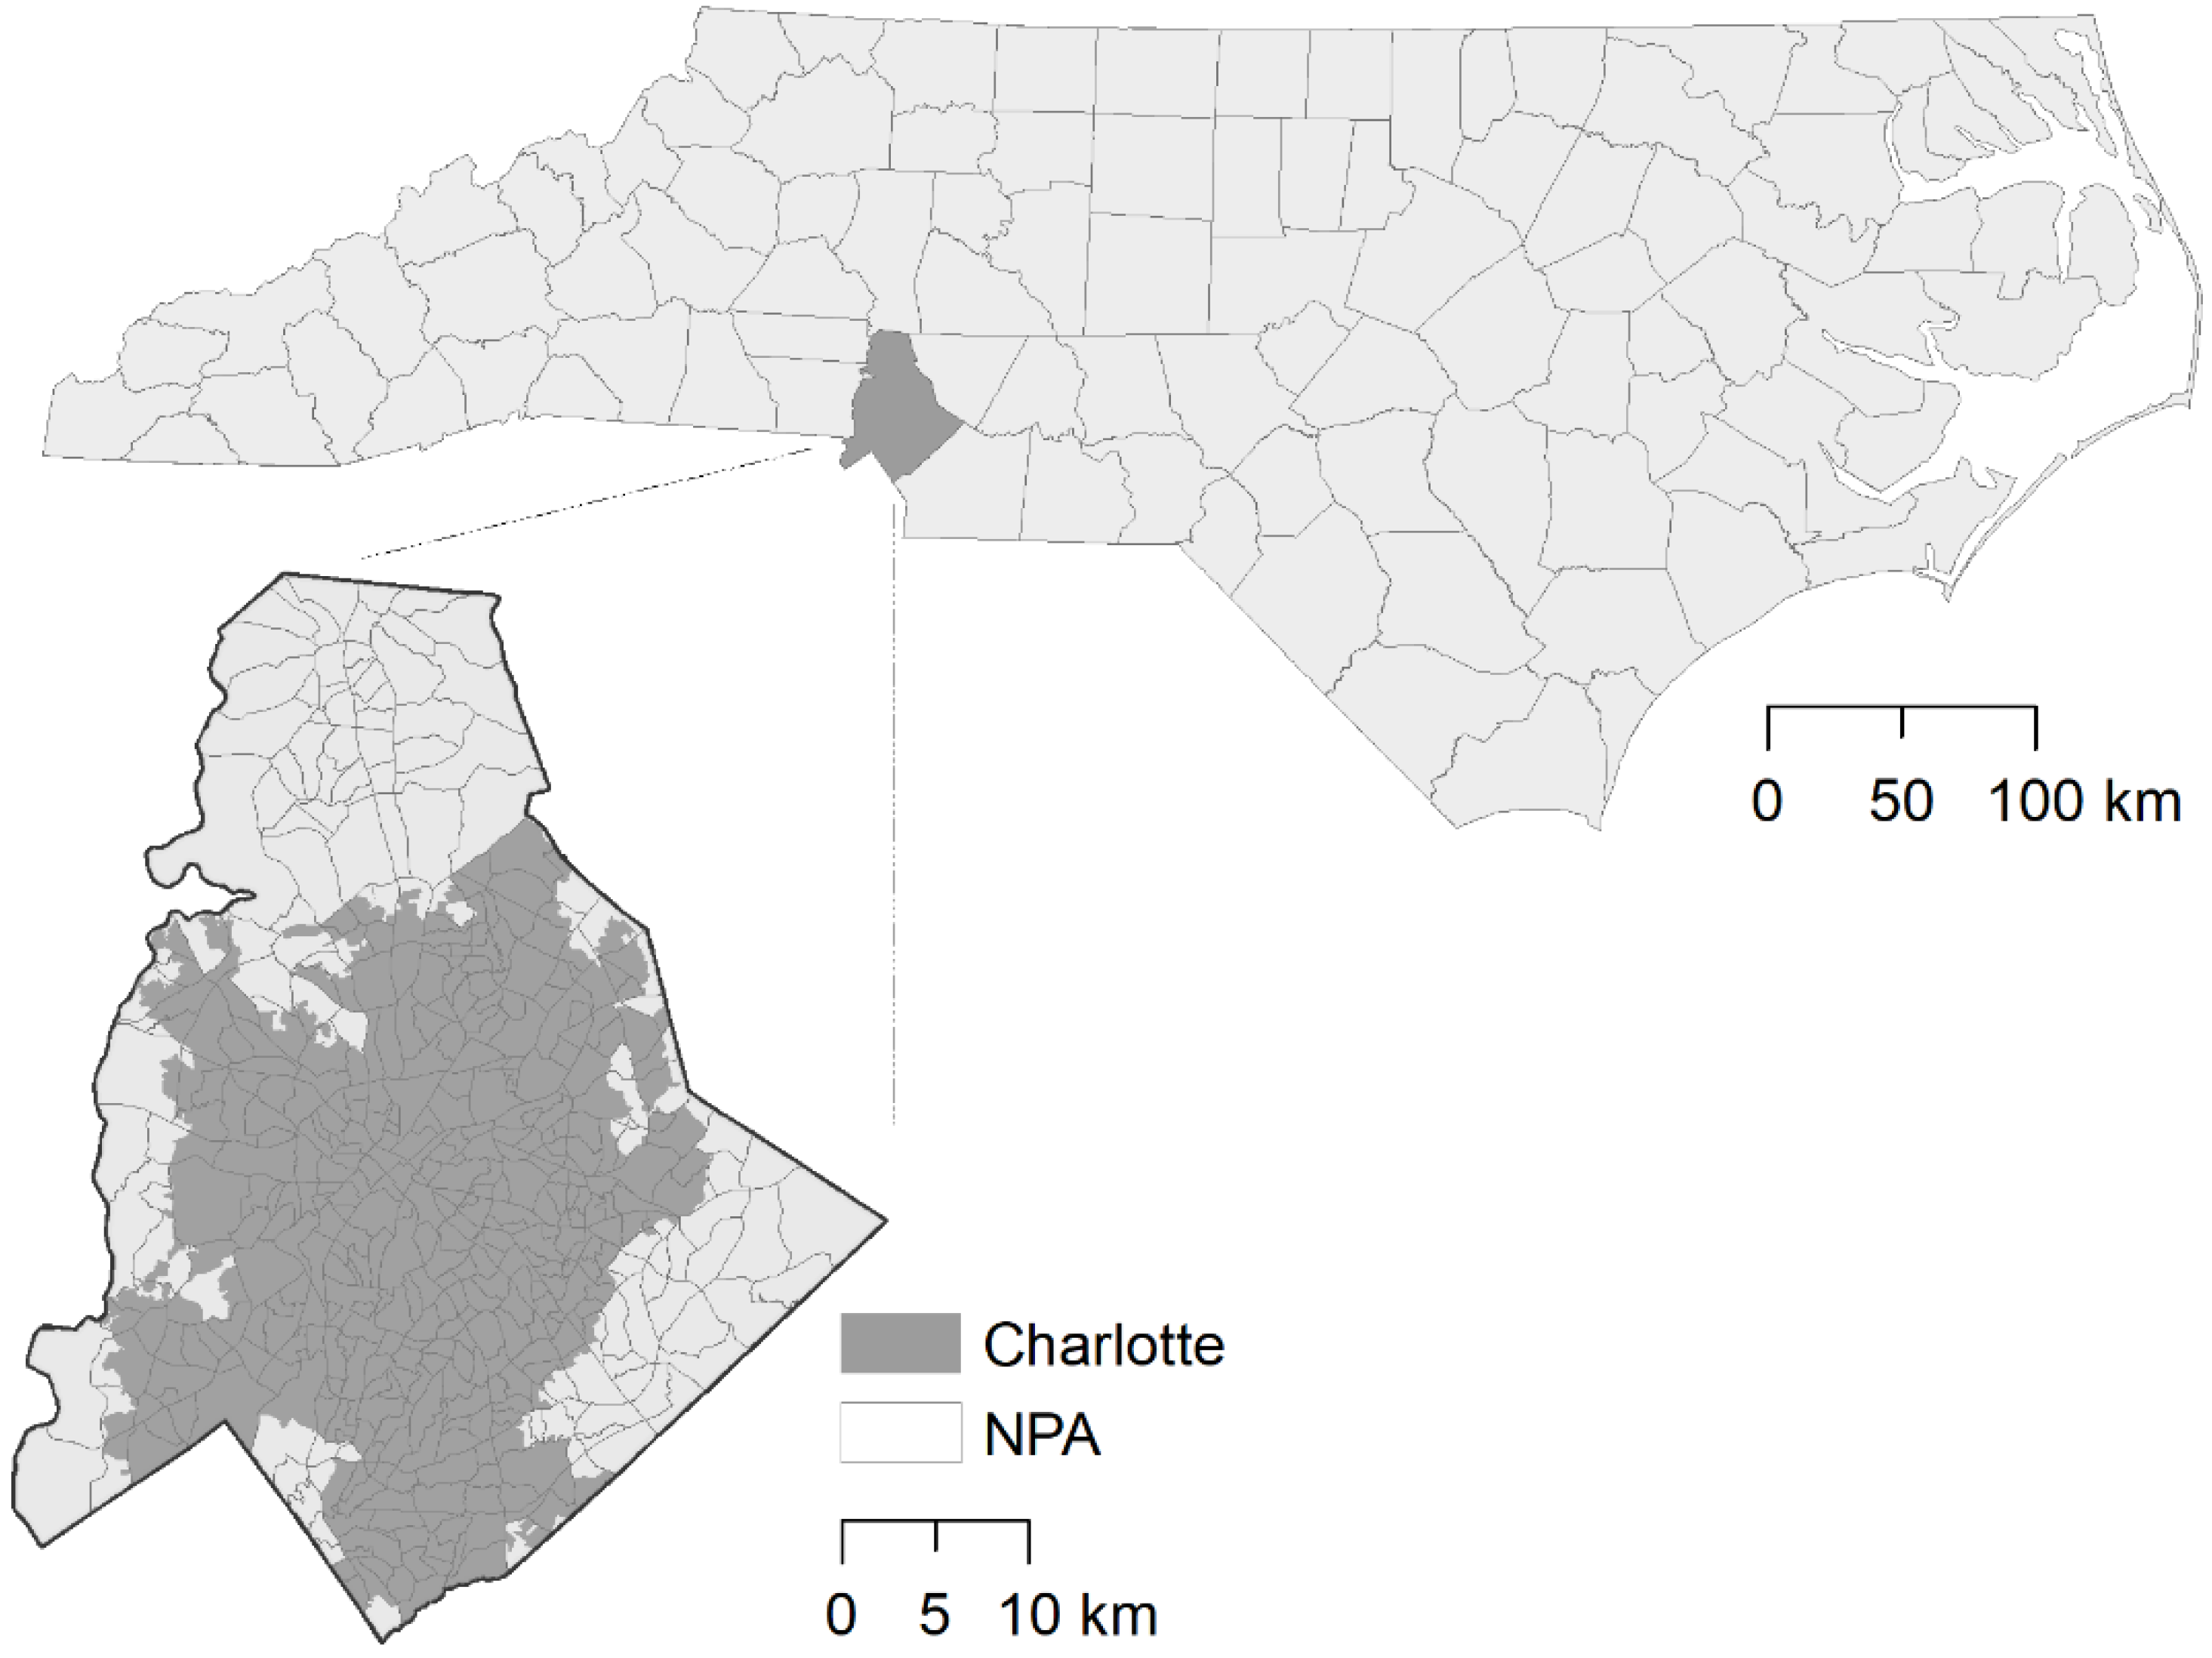
2.1. Study Site
2.2. Trap Location Selection
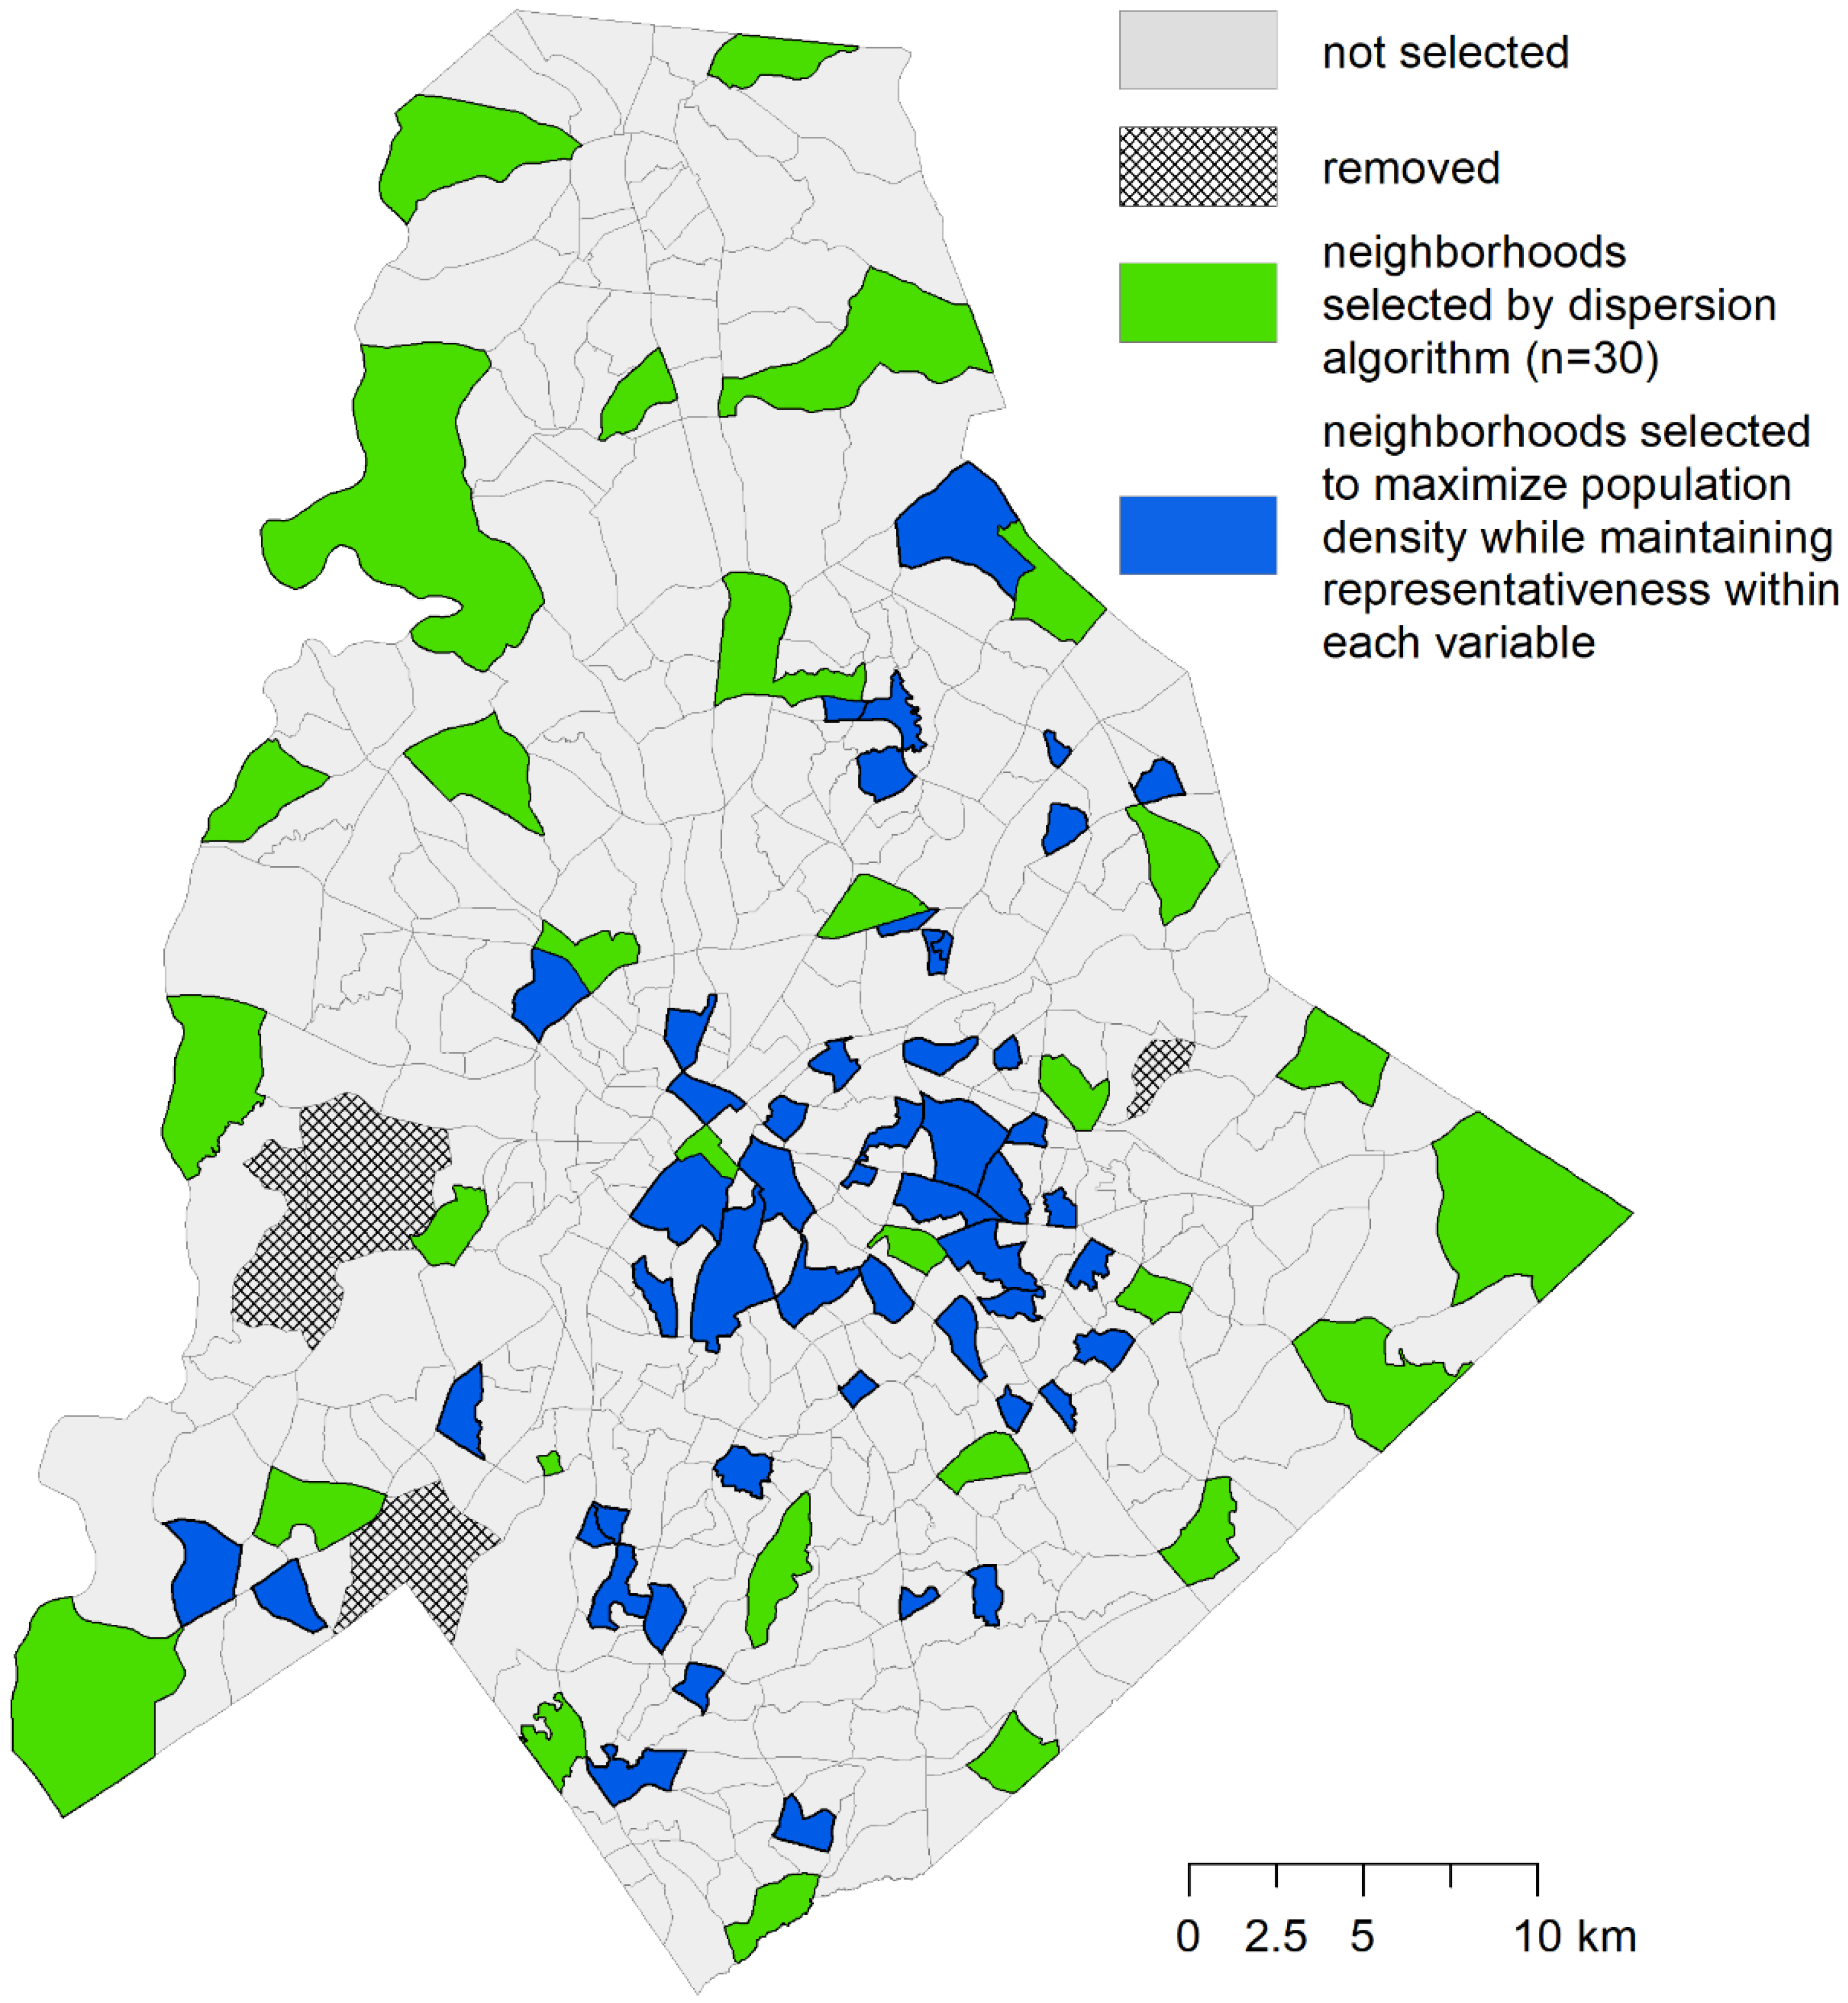
2.3. Optimization Phase 1: P-dispersion
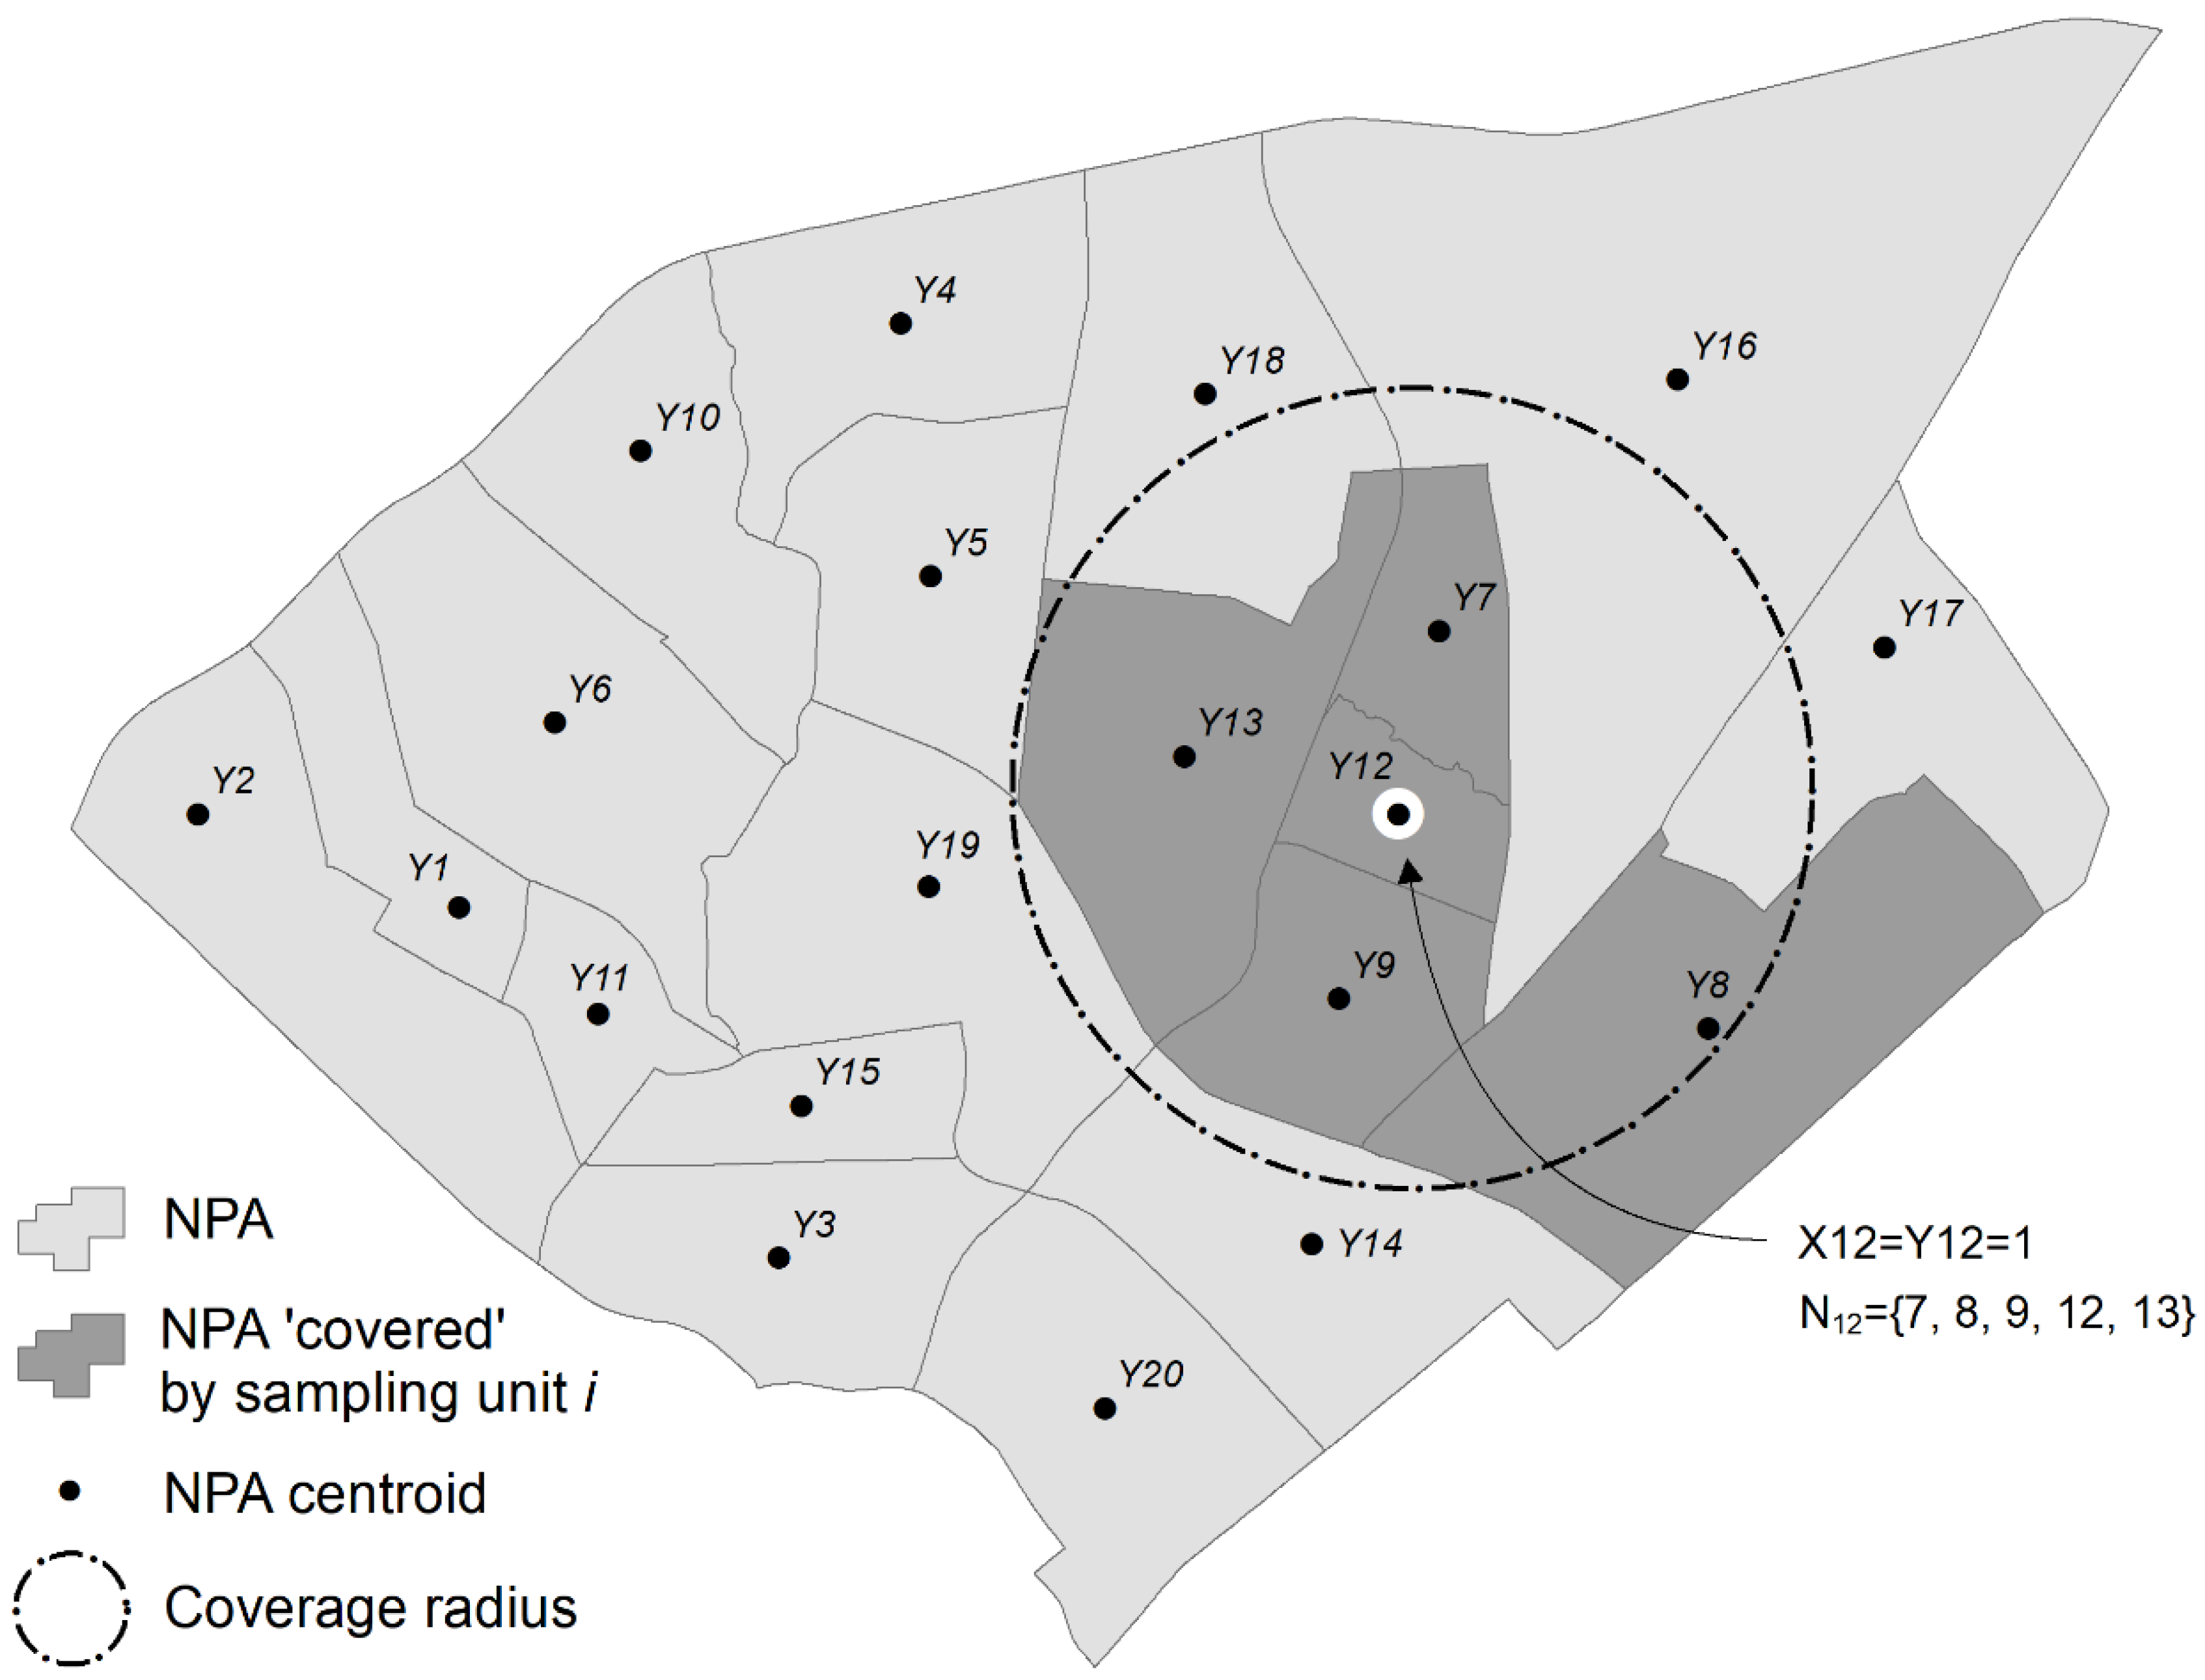
2.4. Optimization Phase 2: Maximal Coverage Approach
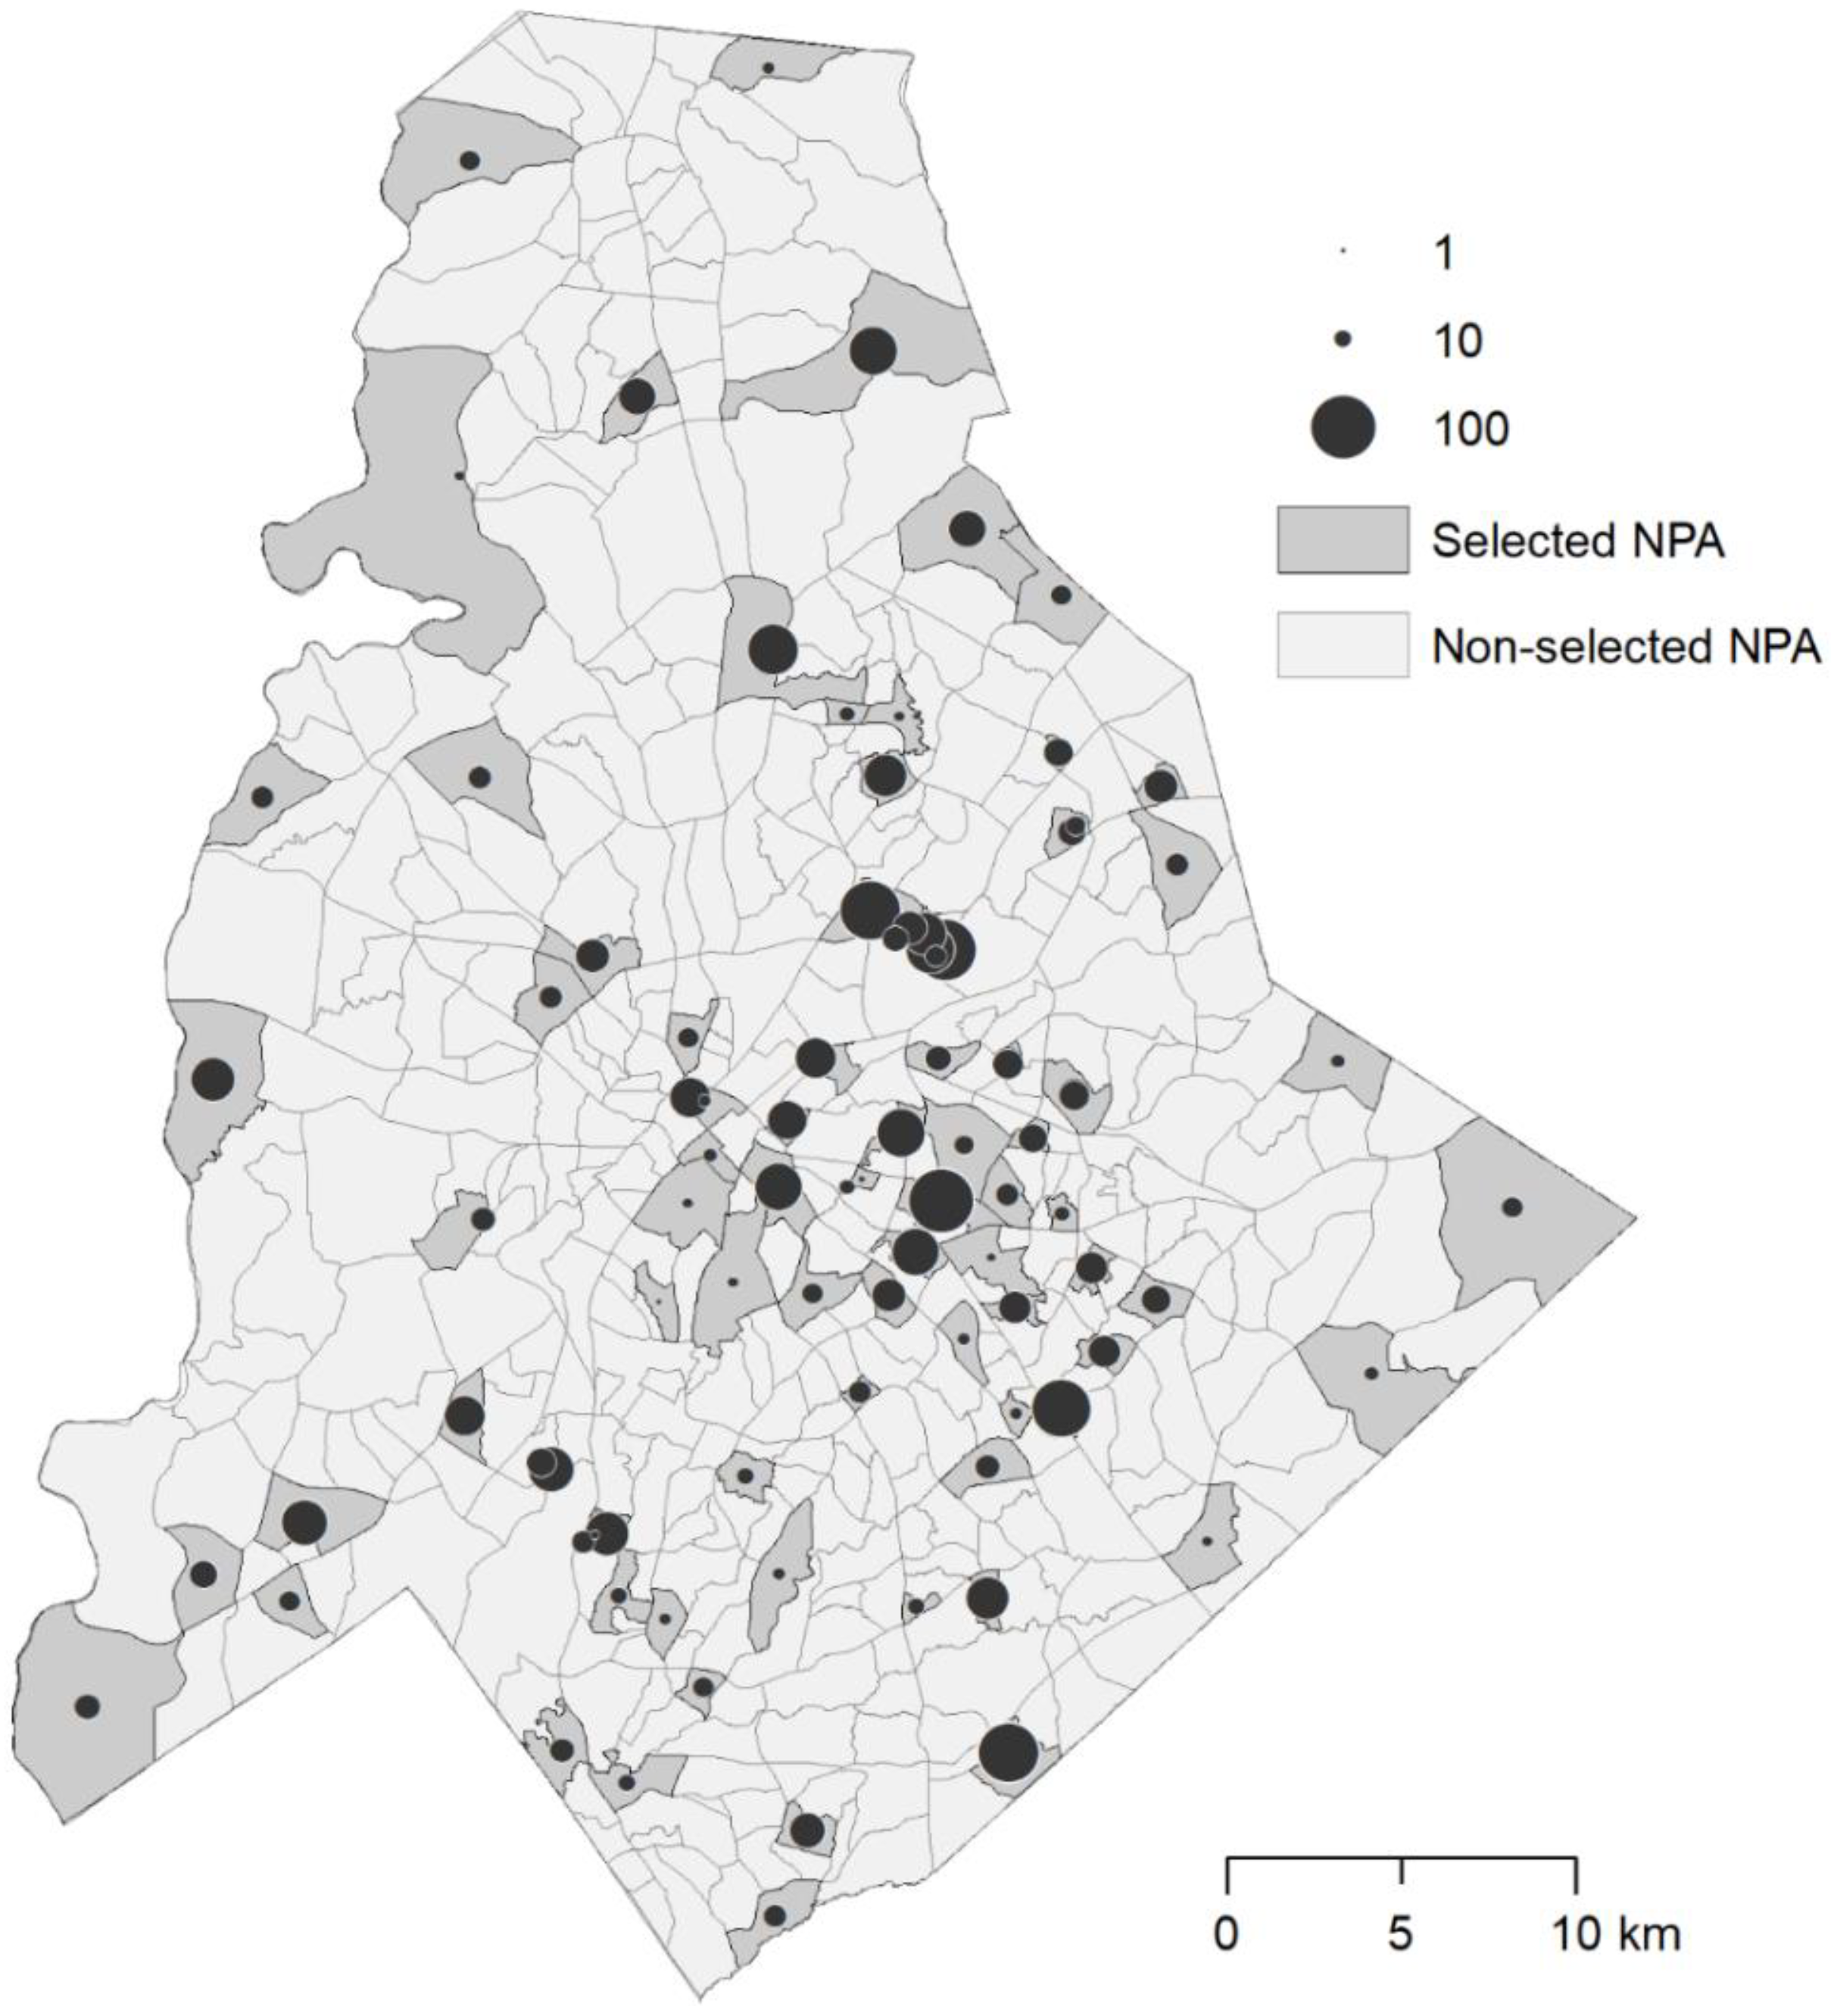
2.5. Entomological Surveys
2.6. Data Analysis
3. Results
4. Discussion
5. Conclusions
Author Contributions
Funding
Conflicts of Interest
References
- Dash, A.P.; Bhatia, R.; Sunyoto, T.; Mourya, D.T. Emerging and re-emerging arboviral diseases in Southeast Asia. J. Vector Borne Dis. 2013, 50, 77–84. [Google Scholar] [PubMed]
- Gubler, D.J. The global emergence/resurgence of arboviral diseases as public health problems. Arch. Med. Res. 2002, 33, 330–342. [Google Scholar] [CrossRef]
- Vasconcelos, P.F.C.; Calisher, C.H. Emergence of Human Arboviral Diseases in the Americas, 2000–2016. Vector-Borne Zoonotic Dis. 2016, 16, 295–301. [Google Scholar] [CrossRef] [PubMed]
- Romanović, M.; Zorić, I. Breeding habitat diversity of medically important mosquitoes and the risk of spreading exotic species in the coastal area of Croatia. Period. Biol. 2006, 108, 15–19. [Google Scholar]
- Seng, C.M.; Jute, N. Breeding of Aedes aegypti (L.) and Aedes albopictus (Skuse) in urban housing of Sibu town, Sarawak. Southeast Asian J. Trop. Med. Public Health 1994, 25, 543–548. [Google Scholar] [PubMed]
- Farjana, T.; Tuno, N. Multiple blood feeding and host-seeking behavior in Aedes aegypti and Aedes albopictus (Diptera: Culicidae). J. Med. Entomol. 2013, 50, 838–846. [Google Scholar] [CrossRef] [PubMed]
- Ponlawat, A.; Harrington, L.C. Blood Feeding Patterns of Aedes aegypti and Aedes albopictus in Thailand. J. Med. Entomol. 2005, 42, 844–849. [Google Scholar] [CrossRef] [PubMed]
- Buckner, E.A.; Blackmore, M.S.; Golladay, S.W.; Covich, A.P. Weather and landscape factors associated with adult mosquito abundance in southwestern Georgia, USA. J. Vector Ecol. 2011, 36, 269–278. [Google Scholar] [CrossRef] [PubMed]
- Richards, S.L.; Ponnusamy, L.; Unnasch, T.R.; Hassan, H.K.; Apperson, C.S. Host-feeding patterns of Aedes albopictus (Diptera: Culicidae) in relation to availability of human ad domestic animals in suburban landscapes of Central North Carolina. J. Med. Entomol. 2006, 43, 543–551. [Google Scholar] [CrossRef] [PubMed]
- Morin, C.W.; Comrie, A.C.; Ernst, K. Climate and dengue transmission: Evidence and implications. Environ. Health Perspect. 2013, 121, 1264–1272. [Google Scholar] [CrossRef] [PubMed]
- Charrel, R.N.; de Lamballerie, X.; Raoult, D. Chikungunya Outbreaks—The Globalization of Vectorborne Diseases. N. Engl. J. Med. 2007, 356, 769–771. [Google Scholar] [CrossRef] [PubMed]
- Tauil, P.L. Urbanization and dengue ecology. Cadernos de Saúde Pública 2001, 17, S99–S102. [Google Scholar]
- Eiras, A.E.; Buhagiar, T.S.; Ritchie, S.A. Development of the Gravid Aedes Trap for the Capture of Adult Female Container-Exploiting Mosquitoes (Diptera: Culicidae). J. Med. Entomol. 2014, 51, 200–209. [Google Scholar] [CrossRef] [PubMed]
- Meeraus, W.H.; Armistead, J.S.; Arias, J.R. Field Comparison of Novel and Gold Standard Traps for Collecting Aedes albopictus in Northern Virginia. J. Am. Mosq. Cont. Control Assoc. 2008, 24, 244–248. [Google Scholar] [CrossRef] [PubMed]
- Norzahira, R.; Hidayatulfathi, O.; Wong, H.M.; Cheryl, A.; Firdaus, R.; Chew, H.S.; Lim, K.W.; Sing, K.W.; Mahathavan, M.; Nazni, W.A.; et al. Ovitrap surveillance of the dengue vectors, Aedes (Stegomyia) aegypti (L.) and Aedes (Stegomyia) albopictus skuse in selected areas in Bentong, Pahang, Malaysia. Trop. Biomed. 2011, 28, 48–54. [Google Scholar] [PubMed]
- Wong, J.; Bayoh, N.; Olang, G.; Killeen, G.F.; Hamel, M.J.; Vulule, J.M.; Gimnig, J.E. Standardizing operational vector sampling techniques for measuring malaria transmission intensity: evaluation of six mosquito collection methods in western Kenya. Malar. J. 2013, 12, 143. [Google Scholar] [CrossRef] [PubMed]
- Ritchie, S.A.; Buhagiar, T.S.; Townsend, M.; Hoffmann, A.; Van Den Hurk, A.F.; McMahon, J.L.; Eiras, A.E. Field validation of the gravid Aedes trap (GAT) for collection of Aedes aegypti (Diptera: Culicidae). J. Med. Entomol. 2014, 51, 210–219. [Google Scholar] [CrossRef] [PubMed]
- Facchinelli, L.; Valerio, L.; Pombi, M.; Reiter, P.; Costantini, C.; Della Torre, A. Development of a novel sticky trap for container-breeding mosquitoes and evaluation of its sampling properties to monitor urban populations of Aedes albopictus. Med. Vet. Entomol. 2007, 21, 183–195. [Google Scholar] [CrossRef] [PubMed]
- Dia, I.; Diallo, D.; Duchemin, J.-B.; Ba, Y.; Konate, L.; Costantini, C.; Diallo, M. Comparisons of human-landing catches and odor-baited entry traps for sampling malaria vectors in Senegal. J. Med. Entomol. 2005, 42, 104–109. [Google Scholar] [CrossRef] [PubMed]
- Hii, J.L.K.; Smith, T.; Mai, A.; Ibam, E.; Alpers, M.P. Comparison between anopheline mosquitoes (Diptera: Culicidae) caught using different methods in a malaria endemic area of Papua New Guinea. Bull. Entomol. Res. 2000, 90, 211–219. [Google Scholar] [CrossRef] [PubMed]
- Degener, C.M.; Azara, T.; Roque, R.A.; Codeco, C.T.; Nobre, A.A.; Ohly, J.J.; Geier, M.; Eiras, A.E. Temporal abundance of Aedes aegypti in Manaus, Brazil, measured by two trap types for adult mosquitoes. Mem. Inst. Oswaldo Cruz 2014, 109, 1030–1040. [Google Scholar] [CrossRef] [PubMed]
- Chansang, C.; Kittayapong, P. Application of mosquito sampling count and geospatial methods to improve dengue vector surveillance. Am. J. Trop. Med. Hyg. 2007, 77, 897–902. [Google Scholar] [CrossRef]
- Silver, J.B. Mosquito Ecology—Field Sampling Methods, Third Edition. Available online: http://www.springer.com/gp/book/9781402066658 (accessed on 1 September 2018).
- Morrison, A.C.; Astete, H.; Chapilliquen, F.; Ramirez-Prada, C.; Diaz, G.; Getis, A.; Gray, K.; Scott, T.W. Evaluation of a sampling methodology for rapid assessment of Aedes aegypti infestation levels in Iquitos, Peru. J. Med. Entomol. 2004, 41, 502–510. [Google Scholar] [CrossRef] [PubMed]
- Sanchez, L.; Cortinas, J.; Pelaez, O.; Gutierrez, H.; Concepción, D.; Van Der Stuyft, P. Breteau Index threshold levels indicating risk for dengue transmission in areas with low Aedes infestation. Trop. Med. Int. Heal. 2010, 15, 173–175. [Google Scholar] [CrossRef] [PubMed]
- Vezzani, D.; Albicócco, A.P. The effect of shade on the container index and pupal productivity of the mosquitoes Aedes aegypti and Culex pipiens breeding in artificial containers. Med. Vet. Entomol. 2009, 23, 78–84. [Google Scholar] [CrossRef] [PubMed]
- Saleeza, S.N.R.; Norma-Rashid, Y.; Sofian-Azirun, M. Mosquitoes Larval Breeding Habitat in Urban and Suburban Areas, Peninsular Malaysia. Int. J. Biol. Vet. Agric. Food Eng. 2011, 5, 72–76. [Google Scholar]
- Bartlett-Healy, K.; Unlu, I.; Obenauer, P.J.; Hughes, T.H.; Healy, S.P.; Crepeau, T.N.; Farajollahi, A.; Kesavaraju, B.; Fonseca, D.M.; Schoeler, G.; et al. Larval mosquito habitat utilization and community dynamics of Aedes albopictus and Aedes japonicus (Diptera: Culicidae). J. Med. Entomol. 2012, 49, 813–824. [Google Scholar] [CrossRef]
- Becker, B.; Leisnham, P.T.; LaDeau, S.L. A tale of two city blocks: Differences in immature and adult mosquito abundances between socioeconomically different urban blocks in Baltimore (Maryland, USA). Int. J. Environ. Res. Public Health 2014, 11, 3256–3270. [Google Scholar] [CrossRef] [PubMed]
- LaDeau, S.L.; Leisnham, P.T.; Biehler, D.; Bodner, D. Higher mosquito production in low-income neighborhoods of Baltimore and Washington, DC: Understanding ecological drivers and mosquito-borne disease risk in temperate cities. Int. J. Environ. Res. Public Health 2013, 10, 1505–1526. [Google Scholar] [CrossRef]
- Tsuda, Y.; Suwonkerd, W.; Chawprom, S.; Prajakwong, S.; Takagi, M. Different spatial distribution of Aedes aegypti and Aedes albopictus along an urban-rural gradient and the relating environmental factors examined in three villages in northern Thailand. J. Am. Mosq. Control Assoc. 2006, 22, 222–228. [Google Scholar] [CrossRef]
- Rozilawati, H.; Zairi, J.; Adanan, C.R. Seasonal abundance of Aedes albopictus in selected urban and suburban areas in Penang, Malaysia. Trop. Biomed. 2007, 24, 83–94. [Google Scholar] [PubMed]
- Moore, C.G.; Cline, B.L.; Ruiz-Tiben, E.; Lee, D.; Romney-Joseph, H.; Rivera-Correa, E. Aedes aegypti in Puerto Rico: Environmental determinants of larval abundance and relation to dengue virus transmission. Am. J. Trop. Med. Hyg. 1978, 27, 1225–1231. [Google Scholar] [CrossRef] [PubMed]
- Bagny Beilhe, L.; Arnoux, S.; Delatte, H.; Lajoie, G.; Fontenille, D. Spread of invasive Aedes albopictus and decline of resident Aedes aegypti in urban areas of Mayotte 2007-2010. Biol. Invasions 2012, 14, 1623–1633. [Google Scholar] [CrossRef]
- Pickett, S.T.A.; Cadenasso, M.L.; Grove, J.M.; Boone, C.G.; Groffman, P.M.; Irwin, E.; Kaushal, S.S.; Marshall, V.; McGrath, B.P.; Nilon, C.H.; et al. Urban ecological systems: Scientific foundations and a decade of progress. J. Environ. Manag. 2011, 92, 331–362. [Google Scholar] [CrossRef] [PubMed]
- Salat, S.; Bourdic, L.; Nowacki, C. Assessing Urban Complexity. Int. J. Sustain. Build. Technol. Urban Dev. 2010, 1, 160–167. [Google Scholar] [CrossRef]
- Rydin, Y.; Bleahu, A.; Davies, M.; Dávila, J.D.; Friel, S.; De Grandis, G.; Groce, N.; Hallal, P.C.; Hamilton, I.; Howden-Chapman, P.; et al. Shaping cities for health: Complexity and the planning of urban environments in the 21st century. Lancet 2012, 379, 2079–2108. [Google Scholar] [CrossRef]
- Carbajo, A.E.; Curto, S.I.; Schweigmann, N.J. Spatial distribution pattern of oviposition in the mosquito Aedes aegypti in relation to urbanization in Buenos Aires: southern fringe bionomics of an introduced vector. Med. Vet. Entomol. 2006, 20, 209–218. [Google Scholar] [CrossRef] [PubMed]
- Walker, K.R.; Joy, T.K.; Ellers-Kirk, C.; Ramberg, F.B. Human and Environmental Factors Affecting Aedes aegypti Distribution in an Arid Urban Environment. J. Am. Mosq. Control Assoc. 2011, 27, 135–141. [Google Scholar] [CrossRef] [PubMed]
- Keating, J.; Macintyre, K.; Mbogo, C.; Githeko, A.; Regens, J.L.; Swalm, C.; Ndenga, B.; Steinberg, L.J.; Kibe, L.; Githure, J.I.; et al. A geographic sampling strategy for studying relationships between human activity and malaria vectors in urban Africa. Am. J. Trop. Med. Hyg. 2003, 68, 357–365. [Google Scholar] [CrossRef] [PubMed]
- Ageep, T.B.; Cox, J.; Hassan, M.M.; Knols, B.G.J.; Benedict, M.Q.; Malcolm, C.A.; Babiker, A.; El Sayed, B.B. Spatial and temporal distribution of the malaria mosquito Anopheles arabiensis in northern Sudan: influence of environmental factors and implications for vector control. Malar. J. 2009, 8, 123. [Google Scholar] [CrossRef] [PubMed]
- Delatte, H.; Dehecq, J.S.; Thiria, J.; Domerg, C.; Paupy, C.; Fontenille, D. Geographic distribution and developmental sites of Aedes albopictus (Diptera: Culicidae) during a Chikungunya epidemic event. Vector Borne Zoonotic Dis. 2008, 8, 25–34. [Google Scholar] [CrossRef] [PubMed]
- Unlu, I.; Farajollahi, A.; Healy, S.P.; Crepeau, T.; Bartlett-Healy, K.; Williges, E.; Strickman, D.; Clark, G.G.; Gaugler, R.; Fonseca, D.M. Area-wide management of Aedes albopictus: Choice of study sites based on geospatial characteristics, socioeconomic factors and mosquito populations. Pest Manag. Sci. 2011, 67, 965–974. [Google Scholar] [CrossRef] [PubMed]
- Southeast Regional Climate Center. Available online: http://www.sercc.com/ (accessed on 1 September 2018).
- Kraemer, M.U.G.; Sinka, M.E.; Duda, K.A.; Mylne, A.; Shearer, F.M.; Barker, C.M.; Moore, C.G.; Carvalho, R.G.; Coelho, G.E.; Van Bortel, W.; et al. The global distribution of the arbovirus vectors Aedes aegypti and Ae. albopictus. Elife 2015, 4, e08347. [Google Scholar] [CrossRef] [PubMed]
- United States Census Bureau. Population and Housing Unit Estimates 2010. Available online: https://www.census.gov/programs-surveys/popest.html (accessed on 1 September 2018).
- Cohen, D.T.; Hatchard, G.W.; Wilson, S.G. Population trends in incorporated places: 2000 to 2013. Available online: https://www.census.gov/content/dam/Census/library/publications/2015/demo/p25-1142.pdf (accessed on 1 September 2018).
- Chetty, R.; Hendren, N.; Kline, P.; Saez, E. Where is the land of Opportunity? The Geography of Intergenerational Mobility in the United States. Q. J. Econ. 2014, 129, 1553–1623. [Google Scholar] [CrossRef]
- World Bank. The World Bank GINI Index (World Bank Estimate). 2015. Available online: https://data.worldbank.org/indicator/si.pov.gini (accessed on 1 September 2018).
- Charlotte Quality of Life Explorer 2017. Available online: https://mcmap.org/qol/ (accessed on 1 September 2018).
- United States Department of Health and Human Services. Public Health Service Centers for Disease Control and Prevention (CDC) Atlanta, GA 30333. Prevention 2003, 52, 1–2. [Google Scholar]
- Faul, F.; ErdFelder, E.; Lang, A.-G.; Buchner, A. Statistical power analyses using G*Power 3.1: Tests for correlation and regression analyses. Behav. Res. Methods 2009, 41, 1149–1160. [Google Scholar] [CrossRef] [PubMed]
- Delmelle, E.M.; Goovaerts, P. Second-phase sampling designs for non-stationary spatial variables. Geoderma 2009, 153, 205–216. [Google Scholar] [CrossRef] [PubMed]
- Dowling, Z.; Armbruster, P.; Ladeau, S.L.; Decotiis, M.; Mottley, J.; Leisnham, P.T. Linking mosquito infestation to resident socioeconomic status, knowledge, and source reduction practices in Suburban Washington, DC. Ecohealth 2013, 10, 36–47. [Google Scholar] [CrossRef] [PubMed]
- Megahed, Y.; Cabral, P.; Silva, J.; Caetano, M. Land Cover Mapping Analysis and Urban Growth Modelling Using Remote Sensing Techniques in Greater Cairo Region—Egypt. ISPRS Int. J. Geo-Inf. 2015, 4, 1750–1769. [Google Scholar] [CrossRef]
- Kuby, M.J. Programming models for facility dispersion: The p-dispersion and maxisum dispersion problems. Geogr. Anal. 1987, 19, 315–329. [Google Scholar] [CrossRef]
- Church, R.; ReVelle, C. The maximal covering location problem. Pap. Region. Sci 1974, 32, 101–108. [Google Scholar] [CrossRef]
- Little, E.; Biehler, D.; Leisnham, P.T.; Jordan, R.; Wilson, S.; Ladeau, S.L. Socio-Ecological Mechanisms Supporting High Densities of Aedes albopictus (Diptera: Culicidae) in Baltimore, MD. J. Med. Entomol. 2017, 54, 1183–1192. [Google Scholar] [CrossRef] [PubMed]
- CPLEX, I.I. User’s Manual for CPLEX. Man. CPLEX 2009. Available online: https://www.ibm.com/support/knowledgecenter/SSSA5P_12.6.2/ilog.odms.studio.help/pdf/usrcplex.pdf (accessed on 1 September 2018).
- Arimoto, H.; Harwood, J.F.; Nunn, P.J.; Richardson, A.G.; Gordon, S.; Obenauer, P.J. Comparison of Trapping Performance Between the Original BG-Sentinel® Trap and BG-Sentinel 2® Trap1. J. Am. Mosq. Control Assoc. 2015, 31, 384–387. [Google Scholar] [CrossRef] [PubMed]
- Maciel-de-Freitas, R.; Eiras, Á.E.; Lourenço-de-Oliveira, R. Field evaluation of effectiveness of the BG-Sentinel, a new trap for capturing adult Aedes aegypti (Diptera: Culicidae). Mem. Inst. Oswaldo Cruz 2006, 101, 321–325. [Google Scholar] [CrossRef] [PubMed]
- Lourenço-de-Oliveira, R.; Lima, J.B.P.; Peres, R.; da Costa Alves, F.; Eiras, Á.E.; Codeço, C.T. Comparison of Different Uses of Adult Traps and Ovitraps for Assessing Dengue Vector Infestation in Endemic Areas. J. Am. Mosq. Control Assoc. 2008, 24, 387–392. [Google Scholar] [CrossRef] [PubMed]
- Mackay, A.; Amador, M.; Barrera, R. An improved autocidal gavid ovitrap for the control and surveillance of Aedes aegypti. Parasit. Vectors 2013, 6, 225. [Google Scholar] [CrossRef] [PubMed]
- Potter, M. Identification key to the genera of adult mosquitoes for the world 2017. Walter Reed Biosystematics Units. Available online: http://www.wrbu.org/mqID/keysMQZoogeo.html (accessed on 1 September 2018).
- NOAA National Weather Forcasting Service. Available online: https://w2.weather.gov/climate/index.php?wfo=gsp (accessed on 1 September 2018).
- Mccullagh, P.; Nelder, J. Generalized Linear Models, 2nd ed.; CRC Press: London, UK, 1972; p. 37. [Google Scholar]
- Honório, N.A.; Codeço, C.T.; Alves, F.C.; Magalhães, M.A.F.M.; Lourenço-De-Oliveira, R. Temporal distribution of Aedes aegypti in different districts of Rio de Janeiro, Brazil, measured by two types of traps. J. Med. Entomol. 2009, 46, 1001–1114. [Google Scholar]
- Yoo, E.-H. Site-specific prediction of West Nile virus mosquito abundance in Greater Toronto Area using generalized linear mixed models. Int. J. Geogr. Inf. Sci. 2014, 28, 296–313. [Google Scholar] [CrossRef]
- Velo, E.; Kadriaj, P.; Mersini, K.; Shukullari, A.; Manxhari, B.; Simaku, A.; Hoxha, A.; Caputo, B.; Bolzoni, L.; Rosà, R.; et al. Enhancement of Aedes albopictus collections by ovitrap and sticky adult trap. Parasites Vectors 2016, 9, 223. [Google Scholar] [CrossRef] [PubMed]
- Wang, J.; Ogden, N.H.; Zhu, H. The Impact of Weather Conditions on Culex pipiens and Culex restuans (Diptera: Culicidae) Abundance: A Case Study in Peel Region. J. Med. Entomol. 2011, 48, 468–475. [Google Scholar] [CrossRef]
- McGarigal, K.; Cushman, S.A.; Ene, E. FRAGSTATS v4: Spatial Pattern Analysis Program for Categorical and Continuous Maps. Computer Software Program Produced by the Authors at the University of Massachusetts, Amherst. Available online: http://www.umass.edu/landeco/research/fragstats/fragstats.html (accessed on 1 September 2018).
- LaCon, G.; Morrison, A.C.; Astete, H.; Stoddard, S.T.; Paz-Soldan, V.A.; Elder, J.P.; Halsey, E.S.; Scott, T.W.; Kitron, U.; Vazquez-Prokopec, G.M. Shifting Patterns of Aedes aegypti Fine Scale Spatial Clustering in Iquitos, Peru. PLoS Negl. Trop. Dis. 2014, 8, e3083. [Google Scholar] [CrossRef] [PubMed]
- Schafrick, N.H.; Milbrath, M.O.; Berrocal, V.J.; Wilson, M.L.; Eisenberg, J.N.S. Spatial clustering of Aedes aegypti related to breeding container characteristics in coastal Ecuador: Implications for dengue control. Am. J. Trop. Med. Hyg. 2013, 89, 758–765. [Google Scholar] [CrossRef] [PubMed]
- Daniels, B. CROSSFOLD: Stata Module to Perform K-Fold Cross-Validation. Available online: https://econpapers.repec.org/software/bocbocode/s457426.htm (accessed on 1 September 2018).
- Quintero, J.; Carrasquilla, G.; Suárez, R.; González, C.; Olano, V.A. An ecosystemic approach to evaluating ecological, socioeconomic and group dynamics affecting the prevalence of Aedes aegypti in two Colombian towns. Cadernos de Saude Publica 2009, 25, 93–103. [Google Scholar] [CrossRef]
- Ruiz, M.O.; Tedesco, C.; McTighe, T.J.; Austin, C.; Uriel, K. Environmental and social determinants of human risk during a West Nile virus outbreak in the greater Chicago area, 2002. Int. J. Health Geogr. 2004, 3, 8. [Google Scholar] [CrossRef] [PubMed]
- Kutz, F.W.; Wade, T.G.; Pagac, B.B. A geospatial study of the potential of two exotic species of mosquitoes to impact the epidemiology of West Nile virus in Maryland. J. Am. Mosq. Control Assoc. 2003, 3, 190–198. [Google Scholar]
- Reisen, W.K.; Takahashi, R.M.; Carroll, B.D.; Quiring, R. Delinquent mortgages, neglected swimming pools, and West Nile virus, California. Emerg. Infect. Dis. 2008, 14, 1747–1749. [Google Scholar] [CrossRef]
- Banerjee, S.; Aditya, G.; Saha, G.K. Household disposables as breeding habitats of dengue vectors: Linking wastes and public health. Waste Manag. 2013, 33, 233–239. [Google Scholar] [CrossRef]
- Farajollahi, A.; Fonseca, D.; Kramer, L.; Kilpatric, A.M. ‘Bird Biting’ mosquitoes and human disease: A review of the role of Culex pipiens complex mosquitoes in epipdemiology. Infect. Genet. Evol. 2011, 11, 1577–1585. [Google Scholar] [CrossRef] [PubMed]
- Dowling, Z.; Ladeau, S.L.; Armbruster, P.; Biehler, D.; Leisnham, P.T.; Dowling, Z.; Ladeau, S.L.; Armbruster, P.; Biehler, D. Socioeconomic Status Affects Mosquito (Diptera: Culicidae) Larval Habitat Type Availability and Infestation Level. J. Med. Entomol. 2013, 50, 764–772. [Google Scholar] [CrossRef] [PubMed]
- Winkleby, M.A.; Jatulis, D.E.; Frank, E.; Fortmann, S.P. Socioeconomic status and health: How education, income, and occupation contribute to risk factors for cardiovascular disease. Am. J. Public Health 1992, 82, 816–820. [Google Scholar] [CrossRef] [PubMed]
- Kjellstrom, T.; Friel, S.; Dixon, J.; Corvalan, C.; Rehfuess, E.; Campbell-Lendrum, D.; Gore, F.; Bartram, J. Urban environmental health hazards and health equity. J. Urban Health 2007, 84, i86–i97. [Google Scholar] [CrossRef] [PubMed]
- Portney, P.R. Housing prices, health effects, and valuing reductions in risk of death. J. Environ. Econ. Manag. 1981, 8, 72–78. [Google Scholar] [CrossRef]
- Rochlin, I.; Turbow, D.; Gomez, F.; Ninivaggi, D.V.; Campbell, S.R. Predictive mapping of human risk for west nile virus (WNV) based on environmental and socioeconomic factors. PLoS ONE 2011, 8, e23280. [Google Scholar] [CrossRef] [PubMed]
- Lockaby, G.; Noori, N.; Morse, W.; Zipperer, W.; Kalin, L.; Governo, R.; Sawant, R.; Ricker, M. Climatic, ecological, and socioeconomic factors associated with West Nile virus incidence in Atlanta, Georgia, U.S.A. J. Vector Ecol. 2016, 41, 232–243. [Google Scholar] [CrossRef] [PubMed]
- Liu, H.; Weng, Q.; Gaines, D. Geographic incidence of human West Nile virus in northern Virginia, USA, in relation to incidence in birds and variations in urban environment. Sci. Total Environ. 2011. [Google Scholar] [CrossRef] [PubMed]
- Rios, J.; Hacker, C.S.; Hailey, C.A.; Parsons, R.E. Demographic and spatial analysis of West Nile virus and St. Louis encephalitis in Houston, Texas. J. Am. Mosq. Control Assoc. 2006, 22, 254–263. [Google Scholar] [CrossRef]
- Kikuti, M.; Cunha, G.M.; Paploski, I.A.D.; Kasper, A.M.; Silva, M.M.O.; Tavares, A.S.; Cruz, J.S.; Queiroz, T.L.; Rodrigues, M.S.; Santana, P.M.; et al. Spatial distribution of dengue in a Brazilian Urban slum setting: Role of socioeconomic gradient in disease risk. PLoS Negl. Trop. Dis. 2015, 7, e0003937. [Google Scholar] [CrossRef] [PubMed]
- Delmelle, E.; Hagenlocher, M.; Kienberger, S.; Casas, I. A spatial model of socioeconomic and environmental determinants of dengue fever in Cali, Colombia. Acta Tropica 2016, 164, 169–176. [Google Scholar] [CrossRef] [PubMed]
- Harrington, L.C.; Edman, J.D.; Scott, T.W. Why do female Aedes aegypti (Diptera: Culicidae) feed preferentially and frequently on human blood? J. Med. Entomol. 2001, 38, 411–422. [Google Scholar] [CrossRef] [PubMed]
- Ayyamani, U.D.; Ying, G.C.; San, O.G. A knowledge attitude and practice (KAP) study on dengue/dengue haemorrhagic fever and the Aedes mosquitoes. Med. J. Malaysia 1986, 41, 108–115. [Google Scholar]
- Hairi, F.; Ong, C.H.S.; Suhaimi, A.; Tsung, T.W.; Bin Anis Ahmad, M.A.; Sundaraj, C.; Soe, M.M. A Knowledge, Attitude and Practices (KAP) Study on Dengue among Selected Rural Communities in the Kuala Kangsar District. Asia-Pacific J. Public Heal. 2003, 15, 37–43. [Google Scholar] [CrossRef] [PubMed]
- Launiala, A. How much can a KAP survey tell us about people’s knowledge, attitudes and practices? Some observations from medical anthropology research on malaria in pregnancy in Malawi. Anthropol. Matters J. 2009, 11, 1–13. [Google Scholar]
- Vanwambeke, S.O.; Somboon, P.; Harbach, R.E.; Isenstadt, M.; Lambin, E.F.; Walton, C.; Butlin, R.K. Landscape and land cover factors influence the presence of Aedes and Anopheles larvae. J. Med. Entomol. 2007, 44, 133–144. [Google Scholar] [CrossRef] [PubMed]
- Vanwambeke, S.O.; Bennett, S.N.; Kapan, D.D. Spatially disaggregated disease transmission risk: Land cover, land use and risk of dengue transmission on the island of Oahu. Trop. Med. Int. Heal. 2011, 16, 174–185. [Google Scholar] [CrossRef] [PubMed]
- Chuang, T.-W.; Hildreth, M.B.; Vanroekel, D.L.; Wimberly, M.C. Weather and Land Cover Influences on Mosquito Populations in Sioux Falls, South Dakota. J. Med. Entomol. 2011. [Google Scholar] [CrossRef]
- Johnson, M.F.; Gómez, A.; Pinedo-Vasquez, M. Land Use and Mosquito Diversity in the Peruvian Amazon. J. Med. Entomol. 2008, 45, 1023. [Google Scholar] [CrossRef] [PubMed]
- Chaves, L.F.; Hamer, G.L.; Walker, E.D.; Brown, W.M.; Ruiz, M.O.; Kitron, U.D. Climatic variability and landscape heterogeneity impact urban mosquito diversity and vector abundance and infection. Ecosphere 2011, 2, 1–21. [Google Scholar] [CrossRef]
- Norris, D.E. Mosquito-borne Diseases as a Consequence of Land Use Change. Ecohealth 2004, 1, 19–24. [Google Scholar] [CrossRef]
- Vanwambeke, S.O.; Lambin, E.F.; Eichhorn, M.P.; Flasse, S.P.; Harbach, R.E.; Oskam, L.; Somboon, P.; Van Beers, S.; Van Benthem, B.H.B.; Walton, C.; et al. Impact of land-use change on dengue and malaria in northern Thailand. Ecohealth. 2007, 4, 37–51. [Google Scholar] [CrossRef]


| Variable | Q1 | Q2 | Q3 | Q4 | Q5 |
|---|---|---|---|---|---|
| Socioeconomic Status | [0–0.305) | [0.305–0.401) | [0.401–0.491) | [0.491–0.603) | [0.603–1) |
| 19 | 22 | 16 | 16 | 17 | |
| Population density | [0–0.0645) | [0.0645–0.129) | [0.129–0.161) | [0.161–0.225) | [0.225–1) |
| 18 | 18 | 5 | 15 | 34 | |
| Employment rate | [0–0.708) | [0.708–0.810) | [0.810–0.856) | [0.856–0.916) | [0.916–1) |
| 20 | 16 | 18 | 22 | 14 | |
| Tree canopy cover | [0–0.388) | [0.388–0.508) | [0.508–0.579) | [0.579–0.674) | [0.674–1) |
| 23 | 22 | 16 | 14 | 15 | |
| Foreclosure rate | [0–0.016) | [0.016–0.032) | [0.032–0.072) | [0.072–1) | |
| 43 | 15 | 18 | 14 | ||
| Violent crime rate | [0–0.005) | [0.005–0.017) | [0.017–0.043) | [0.043–0.103) | [0.103–1) |
| 15 | 15 | 19 | 24 | 17 | |
| African Americans (%) | [0–0.062) | [0.062–0.172) | [0.172–0.349) | [0.349–0.519) | [0.519–1) |
| 11 | 18 | 28 | 20 | 13 | |
| Hispanic (%) | [0–0.047) | [0.047–0.083) | [0.083–0.127) | [0.127–0.239) | [0.239–1) |
| 18 | 16 | 13 | 12 | 31 | |
| Proximity to park | [0–0.08) | [0.08–0.36) | [0.36–0.68) | [0.68–0.97) | [0.97–1) |
| 17 | 16 | 20 | 17 | 20 | |
| Variable | (at 1%) | |
|---|---|---|
| t | p | |
| Socioeconomic Status | 0 | 0.4493 |
| Population Density | 1 | 0.0001 |
| Employment Rate | 0 | 0.9074 |
| Tree Canopy | 0 | 0.2081 |
| Foreclosure Rate | 0 | 0.9950 |
| Violent Crime Rate | 0 | 0.4321 |
| Percent African American | 0 | 0.4374 |
| Percent Latino | 0 | 0.0488 |
| Proximity to Park | 0 | 0.9652 |
| Independent Variable | Source | Coefficient | p |
|---|---|---|---|
| Housing Density | CQOLS | −0.021 | <0.01 |
| Socioeconomic percentile | CQOLS | −0.731 | <0.01 |
| Foreclosure rate | CQOLS | 0.050 | <0.01 |
| Violent crime rate | CQOLS | 0.005 | <0.01 |
| Percent of residents Hispanic | CQOLS | 0.007 | <0.01 |
| Independent Variable | Source | Coefficient | p |
|---|---|---|---|
| Housing Density | CQOLS | −0.107 | <0.01 |
| Socioeconomic percentile | CQOLS | −2.274 | <0.01 |
| Foreclosure rate | CQOLS | 0.241 | <0.01 |
| Violent crime rate | CQOLS | 0.039 | <0.01 |
| Percent of residents Hispanic | CQOLS | 0.033 | <0.01 |
| Percent of land covered by buildings | Mecklenburg County GIS | −4.938 | <0.01 |
| Percent of land covered by roads/railroads | Mecklenburg County GIS | −11.98 | <0.01 |
| Percent of land covered by grass/shrubs | Mecklenburg County GIS | −5.681 | <0.01 |
| Percent of land covered by tree canopy | Mecklenburg County GIS | −2.698 | <0.01 |
| Shannon diversity index: land cover types | Mecklenburg County GIS | 1.718 | <0.01 |
| Model Run | RMSE | Psuedo-R2 |
|---|---|---|
| 1 | 5.354 | 0.075 |
| 2 | 4.744 | 0.048 |
| 3 | 4.142 | 0.053 |
| 4 | 5.112 | 0.062 |
| 5 | 4.891 | 0.044 |
© 2018 by the authors. Licensee MDPI, Basel, Switzerland. This article is an open access article distributed under the terms and conditions of the Creative Commons Attribution (CC BY) license (http://creativecommons.org/licenses/by/4.0/).
Share and Cite
Whiteman, A.; Delmelle, E.; Rapp, T.; Chen, S.; Chen, G.; Dulin, M. A Novel Sampling Method to Measure Socioeconomic Drivers of Aedes albopictus Distribution in Mecklenburg County, North Carolina. Int. J. Environ. Res. Public Health 2018, 15, 2179. https://doi.org/10.3390/ijerph15102179
Whiteman A, Delmelle E, Rapp T, Chen S, Chen G, Dulin M. A Novel Sampling Method to Measure Socioeconomic Drivers of Aedes albopictus Distribution in Mecklenburg County, North Carolina. International Journal of Environmental Research and Public Health. 2018; 15(10):2179. https://doi.org/10.3390/ijerph15102179
Chicago/Turabian StyleWhiteman, Ari, Eric Delmelle, Tyler Rapp, Shi Chen, Gang Chen, and Michael Dulin. 2018. "A Novel Sampling Method to Measure Socioeconomic Drivers of Aedes albopictus Distribution in Mecklenburg County, North Carolina" International Journal of Environmental Research and Public Health 15, no. 10: 2179. https://doi.org/10.3390/ijerph15102179
APA StyleWhiteman, A., Delmelle, E., Rapp, T., Chen, S., Chen, G., & Dulin, M. (2018). A Novel Sampling Method to Measure Socioeconomic Drivers of Aedes albopictus Distribution in Mecklenburg County, North Carolina. International Journal of Environmental Research and Public Health, 15(10), 2179. https://doi.org/10.3390/ijerph15102179