A Systematic Review of Access to Rehabilitation for People with Disabilities in Low- and Middle-Income Countries


Abstract
1. Introduction
2. Materials and Methods
2.1. Eligibility Criteria
2.2. Access to Rehabilitation Defined
2.3. Types of Disability Measures
2.4. Information Sources
2.5. Study Selection
2.6. Data Collection Process
- General study information, including author, year of publication
- Study design, sampling, and recruitment methods
- Study setting, and dates conducted
- Population characteristics including age, sex, and sample size
- Disability type/domain being studied, and means of assessing disability
- Results: main findings related to access to rehabilitation and any disaggregation by age, sex, urban-rural status, or other variables. We extracted data on the proportion covered by rehabilitation services in the population. Where unmet need was presented, we calculated the met need as one minus the unmet need.
2.7. Risk of Bias in Individual Studies
3. Results
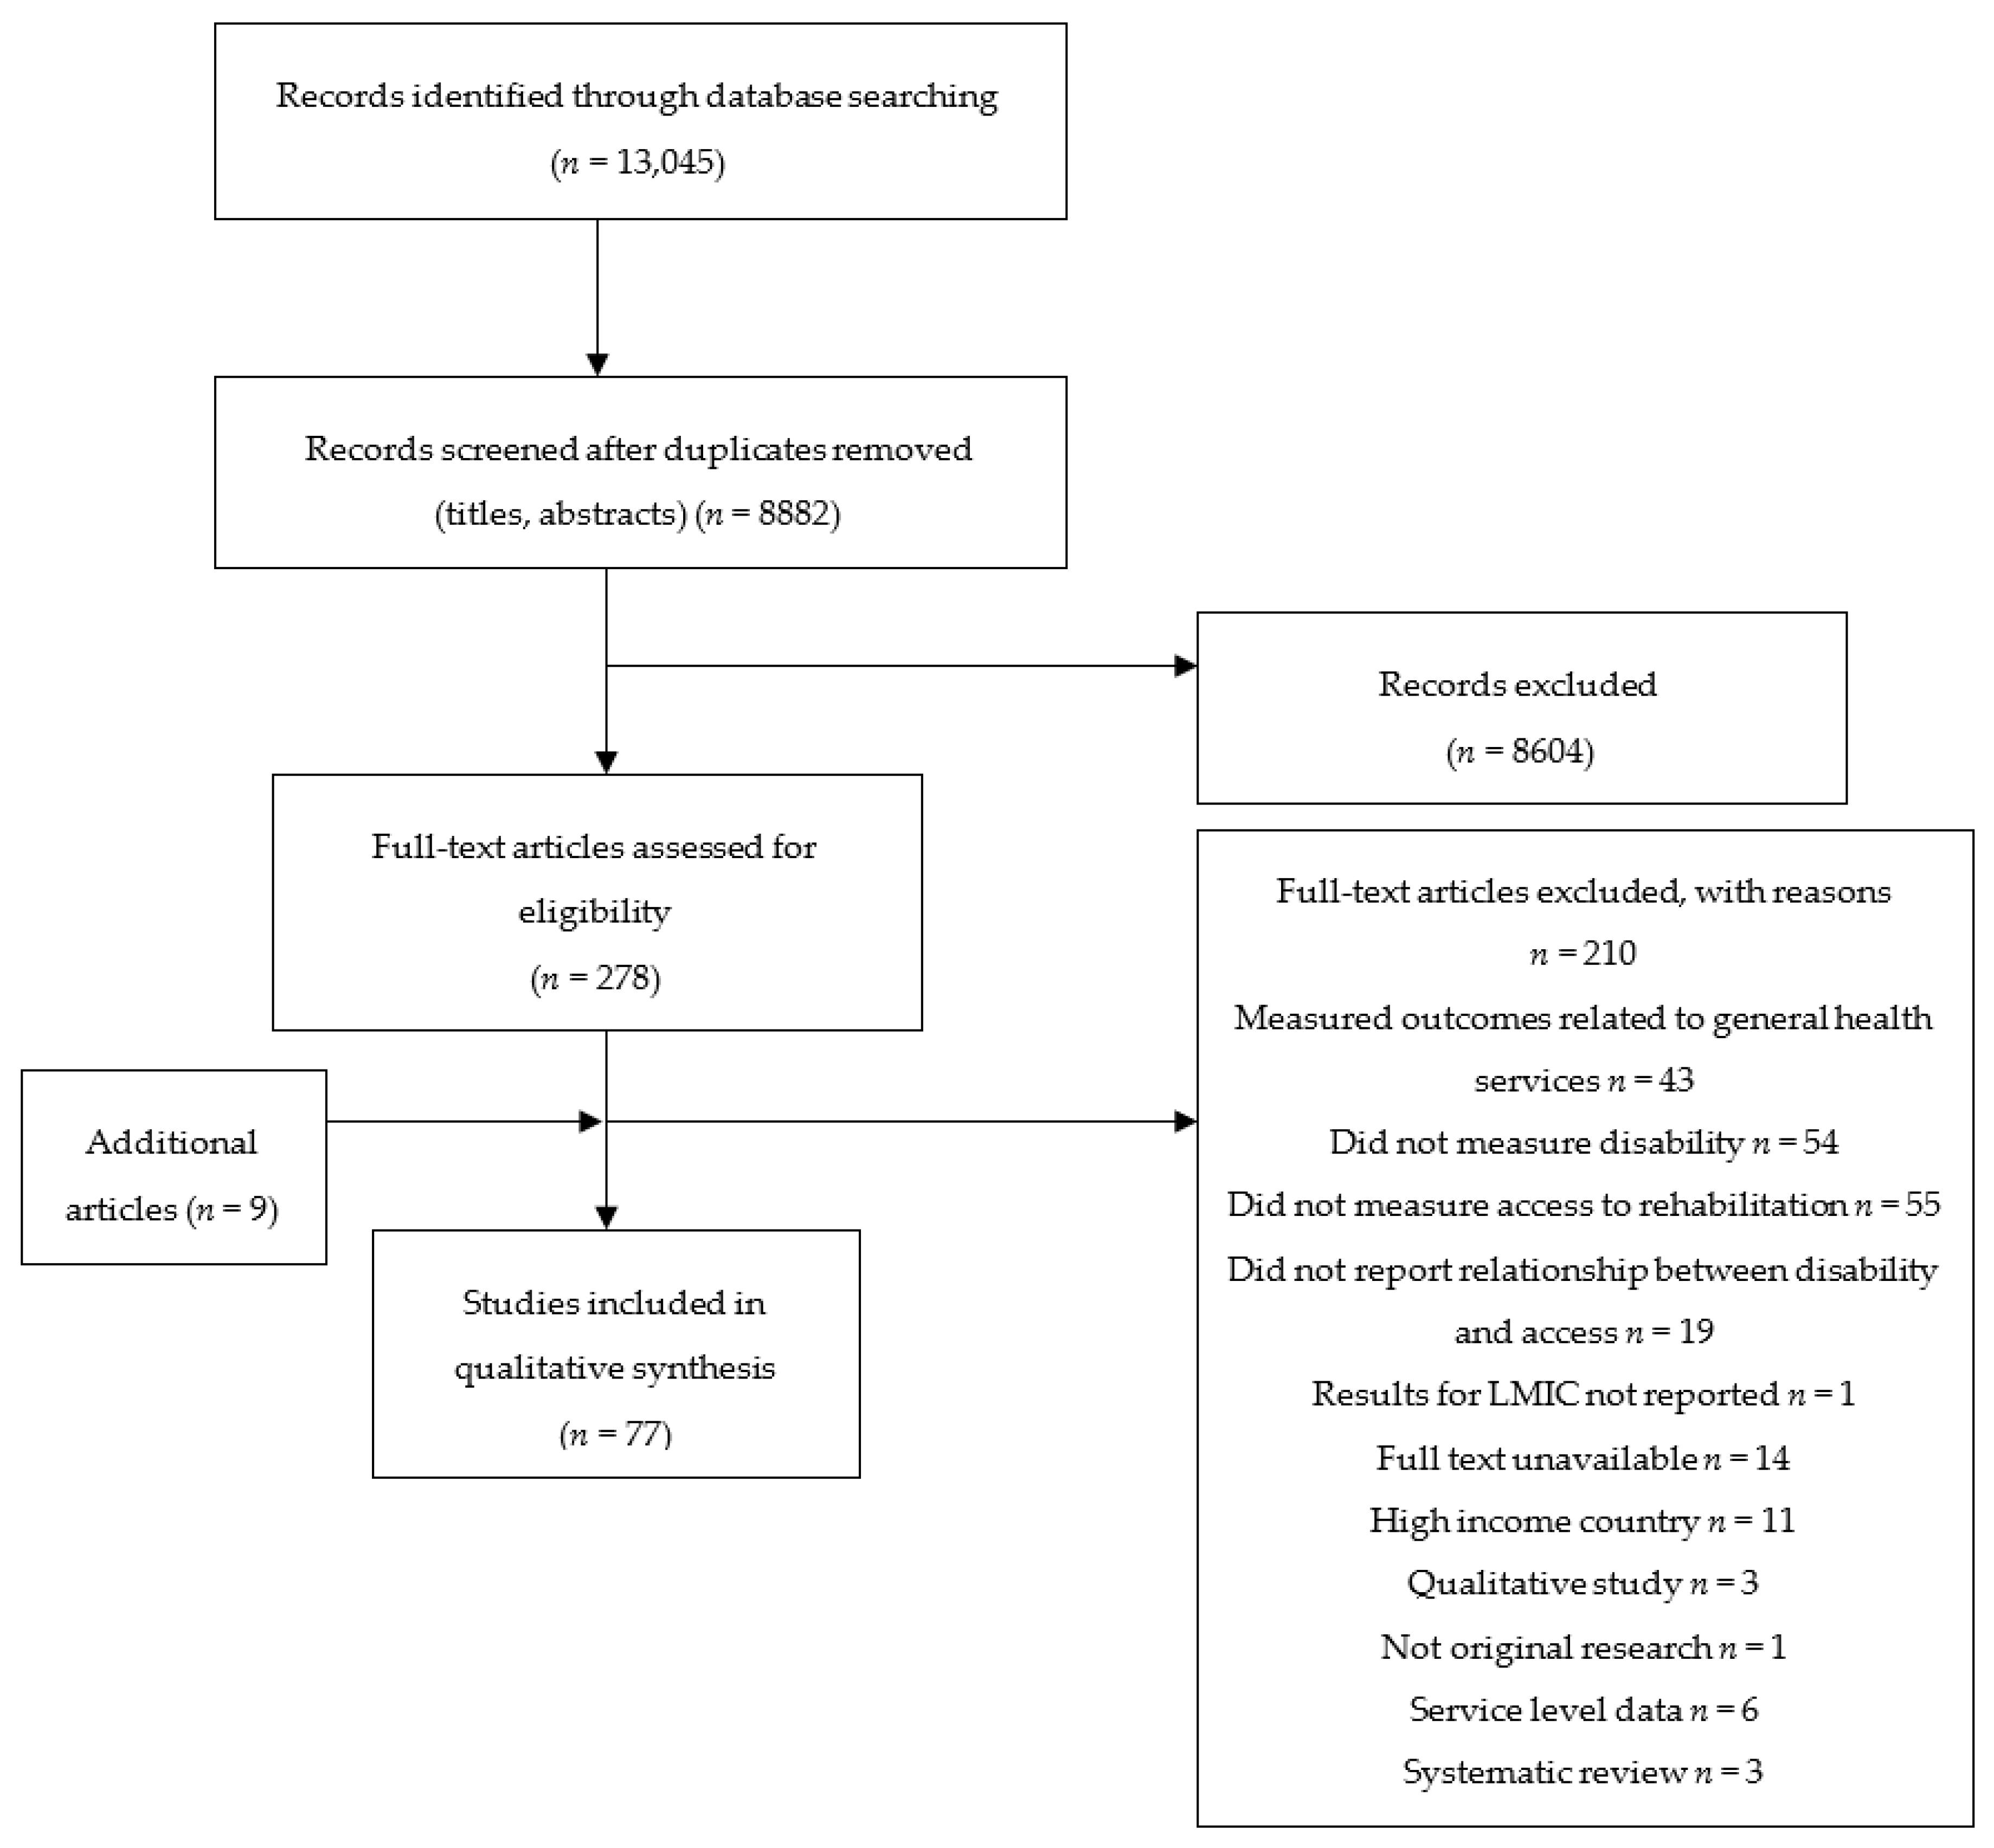
3.1. Study Selection
3.2. Study Characteristics
3.3. Participants
3.4. Outcome Types
- Medical rehabilitation: including received treatment/surgery, received diagnosis, access to, or ever received rehabilitation (any type), received therapy (physical, occupational, speech and language) (48 studies, 62%)
- Assistive devices: including hearing aids, mobility aids, low vision devices, or any assistive device (25 studies, 32%)
- Adherence: including adherence to treatment, treatment completion rate, and uptake of referral (25 studies, 32%)
3.5. Description of Studies
3.5.1. Access to Rehabilitation for Hearing Impairment
3.5.2. Access to Rehabilitation for Mental Impairment
3.5.3. Access to Rehabilitation for Physical Impairment
3.5.4. Access to Rehabilitation for Vision Impairment
3.5.5. Access to Rehabilitation for Any Disability
3.5.6. Barriers
4. Discussion
4.1. Review of Findings
4.2. Consistency with Previous Reviews
4.3. Implications for Practice
4.4. Implications for Research
Use Common Definitions of Disability and Coverage
4.5. Limitations and Strengths
5. Conclusions
Supplementary Materials
Author Contributions
Funding
Acknowledgments
Conflicts of Interest
References
- World Bank; World Health Organization. The World Report on Disability. Available online: http://www.who.int/disabilities/world_report/2011/en/ (accessed on 13 April 2018).
- World Health Organization. Towards a Common Language for Functioning, Disability and Health; World Health Organization: Geneva, Switzerland, 2002. [Google Scholar]
- Prince, M.; Patel, V.; Saxena, S.; Maj, M.; Maselko, J.; Phillips, M.R.; Rahman, A. No health without mental health. Lancet 2007, 370, 859–877. [Google Scholar] [CrossRef]
- Banks, L.M.; Kuper, H.; Polack, S. Poverty and disability in low- and middle-income countries: A systematic review. PLoS ONE 2017, 12, e0189996. [Google Scholar] [CrossRef] [PubMed]
- World Health Organization. Rehabilitation 2030: A Call for Action. 2017. Available online: http://www.who.int/disabilities/care/rehab-2030/en/ (accessed on 24 April 2018).
- World Health Organization. Assistive Devices/Technologies: What WHO Is Doing. Available online: http://www.who.int/disabilities/technology/activities/en/ (accessed on 18 July 2018).
- World Health Organization. Guidelines for Hearing Aids and Services for Developing Countries; World Health Organization: Geneva, Switzerland, 2004. [Google Scholar]
- World Health Organization. Universal Health Coverage and Health Financing. 2018. Available online: http://www.who.int/health_financing/universal_coverage_definition/en/ (accessed on 13 April 2018).
- United Nations. Sustainable Development Goals. Available online: https://sustainabledevelopment.un.org/?menu=1300 (accessed on 18 July 2018).
- United Nations. Convention on the Rights of Persons with Disabilities—Articles. 2006. Available online: https://www.un.org/development/desa/disabilities/convention-on-the-rights-of-persons-with-disabilities/convention-on-the-rights-of-persons-with-disabilities-2.html (accessed on 28 September 2018).
- World Health Organization. Global Cooperation on Assistive Technologies (GATE). 2014. Available online: http://www.who.int/phi/implementation/assistive_technology/phi_gate/en/ (accessed on 13 April 2018).
- Ramke, J.; Gilbert, C.E.; Lee, A.C.; Ackland, P.; Limburg, H.; Foster, A. Effective cataract surgical coverage: An indicator for measuring quality-of-care in the context of Universal Health Coverage. PLoS ONE 2017, 12, e0172342. [Google Scholar] [CrossRef] [PubMed]
- Fricke, T.R.; Tahhan, N.; Resnikoff, S.; Papas, E.; Burnett, A.; Ho, S.M.; Naduvilath, T.; Naidoo, K.S. Global Prevalence of Presbyopia and Vision Impairment from Uncorrected Presbyopia: Systematic Review, Meta-analysis, and Modelling. Ophthalmology 2018, 125, 1492–1499. [Google Scholar] [CrossRef] [PubMed]
- IAPB. Spectacle Coverage Report. 2017. Available online: https://www.iapb.org/resources/spectacle-coverage-report/ (accessed on 18 July 2018).
- Scottish Intercollegiate Guidelines Network. SIGN 50: A Guideline Development Handbook. 2011. Available online: http://www.sign.ac.uk/assets/sign50_2011.pdf (accessed on 13 April 2018).
- Allain, T.J.; Wilson, A.O.; Gomo, Z.A.R.; Mushangi, E.; Senzanje, B.; Adamchak, D.J.; Matenga, J.A. Morbidity and disability in elderly Zimbabweans. Age Ageing 1997, 26, 115–121. [Google Scholar] [CrossRef] [PubMed]
- Bernabe-Ortiz, A.; Diez-Canseco, F.; Vásquez, A.; Miranda, J.J. Disability, caregiver’s dependency and patterns of access to rehabilitation care: Results from a national representative study in Peru. Disabil. Rehabil. 2016, 38, 582–588. [Google Scholar] [CrossRef] [PubMed]
- Danquah, L.; Polack, S.; Brus, A.; Mactaggart, I.; Houdon, C.P.; Senia, P.; Gallien, P.; Kuper, H. Disability in post-earthquake Haiti: Prevalence and inequality in access to services. Disabil. Rehabil. 2015, 37, 1082–1089. [Google Scholar] [CrossRef] [PubMed]
- Devendra, A.; Makawa, A.; Kazembe, P.N.; Calles, N.R.; Kuper, H. HIV and Childhood Disability: A Case-Controlled Study at a Paediatric Antiretroviral Therapy Centre in Lilongwe, Malawi. PLoS ONE 2013, 8, e84024. [Google Scholar] [CrossRef] [PubMed]
- Kuper, H.; Walsham, M.; Myamba, F.; Mesaki, S.; Mactaggart, I.; Banks, M.; Blanchet, K. Social protection for people with disabilities in Tanzania: A mixed methods study. Oxf. Dev. Stud. 2016, 44, 441–457. [Google Scholar] [CrossRef]
- Maart, S.; Jelsma, J. Disability and access to health care—A community based descriptive study. Disabil. Rehabil. 2014, 36, 1489–1493. [Google Scholar] [CrossRef] [PubMed]
- Mactaggart, I.; Kuper, H.; Murthy, G.V.S.; Sagar, J.; Oye, J.; Polack, S. Assessing health and rehabilitation needs of people with disabilities in Cameroon and India. Disabil. Rehabil. 2016, 38, 1757–1764. [Google Scholar] [CrossRef] [PubMed]
- Malta, D.C.; Stopa, S.R.; Canuto, R.; Gomes, N.L.; Mendes, V.L.; Goulart, B.N.; Moura, L. Self-reported prevalence of disability in Brazil, according to the National Health Survey, 2013. Cienc. Saude Colet. 2016, 21, 3253–3264. [Google Scholar] [CrossRef] [PubMed]
- Nesbitt, R.C.; Mackey, S.; Kuper, H.; Muhit, M.; Murthy, G.V. Predictors of referral uptake in children with disabilities in Bangladesh—Exploring barriers as a first step to improving referral provision. Disabil. Rehabil. 2012, 34, 1089–1095. [Google Scholar] [CrossRef] [PubMed]
- Omondi, D.; Ogol, C.; Otieno, S.; Macharia, I. Parental awareness of hearing impairment in their school-going children and healthcare seeking behaviour in Kisumu district, Kenya. Int. J. Pediatr. Otorhinolaryngol. 2007, 71, 415–423. [Google Scholar] [CrossRef] [PubMed]
- Padmamohan, J.; Nair, M.K.C.; Devi, S.R.; Nair, S.M.; Leena, M.L.; Kumar, G.S. Utilization of rehabilitation services by rural households with disabled preschool children. Indian Pediatr. 2009, 46, S79–S82. [Google Scholar] [PubMed]
- Ribas, A.; Guarinello, A.C.; Braga, M.; Cribari, J.; Filho, O.B.; Cardoso, S.M.S.; Martins, J. Access to hearing health service in Curitiba-PR for the elderly with hearing loss and tinnitus. Int. Tinnitus J. 2015, 19, 59–63. [Google Scholar] [CrossRef] [PubMed]
- Tan, S.H. Unmet Health Care Service Needs of Children with Disabilities in Penang, Malaysia. Asia Pac. J Public Health 2015, 27, 41S–51S. [Google Scholar] [CrossRef] [PubMed]
- Abas, M.A.; Broadhead, J.C. Depression and anxiety among women in an urban setting in Zimbabwe. Psychol. Med. 1997, 27, 59–71. [Google Scholar] [CrossRef] [PubMed]
- Alekhya, P.; Sriharsha, M.; Venkata Ramudu, R.; Shivanandh, B.; Priya Darsini, T.; Reddy, K.S.K.; Hrushikesh Reddy, Y. Adherence to antidepressant therapy: Sociodemographic factor wise distribution. Int. J. Pharm. Clin. Res. 2015, 7, 180–184. [Google Scholar]
- Andersson, L.M.C.; Schierenbeck, I.; Strumpher, J.; Krantz, G.; Topper, K.; Backman, G.; Ricks, E.; Van Rooyen, D. Help-Seeking Behaviour, Barriers to Care and Experiences of Care among Persons with Depression in Eastern Cape, South Africa. J. Affect. Disord. 2013, 151, 439–448. [Google Scholar] [CrossRef] [PubMed]
- Hailemariam, S.; Tessema, F.; Asefa, M.; Tadesse, H.; Tenkolu, G. The prevalence of depression and associated factors in Ethiopia: Findings from the National Health Survey. Int. J. Ment. Health Syst. 2012, 6, 23. [Google Scholar] [CrossRef] [PubMed]
- De Snyder, V.N.; de Jesús Díaz-Pérez, M. Los trastornos afectivos en la población rural. Salud Ment. 1999, 22, 68–74. [Google Scholar]
- Karam, E.G. The nosological status of bereavement-related depressions. Br. J. Psychiatry 1994, 165, 48–52. [Google Scholar] [CrossRef] [PubMed]
- Fujii, R.K.; Goren, A.; Annunziata, K.; Mould-Quevedo, J. Prevalence, Awareness, Treatment, and Burden of Major Depressive Disorder: Estimates from the National Health and Wellness Survey in Brazil. Value Health Reg. Issues 2012, 1, 235–243. [Google Scholar] [CrossRef] [PubMed]
- El-Sayed, A.M.; Palma, A.; Freedman, L.P.; Kruk, M.E. Does health insurance mitigate inequities in non-communicable disease treatment? Evidence from 48 low- and middle-income countries. Health Policy 2015, 119, 1164–1175. [Google Scholar] [CrossRef] [PubMed]
- Raban, M.Z.; Dandona, R.; Anil Kumar, G.; Dandona, L. Inequitable coverage of non-communicable diseases and injury interventions in India. Natl. Med. J. India 2010, 23, 267–273. [Google Scholar] [PubMed]
- Padmavathi, R.; Rajkumar, S.; Srinivasan, T.N. Schizophrenic patients who were never treated—A study in an Indian urban community. Psychol. Med. 1998, 28, 1113–1117. [Google Scholar] [CrossRef] [PubMed]
- Lora, A. Service availability and utilization and treatment gap for schizophrenic disorders: A survey in 50 low-and middle income countries. Eur. Arch. Psychiatry Clin. Neurosci. 2013, 263, S52. [Google Scholar] [CrossRef] [PubMed]
- Demyttenaere, K.; Bruffaerts, R.; Posada-Villa, J.; Gasquet, I.; Kovess, V.; Lepine, J.P.; Angermeyer, M.C.; Bernert, S.; de Girolamo, G.; Morosini, P.; et al. Prevalence, severity, and unmet need for treatment of mental disorders in the World Health Organization World Mental Health Surveys. JAMA 2004, 291, 2581–2590. [Google Scholar] [PubMed]
- Andrade, L.; Walters, E.W.; Gentil, V.; Laurenti, R. Prevalence of ICD-10 Mental Disorders in a Catchment Area in the City of São Paulo, Brazil. Soc. Psychiatry Psychiatr. Epidemiol. 2002, 37, 316–325. [Google Scholar] [CrossRef] [PubMed]
- Caraveo-Anduaga, J.J.; Colmenares, B.; Saldívar, H.; Gabriela, J. Morbilidad psiquiátrica en la ciudad de México: Prevalencia y comorbilidad a lo largo de la vida. Salud Ment. 1999, 22, 6. [Google Scholar]
- Loeb, M.E.; Eide, A.H. Living Conditions among People with Activity Limitations in Malawi: A National Representative Study; SINTEF: Trondheim, Norway, 2004. [Google Scholar]
- Eide, A.H.; Loeb, M.E. Living Conditions among People with Activity Limitations in Zambia: A National Representative Study; SINTEF: Trondheim, Norway, 2006. [Google Scholar]
- Alhasnawi, S.; Sadik, S.; Rasheed, M.; Baban, A.; Al-Alak, M.M.; Othman, A.Y.; Othman, Y.; Ismet, N.; Shawani, O.; Murthy, S.; et al. The prevalence and correlates of DSM-IV disorders in the Iraq Mental Health Survey (IMHS). World Psychiatry 2009, 8, 97–109. [Google Scholar] [PubMed]
- Li, N.; Du, W.; Chen, G.; Song, X.; Zheng, X. Mental Health Service Use among Chinese Adults with Mental Disabilities: A National Survey. Psychiatr. Serv. 2013, 64, 638–644. [Google Scholar] [CrossRef] [PubMed]
- Chikovani, I.; Makhashvili, N.; Gotsadze, G.; Patel, V.; McKee, M.; Uchaneishvili, M.; Rukhadze, N.; Roberts, B. Health Service Utilization for Mental, Behavioural and Emotional Problems among Conflict-Affected Population in Georgia: A Cross-Sectional Study. PLoS ONE 2015, 10, e0122673. [Google Scholar] [CrossRef] [PubMed]
- Trump, L.; Hugo, C. The barriers preventing effective treatment of South African patients with mental health problems. Afr. J. Psychiatry 2006, 9, 249–260. [Google Scholar] [CrossRef]
- Ormel, J.; Petukhova, M.; Chatterji, S.; Aguilar-Gaxiola, S.; Alonso, J.; Angermeyer, M.C.; Bromet, E.J.; Burger, H.; Demyttenaere, K.; de Girolamo, G.; et al. Disability and treatment of specific mental and physical disorders across the world. Br. J. Psychiatry 2008, 192, 368–375. [Google Scholar] [CrossRef] [PubMed]
- Seedat, S.; Williams, D.R.; Herman, A.A.; Moomal, H.; Williams, S.L.; Jackson, P.B.; Myer, L.; Stein, D.J. Mental health service use among South Africans for mood, anxiety and substance use disorders. S. Afr. Med. J. 2009, 99, 346–352. [Google Scholar] [PubMed]
- Ma, N.; Liu, J.; Wang, X.; Gan, Y.W.; Ma, H.; Ng, C.H.; Jia, F.J.; Yu, X. Treatment dropout of patients in National Continuing Management and Intervention Program for Psychoses in Guangdong Province from 2006 to 2009: Implication for mental health service reform in China. Asia-Pac. Psychiatry 2012, 4, 181–188. [Google Scholar] [CrossRef]
- Caraveo-Anduaga, J.J.; Martínez Vélez, N.A.; Rivera Guevara, B.E.; Dayan, A.P. Prevalencia en la vida de episodios depresivos y utilización de servicios especializados. Salud Ment. 1997, 20, 15–23. [Google Scholar]
- Paula, C.S.; Bordin, I.A.S.; Mari, J.J.; Velasque, L.; Rohde, L.A.; Coutinho, E.S.F. The Mental Health Care Gap among Children and Adolescents: Data from an Epidemiological Survey from Four Brazilian Regions. PLoS ONE 2014, 9, e88241. [Google Scholar] [CrossRef] [PubMed]
- Chadda, R.K.; Pradhan, S.C.; Bapna, J.S.; Singhal, R.; Singh, T.B. Chronic psychiatric patients: An assessment of treatment and rehabilitation-related needs. Int. J. Rehabil. Res. 2000, 23, 55–58. [Google Scholar] [CrossRef] [PubMed]
- Llosa, A.E.; Ghantous, Z.; Souza, R.; Forgione, F.; Bastin, P.; Jones, A.; Antierens, A.; Slavuckij, A.; Grais, R.F. Mental disorders, disability and treatment gap in a protracted refugee setting. Br.J. Psychiatry 2014, 204, 208–213. [Google Scholar] [CrossRef] [PubMed]
- Dejene, T.; Hanlon, C.; Abebaw, F.; Tekola, B.; Yonas, B.; Hoekstra, R.A. Stigma, explanatory models and unmet needs of caregivers of children with developmental disorders in a low-income African country: A cross-sectional facility-based survey. BMC Health Serv. Res. 2016, 16, 152. [Google Scholar]
- Coleman, R.; Loppy, L.; Walraven, G. The treatment gap and primary health care for people with epilepsy in rural Gambia. Bull. World Health Organ. 2002, 80, 378–383. [Google Scholar] [PubMed]
- Bigelow, J.; Korth, M.; Jacobs, J.; Anger, N.; Riddle, M.; Gifford, J. A picture of amputees and the prosthetic situation in Haiti. Disabil. Rehabil. 2009, 26, 246–252. [Google Scholar] [CrossRef]
- Doocy, S.; Lyles, E.; Akhu-Zaheya, L.; Oweis, A.; Al Ward, N.; Burton, A. Health Service Utilization among Syrian Refugees with Chronic Health Conditions in Jordan. PLoS ONE 2016, 11, e0150088. [Google Scholar] [CrossRef] [PubMed]
- Gadallah, M.A.; Boulos, D.N.K.; Gebrel, A.; Dewedar, S.; Morisky, D.E. Assessment of Rheumatoid Arthritis Patients’ Adherence to Treatment. Am. J. Med. Sci. 2015, 349, 151–156. [Google Scholar] [CrossRef] [PubMed]
- Kumar, R.B.C.; Singhasivanon, P.; Sherchand, J.B.; Mahaisavariya, P.; Kaewkungwal, J.; Peerapakorn, S.; Mahotarn, K. Gender differences in epidemiological factors associated with treatment completion status of leprosy patients in the most hyperendemic district of Nepal. Southeast Asian J. Trop. Med. Public Health 2004, 35, 334–339. [Google Scholar] [PubMed]
- McConachie, H.; Huq, S.; Munir, S.; Akhter, N.; Ferdous, S.; Khan, N.Z. Difficulties for mothers in using an early intervention service for children with cerebral palsy in Bangladesh. Child 2001, 27, 1–12. [Google Scholar] [CrossRef]
- Saleh, M.; Almasri, N.A. Cerebral palsy in Jordan: Demographics, medical characteristics, and access to services. Child. Health Care 2017, 46, 49–65. [Google Scholar] [CrossRef]
- Schafer, J. Leprosy and disability control in the Guera prefecture of Chad, Africa: Do women have access to leprosy control services? Lepr. Rev. 1998, 69, 267–278. [Google Scholar] [CrossRef] [PubMed]
- Suman, K.; Kalyan, B.; Tanmay, M.; Sanchita, M.; Bhadra, U.K.; Kamalesh, S. Perceived morbidity, healthcare-seeking behavior and their determinants in a poor-resource setting: Observation from India. PLoS ONE 2015, 10, e0125865. [Google Scholar]
- Wanaratwichit, C.; Sirasoonthorn, P.; Pannarunothai, S.; Noosorn, N. Access to services and complications experienced by disabled people in Thailand. Asia Pac. J. Public Health 2008, 20, 251–256. [Google Scholar] [PubMed]
- Zongjie, Y.; Hong, D.; Zhongxin, X.; Hui, X. A research study into the requiremenst of disabled residents for rehabilitation services in Beijing. Disabil. Rehabil. 2007, 29, 825–833. [Google Scholar] [CrossRef] [PubMed]
- Ahmad, K.; Zwi, A.B.; Tarantola, D.J.M.; Azam, S.I. Eye Care Service Use and Its Determinants in Marginalized Communities in Pakistan: The Karachi Marine Fishing Communities Eye and General Health Survey. Ophthalmic Epidemiol. 2015, 22, 370–379. [Google Scholar] [CrossRef] [PubMed]
- Brian, G.; Maher, L.; Ramke, J.; Palagyi, A. Eye care in Fiji: A population-based study of use and barriers. Ophthalmic Epidemiol. 2012, 19, 43–51. [Google Scholar] [CrossRef] [PubMed]
- Fletcher, A.E.; Donoghue, M.; Devavaram, J.; Thulasiraj, R.D.; Scott, S.; Abdalla, M.; Shanmugham, C.A.K.; Murugan, P.B. Low uptake of eye services in rural India: A challenge for programs of blindness prevention. Arch. Ophthalmol. 1999, 117, 1393–1399. [Google Scholar] [CrossRef] [PubMed]
- Kovai, V.; Krishnaiah, S.; Shamanna, B.R.; Ravi, T.; Rao, G.N. Barriers to accessing eye care services among visually impaired populations in rural Andhra Pradesh, South India. Indian J. Ophthalmol. 2007, 55, 365–372. [Google Scholar] [CrossRef] [PubMed]
- Lee, L.; Ramke, J.; Blignault, I.; Casson, R.J. Changing Barriers to Use of Eye Care Services in Timor-Leste: 2005 to 2010. Ophthalmic Epidemiol. 2013, 20, 45–51. [Google Scholar] [CrossRef] [PubMed]
- Mahande, M.; Tharaney, M.; Kirumbi, E.; Ngirawamungu, E.; Geneau, R.; Tapert, L.; Courtright, P. Uptake of trichiasis surgical services in Tanzania through two village-based approaches. Br. J. Ophthalmol. 2007, 91, 139–142. [Google Scholar] [CrossRef] [PubMed]
- Palagyi, A.; Ramke, J.; du Toit, R.; Brian, G. Eye care in Timor-Leste: A population-based study of utilization and barriers. Clin. Exp. Ophthalmol. 2008, 36, 47–53. [Google Scholar] [CrossRef] [PubMed]
- Udeh, N.N.; Eze, B.I.; Onwubiko, S.N.; Arinze, O.C.; Onwasigwe, E.N.; Umeh, R.E. Oculocutaneous albinism: Identifying and overcoming barriers to vision care in a Nigerian population. J. Community Health 2014, 39, 508–513. [Google Scholar] [CrossRef] [PubMed]
- Bernabe-Ortiz, A.; Diez-Canseco, F.; Vasquez, A.; Kuper, H.; Walsham, M.; Blanchet, K. Inclusion of persons with disabilities in systems of social protection: A population-based survey and case-control study in Peru. BMJ Open 2016, 6, e011300. [Google Scholar] [CrossRef] [PubMed]
- Borker, S.; Motghare, D.; Kulkarni, M.; Bhat, S. Study of knowledge, accessibility and utilization of the existing rehabilitation services by disabled in a rural Goan community. Ann. Trop. Med. Public Health 2012, 5, 581–586. [Google Scholar] [CrossRef]
- Eide, A.H. Living Conditions among People with Disabilities in Zimbabwe; SINTEF: Trondheim, Norway, 2003. [Google Scholar]
- Eide, A.H.; Van Rooy, G.; Loeb, M.E. Living Conditions among People with Disabilities in Namibia; SINTEF: Trondheim, Norway, 2003. [Google Scholar]
- Eide, A.H.; Kamaleri, Y. Living Conditions among People with Disabilities in Mozambique; SINTEF: Trondheim Norway, 2009. [Google Scholar]
- Eide, A.H.; Jele, B. Living Conditions among People with Disabilities in Swaziland: A National Representative Study; SINTEF: Trondheim, Norway, 2011. [Google Scholar]
- Eide, A.H.; Neupane, S.; Hem, K.G. Living Conditions among People with Disabilities in Nepal; SINTEF: Trondheim, Norway, 2016. [Google Scholar]
- Eide, A.H.; Mmatli, T. Living Conditions among People with Disability in Botswana; SINTEF: Trondheim, Norway, 2016. [Google Scholar]
- Hamdan, M.; Al-Akhras, N. House-to-house survey of disabilities in rural communities in the north of the West Bank. East. Mediterr. Health J. 2009, 15, 1496–1503. [Google Scholar] [PubMed]
- Hosain, G.M.; Chatterjee, N. Health-care utilization by disabled persons: A survey in rural Bangladesh. Disabil. Rehabil. 1998, 20, 337–345. [Google Scholar] [CrossRef] [PubMed]
- Kisioglu, A.N.; Uskun, E.; Ozturk, M. Socio-demographical examinations on disability prevalence and rehabilitation status in southwest of Turkey. Disabil. Rehabil. 2003, 25, 1381–1385. [Google Scholar] [CrossRef] [PubMed]
- Kuper, H.; Nyapera, V.; Evans, J.; Munyendo, D.; Zuurmond, M.; Frison, S.; Mwenda, V.; Otieno, D.; Kisia, J. Malnutrition and Childhood Disability in Turkana, Kenya: Results from a Case-Control Study. PLoS ONE 2015, 10, e0144926. [Google Scholar] [CrossRef] [PubMed]
- Marella, M.; Busija, L.; Islam, F.M.A.; Devine, A.; Fotis, K.; Baker, S.M.; Sprunt, B.; Edmonds, T.J.; Huq, N.L.; Cama, A.; et al. Field-testing of the rapid assessment of disability questionnaire. BMC Public Health 2014, 14, 900. [Google Scholar] [CrossRef] [PubMed]
- Marella, M.; Devine, A.; Armecin, G.F.; Zayas, J.; Marco, M.J.; Vaughan, C. Rapid assessment of disability in the Philippines: Understanding prevalence, well-being, and access to the community for people with disabilities to inform the W-DARE project. Popul. Health Metr. 2016, 14, 26. [Google Scholar] [CrossRef] [PubMed]
- Nualnetr, N.; Sakhornkhan, A. Improving Accessibility to Medical Services for Persons with Disabilities in Thailand. Disabil. CBR Incl. Dev. 2012, 23, 34–49. [Google Scholar] [CrossRef]
- Pongprapai, S.; Tayakkanonta, K.; Chongsuvivatwong, V.; Underwood, P. A study on disabled children in a rural community in southern Thailand. Disabil. Rehabil. 1996, 18, 42–46. [Google Scholar] [CrossRef] [PubMed]
- Souza, F.D.; Pimentel, A.M. Pessoas com deficiência: Entre necessidades e atenção à saúde. Cad. Ter. Ocup. UFSCar 2012, 20, 229–237. [Google Scholar] [CrossRef]
- Matheson, J.; Atijosan, O.; Kuper, H.; Rischewski, D.; Simms, V.; Lavy, C. Musculoskeletal Impairment of Traumatic Etiology in Rwanda: Prevalence, Causes, and Service Implications. World J. Surg. 2011, 35, 2635–2642. [Google Scholar] [CrossRef] [PubMed]
- Kuper, H.; Dok, A.M.V.; Wing, K.; Danquah, L.; Evans, J.; Zuurmond, M.; Gallinetti, J. The Impact of disability on the lives of children; Cross-sectional data including 8900 children with disabilities and 898,834 children without disabilities across 30 countries. PLoS ONE 2014, 9, e107300. [Google Scholar] [CrossRef] [PubMed]
- Eide, A.H.; Mannan, H.; Khogali, M.; Rooy, G.V.; Swartz, L.; Munthali, A.; Hem, K.G.; MacLachlan, M.; Dyrstad, K. Perceived barriers for accessing health services among individuals with disability in four African countries. PLoS ONE 2015, 10, e0125915. [Google Scholar] [CrossRef] [PubMed]
- Matter, R.; Harniss, M.; Oderud, T.; Borg, J.; Eide, A.H. Assistive technology in resource-limited environments: A scoping review. Disabil. Rehabil. 2017, 12, 105–114. [Google Scholar] [CrossRef] [PubMed]
- De Silva, M.J.; Lee, L.; Fuhr, D.C.; Rathod, S.; Chisholm, D.; Schellenberg, J.; Patel, V. Estimating the coverage of mental health programmes: A systematic review. Int. J. Epidemiol. 2014, 43, 341–353. [Google Scholar] [CrossRef] [PubMed]
- Jesus, T.S.; Landry, M.D.; Dussault, G.; Fronteira, I. Human resources for health (and rehabilitation): Six Rehab-Workforce Challenges for the century. Human Resour. Health 2017, 15, 8. [Google Scholar] [CrossRef] [PubMed]
- Bruckner, T.A.; Scheffler, R.M.; Shen, G.; Yoon, J.; Chisholm, D.; Morris, J.; Fulton, B.D.; Dal Poz, M.R.; Saxena, S. The mental health workforce gap in low- and middle-income countries: A needs-based approach. Bull. World Health Organ. 2011, 89, 184–194. [Google Scholar] [CrossRef] [PubMed]
- Bingham, S.; Beatty, P. Rates of access to assistive equipment and medical rehabilitation services among people with disabilities. Disabil. Rehabil. 2003, 25, 487–490. [Google Scholar] [CrossRef] [PubMed]
- Park, S.J.; Jeon, H.J.; Kim, J.Y.; Kim, S.; Roh, S. Sociodemographic factors associated with the use of mental health services in depressed adults: Results from the Korea National Health and Nutrition Examination Survey (KNHANES). BMC Health Serv. Res. 2014, 14, 645. [Google Scholar] [CrossRef] [PubMed]
- Sakellariou, D.; Rotarou, E.S. Access to healthcare for men and women with disabilities in the UK: Secondary analysis of cross-sectional data. BMJ Open 2017, 7, e016614. [Google Scholar] [CrossRef] [PubMed]
- Harniss, M.; Samant Raja, D.; Matter, R. Assistive technology access and service delivery in resource-limited environments: introduction to a special issue of Disability and Rehabilitation: Assistive Technology. Disabil. Rehabil. 2015, 10, 267–270. [Google Scholar] [CrossRef] [PubMed]
- World Health Organization. Rehabilitation in Health Systems. 2017. Available online: http://apps.who.int/iris/bitstream/handle/10665/254506/9789241549974-eng.pdf?sequence=1 (accessed on 18 July 2018).
- World Health Organization. Task Shifting: Global Recommendations and Guidelines; World Health Organization: Geneva, Switzerland, 2008. [Google Scholar]
- De Swanepoel, W.; Hall, J.W., 3rd. A systematic review of telehealth applications in audiology. Telemed. e-Health 2010, 16, 181–200. [Google Scholar] [CrossRef] [PubMed]
- Foley, A.R.; Masingila, J.O. The use of mobile devices as assistive technology in resource-limited environments: Access for learners with visual impairments in Kenya. Disabil. Rehabil. 2015, 10, 332–339. [Google Scholar] [CrossRef] [PubMed]
- Sureshkumar, K.; Murthy, G.V.S.; Munuswamy, S.; Goenka, S.; Kuper, H. ‘Care for Stroke’, a web-based, smartphone-enabled educational intervention for management of physical disabilities following stroke: Feasibility in the Indian context. BMJ Innov. 2015, 1, 127–136. [Google Scholar] [CrossRef] [PubMed]
- Bright, T.; Felix, L.; Kuper, H.; Polack, S. A systematic review of strategies to increase access to health services among children in low and middle income countries. BMC Health Serv. Res. 2017, 17, 252. [Google Scholar] [CrossRef] [PubMed]
- Bright, T.; Felix, L.; Kuper, H.; Polack, S. Systematic review of strategies to increase access to health services among children over five in low- and middle-income countries. Trop. Med. Int. Health 2018, 23, 476–507. [Google Scholar] [CrossRef] [PubMed]
- Mactaggart, I.; Kuper, H.; Murthy, G.V.S.; Oye, J.; Polack, S. Measuring Disability in Population Based Surveys: The Interrelationship between Clinical Impairments and Reported Functional Limitations in Cameroon and India. PLoS ONE 2016, 11, e0164470. [Google Scholar] [CrossRef] [PubMed]
- Peters, D.H.; Garg, A.; Bloom, G.; Walker, D.G.; Brieger, W.R.; Rahman, M.H. Poverty and access to health care in developing countries. Ann. N. Y. Acad. Sci. 2008, 1136, 161–171. [Google Scholar] [CrossRef] [PubMed]


| Assessment Criteria | |
| |
| Overall Ratings | |
| ++ | Low risk of bias: All or almost of the above criteria were fulfilled, and those that were not fulfilled were thought unlikely to alter the conclusions of the study |
| + | Medium risk of bias: Some of the above criteria were fulfilled, and those not fulfilled were thought unlikely to alter the conclusions of the study |
| −− | High risk of bias: Few or no criteria were fulfilled, and the conclusions of the study were thought likely or very likely to alter with their inclusion |
| Variable | Number | % |
|---|---|---|
| Region | ||
| Latin America/Caribbean | 12 | 16% |
| East Asia/Pacific | 12 | 16% |
| Sub-Saharan Africa | 24 | 31% |
| Middle east | 7 | 9% |
| South Asia | 14 | 18% |
| Europe/Central Asia | 2 | 3% |
| Various | 6 | 8% |
| Country income group | ||
| Low | 26 | 33% |
| Low-middle | 22 | 28% |
| Upper-middle | 23 | 29% |
| Various | 6 | 8% |
| Location | ||
| Urban | 14 | 18% |
| Rural | 10 | 13% |
| Both | 38 | 49% |
| Unclear | 15 | 19% |
| Decade of publication | ||
| 1990–1999 | 11 | 14% |
| 2000–2009 | 25 | 32% |
| 2010–current | 41 | 53% |
| Age of participants | ||
| All ages | 29 | 38% |
| Adults only | 25 | 32% |
| Older adults | 7 | 9% |
| Children only | 11 | 14% |
| Unclear age/not presented | 5 | 6% |
| Study design | ||
| Cross-sectional | 63 | 82% |
| Retrospective longitudinal study | 2 | 3% |
| Case control study | 8 | 10% |
| Cohort | 4 | 5% |
| Disability domain | ||
| Hearing | 13 | 17% |
| Vision | 17 | 22% |
| Physical | 24 | 31% |
| Mental | 34 | 44% |
| Any disability | 27 | 35% |
| Multiple domains | 29 | 38% |
| Study Author, Year | Country (Study Location) | World Bank Region | Country Income Group | Locality (Urban or Rural) | Study Type | Participant Source | N (%D) | Age | Means of Assessing Disability | Outcome | Proportion Covered by Type of Rehabilitation (%) | Risk of Bias | ||
|---|---|---|---|---|---|---|---|---|---|---|---|---|---|---|
| Medical Rehabilitation | Assistive Devices | Adherence to Treatment | ||||||||||||
| Allain et al. (1997) [16] | Zimbabwe (Bindura, Marondera) | SSA | Low income | Both | Cross-sectional study | Population | 278 (NS); 55 (20%) with hearing impairment | Older adults | Self-report (bespoke tool, but unclear method) and observation by nurses | Wearing hearing aids when needed | - | 0 | - | Medium: adequate sample size, but small number with hearing loss, and unclear how hearing loss assessed |
| Bernabe-Ortiz et al. (2016) [17] | Peru (Morropon) | SSA | Upper-middle income | Semi-urban | Case control study | Population | 322 (50%) | All ages | Washington Group short set | Coverage of hearing aids (proportion of those who use hearing aids among those reported in need) | - | 9 | - | Medium: low response rate |
| Danquah et al. (2015) [18] | Haiti (Port-au-Prince) | LA | Low income | Urban | Case control study | Population | 356 (50%) | All ages | Washington Group short set | Met need for medical rehabilitation | 3 | 3 | - | Low |
| Devendra et al. (2013) [19] | Malawi (Lilongwe) | SSA | Low income | Unclear | Case control study | Clinic | 592 (50%) | Children | WHO ten questions | Proportion of children who attended ear clinic of those in need | 14 | - | - | Low |
| Kuper et al. (2016) [20] | Tanzania (Mbeya, Tanga, Lindi) | SSA | Low income | Both | Case control study | Population | 807 (39%) | All ages | Washington Group short set | Coverage of hearing aids (proportion of those who use hearing aids among those reported in need) | - | 0 | - | Low |
| Maart et al. (2013) [21] | South Africa (Cape Town) | SSA | Upper-middle income | Urban | Cross-sectional study | Population | 151 (100%) | All ages | Washington Group short set | % needing hearing therapy that received | 42 | - | - | Low |
| Mactaggart et al. (2015) [22] | Cameroon (Fundong Health District) | SSA | Low-middle income | Unclear | Case control study | Population | 845 (60%) | All ages | Washington Group extended set and clinical assessment | Coverage of hearing aids | - | 24 | - | Low |
| India (Mahbubnagar) | SA | Low-middle income | 703 (61%) | - | 6 | - | Low | |||||||
| Malta et al. (2016) [23] | Brazil (National) | LA | Upper-middle income | Both | Cross-sectional study | Population | 204,000 (NS) | All ages | Self-report (bespoke tool) | Attendance at rehabilitation services for those in need | 8 (9 urban, 4 rural) | - | - | Low |
| Nesbitt et al. (2012) [24] | Bangladesh (Natore, Sirajgani) | SA | Low income | Both | Prospective cohort study | Population | 1308 (100%) | Children | Clinical assessment | Uptake/compliance with referral for assistive device, therapy, further investigation, medicine, or surgery | - | - | 34 | Low |
| Omondi et al. (2007) [25] | Kenya (Kisumu) | SSA | Low income | Both | Cross-sectional study | Deaf schools | 33 (100%) | Children | Clinical assessment | Visit for hearing assessment (diagnosis); hearing aid use (assistive device) | 27 | 0 | - | High: small sample size |
| Padmamohan et al. (2009) [26] | India (Kerala) | SA | Low-middle income | Rural | Cross-sectional study | Population | 98 (100%) | Children | Households of children with disabilities were identified with community health workers | Use of rehabilitation treatment | 16 | - | - | Medium: small sample size; unclear measure of disability |
| Ribas et al. (2015) [27] | Brazil (Curibita) | LA | Upper-middle income | Rural | Cross-sectional study | Clinic | 578 (32%) | Older adults | Self-report (bespoke tool) | Had hearing test (diagnosis); wore hearing aids (assistive device) | 28 | 16 | - | Low: unreliable measure of disability |
| Tan et al. (2015) [28] | Malaysia (Penang) | EAP | Upper-middle income | Unclear | Cross-sectional study | Registry | 305 (100%) | Children | Registry | Coverage of hearing aids (assistive devices); proportion accessing hearing services) | 62 | 66 | - | High: poor response rate, and unreliable measure of disability |
| Study Author, Year | Country (Study Location) | World Bank Region | Country Income | Locality (Urban/Rural) | Study Type | Participant Source | N (%D) | Age Group | Specific Condition | Method of Assessment | Outcome | Proportion Covered by Rehabilitation Type % | Risk of Bias | |
|---|---|---|---|---|---|---|---|---|---|---|---|---|---|---|
| Medical Rehabilitation | Adherence to Treatment | |||||||||||||
| Studies measuring mental health and psychiatric disorders | ||||||||||||||
| Abas et al. (1997) [29] | Zimbabwe (Harare) | SSA | Low income | Urban | Cross-sectional study | Population | 51 (100%) | Adults | Depression and anxiety | Screening questionnaire and clinical examination | Receipt of antidepressant or anxiolytic | 0 (antidepressant) 10 (anxiolytic) | - | Medium: small sample size |
| Alekhya et al. (2015) [30] | India (Andhra Pradesh) | SA | Low-middle | Both | Cross-sectional study | Clinic | 103 (100%) | Adults | Depression | Clinical diagnosis | Proportion with good adherence | - | 30 | Medium: unclear measure of disability |
| Andersson et al. (2013) [31] | South Africa (Eastern Cape) | SSA | Upper-middle | Both | Cross-sectional study | Population | 977 (31%) | Adults | Depression | DSM-IV schedule (mini international neuropsychiatric review) | Proportion of those emotionally troubled who sought care | 43 | - | Low |
| Hailemariam et al. (2012) [32] | Ethiopia (9 regions) | SSA | Low income | Both | Cross-sectional survey | Population | 449 (100%) | Adults | Depression | World Mental Health Survey version of the Composite International Diagnostic Interview | Visiting health facilities for depressive episodes | 23 | - | Low |
| Snyder et al. (1999) [33] | Mexico (Jalisco) | LA | Upper-middle | Rural | Cross-sectional study | Population | 945 (6.2%) | Adults | Depression | WHO World Mental Health Composite International Diagnostic Interview | Treatment received | Male 0; Female 13.0 | - | Low |
| Karam et al. (1994) [34] | Lebanon (Bejjeh, Kornet Shehwan, Ashrafieh, Ain Remmaneh) | ME | Upper-middle | Unclear | Cross-sectional study | Population | 213 (100%) | Adults | Major depressive disorder | Diagnostic Interview Schedule (DIS) by psychologists | Consulted doctor; consulted other professional; treatment received | 23; 6; 30 | - | Medium: risk of recall bias |
| Fujii et al. (2012) [35] | Brazil (National) | LA | Upper-middle | Both | Cross-sectional, web-based survey | Population (identified through the web) | 9789 (10%) | Adults | Major depressive disorder | Self-report (bespoke tool) followed by validated questionnaire | Currently taking prescription medication | 54 | - | High: risk of selection bias |
| El Sayed et al. (2015) [36] | 48 LMICs (various National level surveys) | Various | Various | Both | Cross-sectional study (World Health Surveys) | Population | 197,914 (NS) | Adults | Depression and schizophrenia | Self-report (bespoke tool) | Proportion in treatment: depression, schizophrenia | 65; 67 | - | Low |
| Raban et al. (2010) [37] | India (Assam, Karnataka, Maharashtra, Rajasthan, Uttar Pradesh, West Bengal) | SA | Low-middle | Both | Cross-sectional study | Population | 9994 (NS) | Adults | Depression and schizophrenia | Self-report (validated tool) | Treatment coverage: depression; schizophrenia | 12; 50 | - | Medium: means of assessing disability not reliable |
| Padmavathi et al. (1998) [38] | India (Madras) | SA | Low income | Urban | Cross-sectional study | Population | 261 (100%) | All ages | Schizophrenia | Family report using screening tool, and detailed examination by a psychiatrist | Ever received treatment | 71 | - | Low |
| Lora et al. (2012) [39] | 50 LMICs (National) | Various | Various | Unclear | Cross-sectional survey | Various | Unclear | Adults | Schizophrenia | Global burden of disease data for prevalence of schizophrenia, and number of people who received care (facility level data) | Treatment coverage (psychiatrist, mental health professionals) | 11 (Low income); 31 (Low-middle income) | - | Low |
| Demyttenaere et al. (2004) [40] | China (National) | EAP | Low-middle | Urban | Cross-sectional study | Population | 1628 (21%) | Adults | Mental disorders | WHO composite international diagnostic interview (WMH, CIDI) | Sought treatment for condition in the past 12 months: mild; moderate; serious | Beijing: mild 2; serious: 12 Shanghai: serious: 0.5 | - | Low |
| Nigeria (National) | SSA | Low income | Urban | 1682 (14%) | 10 | - | Low | |||||||
| Ukraine (National) | EU | Low-middle | Both | 1720 (56%) | Mild 7 Moderate 17 Serious 19 | - | Low | |||||||
| Lebanon (National) | ME | Upper-middle | Both | 1029 (47%) | Mild 4.5 Moderate 10 Serious 15 | - | Low | |||||||
| Colombia (National) | LA | Low-middle | Urban | 2442 (33%) | Mild 8 Moderate 12 Serious 24 | - | Low | |||||||
| Mexico (National) | LA | Upper-middle | Urban | 2362 (30%) | Mild 10 Moderate 19 Serious 20 | - | Low | |||||||
| Andrade et al. (2002) [41] | Brazil (Sao Paulo) | LA | Upper-middle | Urban | Case control study | Population | 1464 (27%) | Adults | Mental disorders | WHO World Mental Health Composite International Diagnostic Interview | Received specialty medical care: any disorder; mood; anxiety; substance use | 13; 23; 20; 10 | - | Low |
| Caraveo et al. (1999) [42] | Mexico (Mexico City) | LA | Upper-middle | Urban | Cross-sectional study | Population | 1937 (8.3%) | Adults | Mental health condition | WHO World Mental Health Composite International Diagnostic Interview | Care seeking for mental health condition | Total proportion seeking help < 50% | - | Medium: response rate lower than 70% |
| Loeb et al. (2004) [43] | Malawi (National) | SSA | Low income | Both | Cross-sectional study | Population | 1574 (100%) | All ages | Mental/emotional difficulties | Self-report (bespoke tool) | Ever received rehabilitation (medical) | 22 | - | Low |
| Eide et al. (2006) [44] | Zambia (National) | SSA | Low income | Both | Cross-sectional study | Population | 2865 (100%) | All ages | Difficulties remembering, concentrating | Washington Group short set | Ever received rehabilitation (medical) | 30 | - | Low |
| Alhasnawi et al. (2009) [45] | Iraq (National) | ME | Low-middle | Both | Cross-sectional study | Population | 4332 (14.5%) | Adults | Mental disorders | Questionnaire based on ICD10 and DSM-IV | Any health care treatment (mild; moderate; serious) | 3; 4; 17 | - | Low |
| Li et al. (2013) [46] | China (National) | EAP | Upper-middle | Both | Cross-sectional study | Population | 2.6 million (0.6%) | All ages | Mental disorders | Self-report (bespoke tool) followed by clinical examination and WHO DAS | Use of services: rehabilitation; medication | 1; 40 | - | Low |
| Maart et al. (2013) [21] | South Africa (Cape Town) | SSA | Upper-middle | Urban | Cross-sectional study | Population | 151 (100%) | All ages | Difficulties remembering | Washington Group short set | Proportion needing treatment who received | 68 | - | Low |
| Malta et al. (2016) [23] | Brazil (National) | LA | Upper-middle | Both | Cross-sectional study | Population | 20,400 (6%) | All ages | Mental impairment (unspecified) | Self-report (bespoke tool) | Attendance at rehabilitation services | 30 | - | Low |
| Chikovani et al. (2015) [47] | Georgia (conflict affected areas) | EU | Upper-middle | Unclear | Cross-sectional study | Population (conflict affected areas) | 3600 (30%) | Adults | Mental impairment | Self-report (bespoke) and validated clinical tools | Self-reported problem and sought care | 39 | - | Low |
| Trump et al. (2006) [48] | South Africa (National) | SSA | Upper-middle | Both | Cross-sectional study | Support group members, leaders | 331 (100%) | All ages | Mental disorders | Self-report (bespoke tool) | Compliance (self-report) | - | 32 | High: low response rate, means of assessing disability unreliable |
| Ormel et al. (2008) [49] | 6 LMICs (regional: Colombia, Mexico, China; national: Lebanon, South Africa, Ukraine) | Various | Various | Both | Cross-sectional study | Population | 73,441 (NS) | Adults | Mental disorders | Self-report (Chronic disorders checklist) | Treatment prevalence by type of impairment: mental disorders (visiting a professional) | 8 | - | Low |
| Seedat et al. (2009) [50] | South Africa (National) | SSA | Low-middle | Both | Cross-sectional study | Population | 4317 (NS) | Adults | Mental disorders | World Health Organization (WHO) Composite International Diagnostic Interview | Sought treatment for condition in the past 12 months | 25 | - | Low |
| Ma et al. (2012) [51] | China (Guangdong) | EAP | Upper-middle | Urban | Cohort study | Population, hospitals | 1386 (100%) | Adults | Psychiatric disorders | Clinical diagnosis | Adherence to medication | - | 95 | Low |
| Caraveo et al. (1997) [52] | Mexico (Mexico City) | LA | Upper-middle | Urban | Cross-sectional study | Population | 2857 (28.7%) | All ages | Psychiatric disorders | WHO World Mental Health Composite International Diagnostic Interview | Care seeking for mental health condition | 14 | - | Medium: response rate lower than 70% |
| Paula et al. (2014) [53] | Brazil (North, Northeast, Central, Southeast) | LA | Upper-middle | Both | Cross-sectional study | Schools | 1721 (12%) | Children | Psychiatric disorders | Validated tool (KSADS-PL) based on caregiver report | Mental health service use in past 12 months: affective; anxiety; disruptive; eating; psychotic disorder; co-morbidity | 20; 17; 20; 9; 0; 30 | - | Low |
| Chadda et al. (2000) [54] | India (Delhi) | SA | Low income | Not clear | Retrospective study | Clinic | 80 (100%) | All ages | Psychiatric morbidity (schizophrenia, bipolar, unspecified psychosis) | Clinical diagnosis | Compliance with treatment regimen | - | 97 | High: small sample size |
| Llosa et al. (2014) [55] | Lebanon (Burj el-Barajneh refugee camp) | ME | Upper-middle | Urban | Cross-sectional study | Population | 194 (45%) | Adults | Psychiatric disorders | WHO UNHCR Assessment Schedule of Serious Symptoms in Humanitarian Settings (WASSS), followed by clinical exam | Treatment coverage (received psychological or psychiatric care) | 6 | - | Medium: Low response rate |
| Results of studies measuring intellectual impairment | ||||||||||||||
| Padmamohan et al. (2009) [26] | India (Kerala) | SA | Low-middle | Rural | Cross-sectional study | Population | 98 (100%) | Children | Intellectual impairment | Households of children with disabilities were identified by community health workers | Treatment received | 87 | - | Medium: small sample size; unclear measure of disability |
| Dejene et al. (2016) [56] | Ethiopia (Addis Ababa) | SSA | Low income | Urban | Cross-sectional study | Clinic | 102 (100%) | Children | Intellectual disability, autism spectrum disorder | Clinical diagnosis | Met need for treatment by health professional | 73 * | - | Low |
| Results of studies measuring epilepsy | ||||||||||||||
| Allain et al. (1997) [16] | Zimbabwe (Uzumba Maramba Pfungwe, Bindura, Marondera) | SSA | Low income | Both | Cross-sectional study | Population | 278 (NS) | Older adults | Epilepsy | Self-report (bespoke tool, method unclear), nurse observation | Receipt of anti-epileptic medication | 0 | - | Medium: unclear measure of disability |
| Coleman et al. (2002) [57] | Gambia (Farafenni) | SSA | Low income | Rural | Cross-sectional study | Population | 69 (100%) | All ages | Epilepsy | Screening questionnaire followed by psychologist review | Ever sought biomedical treatment for epilepsy (medication) | 52 | - | Low |
| Nesbitt et al. (2012) [24] | Bangladesh (Natore, Sirajgani) | SA | Low income | Both | Key informant method; prospective cohort study | Population | 1308 (100%) | Children | Epilepsy | Clinical diagnosis | Took up referral | - | 34 | Low |
| Study Author, Year | Country (Study Location) | World Bank Region | Country Income | Locality (Urban/Rural) | Age Group | Study Type | Participant Source | N (%D) | Specific Condition | Method of Assessment | Outcome | Proportion Covered by Type of Rehabilitation % | Risk of Bias | ||
|---|---|---|---|---|---|---|---|---|---|---|---|---|---|---|---|
| Medical Rehabilitation | Assistive Device | Adherence | |||||||||||||
| Bernabe-Ortiz et al. (2016) [17] | Peru (Moroppan) | LA | Upper-middle | Semi-urban | All ages | Case control study | Population | 798, 308 (5%) | Difficulties walking (WG) | Washington Group short set | Coverage: Walking stick; wheelchair, crutches, standing frame | - | 26; 33; 26; 10 | - | Medium: low response rate |
| Bigelow et al. (2004) [58] | Haiti (Port-de-Paix, Cap-Haitien, Fort Liberte, Port-au-Prince, Jacmel, Les Cayes, Jeremie) | LA | Low income | Both | All ages | Cross-sectional study | Registry, hospitals, organizations | 164 (100%) | Amputation | Registry, hospitals, word of mouth | Had a prosthetic limb in the past, or currently had | - | 25 | - | High: small sample size |
| Devendra et al. (2013) [19] | Malawi (Lilongwe) | SSA | Low income | Unclear | Children | Case control study | Clinic | 592 (50%) | Physical impairment (unspecified) | WHO ten questions | Proportion of children who attended physiotherapy | 42 | Low | ||
| Doocy et al. (2016) [59] | Jordan (National) | ME | Upper-middle | Both | Not presented | Cross-sectional study | Population | 9580 (14%) | Arthritis | Self-report (bespoke tool) | Care sought for chronic condition | 76 | - | - | Medium: unreliable measure of disability |
| El Sayed et al. (2015) [36] | 48 LMIC (National) | Various | Various | Both | Adults | Cross-sectional study | Population | 197,914 (NS) | Arthritis | Self-report (bespoke tool) | Proportion in treatment | 77 | - | - | Low |
| Eide et al. (2006) [44] | Zambia (National) | SSA | Low income | Both | All ages | Cross-sectional study | Population | 2865 (100%) | Difficulties walking (WG) | Self-report (bespoke tool) | Ever received assistive devices; Ever received rehabilitation (medical) | 25 | 50 | - | Low |
| Gadallah et al. (2015) [60] | Egypt (Cairo) | ME | Low-middle income | Urban | Adults | Cross-sectional study | Clinic | 140 (100%) | Arthritis (rheumatoid) | Patients registered with rheumatology clinic | Medication adherence test | - | - | 0 | High: unclear measure of disability; clinic-based sample; recall bias likely |
| Kumar et al. (2004) [61] | Nepal (Dhanusa) | SA | Low income | Unclear | Adults | Cross-sectional study | Clinic | 273 (42%) | Leprosy | Clinical examination (WHO guidelines) | Treatment completion | - | - | 71 | Medium: unclear how patients selected, clinic-based sample |
| Kuper et al. (2016) [20] | Tanzania (Mbeya, Tanga, Lindi) | SSA | Low income | Both | All ages | Case control study | Population | 254 (50%) | Difficulties walking (WG) | Washington Group short set + albinism | Coverage of: Wheelchair; crutches; walking stick; standing frame | - | 5; 50; 53; 57 | - | Low |
| Loeb et al. (2004) [43] | Malawi (National) | SSA | Low income | Both | All ages | Cross-sectional study | Population | 1574 (100%) | Difficulties walking (WG) | Self-report (bespoke tool) | Ever received assistive devices; Ever received rehabilitation (medical) | 31 | 25 | - | Low |
| Malta et al. (2016) [23] | Brazil (National) | LA | Upper-middle | Both | All ages | Cross-sectional study | Population | 204,000 (NS) | Physical impairment (unspecified) | Self-report (bespoke tool) | Attendance at rehabilitation services | 18 | - | - | Low |
| Maart et al. (2013) [21] | South Africa (Cape Town) | SSA | Upper-middle | Urban | All ages | Cross-sectional study | Population | 151 (100%) | Difficulties walking (WG) | Washington Group short set | Medical rehabilitation coverage | 66 | - | - | Low |
| Mactaggart et al. (2015) [22] | India (Mahbabnagar) | SA | Low-middle income | Unclear | All ages | Case control study | Population | 845 (60%) | Difficulties walking (WG) | Washington Group extended set | Coverage of: Wheelchair; crutches; walking stick; standing frame | - | 26; 43; 87; 58 | - | Low |
| Cameroon (Fundong Health District) | SSA | Low-middle income | 703 (61%) | 41; 32; 93; 33 | |||||||||||
| McConachie et al. (2000) [62] | Bangladesh (location unclear) | SA | Low income | Both | Children | Cohort study | Clinic | 47 (100%) | Cerebral Palsy | Clinical diagnosis | Attendance at 8–9 distance training package sessions | - | 29 | Medium: small sample size | |
| Nesbitt et al. (2012) [24] | Bangladesh (Natore, Sirajgani) | SA | Low income | Both | Children | Cross-sectional study | Population | 1308 (100%) | Physical impairment (unspecified) | Clinical assessment | Took up referral | - | - | 50 | Low |
| Ormel et al. (2008) [49] | Various (National) | Various | Various | Both | Not presented | Cross-sectional study | Population | 73,441 (NS) | Musculoskeletal impairment (MSI) | Chronic disorders checklist | Treatment prevalence | 52 | - | - | Low |
| Padmamohan et al. (2009) [26] | India (Kerala) | SA | Low-middle income | Rural | Children | Cross-sectional study | Population | 98 (100%) | Physical impairment (unspecified) | Community health workers assessment | Treatment received | 47 | - | - | Medium: small sample size; unclear measure of disability |
| Raban et al. (2010) [37] | India (Assam, Karnataka, Maharashtra, Rajasthan, Uttar Pradesh, West Bengal) | SA | Low-middle income | Both | Adults | Retrospective study | Population | 9994 (NS) | Arthritis | Self-report (validated) | Treatment coverage | 58 | - | - | Medium: unreliable measure of disability |
| Saleh et al. (2015) [63] | Jordan (Amman) | ME | Upper-middle | Both | Children | Cross-sectional study | Clinic | 116 (100%) | Cerebral palsy | Clinical diagnosis | Proportion who received treatment for a range of problems | Range: 24–100% (median: 50%) | - | - | High: unclear response rate; small sample size; selection bias |
| Schafer et al. (1998) [64] | Chad (Guera prefecture) | SSA | Low income | Unclear | All ages | Cross-sectional study | Clinic | 351 (48%) | Leprosy | Clinical diagnosis | Footwear coverage; treatment completion rate | - | 45 | 73 | High: unclear measure of access; potential for selection bias |
| Suman et al. (2015) [65] | India (West Bengal) | SA | Low-middle income | Both | All ages | Cross-sectional study | Population | 43,999 (1.3%) | Arthritis | Self-report (bespoke tool) | Care sought from: qualified provider (private), qualified (public) | 4; 3 | - | - | Medium: unreliable measure of disability |
| Tan et al. (2015) [28] | Malaysia (Penang) | EAP | Upper-middle | Unclear | Children | Cross-sectional study | Registry | 305 (100%) | Physical impairment (unspecified) | Registry | Met need for: Mobility aid (e.g., wheelchair); Physiotherapy | 59 | 44 | - | Medium: low response rate |
| Wanaratwichit et al. (2008) [66] | Thailand (Phrae, Sukhothai, Chiang Rai) | EAP | Low-middle income | Unclear | Adults | Cross-sectional study | Population | 406 (100%) | Physical impairment (unspecified) | Unclear | Proportion who have access to equipment; proportion who have access to physical rehabilitation | 67 | 55 | - | Medium: measure of disability unclear |
| Zongjie et al. (2007) [67] | China (Xincheng, Xuanwu, Beijing) | EAP | Low-middle income | Unclear | All ages | Cross-sectional study | Population, registry | 460 (100%) | Various conditions | Registry | Received rehabilitation in the past 3 months | 27 | - | - | Medium: unclear means of assessing access and disability |
| Study Author, Year | Country | World Bank Region | Country Income Group | Locality | Age | Type of Study | Participant Source | N (D%) | Method of Assessment | Outcome | Proportion Covered by Type of Rehabilitation % | Risk of Bias | ||
|---|---|---|---|---|---|---|---|---|---|---|---|---|---|---|
| Medical Rehabilitation | Assistive Device | Adherence | ||||||||||||
| Ahmad et al. (2015) [68] | Pakistan (Karachi) | SA | Low-middle income | Unclear | Older adults | Cross-sectional study | Population | 638 (24%) | Visual acuity assessment; self-reported eye/vision problem | Ever sought treatment (blind; moderate visual impairment; severe visual impairment) | 63; 50; 40 | - | - | Low |
| Bernabe-Ortiz et al. (2016) | Peru (Morropon) | LA | Upper-middle | Semi-urban | All ages | Cross-sectional study | Population | 798,308 (5%) | Washington Group short set | Coverage: Magnifying glasses | - | 33 | - | Medium: low response rate |
| Brian et al. (2012) [69] | Fiji (National) | EAP | Upper-middle | Both | Older adults | Cross-sectional study | Population | 1381 (93%) | Visual acuity assessment and self-report | Consulted a provider (blind; low vision) | 62; 53 | - | - | Low |
| Devendra et al. (2013) [19] | Malawi (Lilongwe) | SSA | Low income | Unclear | Children | Case control study | Clinic | 592 (50%) | WHO ten questions | Proportion of children who attended eye clinic of those in need | 57 | - | - | Low |
| Fletcher et al. (1999) [70] | India (Maduari) | SA | Low income | Rural | Adults | Cross-sectional study | Population | 1039 (34%) | Visual acuity assessment | Attendance at camps for people identified as having need | 7 | - | - | Low |
| Kovai et al. (2007) [71] | India (Andhra Pradesh) | SA | Low-middle income | Rural | Adults | Cross-sectional study | Population | 5573 (22%) | Visual acuity assessment | Sought treatment | 31 | - | - | Low |
| Kuper et al. (2016) [20] | Tanzania (Mbeya, Tanga, Lindi) | SSA | Low income | Both | All ages | Case control study | Population | 254 (50%) | Washington Group short set | Coverage of: White cane; guide | - | 18; 50 | - | Low |
| Lee et al. (2013) [72] | Timor Leste (12 districts) | EAP | Low-middle income | Both | Older adults | Cross-sectional study | Population | 2014 (93%) | Visual acuity assessment | Consulted care provider about vision problem: low vision/blindness; self-reported problem | 25;26 | - | - | Low |
| Maart et al. (2013) [21] | South Africa (Cape Town) | SSA | Upper-middle | Urban | All ages | Cross-sectional study | Population | 151 (100%) | Washington Group short set | Proportion needing medical rehabilitation that received | 57 | - | - | Low |
| Mactaggart et al. (2015) [22] | Cameroon (Fundong Health District) | SSA | Low-middle income | Unclear | All ages | Case control study | Population | 703 (61%) | Washington Group extended set | Coverage of: Magnifying glasses; white cane | - | 15; 33 | - | Low |
| India (Mahbabnagar) | SA | Low-middle income | 845 (60%) | - | 46; 0 | - | Low | |||||||
| Mahande et al. (2007) [73] | Tanzania (Hai) | SSA | Low income | Rural | Older adults | Cohort study | Population | 163 (56%) | Visual acuity assessment | Trichiasis surgery uptake (visual impairment; blind) | 47; 41 | - | - | Medium: small sample size, response rate unclear |
| Malta et al. (2016) [23] | Brazil (National) | LA | Upper-middle | Both | All ages | Cross-sectional study | Population | 204,000 (NS) | Self-report (bespoke tool) | Attendance at rehabilitation services | 5 | - | - | Low |
| Nesbitt et al. (2012) [24] | Bangladesh (Natore, Sirajgani) | SA | Low income | Both | Children | Key informant method initially; then prospective cohort study | Population | 1308 (100%) | Clinical examination | Took up referral | - | - | 31 | Low |
| Palagyi et al. (2008) [74] | Timor Leste (Dili, Bobonaro) | EAP | Low-middle income | Both | Older adults | Cross-sectional study | Population | 1414 (23%) | Visual acuity assessment | Sought treatment from Western Style health services | 29 | - | - | Low |
| Raban et al. (2010) [37] | India (Assam, Karnataka, Maharashtra, Rajasthan, Uttar Pradesh, West Bengal) | SA | Low-middle income | Both | Adults | Retrospective study | Population | 9994 (NS) | Self-report (validated) | Treatment coverage | 21 | - | - | Medium: unreliable measure of disability |
| Tan et al. (2015) [28] | Malaysia (Penang) | EAP | Upper-middle | Unclear | Children | Cross-sectional study | Registry | 305 (100%) | Registry | Met need for: Vision aids; Vision related services | 52 | 47 | - | Medium: low response rate; unclear means of assessing disability |
| Udeh et al. (2014) [75] | Nigeria (Enugu state) | SSA | Low income | Unclear | All ages | Cross-sectional study | Population | 153 (100%) | Recruited through community leaders | Previous eye check; Used low vision device | 82 | 0 | - | High: unclear response rate; unclear measure of access |
| Study Author, Year | Country | World Bank Region | Country Income Group | Locality | Age | Type of Study | Participant Source | Sample Size | Means of Assessing Disability | Outcome | Proportion Covered by Type of Rehabilitation (%) | Risk of Bias | ||
|---|---|---|---|---|---|---|---|---|---|---|---|---|---|---|
| General Rehab | Assistive Device | Adherence | ||||||||||||
| Bernabe-Ortiz et al. (2016) [17] | Peru (National) | LA | Upper-middle | Urban | All ages | Cross-sectional study | Population | 798,608 (5%) | Washington Group short set | Any access to a range of rehabilitation services | 11 | Low | ||
| Bernabe-Ortiz et al. (2016) [76] | Peru (Morropon) | LA | Upper-middle | Semi-urban | All ages | Cross-sectional study (with nested case control) | Population | 3684 (8%) | Washington Group short set | Proportion using rehabilitation now among those in need | 5 | Medium: low response rate | ||
| Borker et al. (2012) [77] | India (Goa) | SA | Low-middle income | Rural | Not presented | Cross-sectional study | Population | 936 families (18%) | Bespoke tool/clinical examination | Use of rehabilitation care | 24 | High: unclear measure of disability, no response rate reported | ||
| Danquah et al. (2015) [18] | Haiti (Port-au-Prince) | LA | Low income | Urban | All ages | Case control study | Population | 376 (50%) | Washington Group short set | Met need for specialist health care; medical rehabilitation; specialist advice | 32; 49; 23 | 18 | Low | |
| Devendra et al. (2013) [19] | Malawi (Lilongwe) | SSA | Low income | Unclear | Children | Case control study | Clinic | 592 (50%) | WHO ten questions | Access to: rehabilitation services, assistive devices | 33 | 5 | Low | |
| Eide et al. (2003) [78] | Zimbabwe (National) | SSA | Low income | Both | All ages | Cross-sectional study | Population | 1972 (100%) | Self-report (bespoke tool) | Received rehabilitation; assistive devices | 55 | 36 | Low | |
| Loeb et al. (2004) [43] | Malawi (National) | SSA | Low income | Both | All ages | Cross-sectional study | Population | 1574 (100%) | Self-report (bespoke tool) | Received rehabilitation; assistive devices | 24 | 18 | Low | |
| Eide et al. (2003) [79] | Namibia (National) | SSA | Low-middle | Both | All ages | Cross-sectional study | Population | 2528 (100%) | Self-report (bespoke tool) | Received rehabilitation; assistive devices | 26 | 17 | Low | |
| Eide et al. (2006) [44] | Zambia (National) | SSA | Low income | Both | All ages | Cross-sectional study | Population | 2865 (100%) | Washington Group short set | Received rehabilitation; assistive devices | 37 | 18 | Low | |
| Eide et al. (2009) [80] | Mozambique (National) | SSA | Low income | Both | All ages | Cross-sectional study | Population | 666 (100%) | Washington Group short set | Received rehabilitation; assistive devices | 38 | 18 | Low | |
| Eide et al. (2011) [81] | Swaziland (National) | SSA | Low-middle | Both | All ages | Cross-sectional study | Population | 866 (100%) | Washington Group short set | Received rehabilitation; assistive devices | 31 | 32 | Low | |
| Eide et al. (2016) [82] | Nepal (National) | SA | Low income | Both | All ages | Cross-sectional study | Population | 2123 (100%) | Washington Group short set | Received rehabilitation; assistive devices | 22 | 22 | Low | |
| Eide et al. (2016) [83] | Botswana (National) | SSA | Upper-middle | Both | All ages | Cross-sectional study | Population | 2123 (100%) | Washington Group short set | Received rehabilitation; assistive devices | 33 | 34 | Low | |
| Hamdan et at. (2009) [84] | Palestine (Tulkarm, Qualqilia) | ME | Low-middle | Rural | All ages | Cross-sectional study | Population | 806 (100%) | Clinical examination | Use of equipment | 19 | Low | ||
| Hosain et al. (1998) [85] | Bangladesh (Maniramore Thana, Jessore district) | SA | Low income | Rural | All ages | Cross-sectional study | Population | 1906 (8%) | Head of household report | Sought treatment from qualified provider | 34 | Medium: unreliable measure of disability | ||
| Kisioglu et al. (2003) [86] | Turkey (Isparta) | EU | Low-middle | Both | All ages | Cross-sectional study | Population | 3500 (5%) | Self-report (bespoke tool) | Receipt of rehabilitation | 5 | High: unreliable measure of disability; unclear response rate | ||
| Kuper et al. (2015) [87] | Kenya (Turkana) | SSA | Low income | Unclear | Children | Case control study | Population | 807 (39%) | Washington Group short set | Receipt of rehabilitation | 15 | Low | ||
| Kuper et al. (2016) [20] | Tanzania (Mbeya, Tanga, Lindi) | SSA | Low income | Both | All ages | Case control study | Population | 254 (50%) | Washington Group short set | Coverage of rehabilitation services; specialist health services; assistive devices | 20; 5 | 33 | Low | |
| Maart et al. (2013) [21] | South Africa (Cape Town) | SSA | Upper-middle | Urban | All ages | Cross-sectional study | Population | 151 (100%) | Washington Group short set | Medical rehabilitation; assistive device | 71 | 66 | Low | |
| Mactaggart et al. (2015) [22] | India (Mahbabnagar) | SA | Low-middle income | Unclear | All ages | Case control study | Population | 703 (61%) | Washington Group extended set | Met need for medical rehabilitation; assistive devices | 61 | 48 | Low | |
| Cameroon (Fundong Health District) | SSA | Low-middle income | 845 (60%) | 76 | 44 | |||||||||
| Marella et al. (2014) [88] | Fiji (not specified) | EAP | Upper-middle | Both | Adults | Case control study | Population | 101 (50%) | Rapid Assessment of Disability | Access to rehabilitation; access to assistive devices | 45 | 35 | Low | |
| Bangladesh (Bogra) | SA | Low income | 195 (50%) | 7 | 12 | |||||||||
| Marella et al. (2016) [89] | Philippines (Quezon, Liago City) | EAP | Low-middle income | Both | Adults | Case control study | Population | 204,000 (6%) | Rapid Assessment of Disability | Access to rehabilitation; Access to assistive devices | 70 | 46 | Low | |
| Nesbitt et al. (2012) [24] | Bangladesh (Natore, Sirajgani) | SA | Low income | Both | Adults | Prospective cohort study | Population | 1308 (100%) | Clinical examination | Uptake of referral | 48 | Low | ||
| Nualnetr et al. (2012) [90] | Thailand (Non Bon, Kosum Phisai, Maha Sarakham) | EAP | Low-middle income | Rural | Not specified | Cross-sectional study | Registry | 99 (99; 100%) | Not specified | Assistive device received and appropriate | 33 | - | Low | |
| Padmamohan et al. (2009) [26] | India (Kerala) | SA | Low-middle income | Rural | Children | Cross-sectional study | Population | 98 (100%) | Community health workers assessment | Use of rehabilitation treatment | 48 | Medium: small sample size, method of disability assessment unreliable | ||
| Pongprapai et al. (1996) [91] | Thailand (Nongjik) | EAP | Low-middle | Unclear | Children | Cross-sectional study | Population | 53 (100%) | Bespoke questionnaire and clinical examination | Sought treatment for child’s condition | 62 | Medium: unclear measure of disability; unclear response rate | ||
| Souza et al. (2012) [92] | Brazil (Bahia) | LA | Upper-middle | Urban | All ages | Cross-sectional study | Population | 235 (100%) | Self-report (bespoke tool) | Ever received treatment | 80 | Medium: unclear measure of disability | ||
| Tan et al. (2015) [28] | Malaysia (Penang) | EAP | Upper-middle | Unclear | Children | Cross-sectional study | Registry | 305 (100%) | Registry | Met need for services (specialist doctor; therapy; assistive device) | 76 | Medium: low response rate | ||
| Barrier | Reference |
|---|---|
| Geographic accessibility | |
| Distance to service | [19,21,26,28,31,47,69,71,72,74,93] |
| Transport problems | [18,19,21,28,31,69,72,74,77,84,89,94] |
| Nobody to accompany | [28,69,71,72,74,77,93] |
| Affordability | |
| Unable to afford services | [18,19,20,21,22,26,27,31,47,58,62,67,71,72,74,77,84,89] |
| Unable to afford treatment | [19,47,60,70,75,93] |
| No insurance | [47] |
| Acceptability | |
| Do not know where to go for treatment | [27,28,31,47,48,69,71,72,74,93] |
| Have not heard about service | [75] |
| Thought nothing could be done | [31,48,69,70,71,72,74] |
| Lack of perceived need | [20,31,47,48,69,70,71,72,74,95] |
| Family do not perceive need | [71] |
| Fear of seeking care | [31,69,70,71,72,74] |
| No time/other priorities | [28,47,69,70,71,72,74,84,93] |
| Other medical problems | [60,71] |
| Shame | [31,95] |
| Lack of trust in healthcare providers keeping confidentiality | [31] |
| Availability | |
| Waiting time at the clinic | [31,74,77] |
| Not availability of drugs, services | [21,28,60,75,84,93] |
| Quality | |
| Discrimination/poor treatment from health provider | [19,21,28,31,47,69] |
| Poor relationship with provider | [70,71,95] |
| Provider refused care | [28,84] |
| Communication barrier | [21] |
| Provider lacks skills | [28,67] |
© 2018 by the authors. Licensee MDPI, Basel, Switzerland. This article is an open access article distributed under the terms and conditions of the Creative Commons Attribution (CC BY) license (http://creativecommons.org/licenses/by/4.0/).
Share and Cite
Bright, T.; Wallace, S.; Kuper, H. A Systematic Review of Access to Rehabilitation for People with Disabilities in Low- and Middle-Income Countries. Int. J. Environ. Res. Public Health 2018, 15, 2165. https://doi.org/10.3390/ijerph15102165
Bright T, Wallace S, Kuper H. A Systematic Review of Access to Rehabilitation for People with Disabilities in Low- and Middle-Income Countries. International Journal of Environmental Research and Public Health. 2018; 15(10):2165. https://doi.org/10.3390/ijerph15102165
Chicago/Turabian StyleBright, Tess, Sarah Wallace, and Hannah Kuper. 2018. "A Systematic Review of Access to Rehabilitation for People with Disabilities in Low- and Middle-Income Countries" International Journal of Environmental Research and Public Health 15, no. 10: 2165. https://doi.org/10.3390/ijerph15102165
APA StyleBright, T., Wallace, S., & Kuper, H. (2018). A Systematic Review of Access to Rehabilitation for People with Disabilities in Low- and Middle-Income Countries. International Journal of Environmental Research and Public Health, 15(10), 2165. https://doi.org/10.3390/ijerph15102165