Health Risk Assessment of Trace Metals in Various Environmental Media, Crops and Human Hair from a Mining Affected Area


Abstract
:1. Introduction
2. Materials and Methods
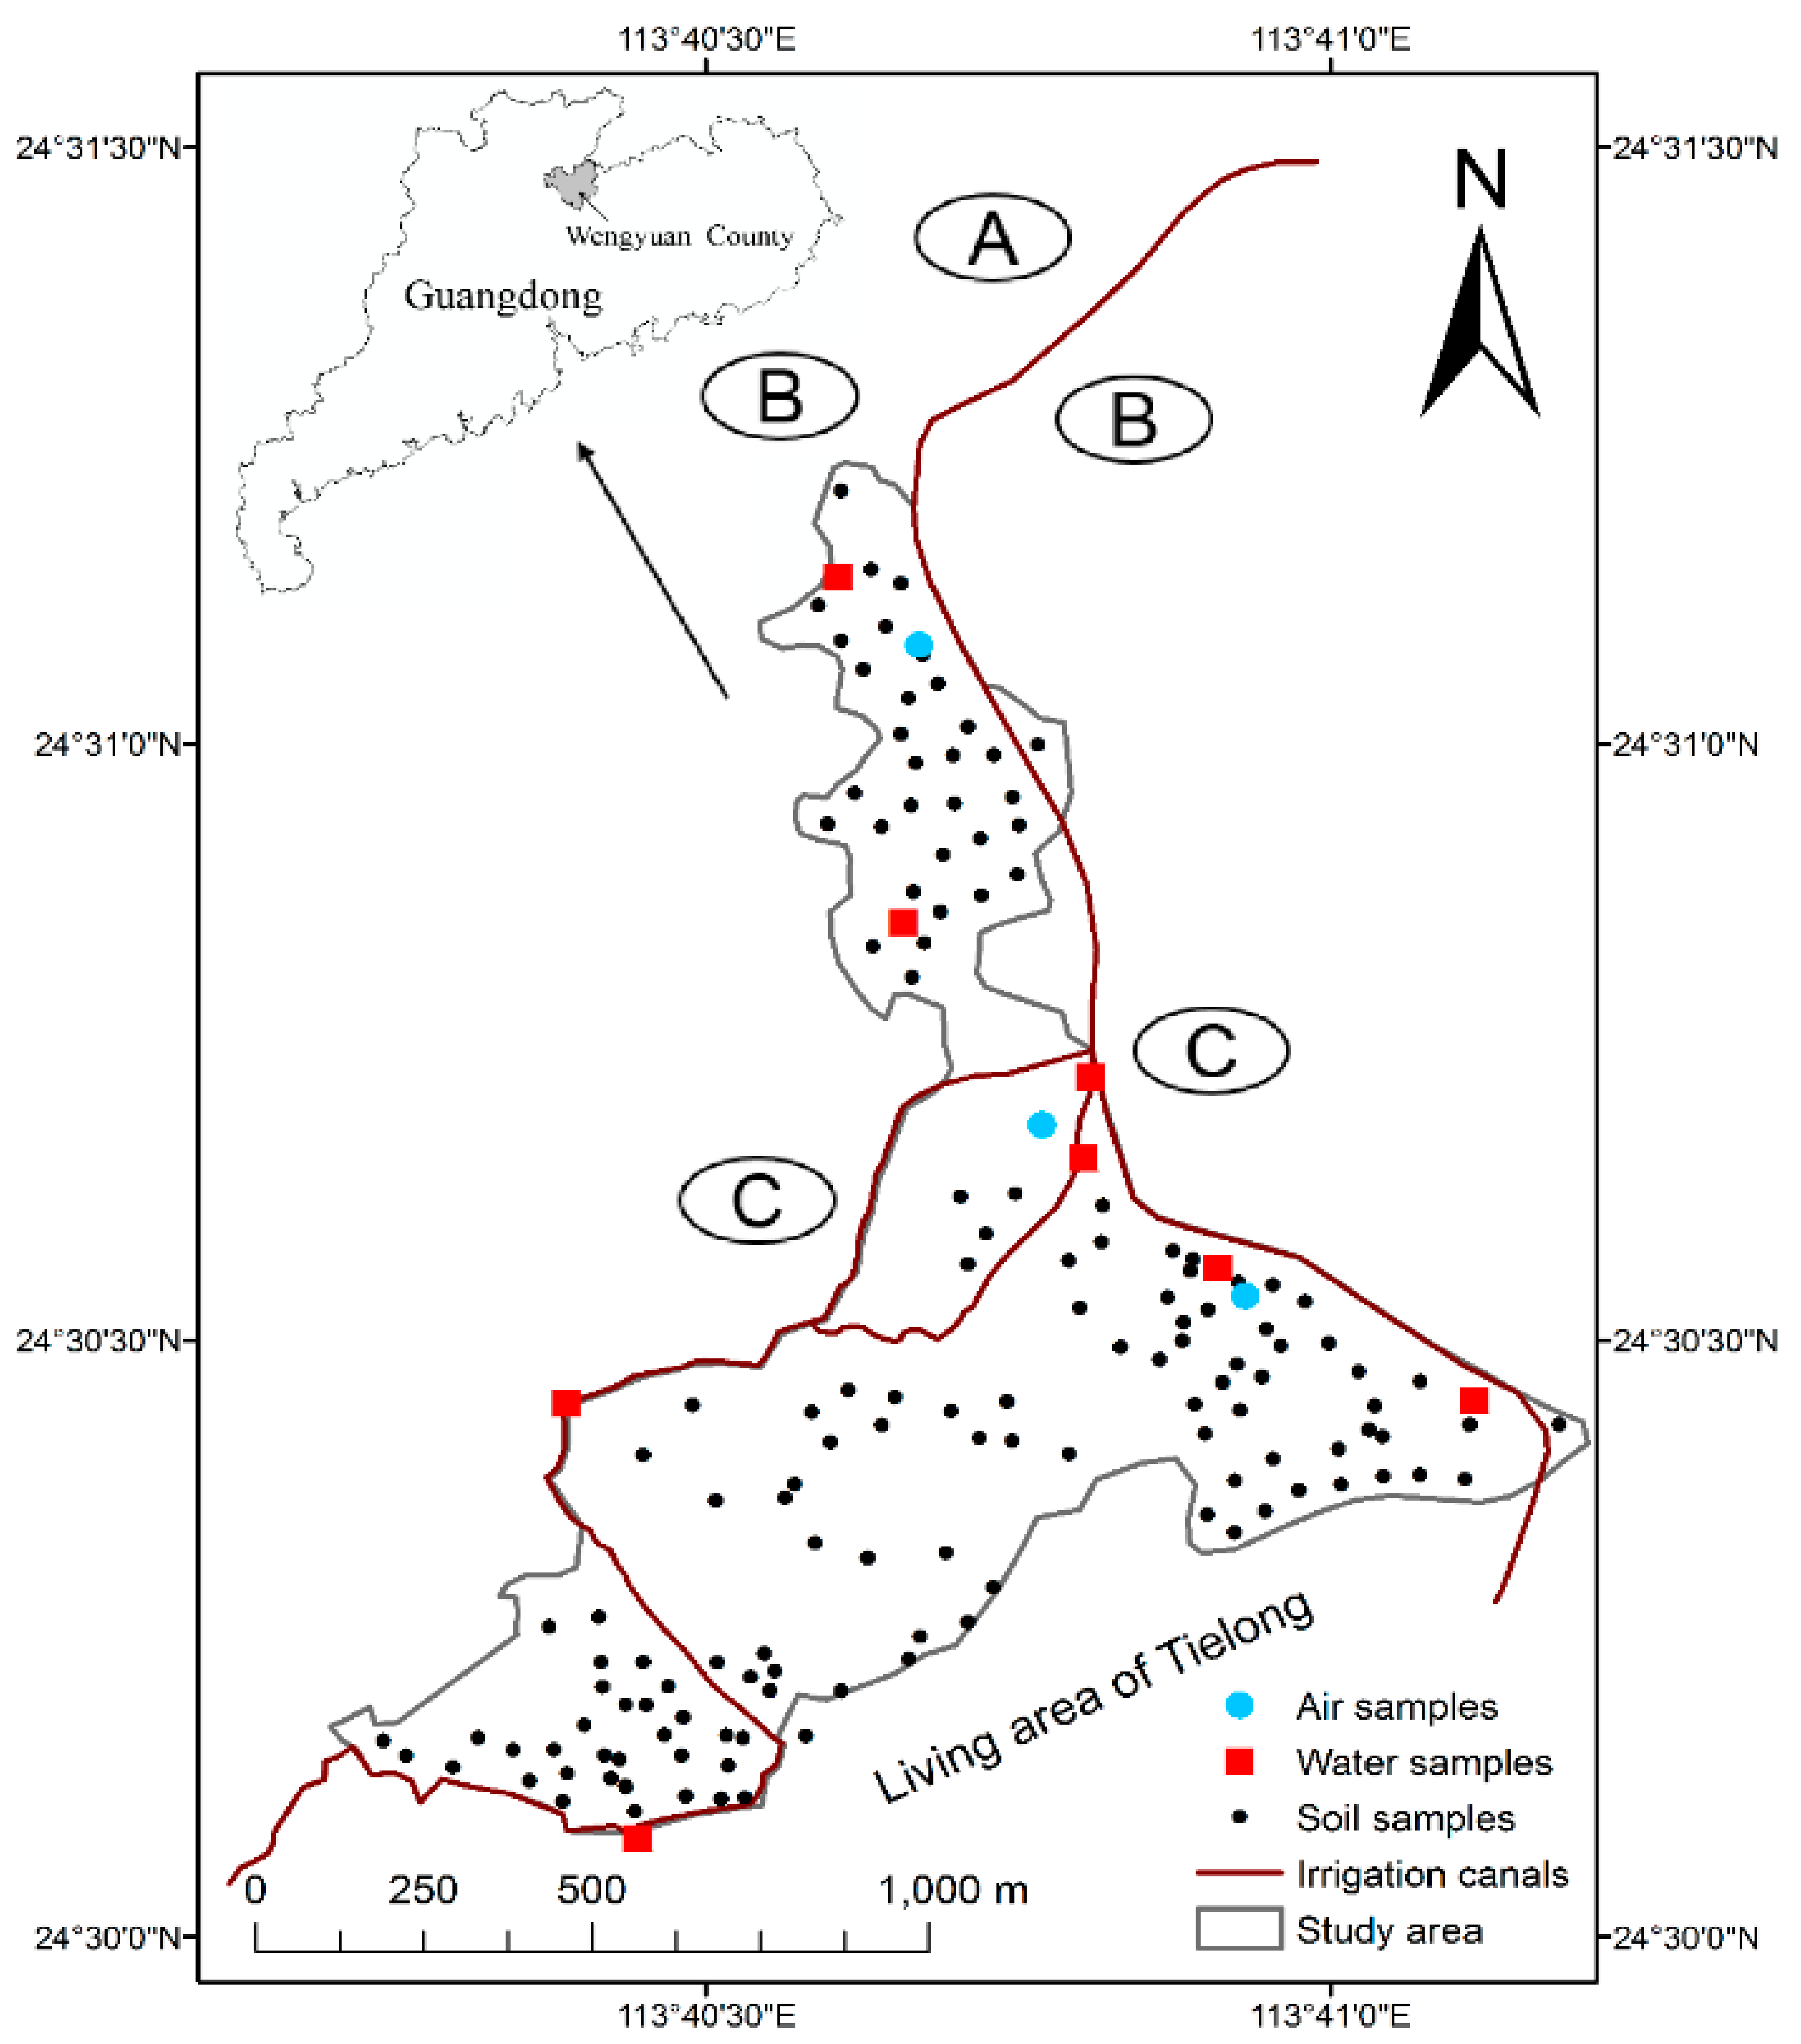
2.1. Study Area
2.2. Samples Collection and Analysis
2.3. Daily Intake (DI) of Trace Metals
2.4. Risk Assessment
2.5. Statistical Analysis
3. Results and Discussion
3.1. Trace Metals in Various Media and Local Crops
3.2. Trace Metal Concentrations in Human Hair
3.3. Health Risk Assessment
3.3.1. Daily Exposure Levels
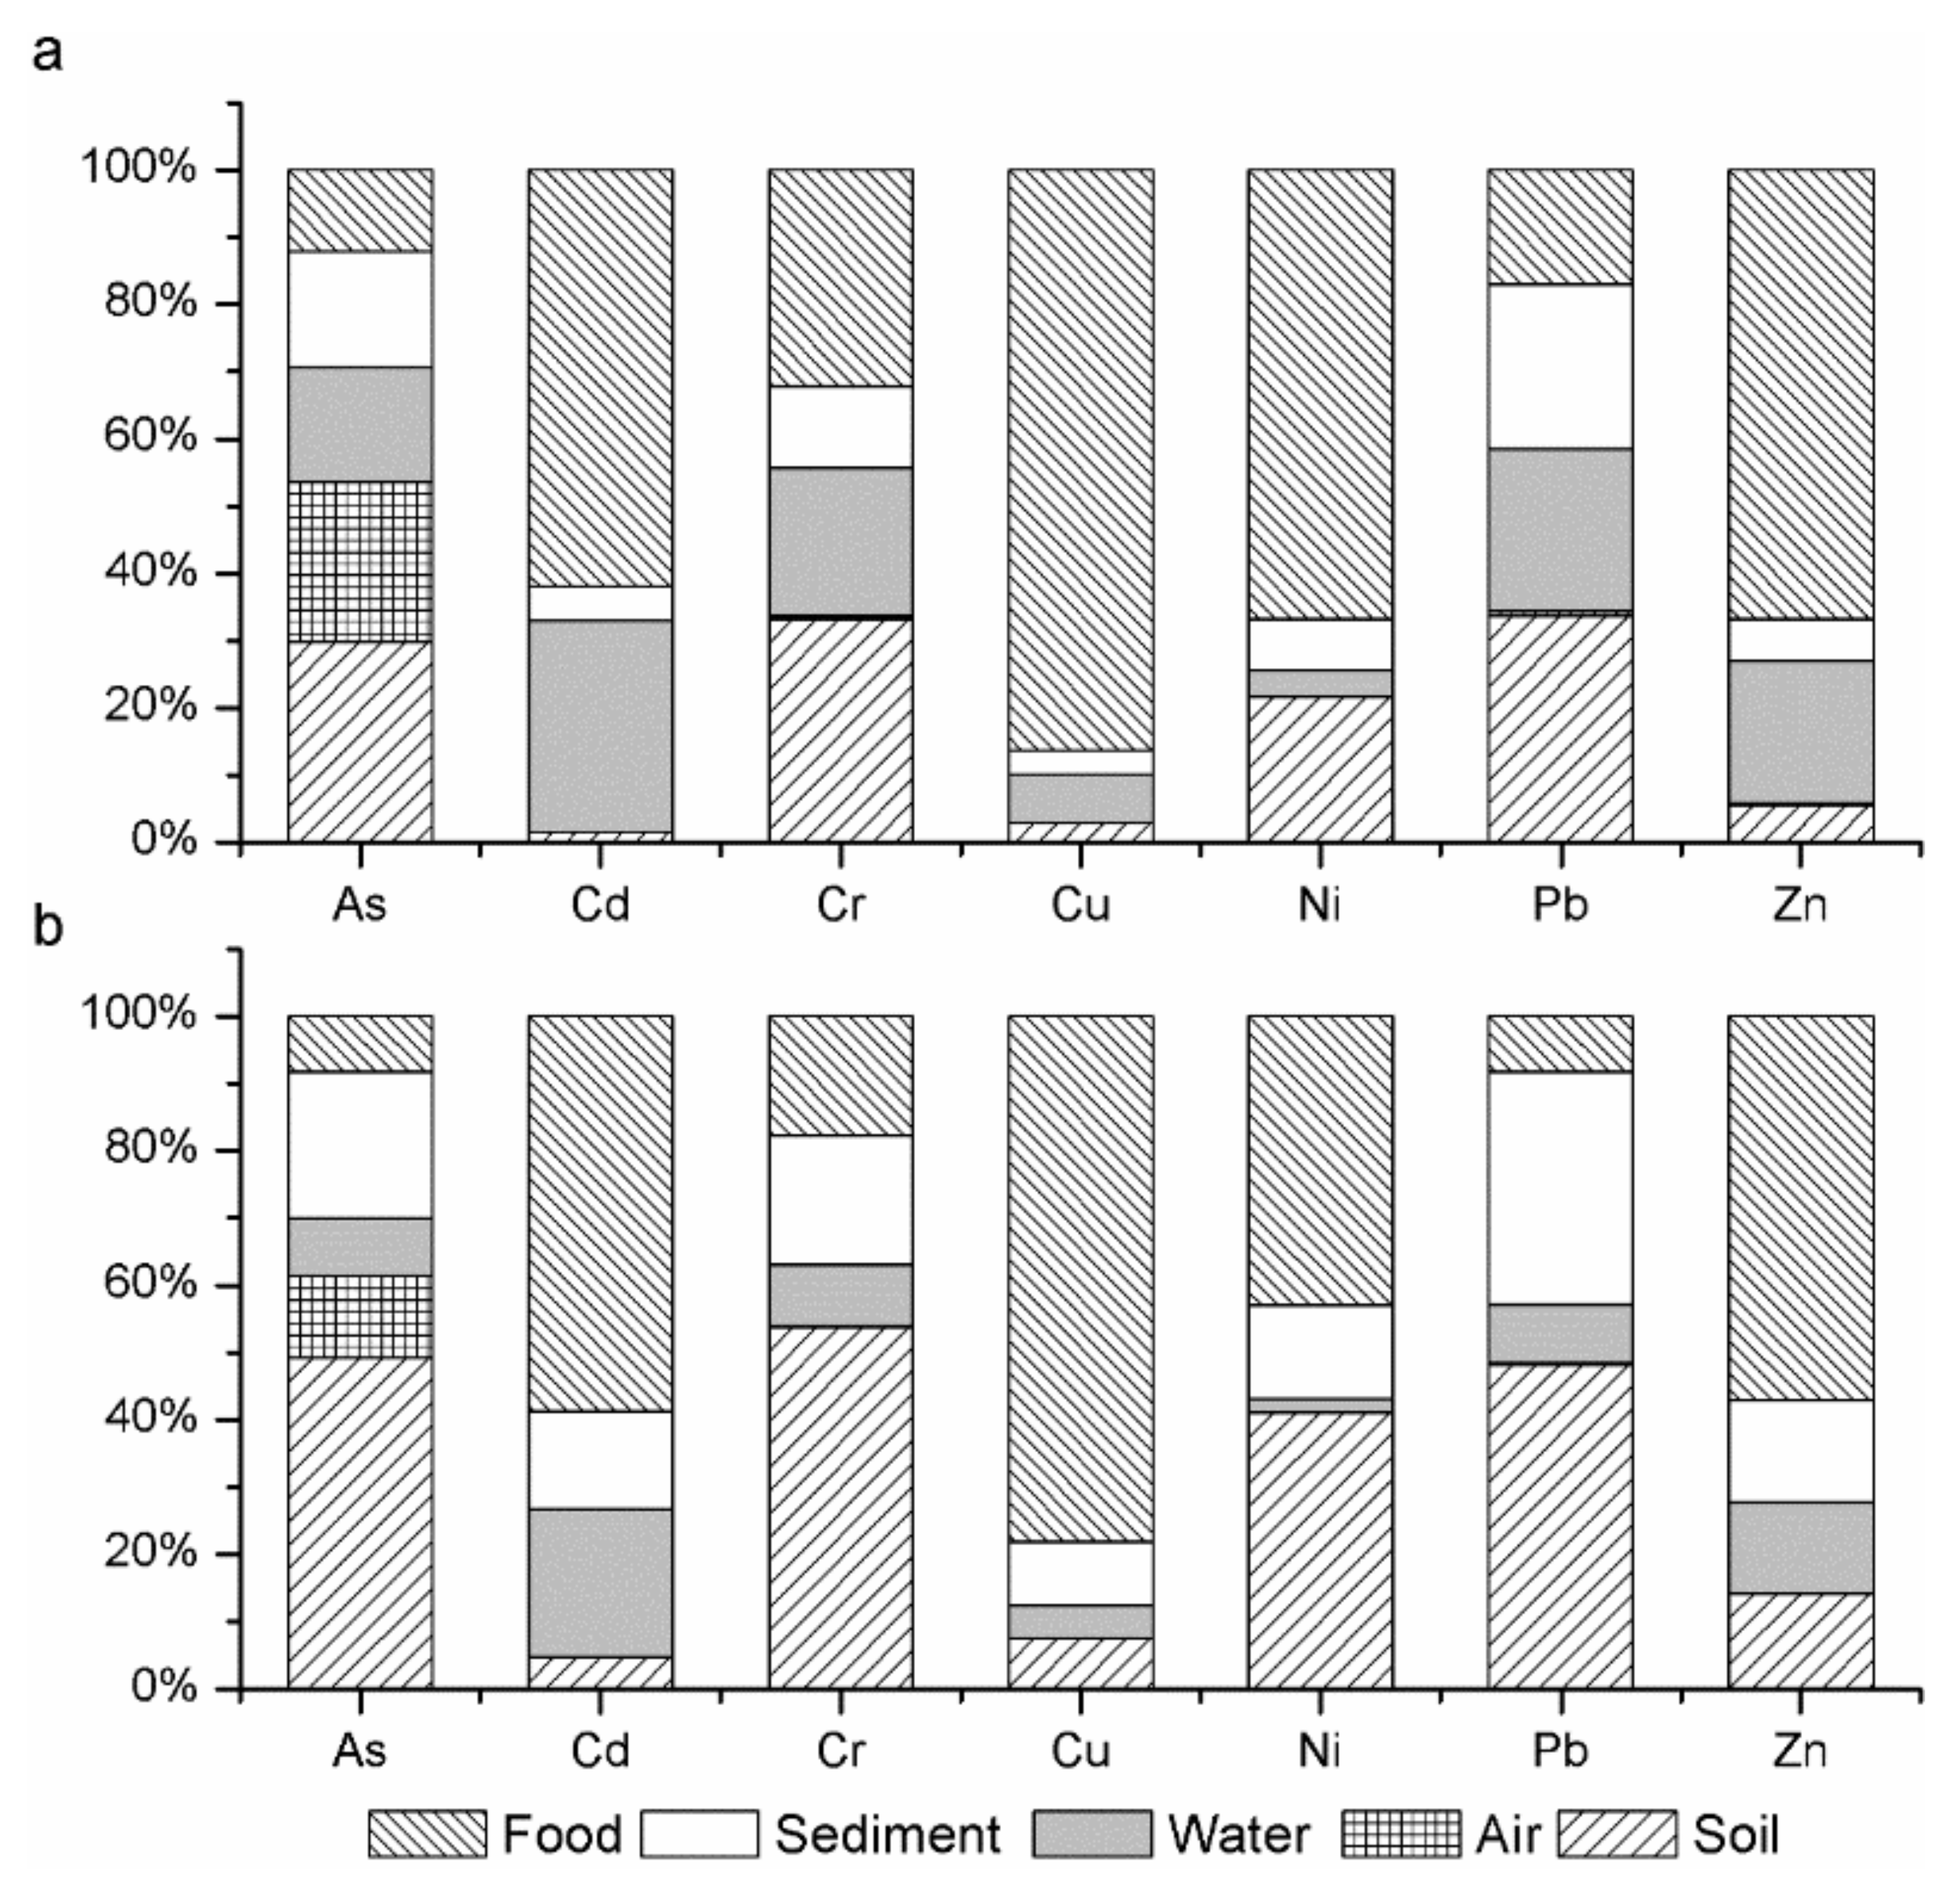
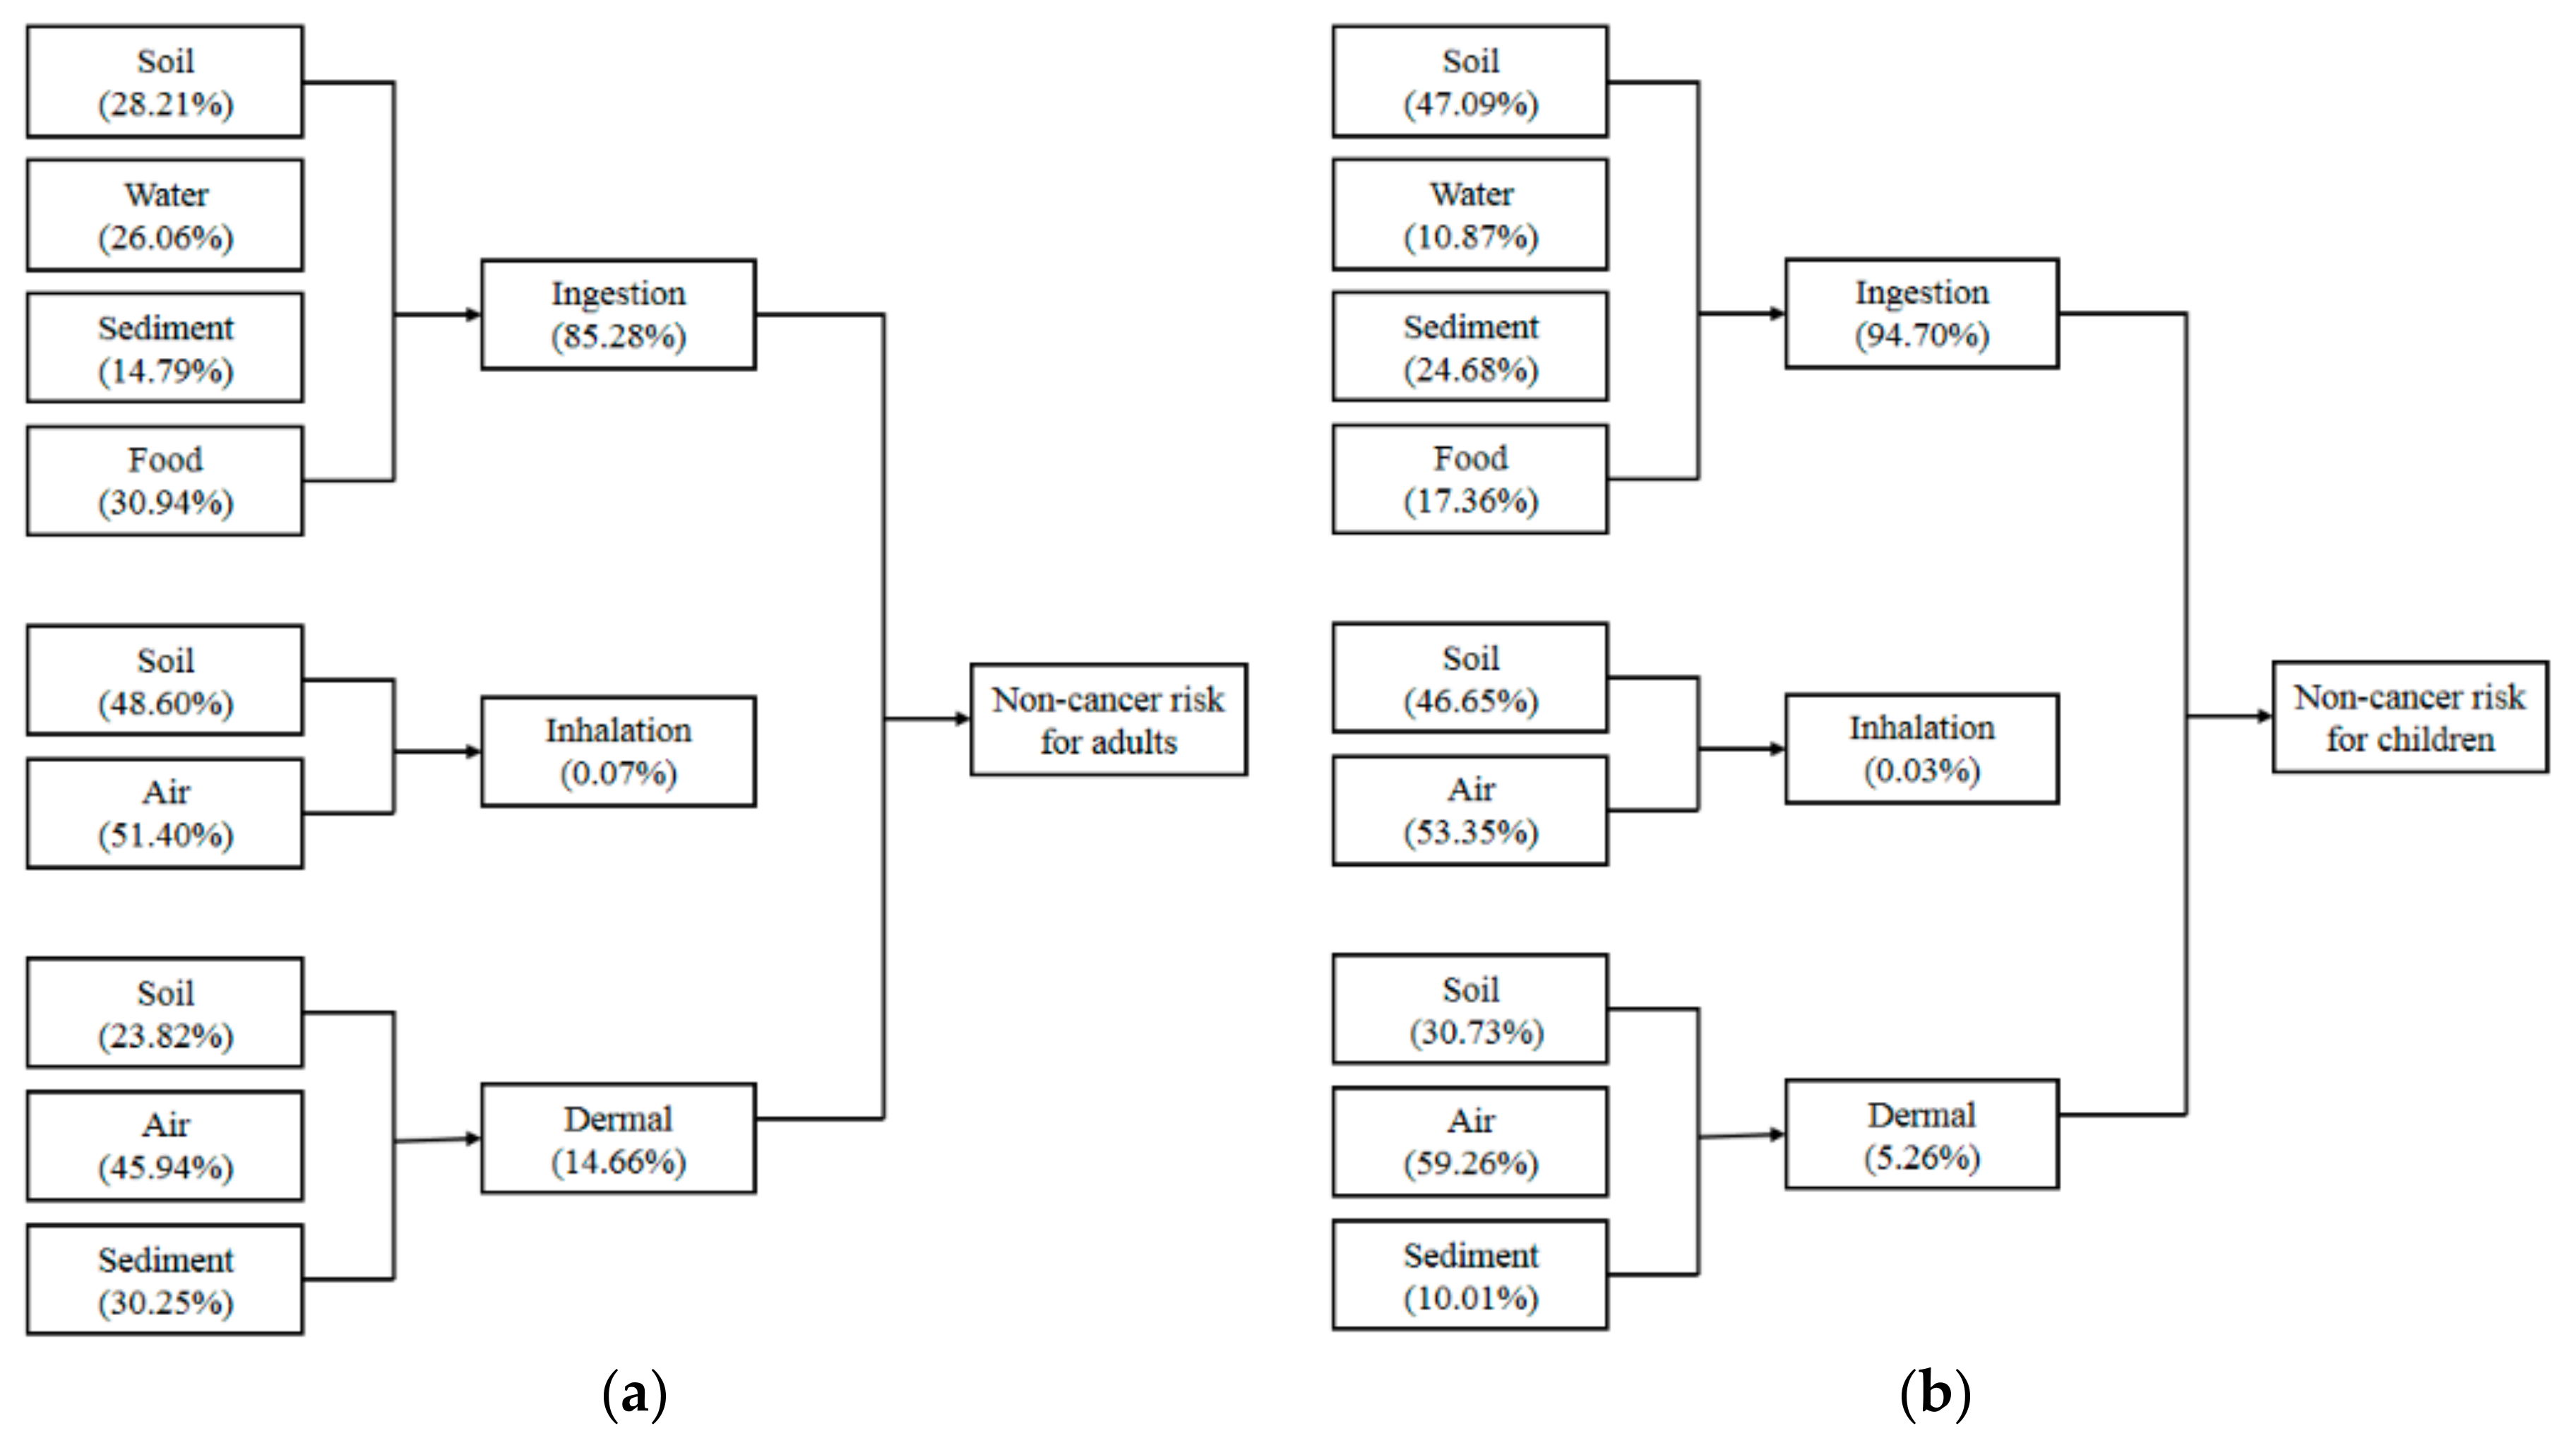
3.3.2. Non-Carcinogenic Risks of Different Media
3.3.3. Carcinogenic Risks of Different Media
4. Conclusions
- (1)
- After long term mining and industrial activities, the area had been seriously polluted by trace metals, especially, As, Cd, and Pb, mainly through air deposition (for Pb) or irrigation (for As and Cd).
- (2)
- Human hair is a suitable indicator for study the long-term metal exposure. Hair analysis results indicated that local resident, especially children, had been seriously affected by the trace metal contamination in the study area, and As and Pb concentrations in residents’ hair were relatively high.
- (3)
- It also lead to high potential health risk. As and Pb presented highest potential non-carcinogenic health risks to children, with a HI value greater than 1, and the cancer risk of Cd exposure were higher than the maximum safe value 10−4.
- (4)
- Risk control should be taken to reduce the ingestion exposure level of children, which was the dominated contribution to the non-cancer effect. Soil remediation should be conducted to reduce food and soil ingestion exposure.
Supplementary Materials
Supplementary File 1Acknowledgments
Author Contributions
Conflicts of Interest
References
- Chen, R.; de Sherbinin, A.; Ye, C.; Shi, G. China’s soil pollution: Farms on the frontline. Science 2014, 344, 691. [Google Scholar] [CrossRef] [PubMed]
- Pourret, O.; Lange, B.; Bonhoure, J.; Colinet, G.; Decrée, S.; Mahy, G.; Séleck, M.; Shutcha, M.; Faucon, M.-P. Assessment of soil metal distribution and environmental impact of mining in Katanga (Democratic Republic of Congo). Appl. Geochem. 2016, 64, 43–55. [Google Scholar] [CrossRef]
- Tume, P.; González, E.; King, R.W.; Cuitiño, L.; Roca, N.; Bech, J. Distinguishing between natural and anthropogenic sources for potentially toxic elements in urban soils of Talcahuano, Chile. J. Soils Sediments 2017. [Google Scholar] [CrossRef]
- Kikuchi, T.; Furuichi, T.; Hai, H.T.; Tanaka, S. Assessment of heavy metal pollution in river water of Hanoi, Vietnam using multivariate analyses. Bull. Environ. Contam. Toxicol. 2009, 83, 575–582. [Google Scholar] [CrossRef] [PubMed]
- Banza, C.L.N.; Nawrot, T.S.; Haufroid, V.; Decrée, S.; De Putter, T.; Smolders, E.; Kabyla, B.I.; Luboya, O.N.; Ilunga, A.N.; Mutombo, A.M.; et al. High human exposure to cobalt and other metals in Katanga, a mining area of the Democratic Republic of Congo. Environ. Res. 2009, 109, 745–752. [Google Scholar] [CrossRef] [PubMed]
- Guo, L.; Zhao, W.; Gu, X.; Zhao, X.; Chen, J.; Cheng, S. Risk assessment and source identification of 17 metals and metalloids on soils from the half-century old tungsten mining areas in Lianhuashan, Southern China. Int. J. Environ. Res. Public Health 2017, 14, 1475. [Google Scholar] [CrossRef] [PubMed]
- Zhou, J.; Feng, K.; Pei, Z.; Meng, F.; Sun, J. Multivariate analysis combined with GIS to source identification of heavy metals in soils around an abandoned industrial area, Eastern China. Ecotoxicology 2016, 25, 380–388. [Google Scholar] [CrossRef] [PubMed]
- Wiseman, C.L.S.; Zereini, F.; Püttmann, W. Metal and metalloid accumulation in cultivated urban soils: A medium-term study of trends in Toronto, Canada. Sci. Total Environ. 2015, 538, 564–572. [Google Scholar] [CrossRef] [PubMed]
- Gray, J.E.; Crock, J.G.; Lasorsa, B.K. Mercury methylation at mercury mines in the Humboldt River Basin, Nevada, USA. Geochem. Explor. Environ. Anal. 2002, 2, 143–149. [Google Scholar] [CrossRef]
- Kuo, C.C.; Weaver, V.; Fadrowski, J.J.; Lin, Y.S.; Guallar, E.; Navas-Acien, A. Arsenic exposure, hyperuricemia, and gout in U.S. adults. Environ. Int. 2015, 76, 32–40. [Google Scholar] [CrossRef] [PubMed]
- Li, G.H.; Feng, X.; Qiu, G.; Bi, X.; Li, Z.; Zhang, C.; Wang, D.; Shang, L.; Guo, Y. Environmental mercury contamination of an artisanal zinc smelting area in Weining County, Guizhou, China. Environ. Pollut. 2008, 154, 21–31. [Google Scholar] [CrossRef] [PubMed]
- Cullen, W.R.; Reimer, K.J. Arsenic speciation in the environment. Chem. Rev. 1989, 89, 713–764. [Google Scholar] [CrossRef]
- Lu, Y.; Yin, W.; Huang, L.; Zhang, G. Assessment of bioaccessibility and exposure risk of arsenic and lead in urban soils of Guangzhou City, China. Environ. Geochem. Health 2011, 33, 93–102. [Google Scholar] [CrossRef] [PubMed]
- Komárek, M.; Ettler, V.; Chrastný, V.; Mihaljevic, M. Lead isotopes in environmental sciences: A review. Environ. Int. 2008, 34, 562–577. [Google Scholar] [CrossRef] [PubMed]
- Park, R.M.; Bena, J.F.; Stayner, L.; Smith, R.J.; Gibb, H.J.; Lees, P.S.J. Hexavalent chromium and lung cancer in the chromate industry: A quantitative risk assessment. Risk Anal. 2004, 24, 1099–1108. [Google Scholar] [CrossRef] [PubMed]
- Man, Y.B.; Sun, X.L.; Zhao, Y.G.; Lopez, B.N.; Chung, S.S.; Wu, S.C.; Cheung, K.C.; Wong, M.H. Health risk assessment of abandoned agricultural soils based on heavy metal contents in Hong Kong, the world’s most populated city. Environ. Int. 2010, 36, 570–576. [Google Scholar] [CrossRef] [PubMed]
- Liu, X.; Song, Q.; Tang, Y.; Li, W.; Xu, J.; Wu, J.; Wang, F.; Brookes, P. Human health risk assessment of heavy metals in soil-vegetable system: A multi-medium analysis. Sci. Total Environ. 2013, 463–464, 530–540. [Google Scholar] [CrossRef] [PubMed]
- Li, Z.Y.; Ma, Z.W.; Kuijp, T.J.V.D.; Yuan, Z.W.; Huang, L. A review of soil heavy metal pollution from mines in China: Pollution and health risk assessment. Sci. Total Environ. 2014, 468–469, 843–853. [Google Scholar] [CrossRef] [PubMed]
- Massaquoi, L.D.; Ma, H.; Liu, X.H.; Han, P.Y.; Zuo, S.M.; Hua, Z.X.; Liu, D.W. Heavy metal accumulation in soils, plants, and hair samples: An assessment of heavy metal exposure risks from the consumption of vegetables grown on soils previously irrigated with wastewater. Environ. Sci. Pollut. Res. Int. 2015, 22, 18456–18468. [Google Scholar] [CrossRef] [PubMed]
- Vimercati, L.; Baldassarre, A.; Gatti, M.F.; Gagliardi, T.; Serinelli, M.; De, M.L.; Caputi, A.; Dirodi, A.A.; Galise, I.; Cuccaro, F. Non-occupational exposure to heavy metals of the residents of an industrial area and biomonitoring. Environ. Monit. Assess. 2016, 188, 673. [Google Scholar] [CrossRef] [PubMed]
- Lai, H.Y.; Hseu, Z.Y.; Chen, T.C.; Chen, B.C.; Guo, H.Y.; Chen, Z.S. Health risk-based assessment and management of heavy metals-contaminated soil sites in Taiwan. Int. J. Environ. Res. Public Health 2010, 7, 3595–3614. [Google Scholar] [CrossRef] [PubMed]
- Huang, M.; Chen, X.; Shao, D.; Zhao, Y.; Wang, W.; Wong, M. Risk assessment of arsenic and other metals via atmospheric particles, and effects of atmospheric exposure and other demographic factors on their accumulations in human scalp hair in urban area of Guangzhou, China. Ecotoxicol. Environ. Saf. 2014, 102, 84–92. [Google Scholar] [CrossRef] [PubMed]
- Luo, R.X.; Zhuo, X.Y.; Ma, D. Determination of 33 elements in scalp hair samples from inhabitants of a mountain village of Tonglu city, China. Ecotoxicol. Environ. Saf. 2014, 104, 215–219. [Google Scholar] [CrossRef] [PubMed]
- Chojnacka, K.; Zielińska, A.; Górecka, H.; Dobrzański, Z.; Górecki, H. Reference values for hair minerals of Polish students. Environ. Toxicol. Pharmacol. 2010, 29, 314–319. [Google Scholar] [CrossRef] [PubMed]
- Dongarrà, G.; Lombardo, M.; Tamburo, E.; Varrica, D.; Cibella, F.; Cuttitta, G. Concentration and reference interval of trace elements in human hair from students living in Palermo, Sicily (Italy). Environ. Toxicol. Pharmacol. 2011, 32, 27–34. [Google Scholar] [CrossRef] [PubMed]
- Skalny, A.V.; Skalnaya, M.G.; Tinkov, A.A.; Serebryansky, E.P.; Demidov, V.A.; Lobanova, Y.N.; Grabeklis, A.R.; Berezkina, E.S.; Gryazeva, I.V.; Skalny, A.A. Reference values of hair toxic trace elements content in occupationally non-exposed Russian population. Environ. Toxicol. Pharmacol. 2015, 40, 18–21. [Google Scholar] [CrossRef] [PubMed]
- Bian, B.; Zhou, L.J.; Li, L.; Lv, L.; Fan, Y.M. Risk assessment of heavy metals in air, water, vegetables, grains, and related soils irrigated with biogas slurry in Taihu Basin, China. Environ. Sci. Pollut. Res. 2015, 22, 7794–7807. [Google Scholar] [CrossRef] [PubMed]
- Baastrup, R.; Sørensen, M.; Balstrøm, T.; Frederiksen, K.; Larsen, C.L.; Tjønneland, A.; Overvad, K.; Raaschou-Nielsen, O. Arsenic in drinking-water and risk for cancer in Denmark. Environ. Health Perspect. 2008, 116, 231–237. [Google Scholar] [CrossRef] [PubMed]
- Mari, M.; Nadal, M.; Schuhmacher, M.; Domingo, J. Exposure to heavy metals and PCDD/Fs by the population living in the vicinity of a hazardous waste landfill in Catalonia, Spain: Health risk assessment. Environ. Int. 2009, 35, 1034–1039. [Google Scholar] [CrossRef] [PubMed]
- Wang, Y.C.; Qiao, M.; Liu, Y.X.; Zhu, Y.G. Health risk assessment of heavy metals in soils and vegetables from wastewater irrigated area, Beijing-Tianjin city cluster, China. J. Environ. Sci. 2012, 24, 690–698. [Google Scholar] [CrossRef]
- Wang, X.L.; Sato, T.; Xing, B.S.; Tao, S. Health risks of heavy metals to the general public in Tianjin, China via consumption of vegetables and fish. Sci. Total Environ. 2005, 350, 28–37. [Google Scholar] [CrossRef] [PubMed]
- World Health Organization (WHO). Joint FAO/WHO Food Standards Rogramme Codex Committee on Contaminants in Foods; Codex Alimentarius Commission: Rio de Janeiro, Brazil, 1993. [Google Scholar]
- Chen, T.B.; Song, B.; Zheng, Y.M.; Huang, Z.C.; Lei, M.; Liao, X.Y. A survey of lead concentrations in vegetables and soils in Beijing and their health risks. Sci. Agric. Sin. 2006, 1589–1597. (In Chinese) [Google Scholar]
- Peng, C.; Cai, Y.M.; Wang, T.Y.; Xiao, R.B.; Chen, W.P. Regional probabilistic risk assessment of heavy metals in different environmental media and land uses: An urbanization-affected drinking water supply area. Sci. Rep. 2016, 6, 37084. [Google Scholar] [CrossRef] [PubMed]
- U.S. Environmental Protection Agency (U.S. EPA). Risk Assessment Guidance for Superfund. Volume I: Human Health Evaluation Manual—Part E, Supplemental Guidance for Demal Risk Assessment; Office of Superfund Remediation and Technology Innovation: Washington, DC, USA, 2004.
- US. Environmental Protection Agency (U.S. EPA). Exposure Factors Handbook: 2011 Edition; Final Report; U.S. Environmental Protection Agency: Washington, DC, USA, 2011.
- Duan, J.C.; Tan, J. Atmospheric heavy metals and arsenic in China: Situation, sources and control policies. Atmos. Environ. 2013, 74, 93–101. [Google Scholar] [CrossRef]
- Tan, J.H.; Duan, J.C.; Ma, Y.L.; Yang, F.M.; Cheng, Y.; He, K.B.; Yu, Y.C.; Wang, J. Source of atmospheric heavy metals in winter in Foshan, China. Sci. Total Environ. 2014, 493, 262–270. [Google Scholar] [CrossRef] [PubMed]
- Rivai, I. Heavy metals in human hair related to age groups and automotive pollution levels of Bandarlampung city, Indonesia. Bull. Environ. Contam. Toxicol. 2001, 66, 443–448. [Google Scholar] [CrossRef] [PubMed]
- Takagi, Y.; Matsuda, S.; Imai, S.; Ohmori, Y.; Masuda, T.; Vinson, J.A.; Mehra, M.; Puri, B.; Kaniewski, A. Trace elements in human hair: An international comparison. Bull. Environ. Contam. Toxicol. 1986, 36, 793–800. [Google Scholar] [CrossRef] [PubMed]
- Qin, J.F.; Li, J.X.; Lou, M.T. Establishing principle and method of normal reference value of elements in human hair and blood. Guangdong Weiliang Yuansu Kexue 2005, 12, 2–11. (In Chinese) [Google Scholar]
- Wang, T.; Fu, J.J.; Wang, Y.W.; Liao, C.Y.; Tao, Y.Q.; Jiang, G.B. Use of scalp hair as indicator of human exposure to heavy metals in an electronic waste recycling area. Environ. Pollut. 2009, 157, 2445–2451. [Google Scholar] [CrossRef] [PubMed]
- Ni, S.Q.; Li, R.P.; Wang, A.J. Heavy metal content in scalp hair of the inhabitants near Dexing Copper Mine, Jiangxi Province, China. Sci. China Earth Sci. 2011, 54, 780–788. [Google Scholar] [CrossRef]
- Moya, J.; Bearer, C.F.; Etzel, R.A. Children’s behavior and physiology and how it affects exposure to environmental contaminants. Pediatrics 2004, 113, 996–1006. [Google Scholar] [PubMed]
- Tao, X.Q.; Shen, D.S.; Shentu, J.L.; Long, Y.Y.; Feng, Y.J.; Shen, C.C. Bioaccessibility and health risk of heavy metals in ash from the incineration of different e-waste residues. Environ. Sci. Pollut. Res. 2015, 22, 3558–3569. [Google Scholar] [CrossRef] [PubMed]
- Leung, A.O.; Duzgorenaydin, N.S.; Cheung, K.C.; Wong, M.H. Heavy metals concentrations of surface dust from e-waste recycling and its human health implications in southeast China. Environ. Sci. Technol. 2008, 42, 2674–2680. [Google Scholar] [CrossRef] [PubMed]


| Media | As | Cd | Cr | Cu | Ni | Pb | Zn |
|---|---|---|---|---|---|---|---|
| Mean ± Std. Deviation (Minimum, Maximum) | |||||||
| Soils (mg·kg−1) | 54.65 ± 29.12 | 2.38 ± 2.22 | 87.54 ± 10.20 | 40.98 ± 12.67 | 39.20 ± 6.02 | 172.76 ± 106.76 | 332.53 ± 114.01 |
| (11.43, 175.73) | (0.68, 16.06) | (57.41, 114.75) | (20.05, 89.36) | (21.33, 62.03) | (89.84, 1258.29) | (118.11, 999.83) | |
| Crops (mg·kg−1) | 0.11 ± 0.11 | 0.30 ± 0.28 | 0.29 ± 0.29 | 4.35 ± 2.26 | 0.30 ± 0.45 | 0.42 ± 0.71 | 13.65 ± 6.90 |
| (0.01, 0.34) | (0.06, 1.27) | (0.01, 0.94) | (0.91,10.32) | (0.00, 2.79) | (0.01,3.82) | (1.37, 29.41) | |
| Surface sediments (mg·kg−1) | 50.17 ± 25.96 | 14.83 ± 9.81 | 62.93 ± 8.82 | 102.23 ± 49.32 | 26.8 ± 6.92 | 247.77 ± 115.18 | 712.62 ± 244.19 |
| (23.64, 87.18) | (2.17, 30.65) | (55.37, 75.85) | (39.22, 171.62) | (18.12, 35.78) | (101.32, 395.58) | (345.18, 986.58) | |
| Surface water (μg·L−1) | 2.09 ± 1.22 | 2.25 ± 4.31 | 2.94 ± 1.20 | 5.37 ± 4.37 | 0.36 ± 0.21 | 6.25 ± 14.60 | 63.75 ± 87.27 |
| (0.79, 5.34) | (0.16, 15.62) | (0.45, 5.25) | (1.75, 19.26) | (0.17, 0.91) | (0.52, 68.76) | (9.79, 329.40) | |
| Air (μg·(m2·d)−1) | 10.52 ± 4.74 | 0.40 ± 0.28 | 7.38 ± 6.31 | 11.27 ± 13.48 | 1.45 ± 1.11 | 30.85 ± 27.59 | 111.70 ± 118.11 |
| (5.02, 16.87) | (0.05, 0.72) | (1.58, 18.39) | (1.20, 38.12) | (0.25, 3.37) | (5.75, 82.92) | (14.18, 331.79) | |
| Daily Intake of Metals | As | Cd | Cr | Cu | Ni | Pb | Zn |
|---|---|---|---|---|---|---|---|
| Adults | 3.23 | 8.80 | 8.50 | 127.56 | 8.80 | 12.32 | 400.29 |
| Children | 2.17 | 5.92 | 5.72 | 85.78 | 5.92 | 8.28 | 269.18 |
| PTDI | 580 | 70 | 500 | 6500 | 1200 | 200 | 33000 |
| Age Group | Statistical Analysis | As | Cd | Cr | Cu | Ni | Pb | Zn |
|---|---|---|---|---|---|---|---|---|
| Children | Mean | 1.13 | 0.19 | 0.17 | 11.43 | 1.21 | 10.88 | 120.70 |
| SD | 0.64 | 0.07 | 0.06 | 2.35 | 0.36 | 3.28 | 29.62 | |
| Adults | Mean | 0.71 | 0.13 | 0.21 | 11.37 | 1.21 | 5.118 | 162.997 |
| SD | 0.36 | 0.06 | 0.13 | 2.65 | 0.526 | 3.020 | 51.803 | |
| Total | Mean | 0.77 | 0.14 | 0.20 | 11.38 | 1.21 | 5.86 | 169.46 |
| SD | 0.43 | 0.06 | 0.13 | 2.60 | 0.51 | 3.56 | 57.42 |
| Country/Region | As | Cd | Cr | Cu | Ni | Pb | Zn | |
|---|---|---|---|---|---|---|---|---|
| Canada [40] | 0.016 | 0.503 | 0.35 | 63.1 | 0.26 | 5.38 | 248 | |
| USA [40] | 0.019 | 0.97 | 0.234 | 108 | 1.01 | 5.35 | 124 | |
| Japan [40] | 0.053 | 0.28 | 0.23 | 10.7 | 2.7 | 3.62 | 114 | |
| Guangdong in China (Adults) [41] | 0.77 | 0.052 | 0.34 | NR | 0.44 | 5.56 | NR | |
| Ningbo in China [42] | 0.282 | 0.209 | 1.16 | 10.7 | 0.812 | 2.98 | NR | |
| Normal reference value by TERCC [43] | Adults | 1.0 | 0.6 | 0.30–1.20 | 8.0–20.0 | NR | 10 | 120–210 |
| Children | 1.0 | 0.5 | 0.18–0.72 | 8.0–16.0 | NR | 10 | 90–170 | |
| Age Group | Ingest-Soil | Inhale-Soil | Dermal-Soil | Inhale-Air | Dermal-Air | Ingest-Water | Ingest-Sediment | Dermal-Sediment | Ingest-Crop |
|---|---|---|---|---|---|---|---|---|---|
| Adults | 0.855 ** | 0.884 ** | −0.015 | 0.959 ** | −0.011 | 0.998 ** | 0.958 ** | 0.251 | 0.970 ** |
| Children | 0.903 ** | 0.905 ** | −0.024 | 0.969 ** | −0.021 | 0.999 ** | 0.972 ** | 0.245 | 0.970 ** |
| Type | Pathway | As | Cd | Cr | Cu | Ni | Pb | Zn | Total |
|---|---|---|---|---|---|---|---|---|---|
| Soil | Ingestion | 2.82 × 10⁻¹ | 3.68 × 10⁻³ | 4.51 × 10⁻² | 1.58 × 10⁻³ | 3.03 × 10⁻³ | 7.63 × 10⁻² | 1.71 × 10⁻³ | 4.13 × 10⁻¹ |
| Inhalation | 3.05 × 10⁻⁵ | 3.97 × 10⁻⁷ | 5.05 × 10⁻⁴ | 1.71 × 10⁻⁷ | 3.28 × 10⁻⁷ | 8.25 × 10⁻⁶ | 1.85 × 10⁻⁷ | 5.44 × 10⁻⁴ | |
| Dermal contact | 2.37 × 10⁻² | 4.12 × 10⁻³ | 2.53 × 10⁻² | 5.92 × 10⁻⁵ | 1.26 × 10⁻⁴ | 5.76 × 10⁻³ | 9.60 × 10⁻⁴ | 6.00 × 10⁻² | |
| Air | Inhalation | 1.01 × 10⁻⁴ | 6.37 × 10⁻⁷ | 4.58 × 10⁻⁴ | 4.96 × 10⁻⁷ | 1.29 × 10⁻⁷ | 1.54 × 10⁻⁵ | 5.72 × 10⁻⁷ | 5.76 × 10⁻⁴ |
| Dermal contact | 7.45 × 10⁻² | 6.26 × 10⁻³ | 2.17 × 10⁻² | 1.62 × 10⁻⁴ | 4.68 × 10⁻⁵ | 1.02 × 10⁻² | 2.81 × 10⁻³ | 1.16 × 10⁻¹ | |
| Water | Ingestion | 2.15 × 10⁻¹ | 6.96 × 10⁻² | 3.03 × 10⁻² | 4.15 × 10⁻³ | 5.56 × 10⁻⁴ | 5.52 × 10⁻² | 6.57 × 10⁻³ | 3.82 × 10⁻¹ |
| Sediment | Ingestion | 1.29 × 10⁻¹ | 1.15 × 10⁻² | 1.62 × 10⁻² | 1.98 × 10⁻³ | 1.04 × 10⁻³ | 5.47 × 10⁻² | 1.84 × 10⁻³ | 2.17 × 10⁻¹ |
| Dermal contact | 2.17 × 10⁻² | 2.57 × 10⁻² | 1.82 × 10⁻² | 1.48 × 10⁻⁴ | 8.60 × 10⁻⁵ | 8.25 × 10⁻³ | 2.06 × 10⁻³ | 7.61 × 10⁻² | |
| Food | Ingestion | 1.53 × 10⁻¹ | 1.38 × 10⁻¹ | 4.42 × 10⁻² | 4.93 × 10⁻² | 9.46 × 10⁻³ | 3.91 × 10⁻² | 2.06 × 10⁻² | 4.53 × 10⁻¹ |
| HI | 8.99 × 10⁻¹ | 2.59 × 10⁻¹ | 2.02 × 10⁻¹ | 5.74 × 10⁻² | 1.43 × 10⁻² | 2.50 × 10⁻¹ | 3.66 × 10⁻² | 1.72 | |
| Type | Pathway | As | Cd | Cr | Cu | Ni | Pb | Zn | Total |
|---|---|---|---|---|---|---|---|---|---|
| Soil | Ingestion | 2.20 | 2.87 × 10⁻² | 3.52 × 10⁻¹ | 1.24 × 10⁻² | 2.36 × 10⁻² | 5.95 × 10⁻¹ | 1.34 × 10⁻² | 3.22 |
| Inhalation | 6.16 × 10⁻⁵ | 8.04 × 10⁻⁷ | 1.02 × 10⁻³ | 3.47 × 10⁻⁷ | 6.63 × 10⁻⁷ | 1.67 × 10⁻⁵ | 3.75 × 10⁻⁷ | 1.10 × 10⁻³ | |
| Dermal contact | 4.61 × 10⁻² | 8.03 × 10⁻³ | 4.93 × 10⁻² | 1.15 × 10⁻⁴ | 2.45 × 10⁻⁴ | 1.12 × 10⁻² | 1.87 × 10⁻³ | 1.17 × 10⁻¹ | |
| Air | Inhalation | 2.21 × 10⁻⁴ | 1.39 × 10⁻⁶ | 1.00 × 10⁻³ | 1.08 × 10⁻⁶ | 2.82 × 10⁻⁷ | 3.36 × 10⁻⁵ | 1.25 × 10⁻⁶ | 1.26 × 10⁻³ |
| Dermal contact | 1.45 × 10⁻¹ | 1.22 × 10⁻² | 4.24 × 10⁻² | 3.17 × 10⁻⁴ | 9.13 × 10⁻⁵ | 1.98 × 10⁻² | 5.48 × 10⁻³ | 2.25 × 10⁻¹ | |
| Water | Ingestion | 4.20 × 10⁻¹ | 1.36 × 10⁻¹ | 5.91 × 10⁻² | 8.09 × 10⁻³ | 1.08 × 10⁻³ | 1.08 × 10⁻¹ | 1.28 × 10⁻² | 7.44× 10⁻¹ |
| Sediment | Ingestion | 1.01 | 8.95 × 10⁻² | 1.27 × 10⁻¹ | 1.54 × 10⁻² | 8.08 × 10⁻³ | 4.27 × 10⁻¹ | 1.43 × 10⁻² | 1.69 |
| Dermal contact | 1.09 × 10⁻² | 1.28 × 10⁻² | 9.08 × 10⁻³ | 7.38 × 10⁻⁵ | 4.30 × 10⁻⁵ | 4.13 × 10⁻³ | 1.03 × 10⁻³ | 3.81 × 10⁻² | |
| Crop | Ingestion | 4.00 × 10⁻¹ | 3.62 × 10⁻¹ | 1.16 × 10⁻¹ | 1.29 × 10⁻¹ | 2.48 × 10⁻² | 1.03 × 10⁻¹ | 5.41 × 10⁻² | 1.19 |
| HI | 4.23 | 6.48 × 10⁻¹ | 7.56 × 10⁻¹ | 1.66 × 10⁻¹ | 5.80 × 10⁻² | 1.27 | 1.03 × 10⁻¹ | 7.23 | |
| Age Group | Type | Pathway | As | Cd | Total |
|---|---|---|---|---|---|
| Adults | Soil | Ingest | 4.35 × 10⁻⁵ | 7.69 × 10⁻⁶ | 5.12 × 10⁻⁵ |
| Inhale | 1.35 × 10⁻¹¹ | 5.18 × 10⁻¹¹ | 6.52 × 10⁻¹¹ | ||
| Dermal | 1.46 × 10⁻⁵ | 8.61 × 10⁻⁸ | 1.47 × 10⁻⁵ | ||
| Air | Inhale | 4.47 × 10⁻¹¹ | 8.30 × 10⁻¹¹ | 1.28 × 10⁻¹⁰ | |
| Dermal | 4.59 × 10⁻⁵ | 1.31 × 10⁻⁷ | 4.61 × 10⁻⁵ | ||
| Water | Ingest | 3.32 × 10⁻⁵ | 1.46 × 10⁻⁴ | 1.79 × 10⁻⁴ | |
| Sediment | Ingest | 2.00 × 10⁻⁵ | 2.40 × 10⁻⁵ | 4.39 × 10⁻⁵ | |
| Dermal | 1.34 × 10⁻⁵ | 5.37 × 10⁻⁷ | 1.39 × 10⁻⁵ | ||
| Crop | Ingest | 2.35 × 10⁻⁵ | 2.88 × 10⁻⁴ | 3.12 × 10⁻⁴ | |
| TCR | 1.94 × 10⁻⁴ | 4.66 × 10⁻⁴ | 6.60 × 10⁻⁴ | ||
| Children | Soil | Ingest | 8.48 × 10⁻⁵ | 1.50 × 10⁻⁵ | 9.97 × 10⁻⁵ |
| Inhale | 6.82 × 10⁻¹² | 2.62 × 10⁻¹¹ | 3.30 × 10⁻¹¹ | ||
| Dermal | 7.12 × 10⁻⁶ | 4.20 × 10⁻⁸ | 7.16 × 10⁻⁶ | ||
| Air | Inhale | 2.44 × 10⁻¹¹ | 4.54 × 10⁻¹¹ | 6.99 × 10⁻¹¹ | |
| Dermal | 2.24 × 10⁻⁵ | 6.38 × 10⁻⁸ | 2.25 × 10⁻⁵ | ||
| Water | Ingest | 1.62 × 10⁻⁵ | 7.09 × 10⁻⁵ | 8.71 × 10⁻⁵ | |
| Sediment | Ingest | 3.89 × 10⁻⁵ | 4.68 × 10⁻⁵ | 8.57 × 10⁻⁵ | |
| Dermal | 1.68 × 10⁻⁶ | 6.72 × 10⁻⁸ | 1.74 × 10⁻⁶ | ||
| Crop | Ingest | 1.54 × 10⁻⁵ | 1.89 × 10⁻⁴ | 2.04 × 10⁻⁴ | |
| TCR | 1.86 × 10⁻⁴ | 3.22 × 10⁻⁴ | 5.08 × 10⁻⁴ | ||
© 2017 by the authors. Licensee MDPI, Basel, Switzerland. This article is an open access article distributed under the terms and conditions of the Creative Commons Attribution (CC BY) license (http://creativecommons.org/licenses/by/4.0/).
Share and Cite
Xie, W.; Peng, C.; Wang, H.; Chen, W. Health Risk Assessment of Trace Metals in Various Environmental Media, Crops and Human Hair from a Mining Affected Area. Int. J. Environ. Res. Public Health 2017, 14, 1595. https://doi.org/10.3390/ijerph14121595
Xie W, Peng C, Wang H, Chen W. Health Risk Assessment of Trace Metals in Various Environmental Media, Crops and Human Hair from a Mining Affected Area. International Journal of Environmental Research and Public Health. 2017; 14(12):1595. https://doi.org/10.3390/ijerph14121595
Chicago/Turabian StyleXie, Wushuang, Chi Peng, Hongtao Wang, and Weiping Chen. 2017. "Health Risk Assessment of Trace Metals in Various Environmental Media, Crops and Human Hair from a Mining Affected Area" International Journal of Environmental Research and Public Health 14, no. 12: 1595. https://doi.org/10.3390/ijerph14121595
APA StyleXie, W., Peng, C., Wang, H., & Chen, W. (2017). Health Risk Assessment of Trace Metals in Various Environmental Media, Crops and Human Hair from a Mining Affected Area. International Journal of Environmental Research and Public Health, 14(12), 1595. https://doi.org/10.3390/ijerph14121595