Multi-Elements in Source Water (Drinking and Surface Water) within Five Cities from the Semi-Arid and Arid Region, NW China: Occurrence, Spatial Distribution and Risk Assessment

 ,
,  ,
,
Abstract
1. Introduction
2. Materials and Methods
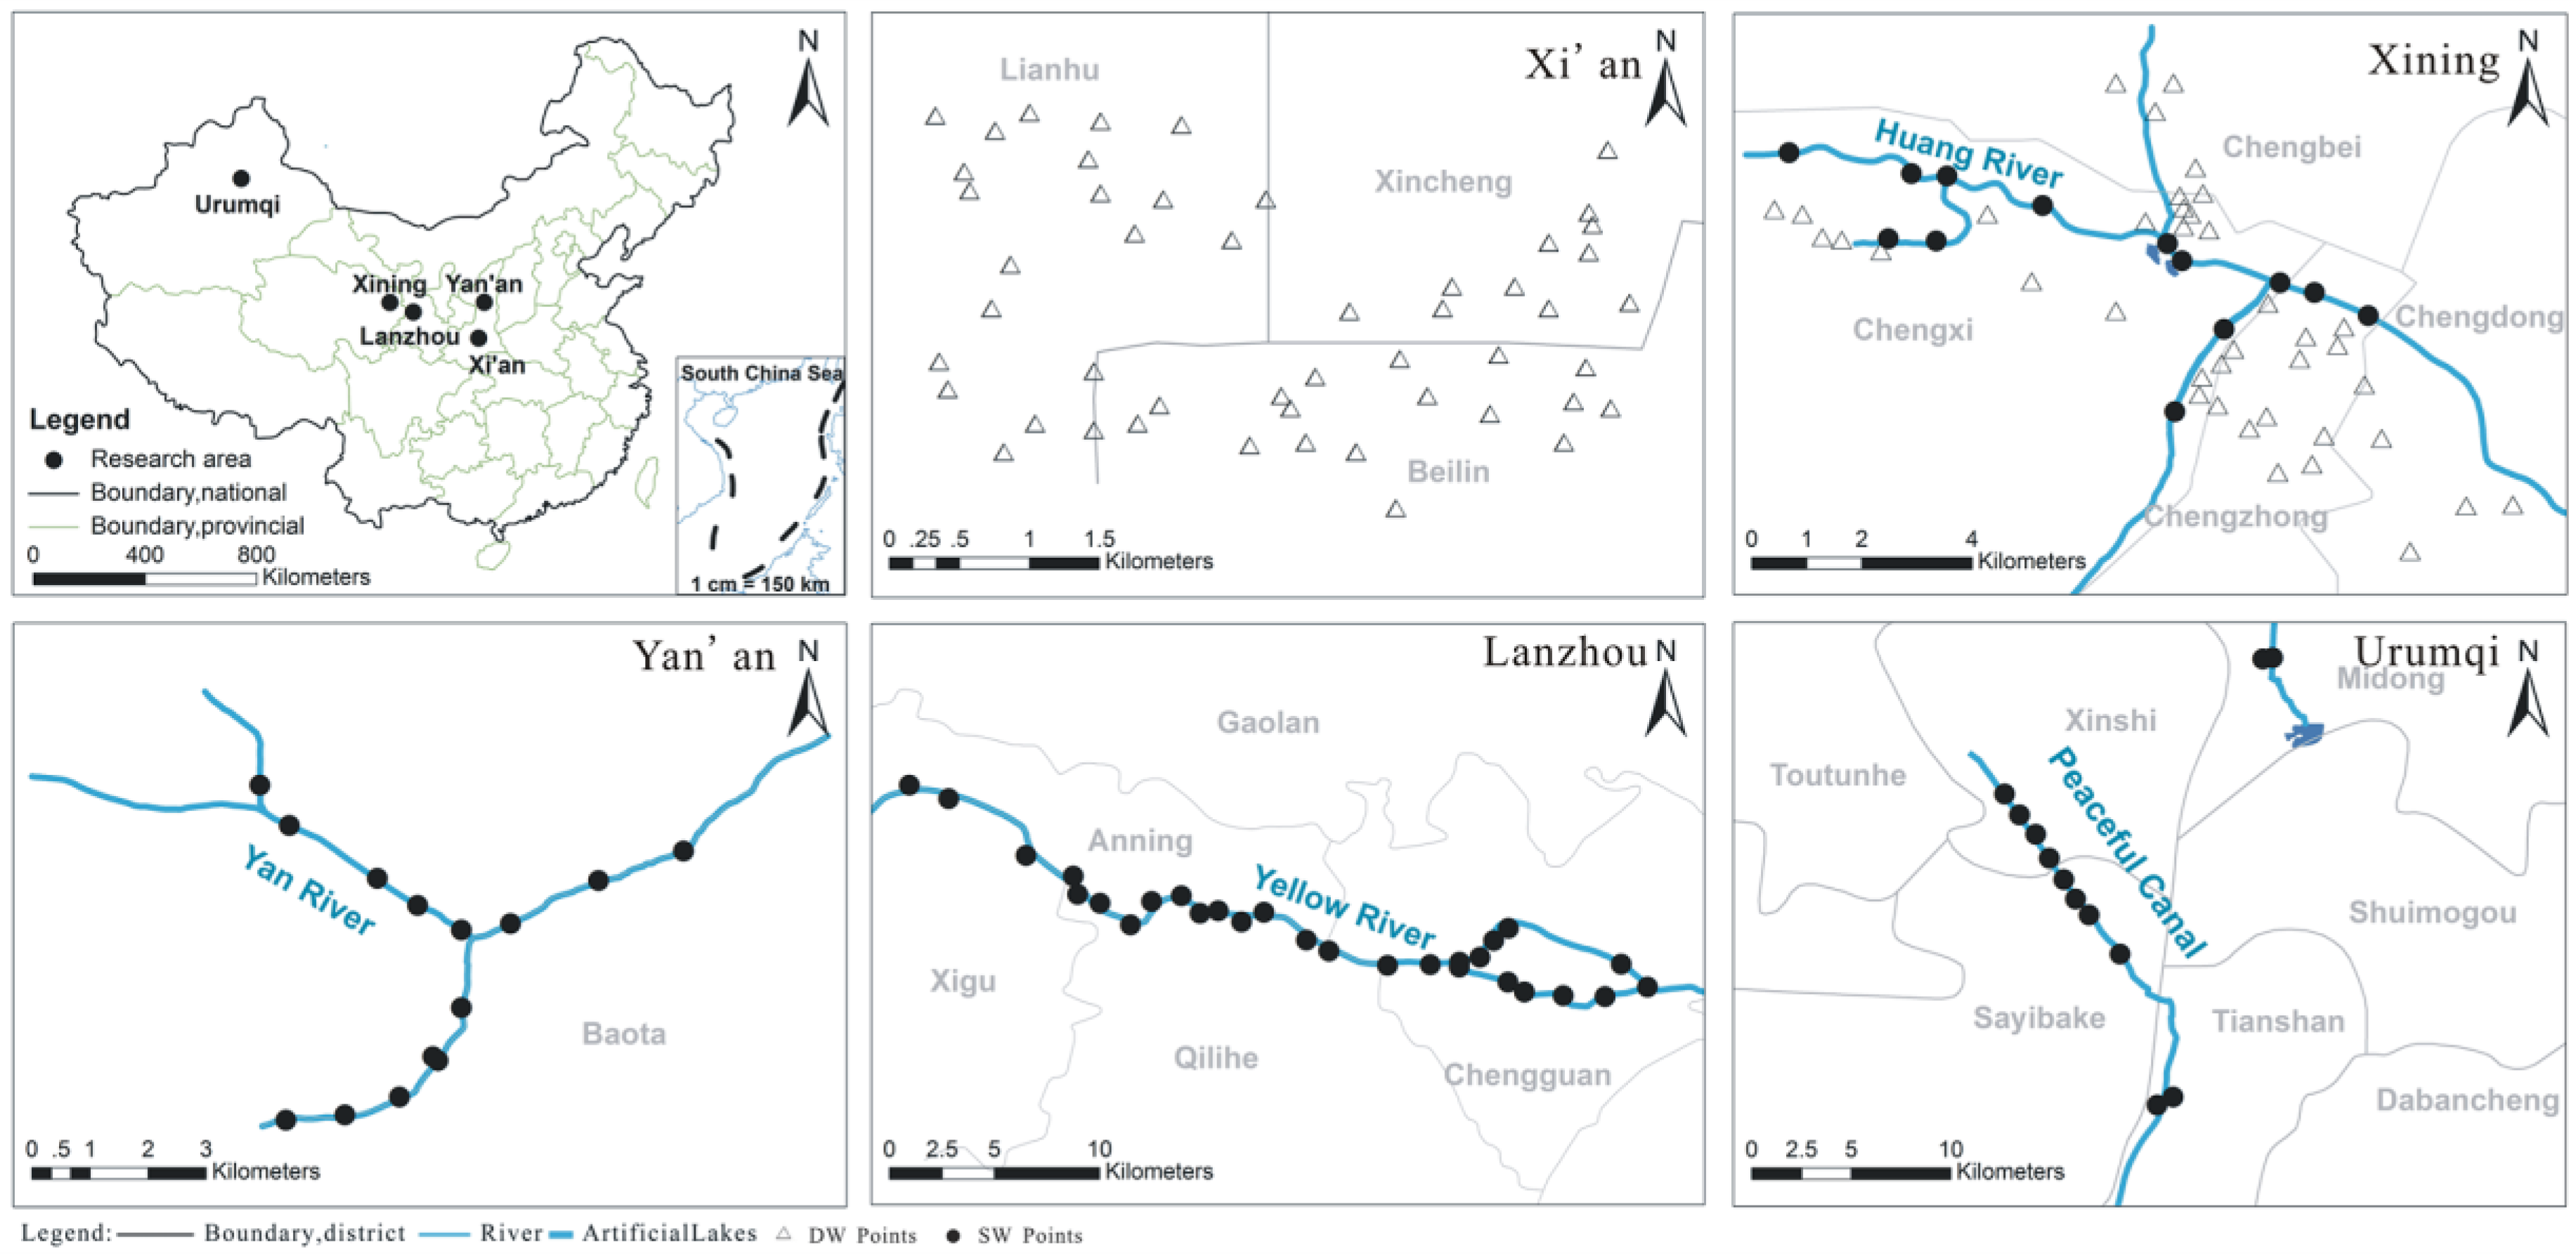
2.1. Study Area
2.2. Sampling and Analytical Procedure
2.2.1. Sampling
2.2.2. Analytical Procedure
2.3. Heavy Metal Risk Assessment
2.3.1. Drinking Water Exposure and Children Health Risk Assessment
2.3.2. Surface Water Ecological Risk Assessment
3. Results and Discussion
3.1. Hydrochemistry and Natural Variation of MEs
3.1.1. The pH and Electrical Conductivity
3.1.2. Anion Chemistry
3.1.3. Cation Chemistry
3.1.4. The HMs, TOC and TN
3.1.5. Correlation Analysis
3.2. Multiple-Elements and Regional Distribution
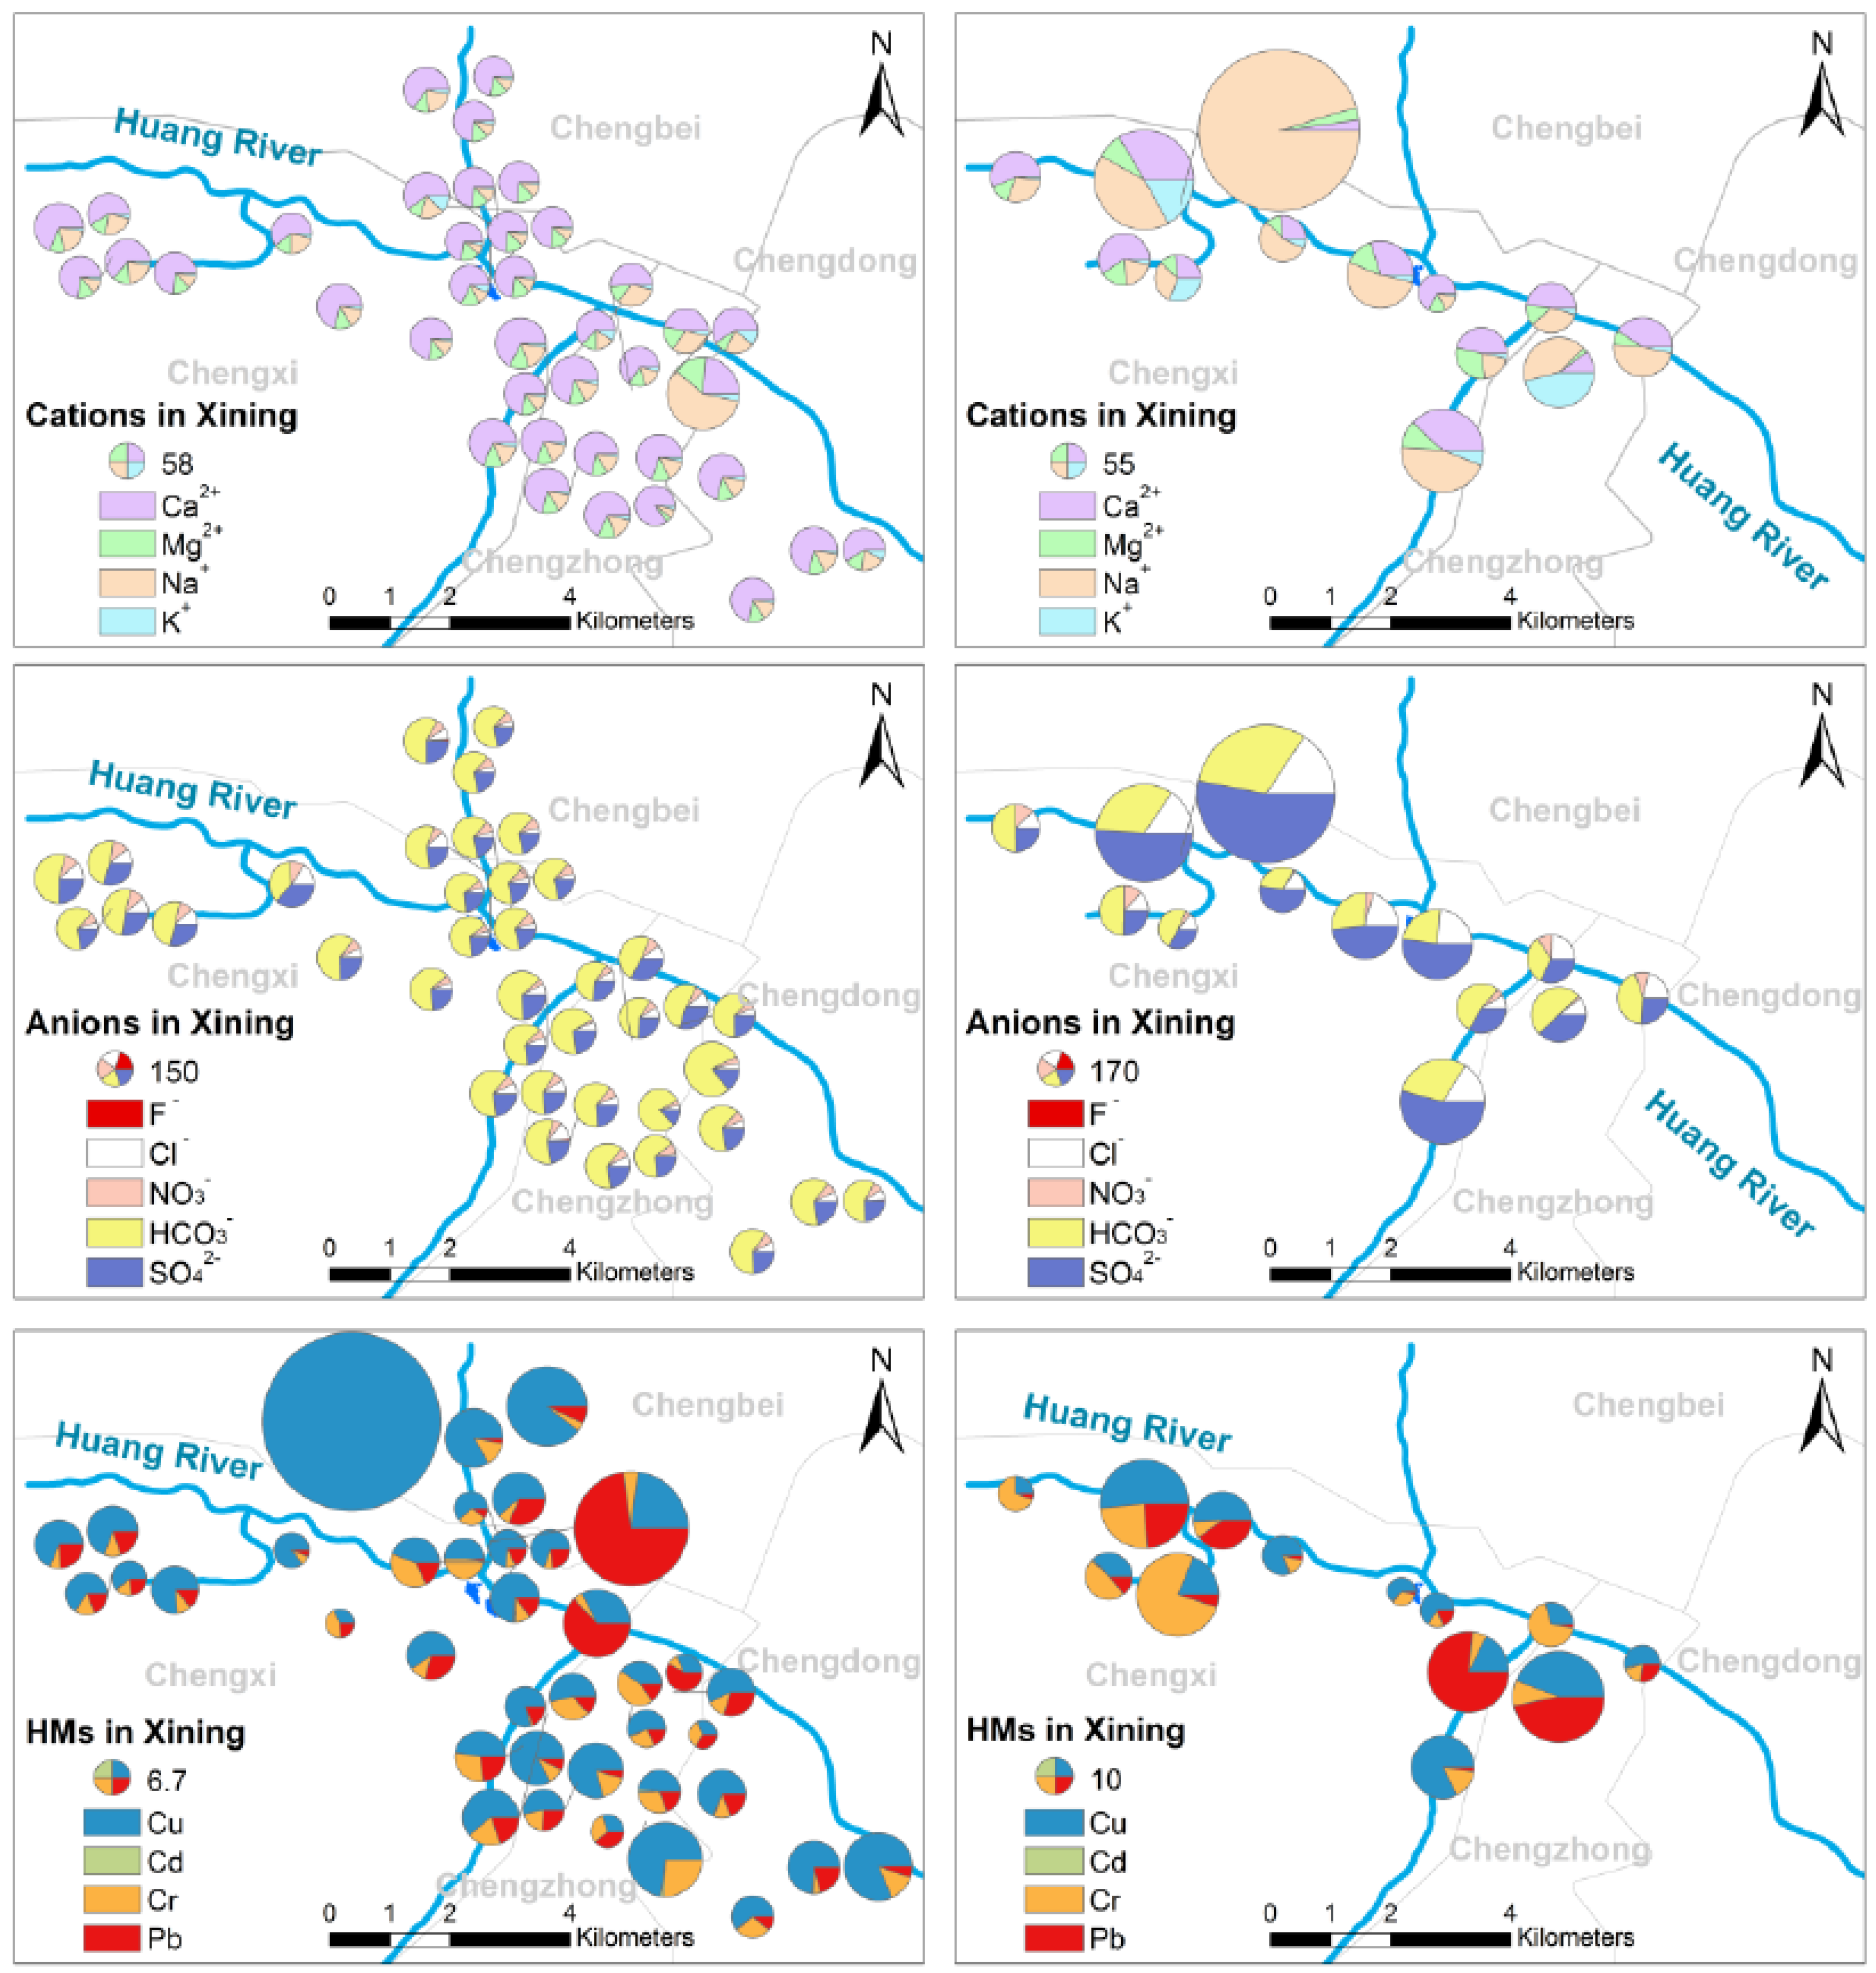
3.2.1. The Spatial Variations and Distributions of MEs
3.2.2. The Boxplot of Water Parameters in Different Areas
- The Yellow River seems to have the lowest median values of Cu and TOC, although the differences are not significant.
- The median values of all major elements, except Cd and Cr are significantly higher in Xining DW than in Xi’an DW.
- Yellow River resembles Huang River regarding Na+, Cr and TN, and Mg2+, Cl−, NO3−, SO42−. To this point, we should notice the Huang River is one of branches of Yellow River.
- Xining drinking water resembles the Yellow River regarding Pb, Ca2+, Cu and TN, and Mg2+, NO3−, HCO3− and TOC also come nearly. In addition, it’s important to note that Huang River is one of the water sources of Xining drinking water.
- Compared to the other datasets, Xi’an DW has a rather uniform content of Na+, K+, Cl−, HCO3−, SO42− and TN.
- The variation of F− in Xining tap is much larger than others, especially compared with Xi’an DW.
3.3. Heavy Metal Risk Assessments
3.3.1. Children Health Risk Assessment of the DW
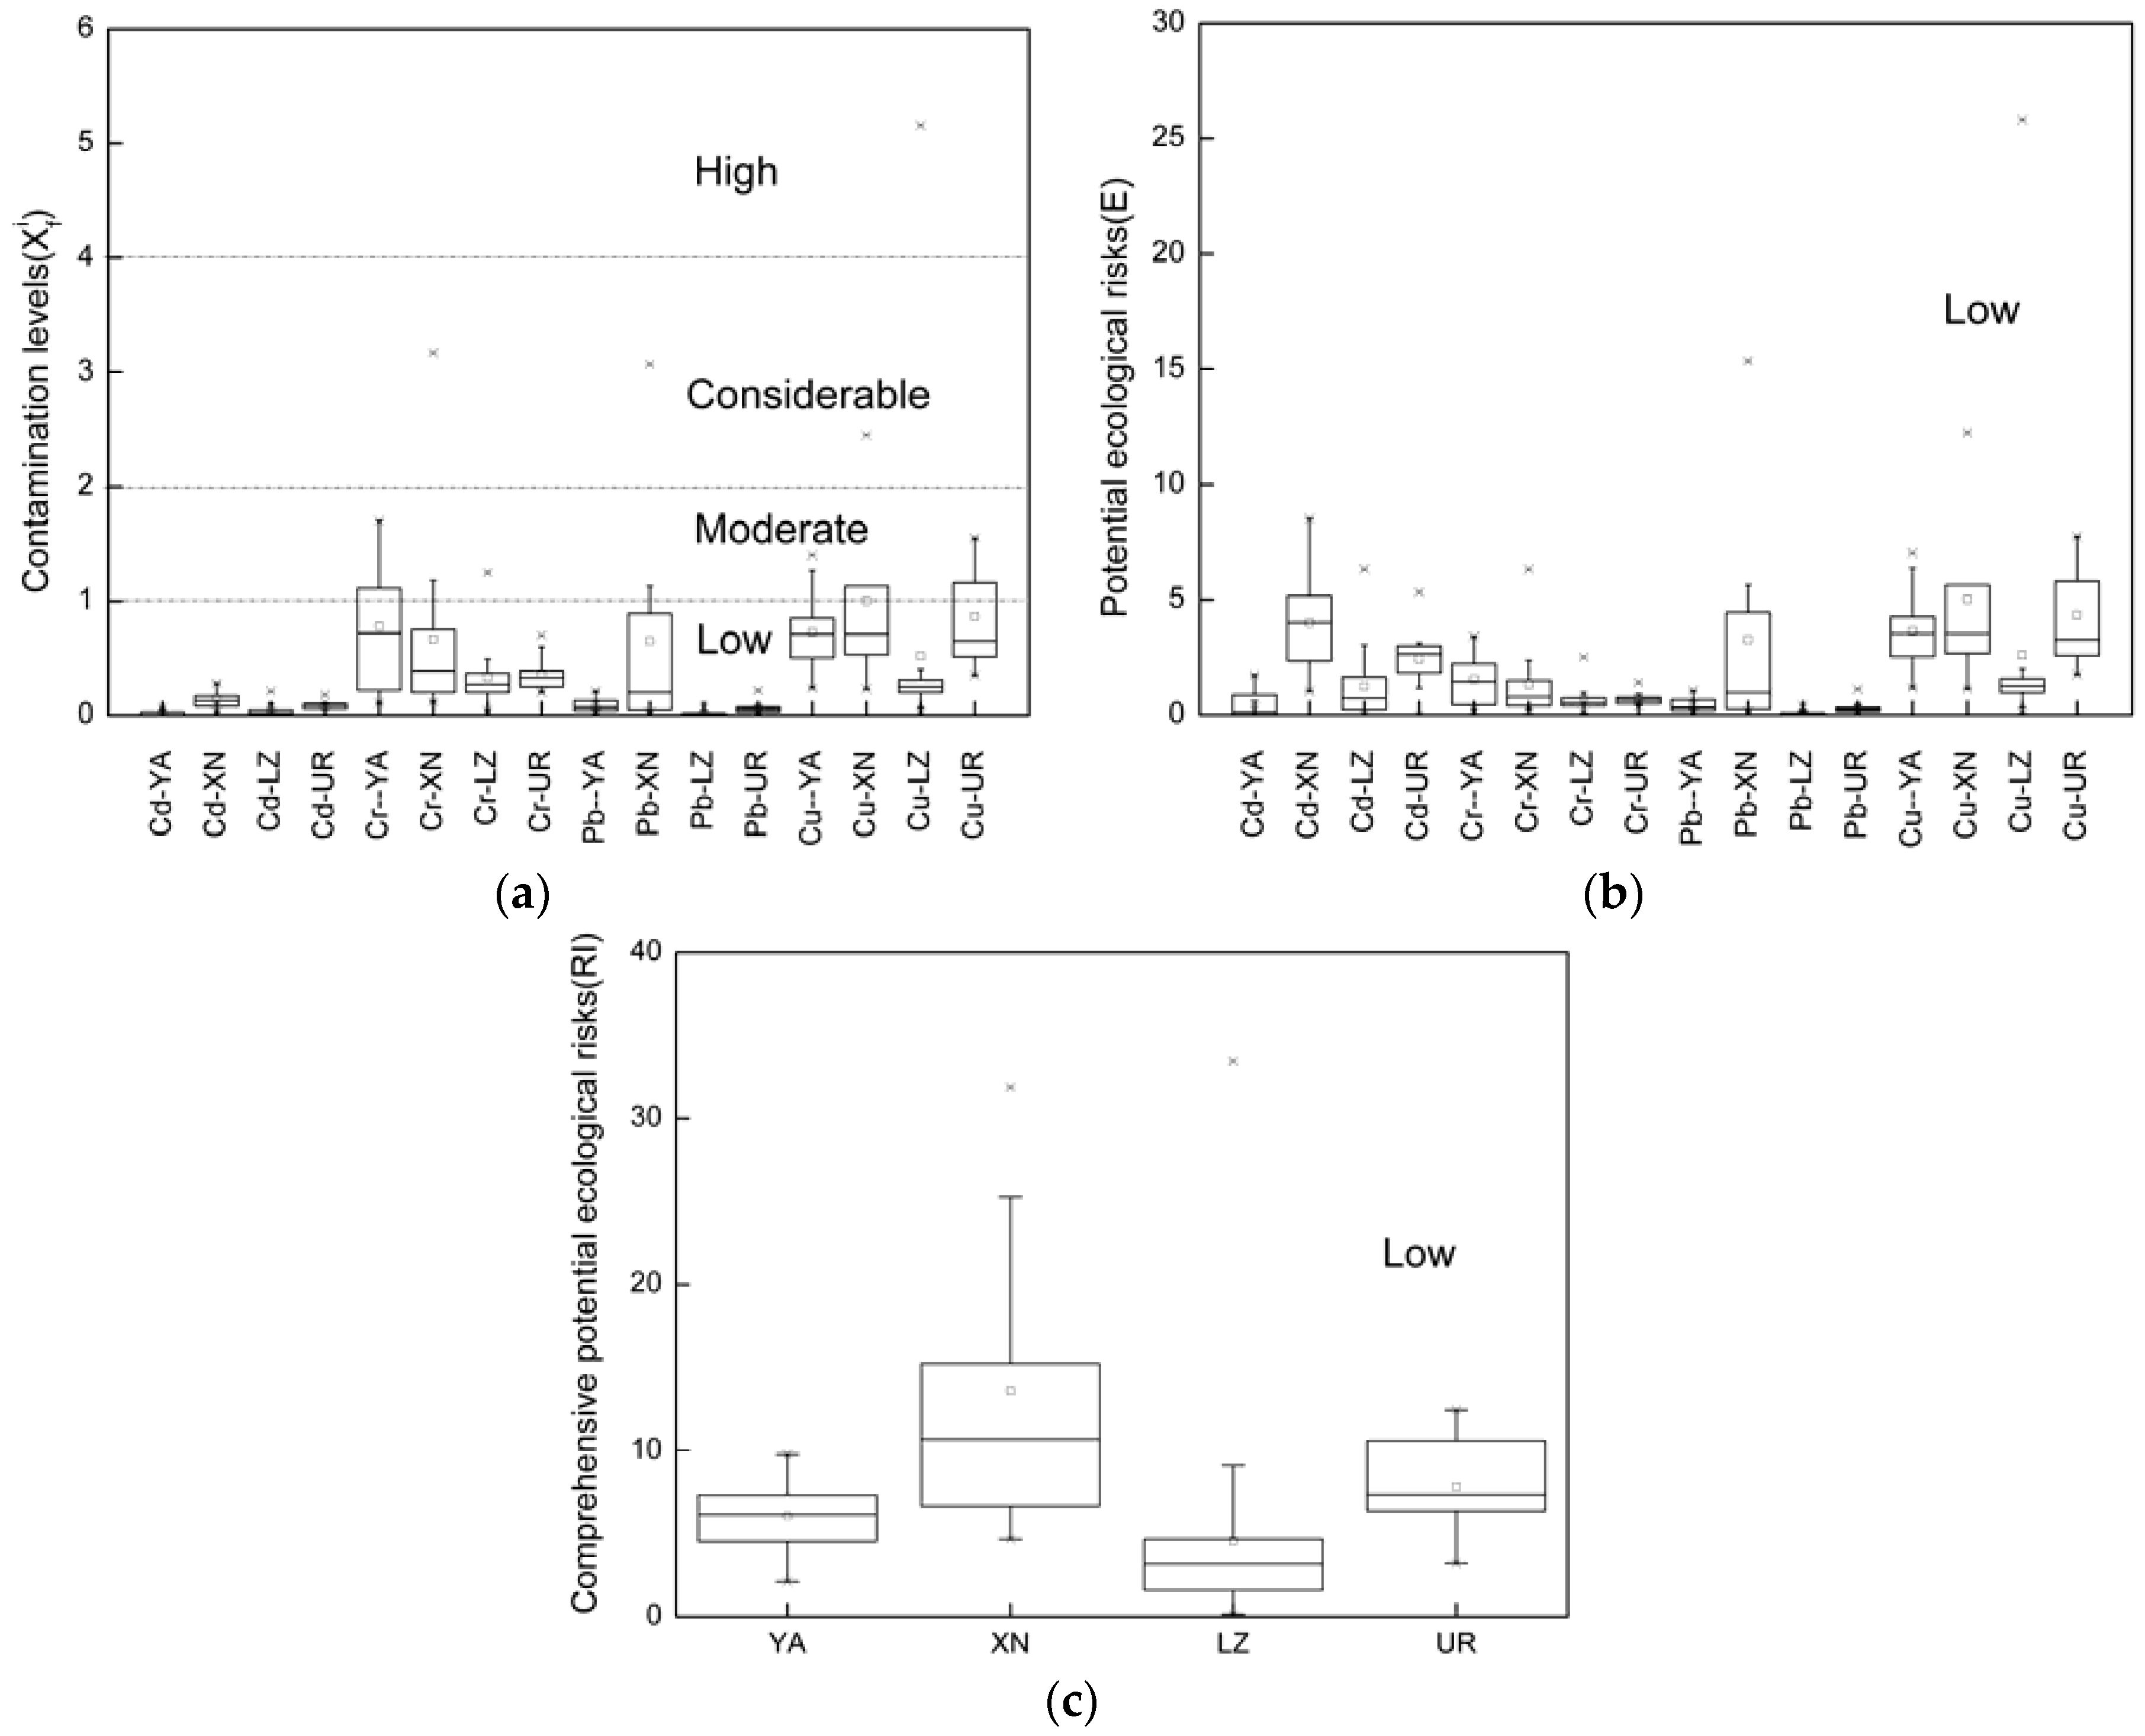
3.3.2. Ecological Assessment of the Surface Water
4. Conclusions
Supplementary Materials
Acknowledgments
Author Contributions
Conflicts of Interest
References
- Khan, S.D.; Mahmood, K.; Sultan, M.I.; Khan, A.S.; Xiong, Y.; Sagintayev, Z. Trace element geochemistry of groundwater from Quetta Valley, western Pakistan. Environ. Earth Sci. 2009, 60, 573–582. [Google Scholar] [CrossRef]
- Fordyce, F.M.; Vrana, K.; Zhovinsky, E.; Povoroznuk, V.; Toth, G.; Hope, B.C.; Iljinsky, U.; Baker, J. A health risk assessment for fluoride in Central Europe. Environ. Geochem. Health 2007, 29, 83–102. [Google Scholar] [CrossRef] [PubMed]
- Mukherjee, A.; Bhattacharya, P.; Savage, K.; Foster, A.; Bundschuh, J. Distribution of geogenic arsenic in hydrologic systems: Controls and challenges. J. Contam. Hydrol. 2008, 99, 1–7. [Google Scholar] [CrossRef] [PubMed]
- Kavcar, P.; Sofuoglu, A.; Sofuoglu, S.C. A health risk assessment for exposure to trace metals via drinking water ingestion pathway. Int. J. Hyg. Environ. Health 2009, 212, 216–227. [Google Scholar] [CrossRef] [PubMed]
- Muhammad, S.; Shah, M.T.; Khan, S. Health risk assessment of heavy metals and their source apportionment in drinking water of Kohistan region, northern Pakistan. Microchem. J. 2011, 98, 334–343. [Google Scholar] [CrossRef]
- Wu, B.; Zhang, Y.; Zhang, X.X.; Cheng, S.P. Health risk assessment of polycyclic aromatic hydrocarbons in the source water and drinking water of China: Quantitative analysis based on published monitoring data. Sci. Total Environ. 2011, 410–411, 112–118. [Google Scholar] [CrossRef] [PubMed]
- Bikundia, D.S.; Mohan, D. Major ion chemistry of the ground water at the Khoda Village, Ghaziabad, India. Sustain. Water Qual. Ecol. 2014, 3–4, 133–150. [Google Scholar] [CrossRef]
- Islam, M.S.; Ahmed, M.K.; Raknuzzaman, M.; Habibullah-Al-Mamun, M.; Islam, M.K. Heavy metal pollution in surface water and sediment: A preliminary assessment of an urban river in a developing country. Ecol. Indic. 2015, 48, 282–291. [Google Scholar] [CrossRef]
- Ma, J.Z.; Wang, X.S.; Edmunds, W.M. The characteristics of ground-water resources and their changes under the impacts of human activity in the arid Northwest China—A case study of the Shiyang River Basin. J. Arid Environ. 2005, 61, 277–295. [Google Scholar] [CrossRef]
- Li, S.; Li, J.; Zhang, Q. Water quality assessment in the rivers along the water conveyance system of the Middle Route of the South to North Water Transfer Project (China) using multivariate statistical techniques and receptor modeling. J. Hazard. Mater. 2011, 195, 306–317. [Google Scholar] [CrossRef] [PubMed]
- Zhang, Y.; Guo, F.; Meng, W.; Wang, X.Q. Water quality assessment and source identification of Daliao River Basin using multivariate statistical methods. Environ. Monit. Assess. 2009, 152, 105–121. [Google Scholar] [CrossRef] [PubMed]
- Wang, P.; Cao, J.; Han, Y.; Jin, Z.; Wu, F.; Zhang, F. Elemental distribution in the topsoil of the Lake Qinghai catchment, NE Tibetan Plateau, and the implications for weathering in semi-arid areas. J. Geochem. Explor. 2015, 152, 1–9. [Google Scholar] [CrossRef]
- Meng, Q.; Zhang, J.; Zhang, Z.; Wu, T. Geochemistry of dissolved trace elements and heavy metals in the Dan River Drainage (China): Distribution, sources, and water quality assessment. Environ. Sci. Pollut. Res. Int. 2016, 23, 8091–8103. [Google Scholar] [CrossRef] [PubMed]
- Nazeer, S.; Hashmi, M.Z.; Malik, R.N. Heavy metals distribution, risk assessment and water quality characterization by water quality index of the River Soan, Pakistan. Ecol. Indic. 2014, 43, 262–270. [Google Scholar] [CrossRef]
- Farahat, E.; Linderholm, H.W. The effect of long-term wastewater irrigation on accumulation and transfer of heavy metals in Cupressus sempervirens leaves and adjacent soils. Sci. Total Environ. 2015, 512–513, 1–7. [Google Scholar] [CrossRef] [PubMed]
- Li, S.; Zhang, Q. Risk assessment and seasonal variations of dissolved trace elements and heavy metals in the Upper Han River, China. J. Hazard. Mater. 2010, 181, 1051–1058. [Google Scholar] [CrossRef] [PubMed]
- Li, S.; Zhang, Q. Spatial characterization of dissolved trace elements and heavy metals in the upper Han River (China) using multivariate statistical techniques. J. Hazard. Mater. 2010, 176, 579–588. [Google Scholar] [CrossRef] [PubMed]
- Xiao, J.; Jin, Z.; Wang, J. Geochemistry of trace elements and water quality assessment of natural water within the Tarim River Basin in the extreme arid region, NW China. J. Geochem. Explor. 2014, 136, 118–126. [Google Scholar] [CrossRef]
- United States Environmental Protection Agency (USEPA). Exposure Factors Handbook; National Center for Environmental Assessment Office of Research and Development, Ed.; USEPA: Washington, DC, USA, 1997.
- United States Environmental Protection Agency (USEPA). Risk Assessment Guidance for Superfund Volume I: Human Health Evaluation Manual (Part A); Office of Emergency and Remedial Response, Ed.; USEPA: Washington, DC, USA, 1989.
- Al-Saleh, I.; Nester, M.; Devol, E.; Shinwari, N.; Al-Shahria, S. Determinants of blood lead levels in Saudi Arabian Schoolgirls. Int. J. Occup. Environ. Health 1999, 5, 107–114. [Google Scholar] [CrossRef] [PubMed]
- United States Environmental Protection Agency (USEPA). Water Quality Standards, Establishment of Numeric Criteria for Priority Toxic Pollutants for the State of California; Office of Water, Ed.; USEPA: Washington, DC, USA, 2000.
- International Agency for Research on Cancer (IARC). Agents Classified by the IARC Monographs; IARC: Lyon, France, 2017. [Google Scholar]
- United States Environmental Protection Agency (USEPA). Exposure Factor Handbook, 2011 ed.; National Center for Environmental Assessment Office of Research and Development, Ed.; USEPA: Washington, DC, USA, 2011.
- Hao, H.; Tongbin, C.; Jiliang, W.; Mei, L.; Hui, T.; Wenpu, Z.; Xuebin, Z. Risk assessment of lead exposure from different intake pathways for Children in Wuhan City. Environ. Sci. 2012, 33, 2075–2083. [Google Scholar]
- Zhe, W.; Shaoqing, L.; Xiaomin, C.; Chunye, L. Estimates of the exposed dermal surface area of Chinese in view of human health risk assessment. J. Saf. Environ. 2008, 8, 152–156. [Google Scholar]
- Nadal, M.; Schuhmacher, M.; Domingo, J.L. Long-term environmental monitoring of persistent organic pollutants and metals in a chemical/petrochemical area: Human health risks. Environ. Pollut. 2011, 159, 1769–1777. [Google Scholar] [CrossRef] [PubMed]
- Hakanson, L. An ecological risk index for aquatic pollution control.a sedimentological approach. Water Res. 1980, 14, 975–1001. [Google Scholar] [CrossRef]
- Jiang, X.; Lu, W.X.; Zhao, H.Q.; Yang, Q.C.; Yang, Z.P. Potential ecological risk assessment and prediction of soil heavy-metal pollution around coal gangue dump. Nat. Hazards Earth Syst. Sci. 2014, 14, 1599–1610. [Google Scholar] [CrossRef]
- Zhengqi, X.; Shijun, N.; Xianguo, T.; Chengjiang, Z. Calculation of heavy metals’ toxicity coefficient in the evaluation of potential ecological risk index. Environ. Sci. Technol. 2008, 31, 112–115. [Google Scholar]
- Li, X.; Wu, T.; Bao, H.; Liu, X.; Xu, C.; Zhao, Y.; Liu, D.; Yu, H. Potential toxic trace element (PTE) contamination in Baoji urban soil (NW China): Spatial distribution, mobility behavior, and health risk. Environ. Sci. Pollut. Res. Int. 2017, 24, 19749–19766. [Google Scholar] [CrossRef] [PubMed]
- Fawell, J.; Bailey, K.; Chilton, J.; Dahi, E. Fluoride In Drinking-Water (WHO Drinking-Water Quality); World Health Organization: Geneva, Switzerland, 2006; Volume 144. [Google Scholar]
- Drever, J.I. The Geochemistry of Natural Waters: Surface and Groundwater Environments; Prentice Hall: Upper Saddle River, NJ, USA, 1997. [Google Scholar]
- Maddock, I. Groundwater in the environment: An introduction, by Paul L. Younger, 2007. River Res. Appl. 2008, 24, 1377. [Google Scholar] [CrossRef]
- Krishna, V.S.R. Ground Water Brochure: Krishna District, Andhra Pradesh; Ministry of Water Resources Government of India: Hyderabad, India, 2013.
- Marghade, D.; Malpe, D.B.; Zade, A.B. Major ion chemistry of shallow groundwater of a fast growing city of central India. Environ. Monit. Assess. 2012, 184, 2405–2418. [Google Scholar] [CrossRef] [PubMed]
- Cicchella, D.; Albanese, S.; de Vivo, B.; Dinelli, E.; Giaccio, L.; Lima, A.; Valera, P. Trace elements and ions in Italian bottled mineral waters: Identification of anomalous values and human health related effects. J. Geochem. Explor. 2010, 107, 336–349. [Google Scholar] [CrossRef]
- Sarin, M.M.; Krishnaswami, S.; Dilli, K.; Somayajulu, B.L.K.; Moore, W.S. Major ion chemistry of the Ganga-Brahmaputra river system: Weathering processes and fluxes to the Bay of Bengal. Geochim. Cosmochim. Acta 1989, 53, 997–1009. [Google Scholar] [CrossRef]
- Krishna, A.K.; Satyanarayanan, M.; Govil, P.K. Assessment of heavy metal pollution in water using multivariate statistical techniques in an industrial area: A case study from Patancheru, Medak District, Andhra Pradesh, India. J. Hazard. Mater. 2009, 167, 366–373. [Google Scholar] [CrossRef] [PubMed]
- Pekey, H.; Karakas, D.; Bakoglu, M. Source apportionment of trace metals in surface waters of a polluted stream using multivariate statistical analyses. Mar. Pollut. Bull. 2004, 49, 809–818. [Google Scholar] [CrossRef] [PubMed]
- Ouyang, Y.; Nkedi-Kizza, P.; Wu, Q.T.; Shinde, D.; Huang, C.H. Assessment of seasonal variations in surface water quality. Water Res. 2006, 40, 3800–3810. [Google Scholar] [CrossRef] [PubMed]
- Singh, V.K.; Bikundia, D.S.; Sarswat, A.; Mohan, D. Groundwater quality assessment in the village of Lutfullapur Nawada, Loni, District Ghaziabad, Uttar Pradesh, India. Environ. Monit. Assess. 2012, 184, 4473–4488. [Google Scholar] [CrossRef] [PubMed]
- Srivastava, S.K.; Ramanathan, A.L. Geochemical assessment of groundwater quality in vicinity of Bhalswa landfill, Delhi, India, using graphical and multivariate statistical methods. Environ. Geol. 2007, 53, 1509–1528. [Google Scholar] [CrossRef]
- Meharg, A.A.; Scrimgeour, C.; Hossain, S.A.; Fuller, K.; Cruickshank, K.; Williams, P.N.; Kinniburgh, D.G. Codeposition of organic carbon and arsenic in Bengal Delta aquifers. Environ. Sci. Technol. 2006, 40, 4928–4935. [Google Scholar] [CrossRef] [PubMed]
- Cao, S.; Duan, X.; Zhao, X.; Ma, J.; Dong, T.; Huang, N.; Sun, C.; He, B.; Wei, F. Health risks from the exposure of children to As, Se, Pb and other heavy metals near the largest coking plant in China. Sci. Total Environ. 2014, 472, 1001–1009. [Google Scholar] [CrossRef] [PubMed]


| Item | Exposure Parameters | Value | Source |
|---|---|---|---|
| C | The concentration in DW | mg·L−1 | In this study |
| IngR | Ingestion rate of water | 0.327 L·day−1 | [24] |
| EF | Exposure frequency | 360 day·a−1 | [25] |
| ED | Exposure duration | 6 a−1 | [24] |
| BW | Average body weight | 15 kg | [24] |
| AT | Average exposure time | 70 × 365 day | [24] |
| SA | Exposed skin area | 1150 cm2 | [26] |
| AF | Skin adherence factor | 0.2 mg (cm2·day)−1 | [24] |
| ABS | Dermal absorption factor | 0.0003 | [27] |
| RfD | The reference dose | mg·kg−1·day−1 | [20] |
| SF | The slope factor | (mg/kg/day)−1 | [20] |
| Heavy Metals | Oral RfD | Dermal RfD | Oral SF | Dermal SF |
|---|---|---|---|---|
| Cd | 0.0005 | 0.00001 | NA | NA |
| Cr | 0.003 | 0.003 | 0.501 | 20 |
| Cu | 0.04 | 0.012 | NA | NA |
| Pb | 0.0014 | NF | NA | NA |
| Contamination Levels | RI | Risk Levels | |||
|---|---|---|---|---|---|
| <1 | <4 | low | <30 | <40 | low |
| 1–2 | 4–8 | moderate | 30–60 | 40–80 | moderate |
| 2–4 | 8–12 | considerable | 60–90 | 80–120 | considerable |
| ≥4 | ≥12 | high | 90–120 | 120–160 | high |
| - | - | - | ≥120 | ≥160 | Very high |
| Characteristics | Tap Water (n = 88) | Surface Water (n = 73) | Water Quality Criteria in China | |||||||||||||
|---|---|---|---|---|---|---|---|---|---|---|---|---|---|---|---|---|
| Min. | 25% | Median | 75% | Max. | AV. | SD | Min. | 25% | Median | 75% | Max. | AV. | SD | Tap Water | Surface Water * | |
| pH | 7.1 | 7.8 | 8.0 | 8.1 | 8.5 | 7.9 | 0.2 | 7.0 | 7.5 | 7.8 | 8.0 | 9.0 | 7.8 | 0.4 | 6.5~8.5 | 6~9 |
| EC (μS/cm) | 114.0 | 126.3 | 135.5 | 291.0 | 428.0 | 204.0 | 92.1 | 209.0 | 316.5 | 417.0 | 979.0 | 3080.0 | 712.9 | 599.1 | ||
| F− (mg/L) | 0.0 | 0.1 | 0.1 | 0.3 | 3.1 | 0.4 | 0.6 | 0.1 | 0.3 | 0.7 | 1.2 | 2.9 | 0.8 | 0.6 | 1 | 1 |
| Cl− (mg/L) | 4.6 | 8.2 | 9.4 | 14.3 | 38.3 | 12.0 | 6.2 | 12.5 | 35.1 | 81.6 | 151.4 | 604.8 | 125.7 | 122.8 | 250 | 250 |
| HCO3− (mg/L) | 33.2 | 53.6 | 58.9 | 128.7 | 265.3 | 88.8 | 44.4 | 36.1 | 102.3 | 151.5 | 247.1 | 880.2 | 202.6 | 155.8 | ||
| NO3− (mg/L) | 5.0 | 9.7 | 11.2 | 15.8 | 26.4 | 13.0 | 4.3 | 1.4 | 13.4 | 17.9 | 37.3 | 315.0 | 39.9 | 67.0 | 10 | 10 |
| SO42− (mg/L) | 19.0 | 24.5 | 26.2 | 48.9 | 87.0 | 36.9 | 15.6 | 30.9 | 81.1 | 148.3 | 296.1 | 2172.9 | 274.4 | 335.2 | 250 | 250 |
| NH4+ (mg/L) | 0.0 | 0.0 | 0.2 | 0.5 | 1.8 | 0.3 | 0.4 | 0.0 | 0.0 | 0.0 | 0.0 | 3.0 | 0.1 | 0.4 | 0.5 | 1 |
| K+ (mg/L) | 1.1 | 1.5 | 1.9 | 2.5 | 9.3 | 2.3 | 1.4 | 0.2 | 2.5 | 5.5 | 12.1 | 97.5 | 11.6 | 16.2 | ||
| Na+ (mg/L) | 2.1 | 2.9 | 4.1 | 11.3 | 115.7 | 8.4 | 12.9 | 8.1 | 33.1 | 78.3 | 175.2 | 1062.3 | 140.7 | 175.0 | 200 | |
| Mg2+ (mg/L) | 2.7 | 2.9 | 3.4 | 10.4 | 30.0 | 6.4 | 4.5 | 3.7 | 15.9 | 20.9 | 37.5 | 64.7 | 26.1 | 13.0 | ||
| Ca2+ (mg/L) | 16.0 | 25.8 | 28.0 | 54.2 | 73.0 | 38.6 | 15.9 | 14.6 | 29.0 | 41.8 | 65.6 | 282.3 | 60.1 | 47.4 | ||
| Cd (μg/L) | 0.0 | 0.1 | 0.1 | 0.2 | 3.6 | 0.2 | 0.4 | 0.0 | 0.0 | 0.1 | 0.1 | 0.3 | 0.1 | 0.1 | 5 | 5 |
| Cr (μg/L) | 0.2 | 1.6 | 2.5 | 3.2 | 7.3 | 2.5 | 1.2 | 0.4 | 2.1 | 3.3 | 6.2 | 31.7 | 4.8 | 4.7 | 50 | 50 |
| Pb (μg/L) | 0.0 | 0.4 | 1.1 | 2.2 | 14.7 | 1.6 | 2.1 | 0.0 | 0.3 | 0.5 | 1.4 | 49.0 | 2.7 | 8.1 | 10 | 50 |
| Cu (μg/L) | 0.6 | 3.5 | 5.6 | 8.8 | 161.4 | 10.7 | 24.0 | 0.2 | 2.5 | 5.1 | 9.0 | 51.6 | 7.2 | 7.6 | 1000 | 1000 |
| TOC (mg/L) | 1.6 | 2.9 | 3.5 | 3.9 | 151.6 | 5.5 | 16.1 | 0.6 | 2.6 | 3.5 | 6.1 | 47.3 | 5.2 | 6.3 | ||
| TN (mg/L) | 4.2 | 5.8 | 6.7 | 8.0 | 15.8 | 7.3 | 2.0 | 1.1 | 8.1 | 13.1 | 22.5 | 100.0 | 21.5 | 21.9 | ||
| pH | EC | F− | Cl− | HCO3− | NO3− | SO42− | NH4+ | K+ | Na+ | Mg2+ | Ca2+ | Cd | Cr | Pb | Cu | TOC | |
|---|---|---|---|---|---|---|---|---|---|---|---|---|---|---|---|---|---|
| EC | −0.54 ** | ||||||||||||||||
| F− | −0.12 | 0.44 ** | |||||||||||||||
| Cl− | −0.40 ** | 0.72 ** | 0.35 ** | ||||||||||||||
| HCO3− | −0.42 ** | 0.79 ** | 0.40 ** | 0.51 ** | |||||||||||||
| NO3− | −0.29 ** | 0.71 ** | 0.32 ** | 0.72 ** | 0.53 ** | ||||||||||||
| SO42− | −0.44 ** | 0.88 ** | 0.47 ** | 0.84 ** | 0.75 ** | 0.83 ** | |||||||||||
| NH4+ | 0.13 | 0.01 | −0.18 | 0.02 | −0.05 | 0.33 ** | 0.09 | ||||||||||
| K+ | −0.40 ** | 0.72 ** | 0.38 ** | 0.69 ** | 0.74 ** | 0.52 ** | 0.76 ** | 0.04 | |||||||||
| Na+ | −0.37 ** | 0.85 ** | 0.45 ** | 0.80 ** | 0.81 ** | 0.72 ** | 0.92 ** | 0.07 | 0.86 ** | ||||||||
| Mg2+ | −0.36 ** | 0.81 ** | 0.43 ** | 0.63 ** | 0.85 ** | 0.66 ** | 0.84 ** | 0.00 | 0.75 ** | 0.87 ** | |||||||
| Ca2+ | −0.49 ** | 0.80 ** | 0.39 ** | 0.52 ** | 0.98 ** | 0.56 ** | 0.76 ** | −0.07 | 0.72 ** | 0.78 ** | 0.83 ** | ||||||
| Cd | 0.06 | −0.21 | −0.33 ** | −0.11 | −0.26 * | −0.08 | −0.16 | 0.30 ** | 0.03 | −0.12 | −0.23 * | −0.24 * | |||||
| Cr | 0.08 | −0.36 ** | −0.16 | −0.30 ** | −0.41 ** | −0.41 ** | −0.38 ** | −0.07 | −0.22* | −0.36 ** | −0.42 ** | −0.40 ** | 0.37 ** | ||||
| Pb | −0.25 * | 0.63 ** | 0.15 | 0.49 ** | 0.55 ** | 0.44 ** | 0.59 ** | −0.16 | 0.50 ** | 0.65 ** | 0.61 ** | 0.54 ** | −0.23 | −0.40 ** | |||
| Cu | −0.14 | 0.15 | 0.04 | 0.09 | 0.28 ** | 0.20 | 0.20 | −0.09 | 0.28 ** | 0.20 | 0.15 | 0.32 ** | 0.26 * | −0.13 | 0.13 | ||
| TOC | 0.21 * | −0.41 ** | −0.36 ** | −0.20 | −0.36 ** | −0.27 * | −0.33 ** | 0.17 | −0.17 | −0.31 ** | −0.45 ** | −0.36 ** | 0.52 ** | 0.36 ** | −0.37 ** | 0.13 | |
| TN | −0.49 ** | 0.75 ** | 0.32 ** | 0.69 ** | 0.62 ** | 0.74 ** | 0.82 ** | 0.13 | 0.67 ** | 0.78 ** | 0.70 ** | 0.66 ** | 0.06 | −0.28 ** | 0.50 ** | 0.30 ** | −0.23 * |
| pH | EC | F− | Cl− | HCO3− | NO3− | SO42− | NH4+ | K+ | Na+ | Mg2+ | Ca2+ | Cd | Cr | Pb | Cu | TOC | |
|---|---|---|---|---|---|---|---|---|---|---|---|---|---|---|---|---|---|
| EC | −0.56 ** | ||||||||||||||||
| F− | 0.12 | −0.13 | |||||||||||||||
| Cl− | −0.35 ** | 0.56 ** | 0.09 | ||||||||||||||
| HCO3− | −0.20 | 0.34 ** | 0.01 | 0.67 ** | |||||||||||||
| NO3− | 0.02 | −0.05 | 0.15 | 0.22 | 0.18 | ||||||||||||
| SO42− | −0.26 * | 0.51 ** | 0.07 | 0.96 ** | 0.72 ** | 0.17 | |||||||||||
| NH4+ | −0.02 | 0.18 | −0.40 ** | −0.13 | −0.15 | −0.18 | −0.14 | ||||||||||
| K+ | −0.34 ** | 0.45 ** | 0.03 | 0.67 ** | 0.55 ** | 0.01 | 0.65 ** | −0.03 | |||||||||
| Na+ | −0.27 * | 0.40 ** | 0.12 | 0.88 ** | 0.68 ** | 0.21 | 0.85 ** | −0.13 | 0.74 ** | ||||||||
| Mg2+ | −0.13 | 0.07 | 0.10 | 0.68 ** | 0.52 ** | 0.32 ** | 0.69 ** | −0.32 ** | 0.55 ** | 0.74 ** | |||||||
| Ca2+ | −0.39 ** | 0.54 ** | −0.22 | 0.59 ** | 0.55 ** | 0.14 | 0.54 ** | 0.02 | 0.58 ** | 0.52 ** | 0.42 ** | ||||||
| Cd | −0.09 | 0.33 ** | −0.24 | 0.02 | 0.10 | −0.32 * | 0.05 | 0.24 | 0.38 ** | 0.01 | −0.22 | 0.30 * | |||||
| Cr | 0.09 | −0.07 | −0.07 | 0.14 | 0.06 | −0.03 | 0.12 | 0.08 | 0.29 * | 0.17 | 0.25 * | 0.20 | −0.05 | ||||
| Pb | 0.13 | 0.04 | 0.22 | 0.13 | 0.33 * | −0.13 | 0.15 | 0.00 | 0.35 ** | 0.09 | 0.09 | 0.06 | 0.33 * | 0.04 | |||
| Cu | 0.08 | 0.13 | −0.09 | 0.38 ** | 0.39 ** | −0.28 * | 0.41 ** | 0.07 | 0.61 ** | 0.38 ** | 0.28 * | 0.34 ** | 0.34 ** | 0.39 ** | 0.41 ** | ||
| TOC | −0.30 * | 0.40 ** | 0.08 | 0.56 ** | 0.57 ** | −0.18 | 0.58 ** | −0.06 | 0.74 ** | 0.58 ** | 0.30 * | 0.53 ** | 0.47 ** | 0.06 | 0.35 ** | 0.57 ** | |
| TN | −0.40 ** | 0.35 ** | 0.06 | 0.69 ** | 0.47 ** | 0.41 ** | 0.60 ** | −0.24 | 0.68 ** | 0.74 ** | 0.64 ** | 0.58 ** | 0.07 | 0.14 | 0.07 | 0.28 * | 0.53 ** |
| Heavy Metals Noncarcinogenic Effects (HI) | 5% | Median | 95% | ||||||
| HIing | HIder | HIt | HIing | HIder | HIt | HIing | HIder | HIt | |
| Cd | 2.26 × 10⁻⁴ | 2.38 × 10⁻³ | 2.61 × 10⁻³ | 4.32 × 10⁻⁴ | 4.56 × 10⁻³ | 4.99 × 10⁻³ | 1.81 × 10⁻³ | 1.91 × 10⁻² | 2.09 × 10⁻² |
| Cr | 1.13 × 10⁻³ | 3.75 × 10⁻¹ | 3.76 × 10⁻¹ | 1.74 × 10⁻³ | 5.79 × 10⁻¹ | 5.81 × 10⁻¹ | 2.60 × 10⁻³ | 8.67 × 10⁻¹ | 8.70 × 10⁻¹ |
| Cu | 4.82 × 10⁻⁵ | 3.39 × 10⁻⁵ | 8.22 × 10⁻⁵ | 2.24 × 10⁻⁴ | 1.58 × 10⁻⁴ | 3.82 × 10⁻⁴ | 1.70 × 10⁻³ | 1.19 × 10⁻³ | 2.89 × 10⁻³ |
| Pb | - | - | - | 7.18 × 10⁻⁵ | 1.52 × 10⁻⁵ | 8.70 × 10⁻⁵ | 3.54 × 10⁻³ | 7.46 × 10⁻⁴ | 4.28 × 10⁻³ |
| Total | 1.55 × 10⁻³ | 3.85 × 10⁻¹ | 3.87 × 10⁻¹ | 2.73 × 10⁻³ | 5.89 × 10⁻¹ | 5.92 × 10⁻¹ | 9.95 × 10⁻³ | 8.77 × 10⁻¹ | 8.82 × 10⁻¹ |
| Heavy Metals Carcinogenic Risks (ILCR) | 5% | Median | 95% | ||||||
| HIing | HIder | sum | HIing | HIder | sum | HIing | HIder | sum | |
| Cr | 1.69 × 10⁻⁶ | 1.43 × 10⁻⁵ | 1.59 × 10⁻⁵ | 2.61 × 10⁻⁶ | 2.20 × 10⁻⁵ | 2.46 × 10⁻⁵ | 3.91 × 10⁻⁶ | 3.29 × 10⁻⁵ | 3.69 × 10⁻⁵ |
| Heavy Metals Noncarcinogenic effects (HI) | 5% | Median% | 95% | ||||||
| HIing | HIder | HIt | HIing | HIder | HIt | HIing | HIder | HIt | |
| Cd | 8.77 × 10⁻⁵ | 9.26 × 10⁻⁴ | 1.01 × 10⁻³ | 3.02 × 10⁻⁴ | 3.19 × 10⁻³ | 3.49 × 10⁻³ | 1.04 × 10⁻³ | 1.09 × 10⁻² | 1.20 × 10⁻² |
| Cr | 3.45 × 10⁻⁴ | 1.15 × 10⁻¹ | 1.15 × 10⁻¹ | 9.26 × 10⁻⁴ | 3.09 × 10⁻¹ | 3.10 × 10⁻¹ | 2.93 × 10⁻³ | 9.77 × 10⁻¹ | 9.80 × 10⁻¹ |
| Cu | 6.30 × 10⁻⁵ | 4.43 × 10⁻⁵ | 1.07 × 10⁻⁴ | 3.04 × 10⁻⁴ | 2.14 × 10⁻⁴ | 5.17 × 10⁻⁴ | 1.34 × 10⁻³ | 9.46 × 10⁻⁴ | 2.29 × 10⁻³ |
| Pb | 2.22 × 10⁻⁴ | 4.69 × 10⁻⁵ | 2.69 × 10⁻⁴ | 2.06 × 10⁻³ | 4.34 × 10⁻⁴ | 2.49 × 10⁻³ | 5.91 × 10⁻³ | 1.25 × 10⁻³ | 7.15 × 10⁻³ |
| Total | 2.13 × 10⁻³ | 1.16 × 10⁻¹ | 1.18 × 10⁻¹ | 4.46 × 10⁻³ | 3.16 × 10⁻¹ | 3.22 × 10⁻¹ | 1.09 × 10⁻² | 9.82 × 10⁻¹ | 9.88 × 10⁻¹ |
| Heavy Metals carcinogenic risks (ILCR) | 5% | Median | 95% | ||||||
| HIing | HIder | sum | HIing | HIder | sum | HIing | HIder | sum | |
| Cr | 5.18 × 10⁻⁷ | 4.36 × 10⁻⁶ | 4.88 × 10⁻⁶ | 1.39 × 10⁻⁶ | 1.17 × 10⁻⁵ | 1.31 × 10⁻⁵ | 4.41 × 10⁻⁶ | 3.71 × 10⁻⁵ | 4.15 × 10⁻⁵ |
© 2017 by the authors. Licensee MDPI, Basel, Switzerland. This article is an open access article distributed under the terms and conditions of the Creative Commons Attribution (CC BY) license (http://creativecommons.org/licenses/by/4.0/).
Share and Cite
Wu, T.; Li, X.; Yang, T.; Sun, X.; Mielke, H.W.; Cai, Y.; Ai, Y.; Zhao, Y.; Liu, D.; Zhang, X.; et al. Multi-Elements in Source Water (Drinking and Surface Water) within Five Cities from the Semi-Arid and Arid Region, NW China: Occurrence, Spatial Distribution and Risk Assessment. Int. J. Environ. Res. Public Health 2017, 14, 1168. https://doi.org/10.3390/ijerph14101168
Wu T, Li X, Yang T, Sun X, Mielke HW, Cai Y, Ai Y, Zhao Y, Liu D, Zhang X, et al. Multi-Elements in Source Water (Drinking and Surface Water) within Five Cities from the Semi-Arid and Arid Region, NW China: Occurrence, Spatial Distribution and Risk Assessment. International Journal of Environmental Research and Public Health. 2017; 14(10):1168. https://doi.org/10.3390/ijerph14101168
Chicago/Turabian StyleWu, Ting, Xiaoping Li, Tao Yang, Xuemeng Sun, Howard W. Mielke, Yue Cai, Yuwei Ai, Yanan Zhao, Dongying Liu, Xu Zhang, and et al. 2017. "Multi-Elements in Source Water (Drinking and Surface Water) within Five Cities from the Semi-Arid and Arid Region, NW China: Occurrence, Spatial Distribution and Risk Assessment" International Journal of Environmental Research and Public Health 14, no. 10: 1168. https://doi.org/10.3390/ijerph14101168
APA StyleWu, T., Li, X., Yang, T., Sun, X., Mielke, H. W., Cai, Y., Ai, Y., Zhao, Y., Liu, D., Zhang, X., Li, X., Wang, L., & Yu, H. (2017). Multi-Elements in Source Water (Drinking and Surface Water) within Five Cities from the Semi-Arid and Arid Region, NW China: Occurrence, Spatial Distribution and Risk Assessment. International Journal of Environmental Research and Public Health, 14(10), 1168. https://doi.org/10.3390/ijerph14101168