
Dissipation and Residues of Dichlorprop-P and Bentazone in Wheat-Field Ecosystem

Abstract
:1. Introduction
2. Materials and Methods
2.1. Materials and Reagents
2.2. Field Trials
2.3. Sample Pretreatment
2.4. HPLC-MS/MS Conditions
2.5. Statistical Analysis
3. Results and Discussion
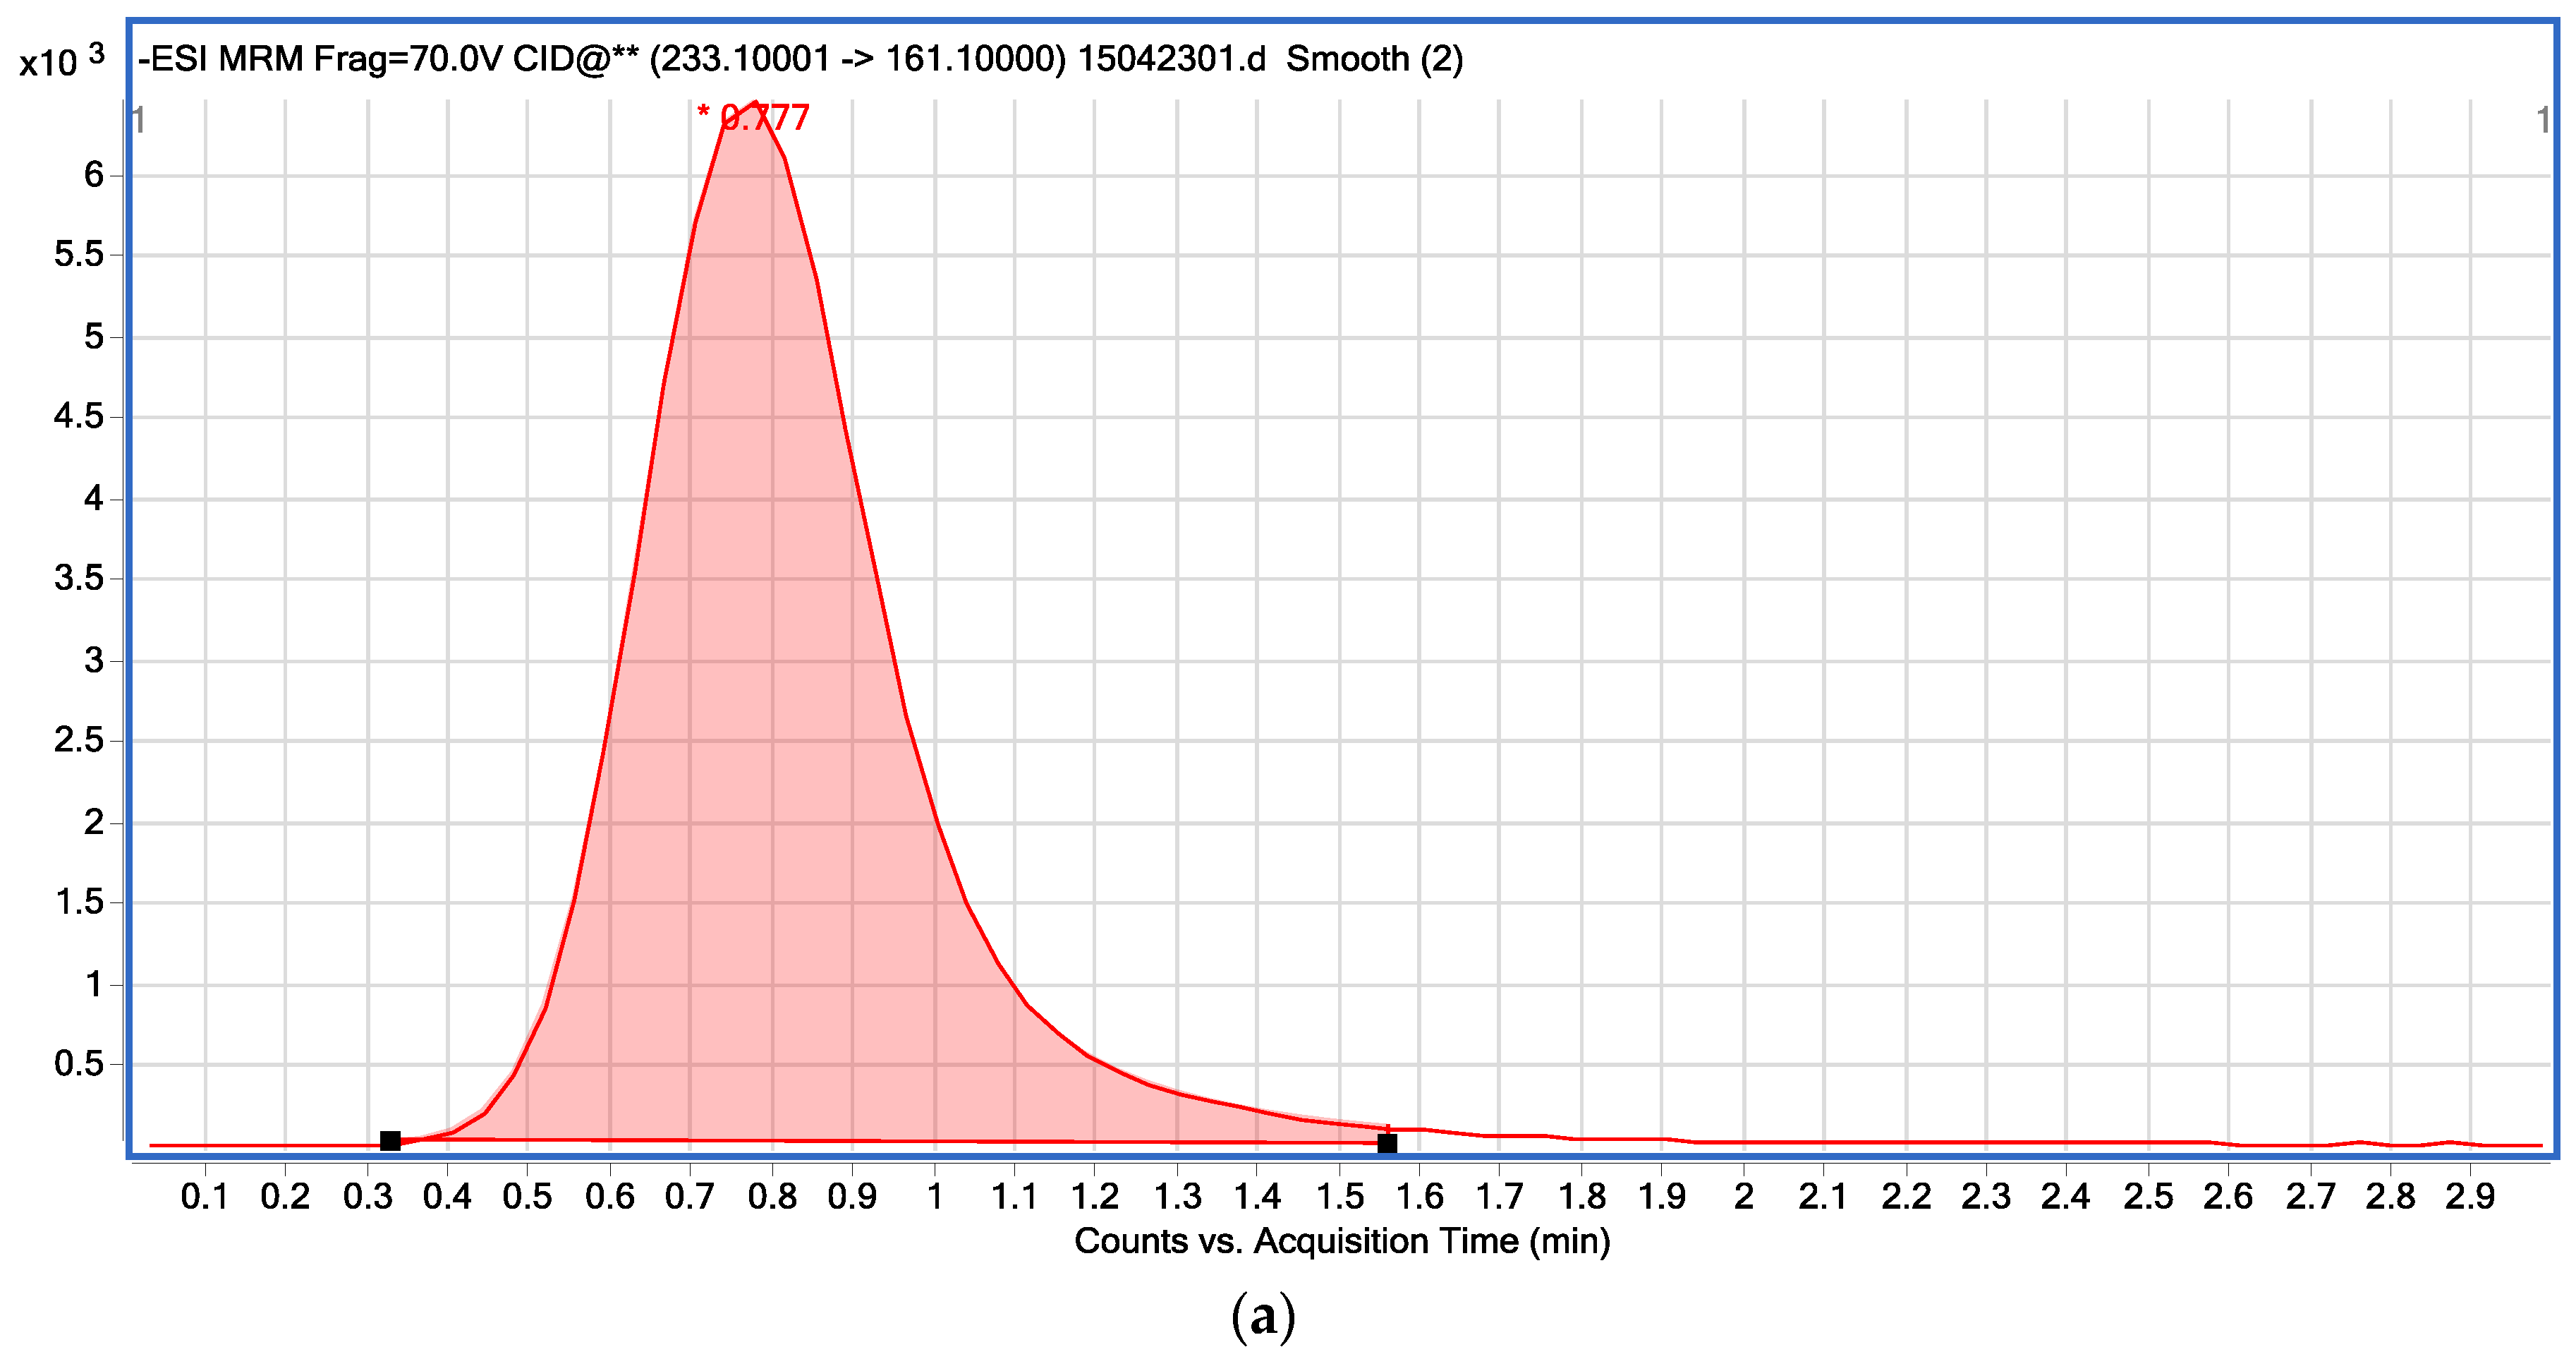
3.1. Optimization of HPLC-MS/MS Conditions
3.2. Optimization of Sample Pretreatment
3.3. Method Validation
3.3.1. Calibration, LOD and LOQ
3.3.2. Accuracy
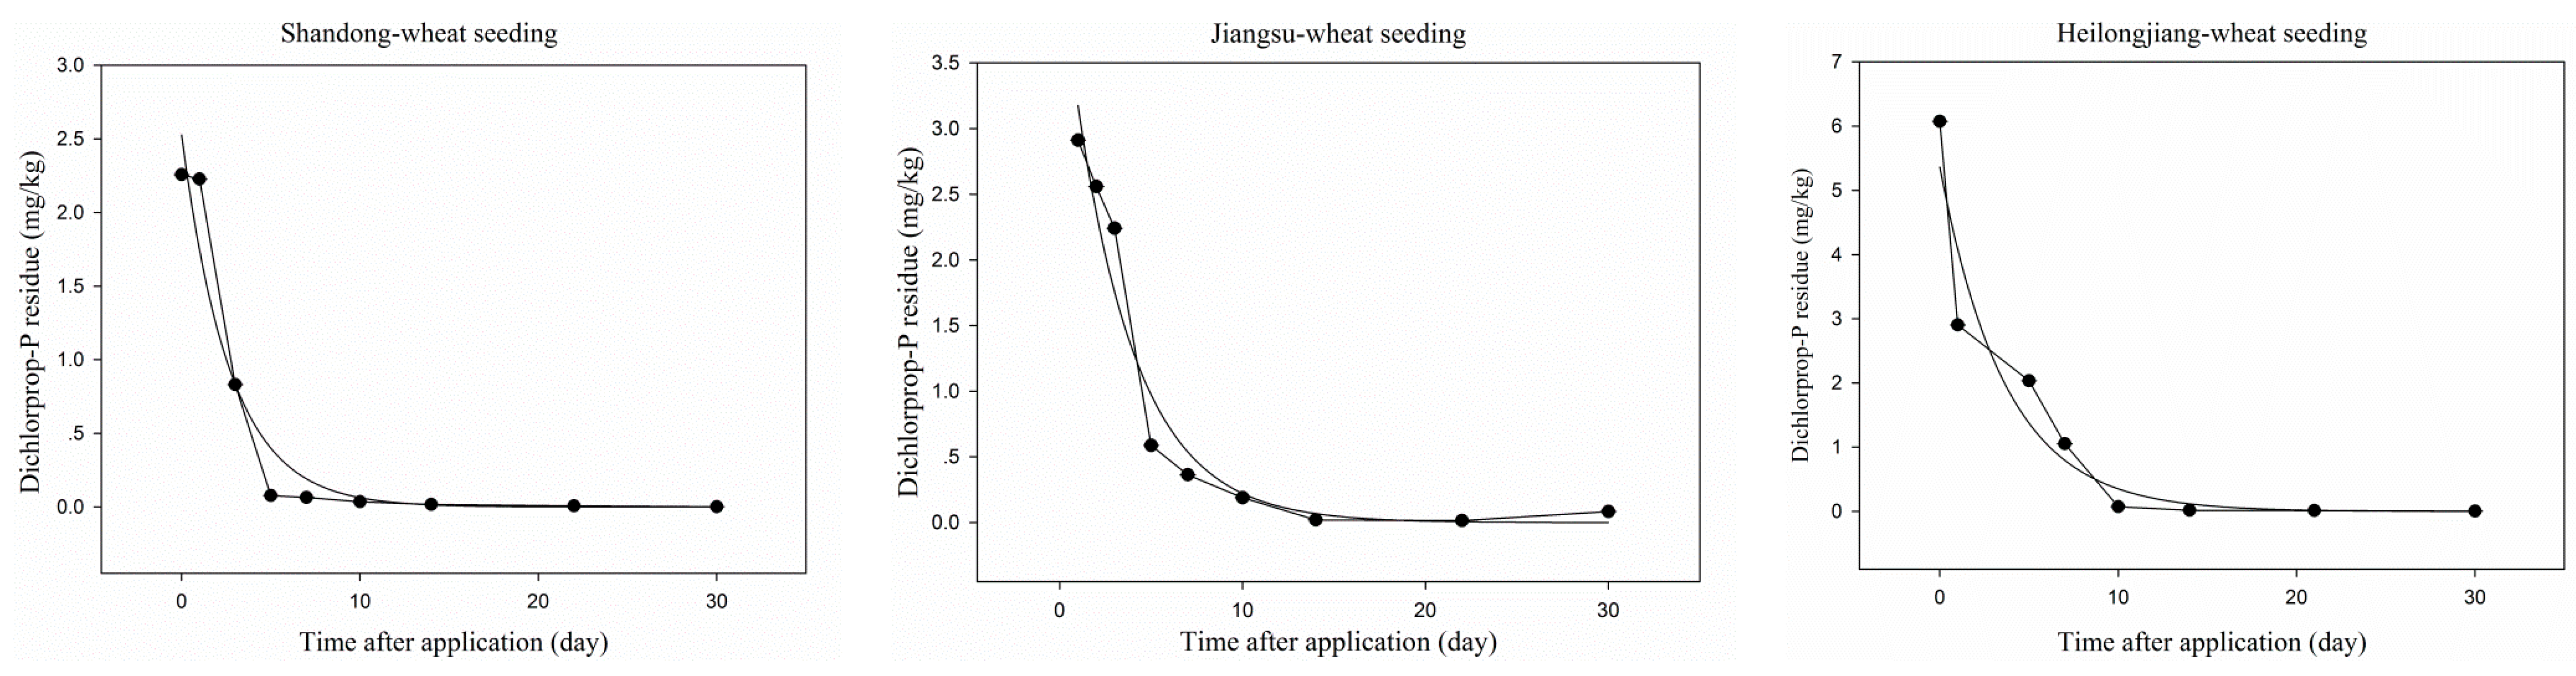
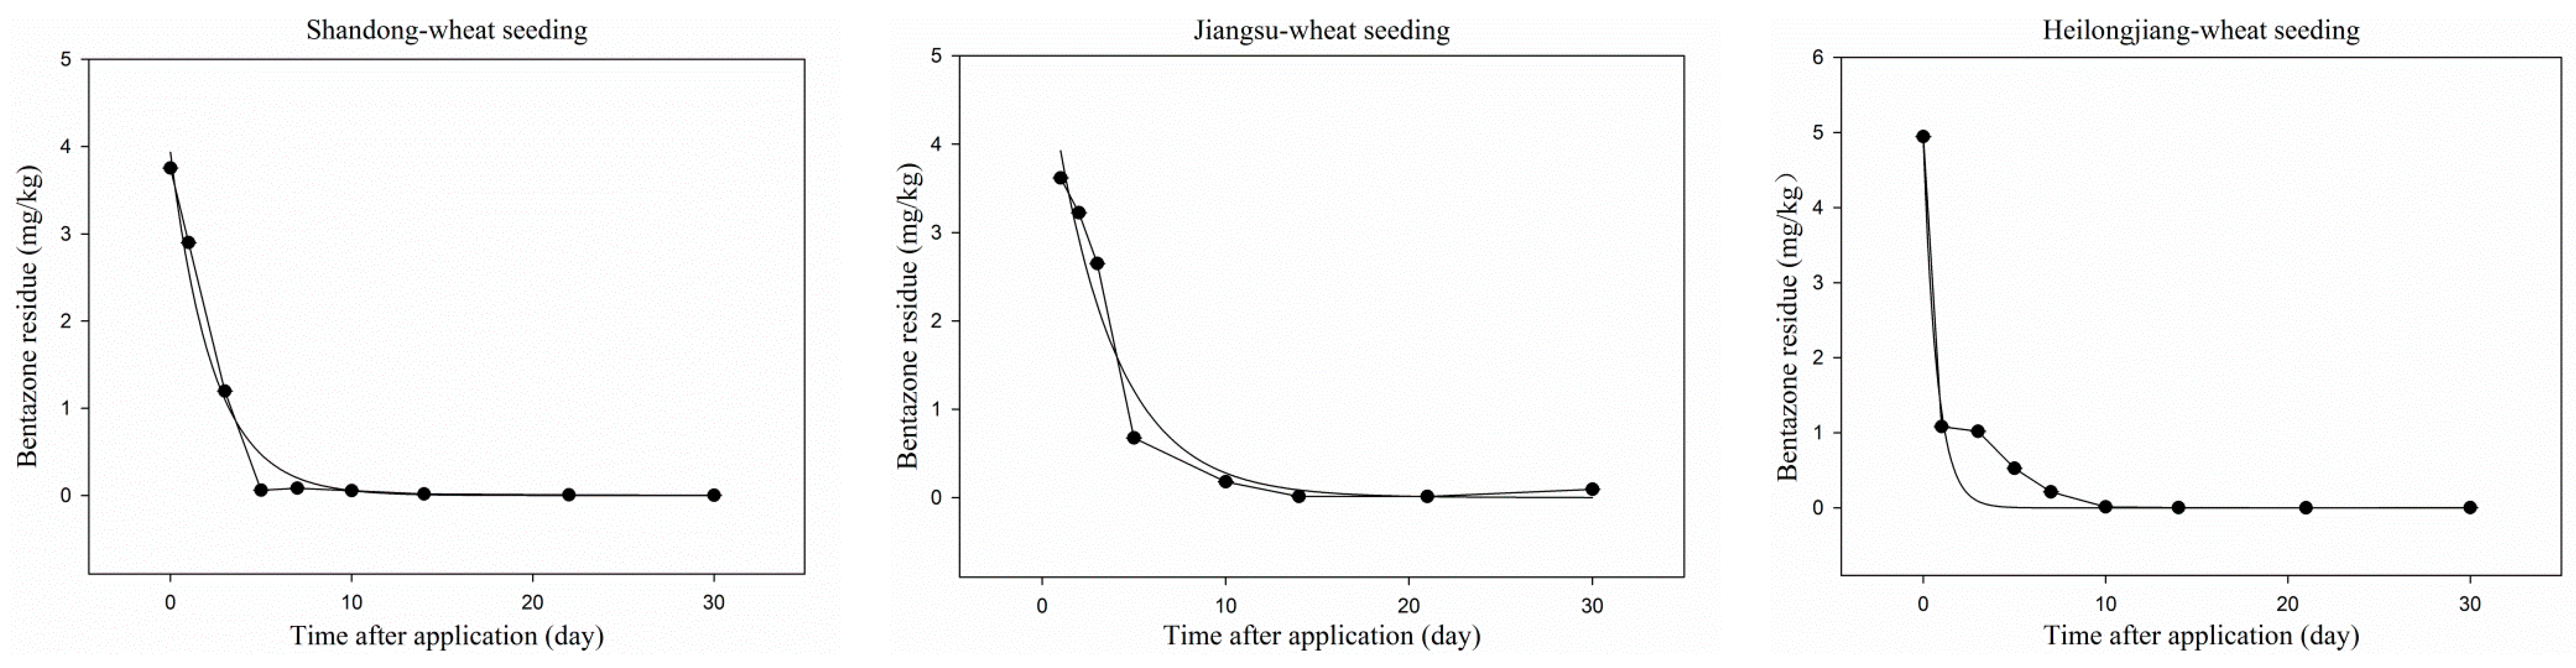
3.4. Dissipation of Dichlorprop-P and Bentazone in Wheat Plants
3.5. Terminal Residue of Four Analytes in Wheat Straw and Grain of Wheat
4. Conclusions
Acknowledgments
Author Contributions
Conflicts of Interest
References
- He, J.; Shen, Y.; Wang, D.; Sun, X.; Fan, M.; Liu, X. Dissipation and residues of 2,4-d-dimethylammonium in wheat and soil. Bull. Environ. Contam. Toxicol. 2010, 85, 157–159. [Google Scholar]
- Tu, H. Development in research and controlling of weeds in fields of China. Nongyao 2001, 40, 1–3. [Google Scholar]
- Ma, S.Y.; Kim, S.W.; Chun, J.C. Antagonistic mode of action of fenoxaprop-p-ethyl phytotoxicity with bentazon. Korean J. Weed Sci. 1998, 18, 161–170. [Google Scholar]
- Food and Agriculture Organization of the United Nations. Aviliable online: http://www.fao.org/fileadmin/templates/agphome/documents/Pests_Pesticides/JMPR/Reports_1991-2006/REPORT1991.pdf (accessed on 25 September 1991).
- Codex Alimentarius Commission. Avaliable online: ftp://ftp.fao.org/codex/meetings/CCPR/CCPR46/pr46_02e.pdf (accessecd on 10 May 2014).
- EU Pesticides Database. Aviliable online: http://ec.europa.eu/food/plant/pesticides/eu-pesticides-database/public/?event=pesticide.residue.CurrentMRL&language=EN (accessed on 7 April 2016).
- China Pesticide Information Network. Aviliable online: http://202.127.42.84/tbt-sps/mrlsdb/queryMrlsdb.do (accessed on 25 May 2012).
- Pulgarín, J.A.M.; Bermejo, L.F.G.; Rodríguez, S.B. Direct determination of dichlorprop in commercial formulations, tomato and fruit samples using photochemically induced fluorescence. Food Anal. Methods 2015, 8, 1–9. [Google Scholar] [CrossRef]
- You, X.; Liang, L.; Liu, F. Dissipation and residues of clethodim and its oxidation metabolites in a rape-field ecosystem using QuEChERS and liquid chromatography/tandem mass spectrometry. Food Chem. 2014, 143, 170–174. [Google Scholar] [CrossRef] [PubMed]
- Sanchis-Mallols, J.M.; Sagrado, S.; Medina-Hernandez, M.J.; Camanas, R.M.V.; Bonet-Domingo, E. Determination of phenoxy acid herbicides in drinking waters by HPLC and solid phase extraction. J. Liq. Chromatogr. Relat. Technol. 1998, 21, 1871–1882. [Google Scholar] [CrossRef]
- Tsipi, D.; Hiskiai, A.; Heberer, T.; Stan, H.-J. Determination of acidic pesticides in the drinking water of Greece using capillary gas chromatography-mass spectrometry. Water Air Soil Pollut. 1998, 104, 259–268. [Google Scholar] [CrossRef]
- Vink, M.; van der Poll, J.M. Gas chromatographic determination of acid herbicides in surface water samples with electron-capture detection and mass spectrometric confirmation. J. Chromatogr. A 1996, 733, 361–366. [Google Scholar] [CrossRef]
- Meng, C.-K.; Werner, S.L.; Furlong, E.T. Determination of pesticide residue in water under positive and negative ion mode by solid-phase extraction and LC/MS/MS. Huanjing Huaxue 2008, 27, 127–130. [Google Scholar]
- Thorstensen, C.W.; Lode, O.; Christiansen, A.L. Development of a solid-phase extraction method for phenoxy acids and bentazone in water and comparison to a liquid-liquid extraction method. J. Agric. Food Chem. 2000, 48, 5829–5833. [Google Scholar] [CrossRef] [PubMed]
- Nishina, T.; Murakawa, H.; Fukushima, K.; Tobino, T. Pesticide residue monitoring method in agricultural products with GC/MS and LC/MS/MS. Ann. Rep. Kumamoto Prefect. Inst. Public Health Environ. Sci. 2006, 35, 78–85. [Google Scholar]
- Paul, N.T.; Mark, D.S.; John, N.L. Supercritical fluid extraction of acidic herbicides from sediment. Int. J. Environ. Anal. Chem. 1998, 69, 141–155. [Google Scholar]
- Jin, H.; Wang, Y.; Lan, J.; Ma, S. Determination of 192 pesticides in Flos Lonicerae by gas chromatography-mass spectrometry. Chin. Pharm. J. 2012, 47, 613–619. [Google Scholar]
- Zhang, L.; Gui, J.-Y.; Zhang, Y.-T.; Zuo, H.-Y.; Li, X.-Y.; Zhang, G.-Q. GC-MS determination of acidic herbicides in water with prederivatization. Physic. Test. Chem. Anal. 2011, 47, 8–11. [Google Scholar]
- Reddersen, K.; Heberer, T. Multi-compound methods for the detection of pharmaceutical residues in various waters applying solid phase extraction (SPE) and gas chromatography with mass spectrometric (GC-MS) detection. J. Sep. Sci. 2003, 26, 1443–1450. [Google Scholar] [CrossRef]
- Yan, H.; Huang, Z.; Zhang, Y.; Li, Y.; Wang, M. Determination of 29 acidic herbicide residues in tea by gas chromatography-mass spectrometry. SEPU 2009, 27, 288–293. [Google Scholar]
- Dong, Z.; Zhao, S.; Wei, F.; Jiang, J.; Jiang, W.; Xie, B. Determination of herbicide residues in rice by GC-ECD with methylation derivatization. Chin. J. Public Health 2005, 21, 881–882. [Google Scholar]
- Anastassiades, M.; Lehotay, S.J.; Stajnbaher, D.; Schenck, F.J. Fast and easy multiresidue method employing acetonitrile extraction/partitioning and “dispersive solid-phase extraction” for the determination of pesticide residues in produce. J. AOAC Int. 2003, 86, 412–431. [Google Scholar] [PubMed]
- Hou, X.; Han, M.; Dai, X.H.; Yang, X.F.; Yi, S. A multi-residue method for the determination of 124 pesticides in rice by modified QuEChERS extraction and gas chromatography–tandem mass spectrometry. Food Chem. 2013, 138, 1198–1205. [Google Scholar] [CrossRef] [PubMed]
- Guan, W.; Xu, P.; Wang, K.; Song, Y.; Zhang, H. Determination and study on dissipation of 1-naphthylacetic acid in garlic and soil using high performance liquid chromatography–tandem mass spectrometry. Food Chem. Toxicol. 2011, 49, 2869–2874. [Google Scholar] [CrossRef] [PubMed]
- Cunha, S.C.; Lehotay, S.J.; Mastovska, K.; Fernes, J.O.; Beatriz, M.; Oliveira, P.P. Evaluation of the QuEChERS sample preparation approach for the analysis of pesticide residues in olives. J. Sep. Sci. 2007, 30, 620–632. [Google Scholar] [CrossRef] [PubMed]
- Lehotay, S.J.; Mastovská, K.; Yun, S.J. Evaluation of two fast and easy methods for pesticide residue analysis in fatty food matrixes. J. AOAC Int. 2005, 88, 630–638. [Google Scholar] [PubMed]
- Omirou, M.; Vryzas, Z.; Papadopoulou-Mourkidou, E.; Economou, A. Dissipation rates of iprodione and thiacloprid during tomato production in greenhouse. Food Chem. 2009, 116, 499–504. [Google Scholar] [CrossRef]
- Rajib, K.; Gita, K. Persistence, metabolism and safety evaluation of thiamethoxam in tomato crop. Pest Manag. Sci. 2009, 65, 931–937. [Google Scholar]
- Lu, Q.; Chen, L.; Lu, M. Extraction and analysis of auxins in plants using dispersive liquid-liquid microextraction followed by high-performance liquid chromatography with fluorescence detection. J. Agric. Food Chem. 2010, 58, 2763–2770. [Google Scholar] [CrossRef] [PubMed]
- Walorczyk, S. Validation and use of a QuEChERS-based gas chromatographic–tandem mass spectrometric method for multiresidue pesticide analysis in blackcurrants including studies of matrix effects and estimation of measurement uncertainty. Talanta 2014, 120, 106–113. [Google Scholar] [CrossRef] [PubMed]
- Ferrer, I.; Thurman, E.M. Multi-residue method for the analysis of 101 pesticides and their degradates in food and water samples by liquid chromatography/time-of-flight mass spectrometry. J. Chromatogr. A 2008, 1175, 24–37. [Google Scholar] [CrossRef] [PubMed]
- Jian, P.; Xia, X.X.; Liang, J. Analysis of pesticide multi-residues in leafy vegetables by ultrasonic solvent extraction and liquid chromatography-tandem mass spectrometry. Ultrason. Sonochem. 2008, 15, 25–32. [Google Scholar]
- Sack, C.; Vonderbrink, J.; Smoker, M.; Smith, R.E. Determination of acid herbicides using modified quechers with fast switching ESI+/ESI−LC-MS/MS. J. Agric. Food Chem. 2015, 63, 9657–9665. [Google Scholar] [CrossRef] [PubMed]
- Shida, S.S.; Nemoto, S.; Matsuda, R. Simultaneous determination of acidic pesticides in vegetables and fruits by liquid chromatography–tandem mass spectrometry. J. Environ. Sci. Health B 2015, 50, 151–162. [Google Scholar] [CrossRef] [PubMed]
- Koesukwiwat, U.; Sanguankaew, K.; Leepipatpiboon, N. Rapid determination of phenoxy acid residues in rice by modified quechers extraction and liquid chromatography–tandem mass spectrometry. Anal. Chim. Acta 2008, 626, 10–20. [Google Scholar] [CrossRef] [PubMed]
- Santilio, A.; Stefanelli, P.; Girolimetti, S.; Dommarco, R. Determination of acidic herbicides in cereals by quechers extraction and LC/MS/MS. J. Environ. Sci. Health B 2011, 46, 535–543. [Google Scholar] [PubMed]
- Lehotay, S.J. Determination of pesticide residues in foods by acetonitrile extraction and partitioning with magnesium sulfate: Collaborative study. J. AOAC Int. 2007, 90, 485–520. [Google Scholar] [PubMed]
- Ferrer, C.; Martínez-Bueno, M.J.; Lozano, A.; Fernández-Alba, A.R. Pesticide residue analysis of fruit juices by LC-MS/MS direct injection. One year pilot survey. Talanta 2011, 83, 1552–1561. [Google Scholar] [CrossRef] [PubMed]
- European Commission. Guidance Document on Analytical Quality Control and Method Validation Procedures for Pesticides Residues Analysis in Food and Feed. Aviliable online: http://ec.europa.eu/food/plant/docs/plant_pesticides_mrl_guidelines_wrkdoc_11945_en.pdf (accessed on 1 December 2015).


| Treatments | Dosage of Application (g a.i./ha) | Times of Application | Experiments | Days after the Last Application | |
|---|---|---|---|---|---|
| Serial number | Areas (m2) | ||||
| 1 | 30 × 3 | 2547 | 1 | Grains of wheat/wheat straw residue | Harvest |
| 2 | 30 × 3 | 3280.5 | 1 | Grains of wheat/wheat straw residue | Harvest |
| 3 | 30 × 3 | 3280.5 | 1 | Dissipation in wheat plants | 2 h, 1 day, 2 days, 3 days, 5 days, 7 days, 10 days, 14 days, 21 days, 30 days |
| 4 | 30 | 0 | - | Control treatment | Before harvest and harvest |
| Compound | tR (min) | High-Performance Liquid Chromatography Coupled with Tandem Mass Spectrometry (HPLC-MS/MS) | ||||
|---|---|---|---|---|---|---|
| Quantification Ion Transition | Collision Energy (V) | Confirmatory Ion Transition | Collision Energy (V) | Fragmentor (V) | ||
| Dichlorprop-P | 0.74 | 233.1–161.1 | 5 | 233.1–125.2 | 25 | 70 |
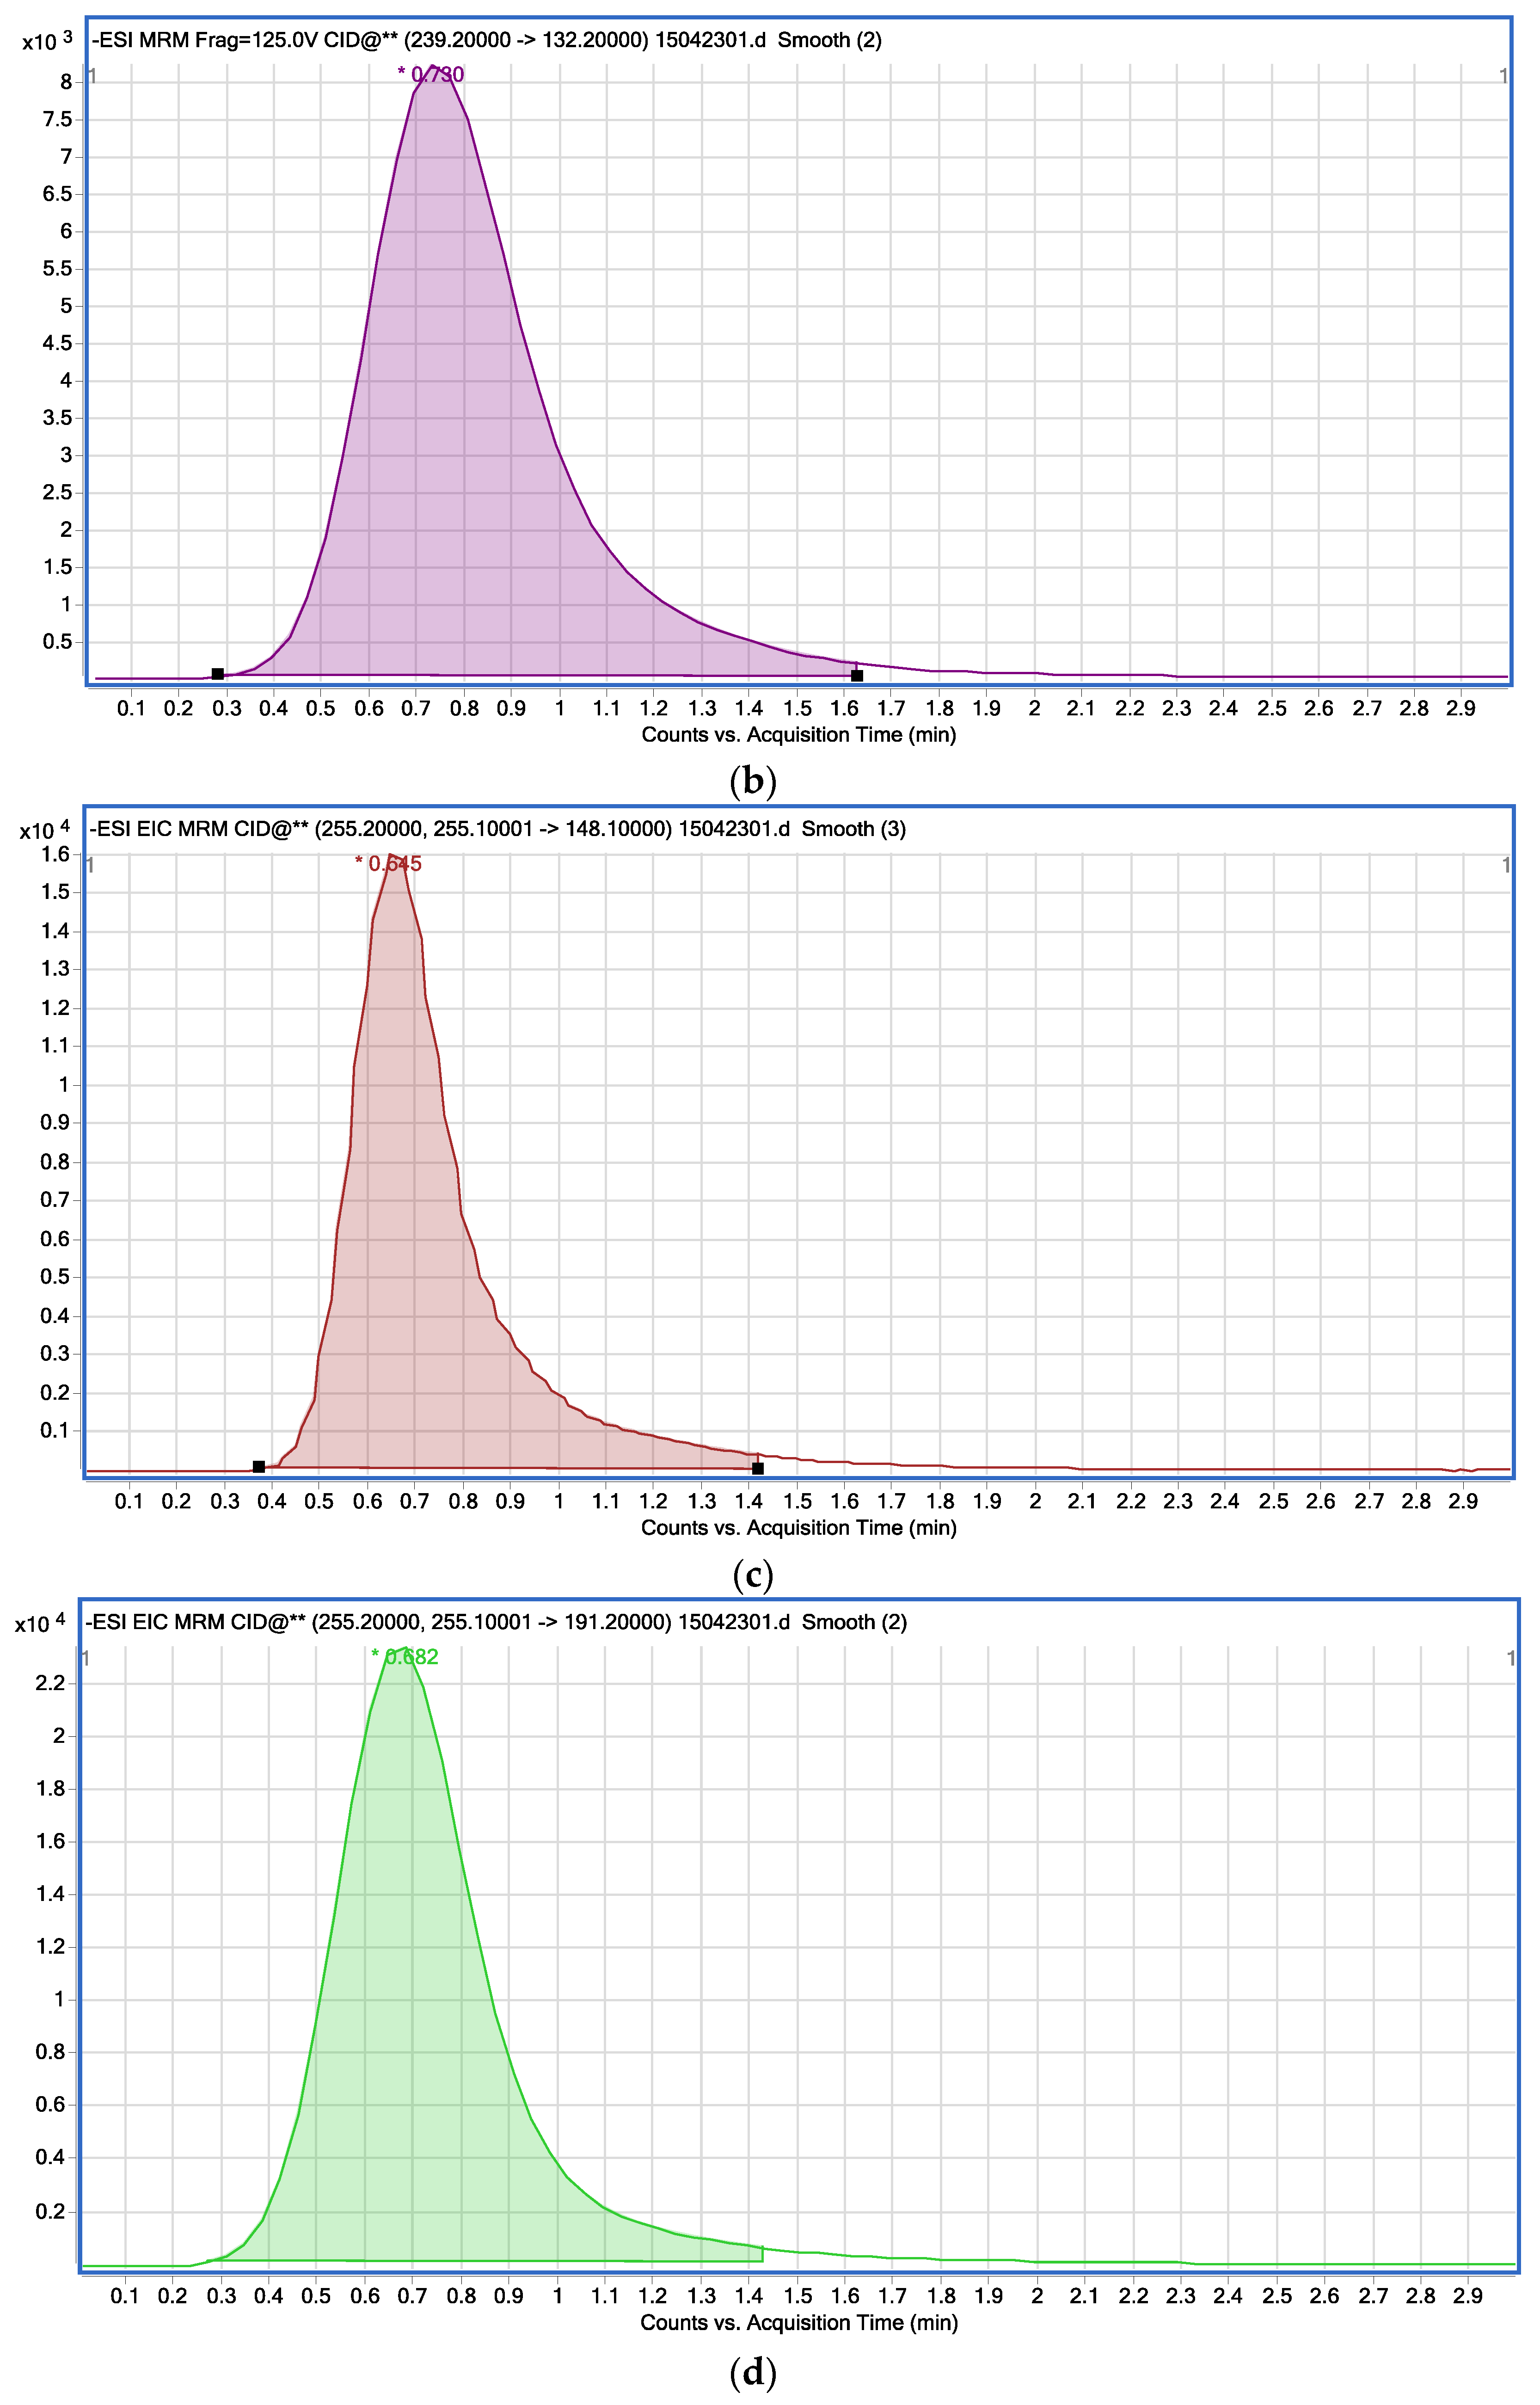
| Bentazone | 0.70 | 239.2–132.2 | 20 | 239.2–197.1 | 15 | 125 |
| 239.2–175.2 | 15 | |||||
| 6-hydroxy-bentazone | 0.64 | 255.2–148.1 | 20 | 255.2–213.2 | 15 | 130 |
| 255.2–121.1 | 25 | |||||
| 8-hydroxy-bentazone | 0.65 | 255.1–191.2 | 10 | 255.1–148.1 | 20 | 120 |
| 255.1–106.2 | 20 | |||||
| Compound | Matrix | Matrix-Matched Calibration Curve | R2 | LOD (μg/kg) | LOQ (μg/kg) |
|---|---|---|---|---|---|
| Dichlorprop-P | Grains of wheat | Y = 30939X − 1515.9 | 0.9911 | 2 | 7 |
| Wheat plants | Y = 32278X−486.86 | 0.9995 | 4 | 12 | |
| Wheat straw | Y = 23968X + 196.11 | 0.9999 | 2 | 7 | |
| Bentazone | Grains of wheat | Y = 89621X − 1369.4 | 0.9959 | 1 | 3 |
| Wheat plants | Y = 77068X + 12.216 | 0.9997 | 3 | 9 | |
| Wheat straw | Y = 48882X − 95.561 | 0.9995 | 3 | 9 | |
| 6-hydroxy-bentazone | Grains of wheat | Y = 150628X − 731.53 | 0.9989 | 2 | 7 |
| Wheat plants | Y = 144706X − 80.588 | 0.9998 | 1 | 3 | |
| Wheat straw | Y = 124585X − 178.16 | 0.9999 | 0.8 | 2.5 | |
| 8-hydroxy-bentazone | Grains of wheat | Y = 309797X + 853.47 | 0.9996 | 2 | 6 |
| Wheat plants | Y = 360626X − 477.38 | 0.9995 | 3 | 9 | |
| Wheat straw | Y = 264981X − 168.88 | 0.9996 | 1 | 4 |
| Compound | Matrix | Fortified Level (mg/kg) | Average Recovery (%) | RSD (%) |
|---|---|---|---|---|
| Dichlorprop-P | Grains of wheat | 0.1 | 85.9 | 7.0 |
| 1 | 85.0 | 5.7 | ||
| 5 | 72.9 | 4.0 | ||
| Wheat plants | 0.1 | 82.0 | 6.3 | |
| 1 | 96.1 | 4.0 | ||
| 5 | 82.9 | 11.4 | ||
| Wheat straw | 0.1 | 107.4 | 8.0 | |
| 1 | 82.1 | 5.1 | ||
| 5 | 98.6 | 2.5 | ||
| Bentazone | Grains of wheat | 0.01 | 84.6 | 7.6 |
| 0.1 | 93.6 | 3.1 | ||
| 0.5 | 76.1 | 1.0 | ||
| Wheat plants | 0.01 | 82.0 | 10.7 | |
| 0.1 | 96.1 | 3.8 | ||
| 0.5 | 82.9 | 3.7 | ||
| Wheat straw | 0.01 | 108.7 | 9.6 | |
| 0.1 | 96.2 | 2.2 | ||
| 0.5 | 87.0 | 3.4 | ||
| 6-hydroxy-bentazone | Grains of wheat | 0.01 | 92.9 | 2.9 |
| 0.1 | 81.4 | 9.2 | ||
| 0.5 | 84.7 | 1.3 | ||
| Wheat plants | 0.01 | 90.8 | 1.4 | |
| 0.1 | 94.0 | 4.3 | ||
| 0.5 | 74.8 | 4.2 | ||
| Wheat straw | 0.01 | 87.5 | 5.8 | |
| 0.1 | 89.7 | 3.3 | ||
| 0.5 | 84.9 | 3.5 | ||
| 8-hydroxy-bentazone | Grains of wheat | 0.01 | 86.8 | 5.4 |
| 0.1 | 88.9 | 7.1 | ||
| 0.5 | 79.5 | 6.3 | ||
| Wheat plants | 0.01 | 85.0 | 7.6 | |
| 0.1 | 95.9 | 4.5 | ||
| 0.5 | 75.2 | 5.7 | ||
| Wheat straw | 0.01 | 107.4 | 8.0 | |
| 0.1 | 82.1 | 5.1 | ||
| 0.5 | 84.5 | 1.6 |
© 2016 by the authors; licensee MDPI, Basel, Switzerland. This article is an open access article distributed under the terms and conditions of the Creative Commons Attribution (CC-BY) license (http://creativecommons.org/licenses/by/4.0/).
Share and Cite
Feng, X.; Yu, J.; Pan, L.; Song, G.; Zhang, H. Dissipation and Residues of Dichlorprop-P and Bentazone in Wheat-Field Ecosystem. Int. J. Environ. Res. Public Health 2016, 13, 534. https://doi.org/10.3390/ijerph13060534
Feng X, Yu J, Pan L, Song G, Zhang H. Dissipation and Residues of Dichlorprop-P and Bentazone in Wheat-Field Ecosystem. International Journal of Environmental Research and Public Health. 2016; 13(6):534. https://doi.org/10.3390/ijerph13060534
Chicago/Turabian StyleFeng, Xiaoxiao, Jianlei Yu, Lixiang Pan, Guochun Song, and Hongyan Zhang. 2016. "Dissipation and Residues of Dichlorprop-P and Bentazone in Wheat-Field Ecosystem" International Journal of Environmental Research and Public Health 13, no. 6: 534. https://doi.org/10.3390/ijerph13060534
APA StyleFeng, X., Yu, J., Pan, L., Song, G., & Zhang, H. (2016). Dissipation and Residues of Dichlorprop-P and Bentazone in Wheat-Field Ecosystem. International Journal of Environmental Research and Public Health, 13(6), 534. https://doi.org/10.3390/ijerph13060534