
Effects of Lane Width, Lane Position and Edge Shoulder Width on Driving Behavior in Underground Urban Expressways: A Driving Simulator Study


Abstract
:1. Introduction
2. Methods
2.1. Participants
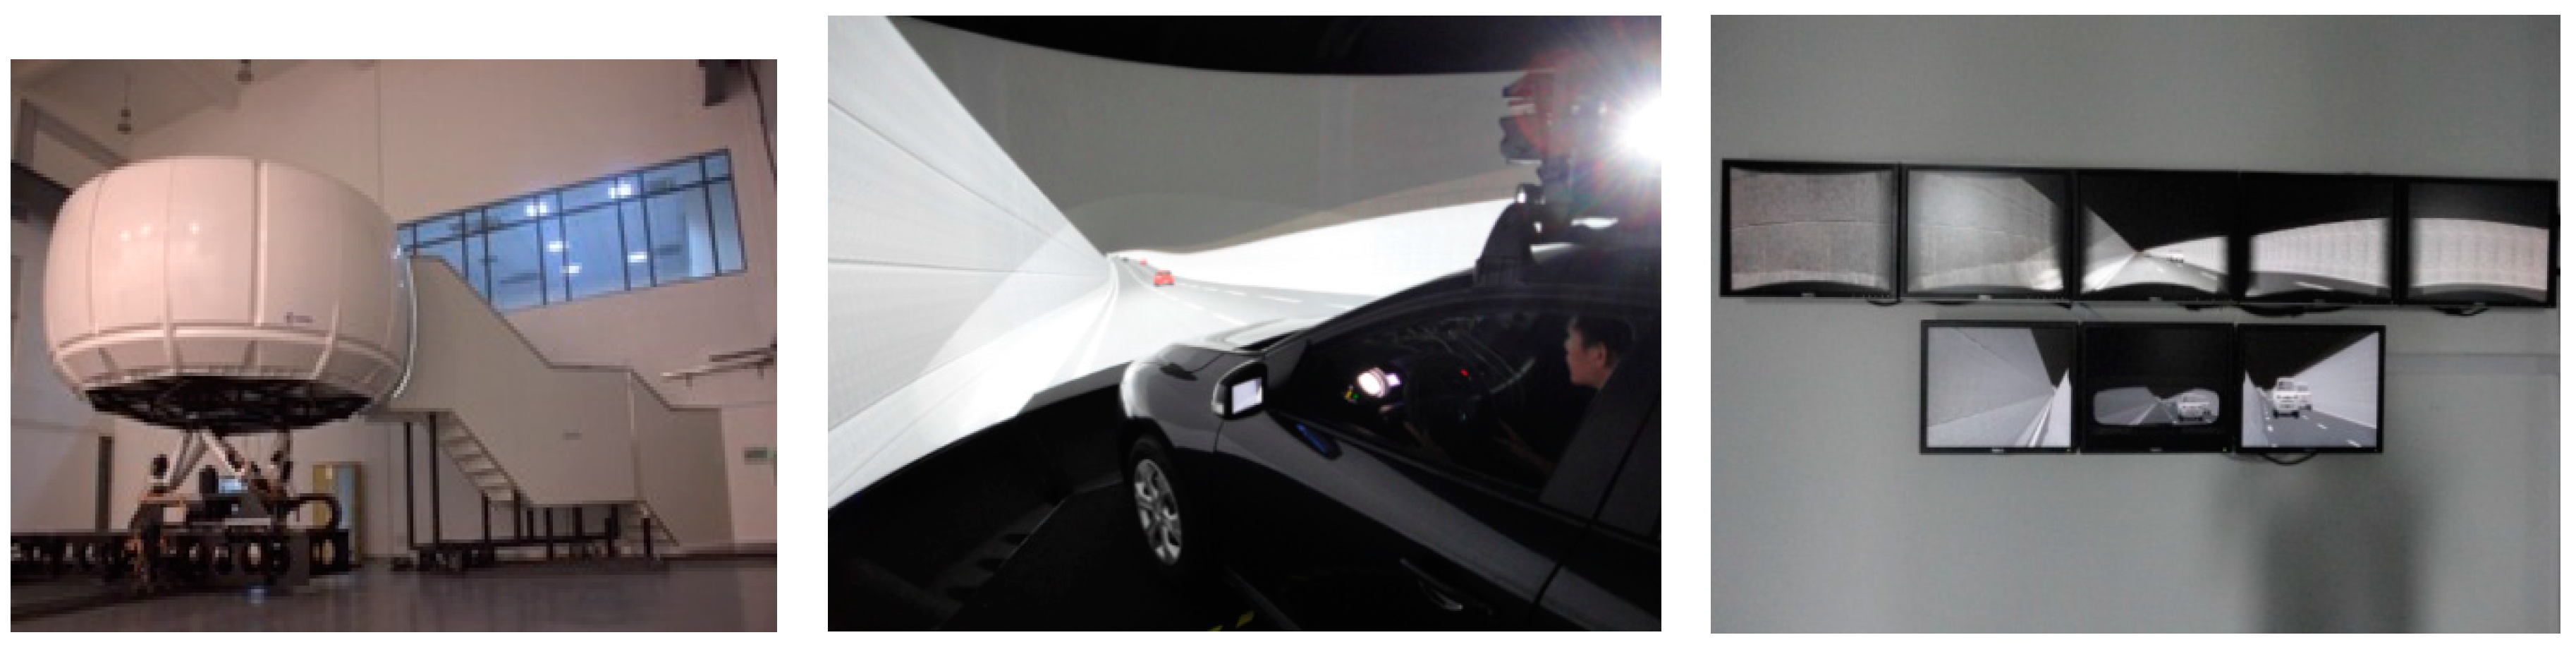
2.2. Apparatus
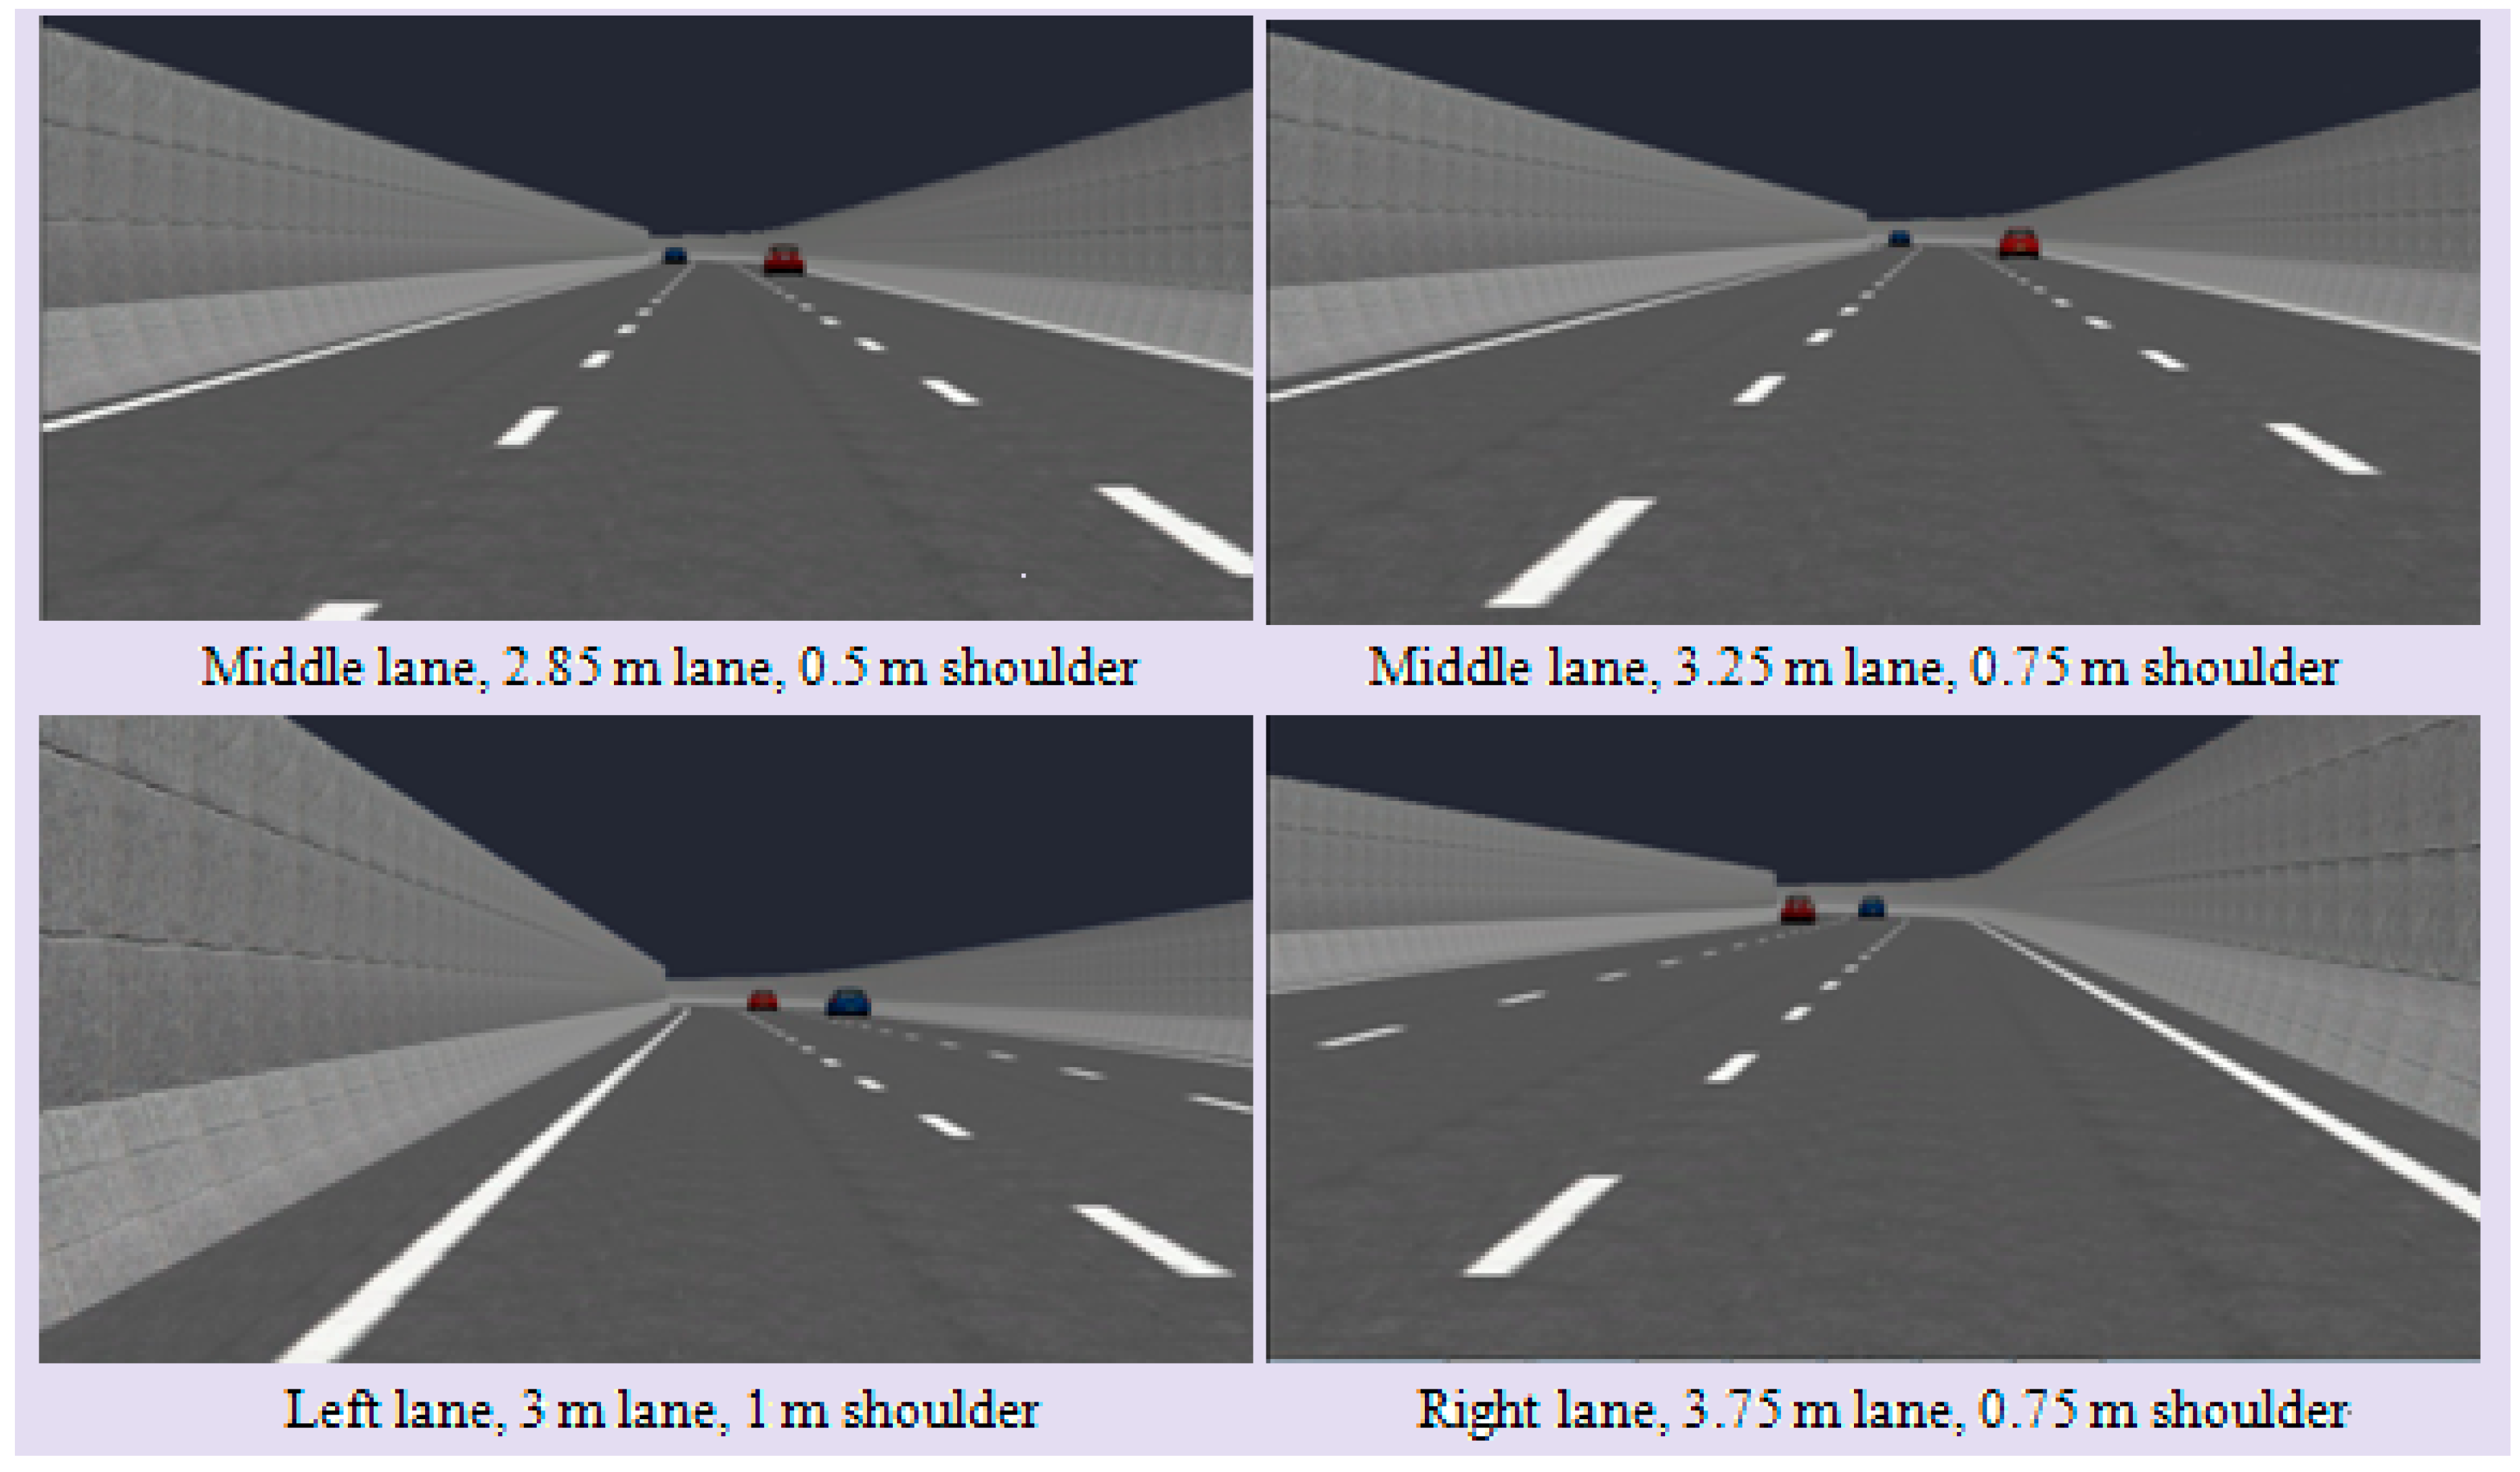
2.3. Variables Studied
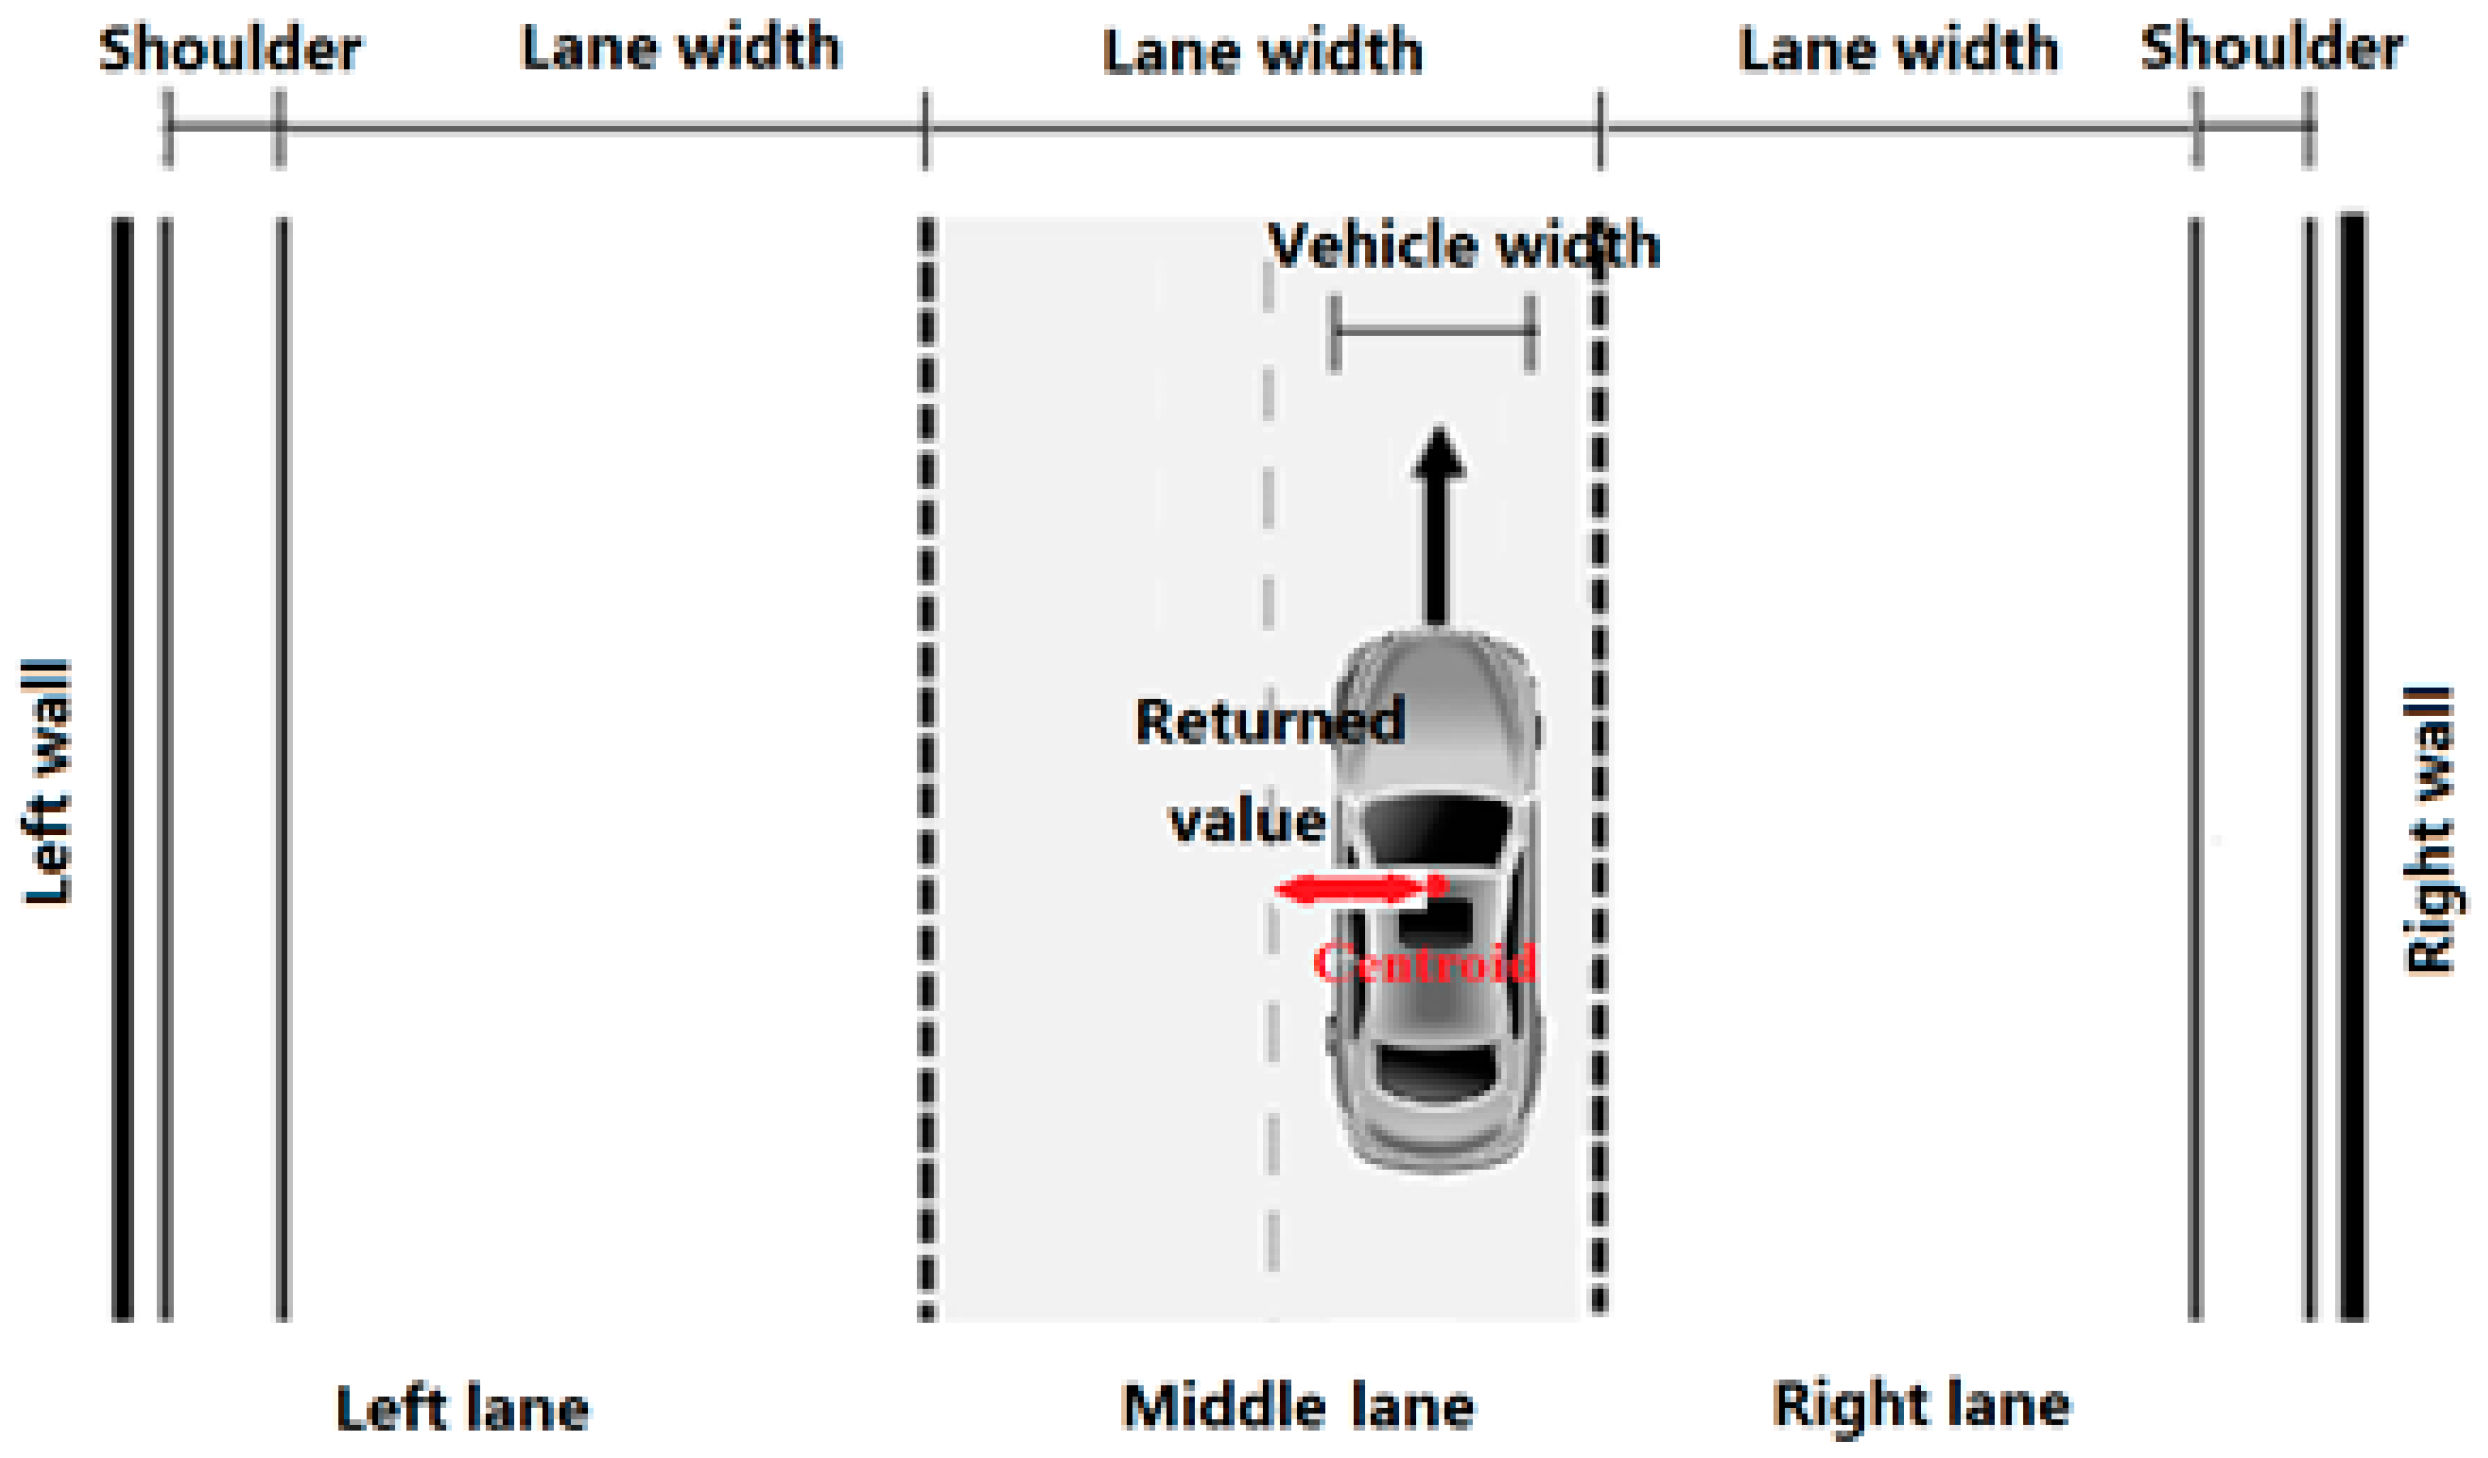
2.4. Data Extraction
2.4.1. Objective Data
2.4.2. Subjective Data
2.5. Experiment Design and Procedure
3. Results and Analysis
3.1. Speed Results
3.1.1. Effect of Lane Width on Speed
3.1.2. Effect of Lane Position on Speed
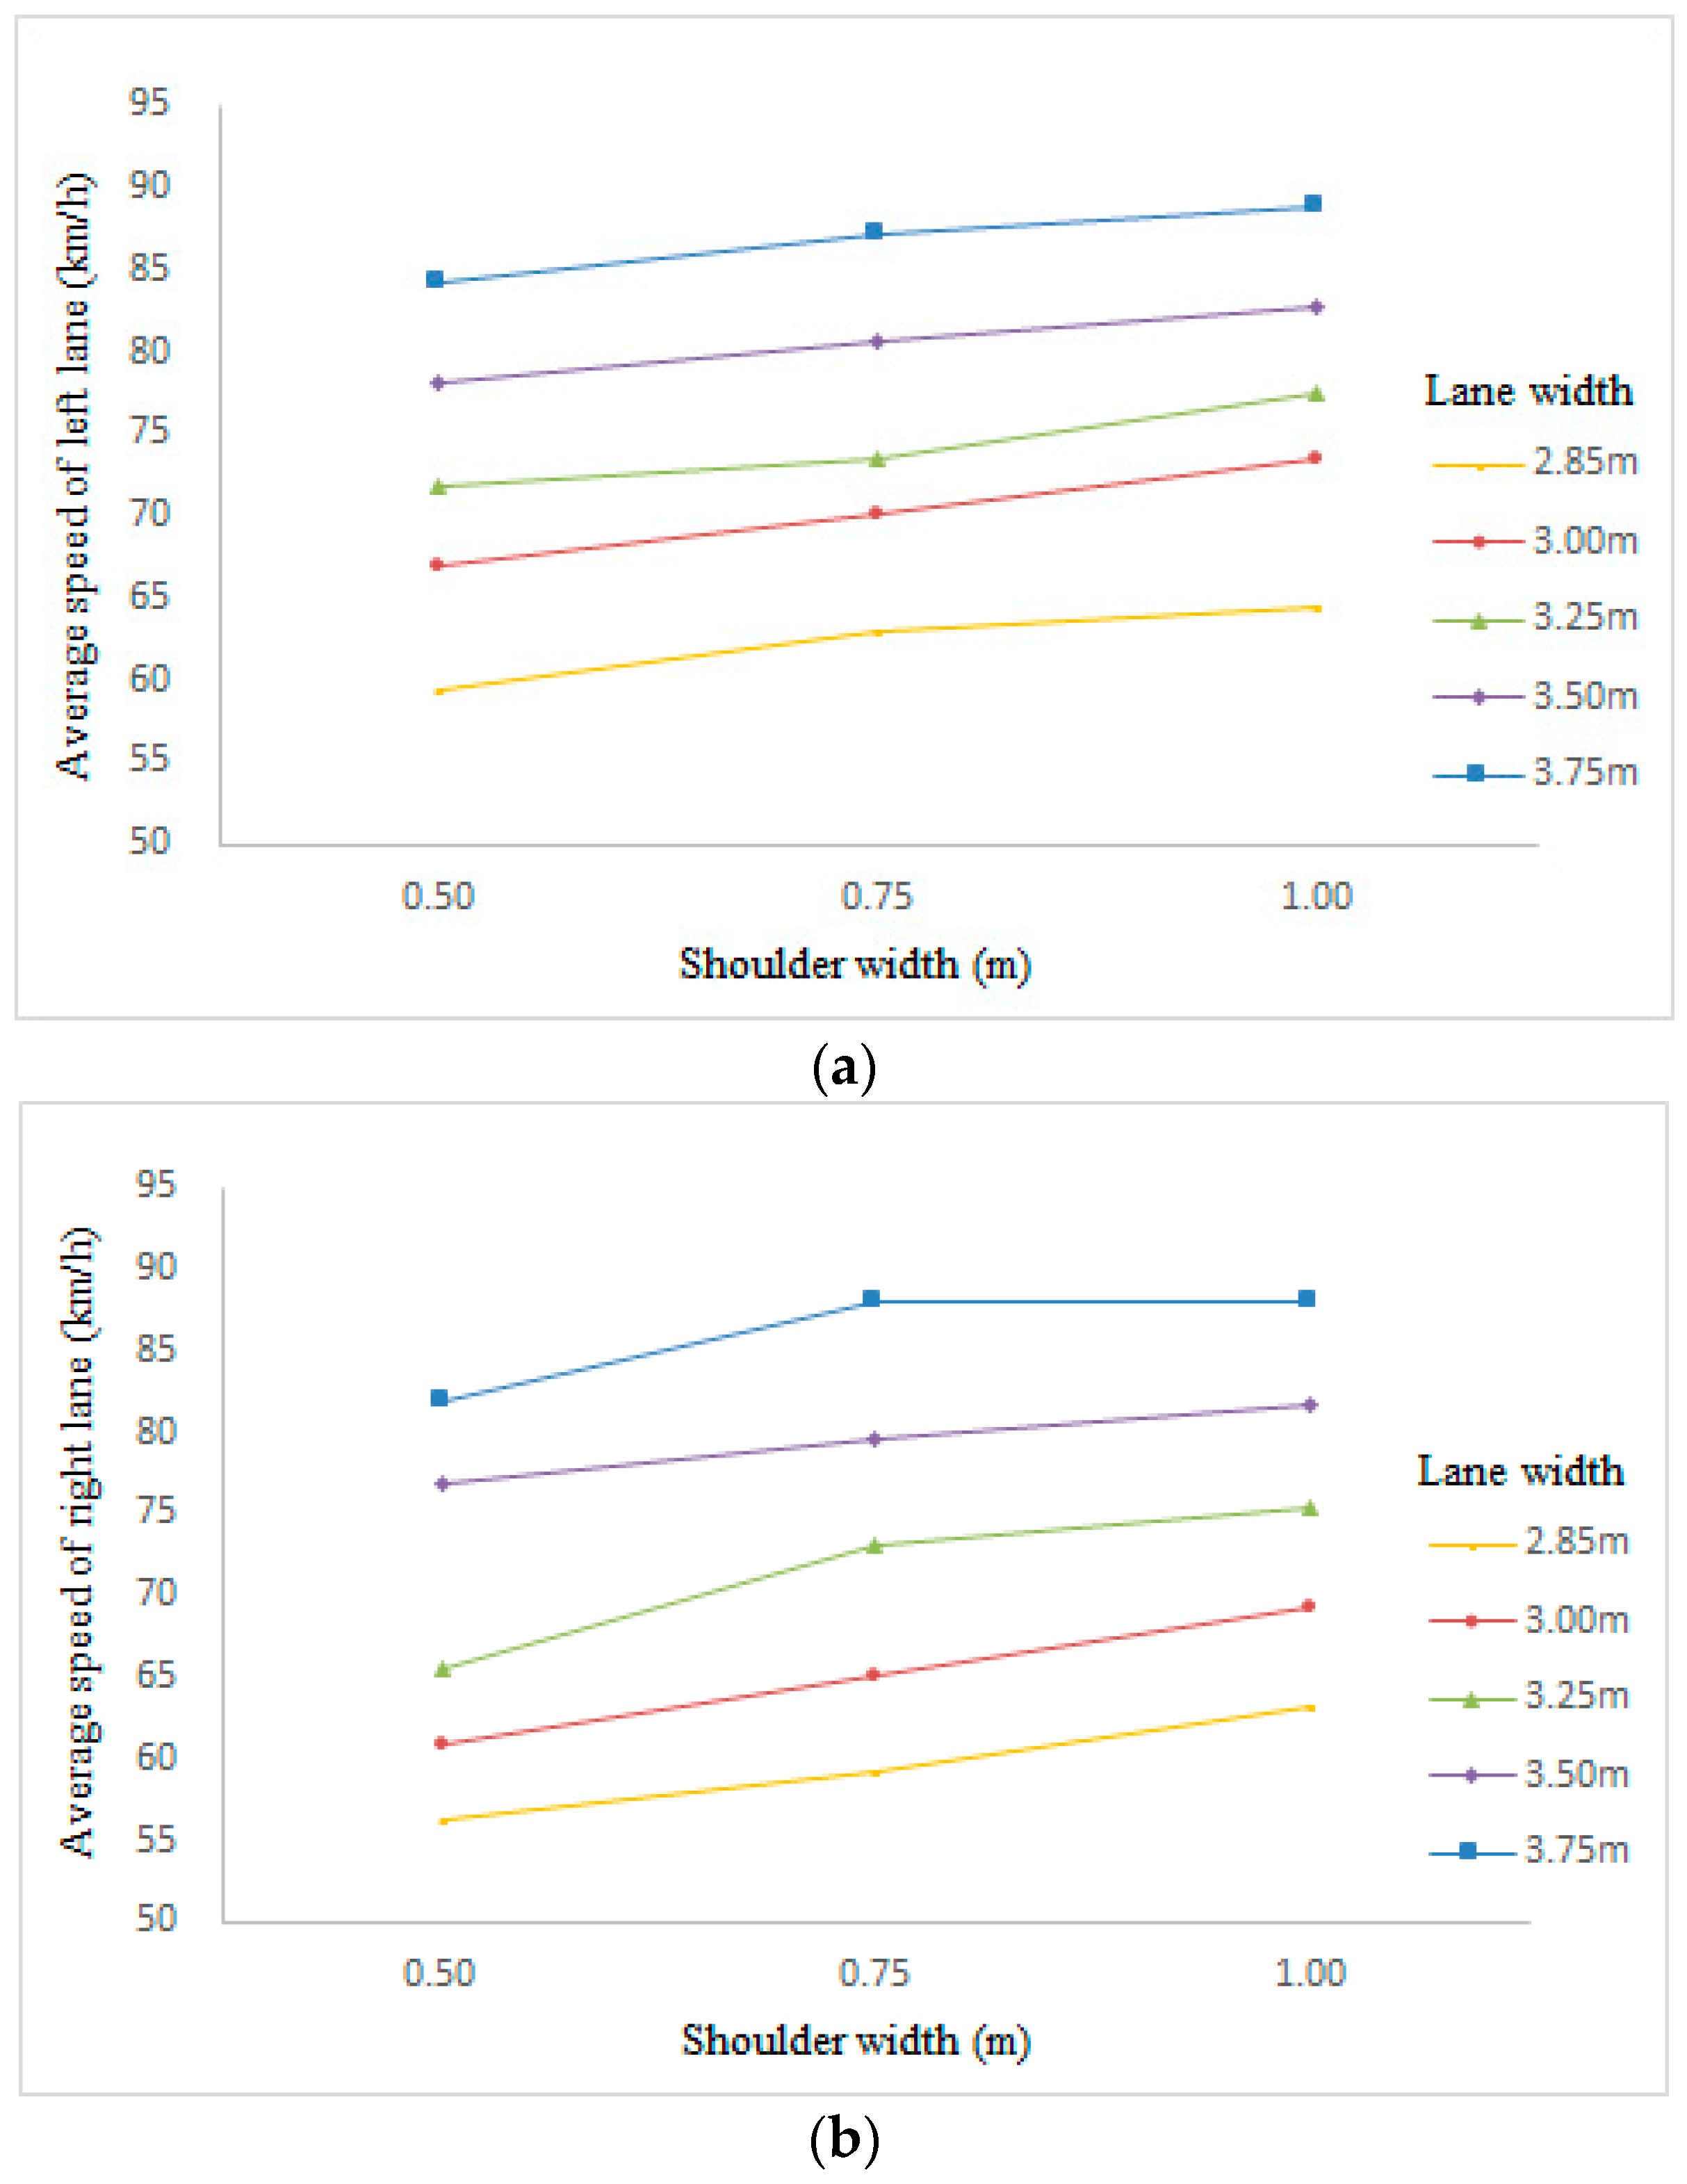
3.1.3. Effect of Shoulder Width on Speed
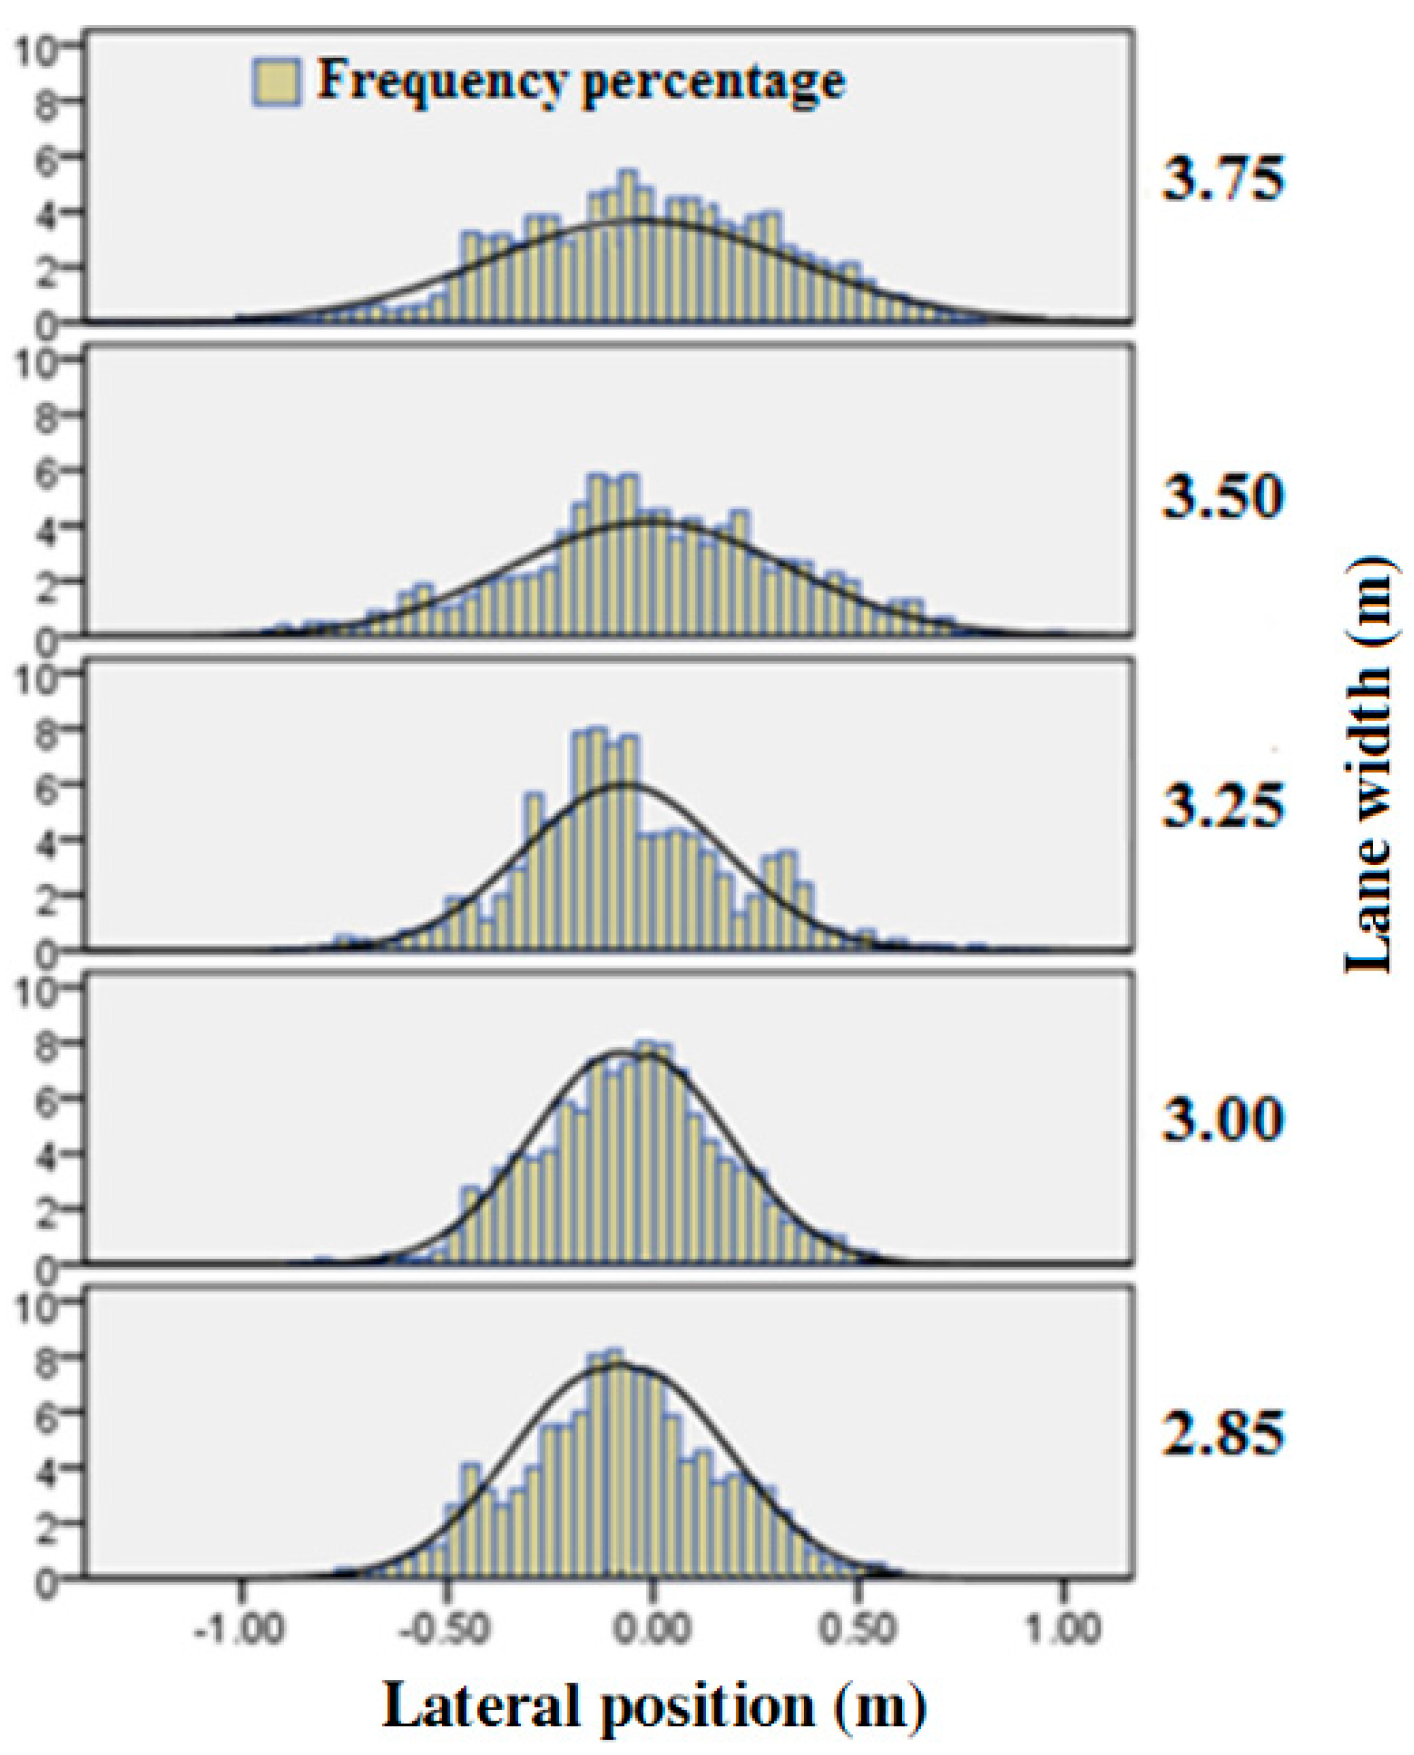
3.2. Lane Deviation Results
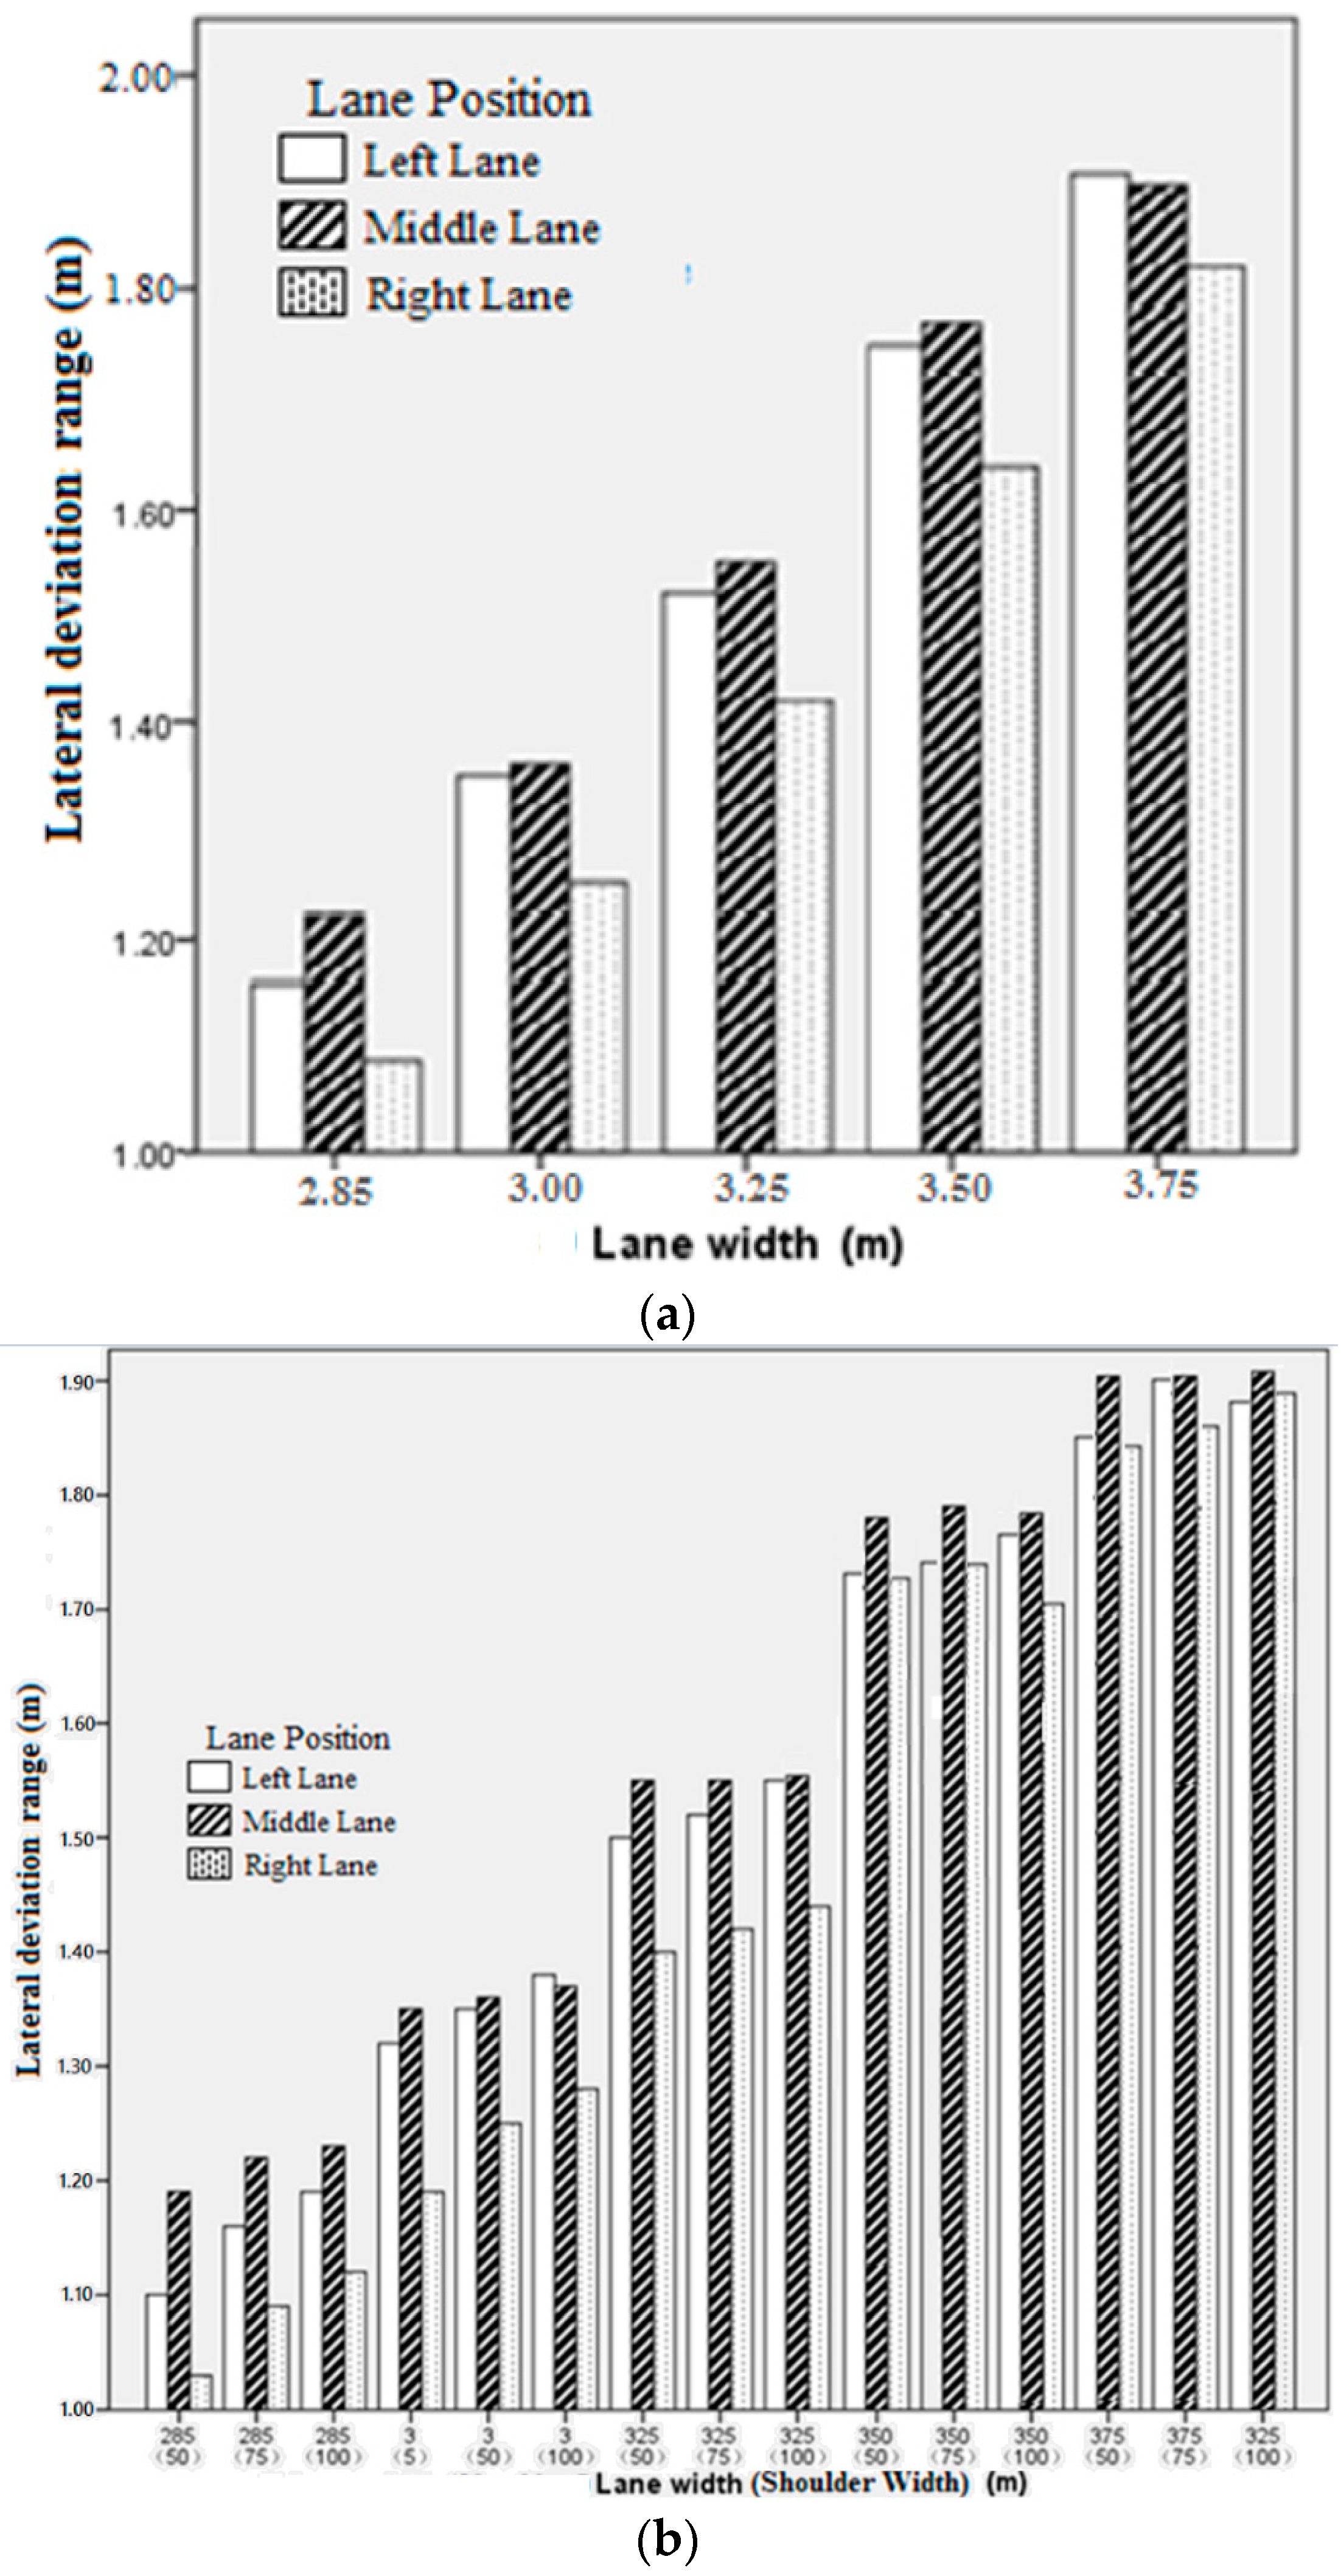
3.2.1. Effect of Lane Width on Lane Deviation
3.2.2. Effect of Lane Position on Lane Deviation
3.2.3. Effect of Shoulder Width on Lane Deviation
3.3. Subjective and Objective Evaluation
3.3.1. Subjective Evaluation
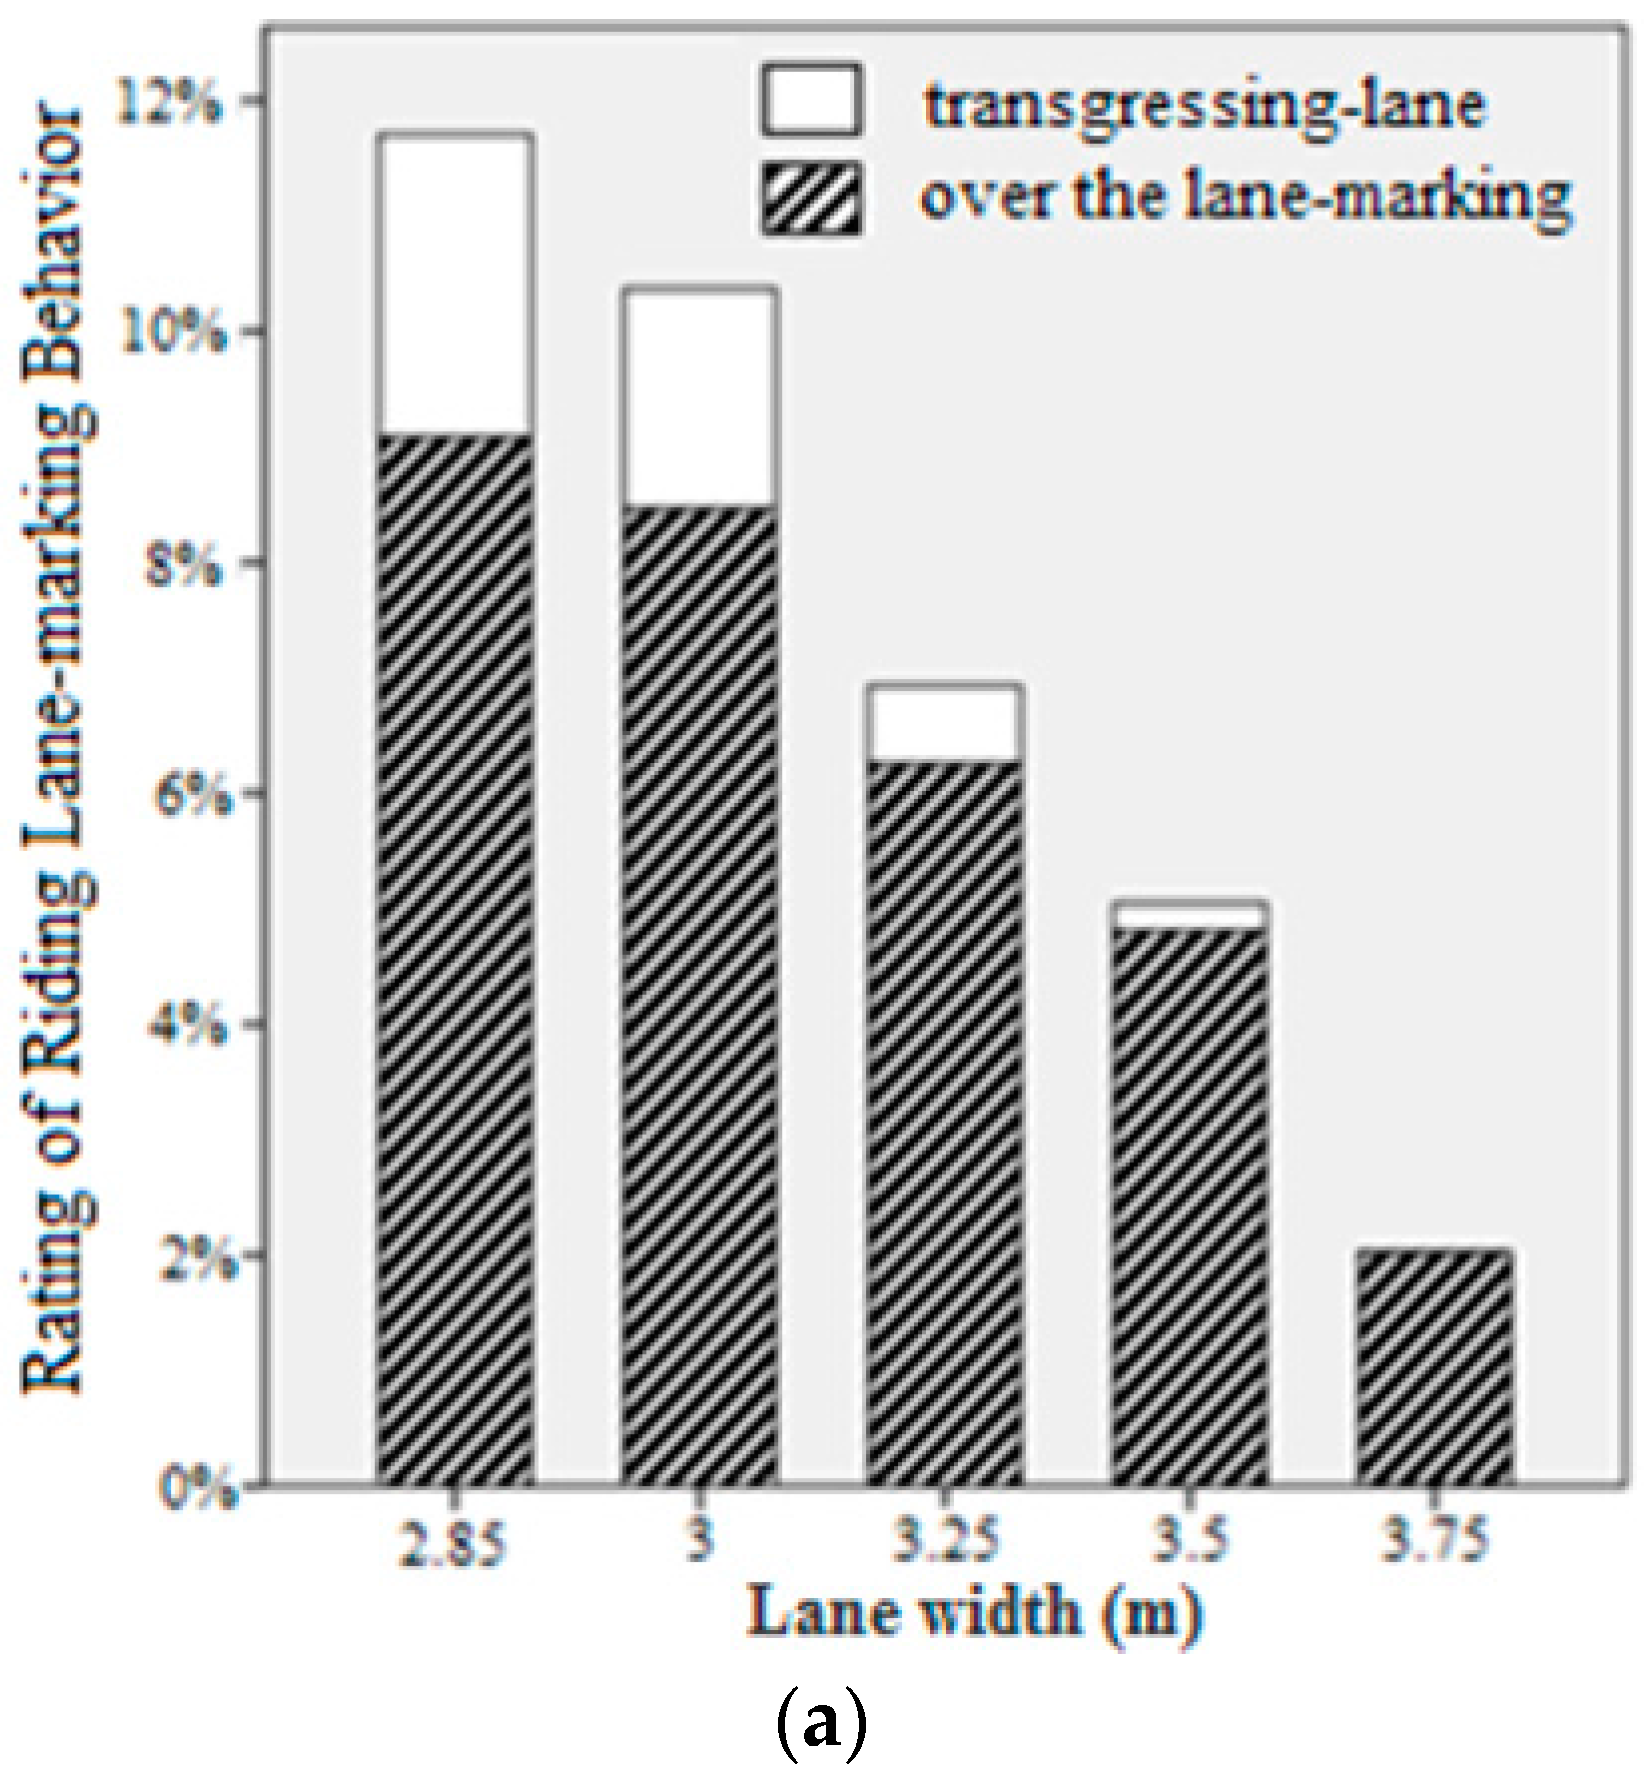
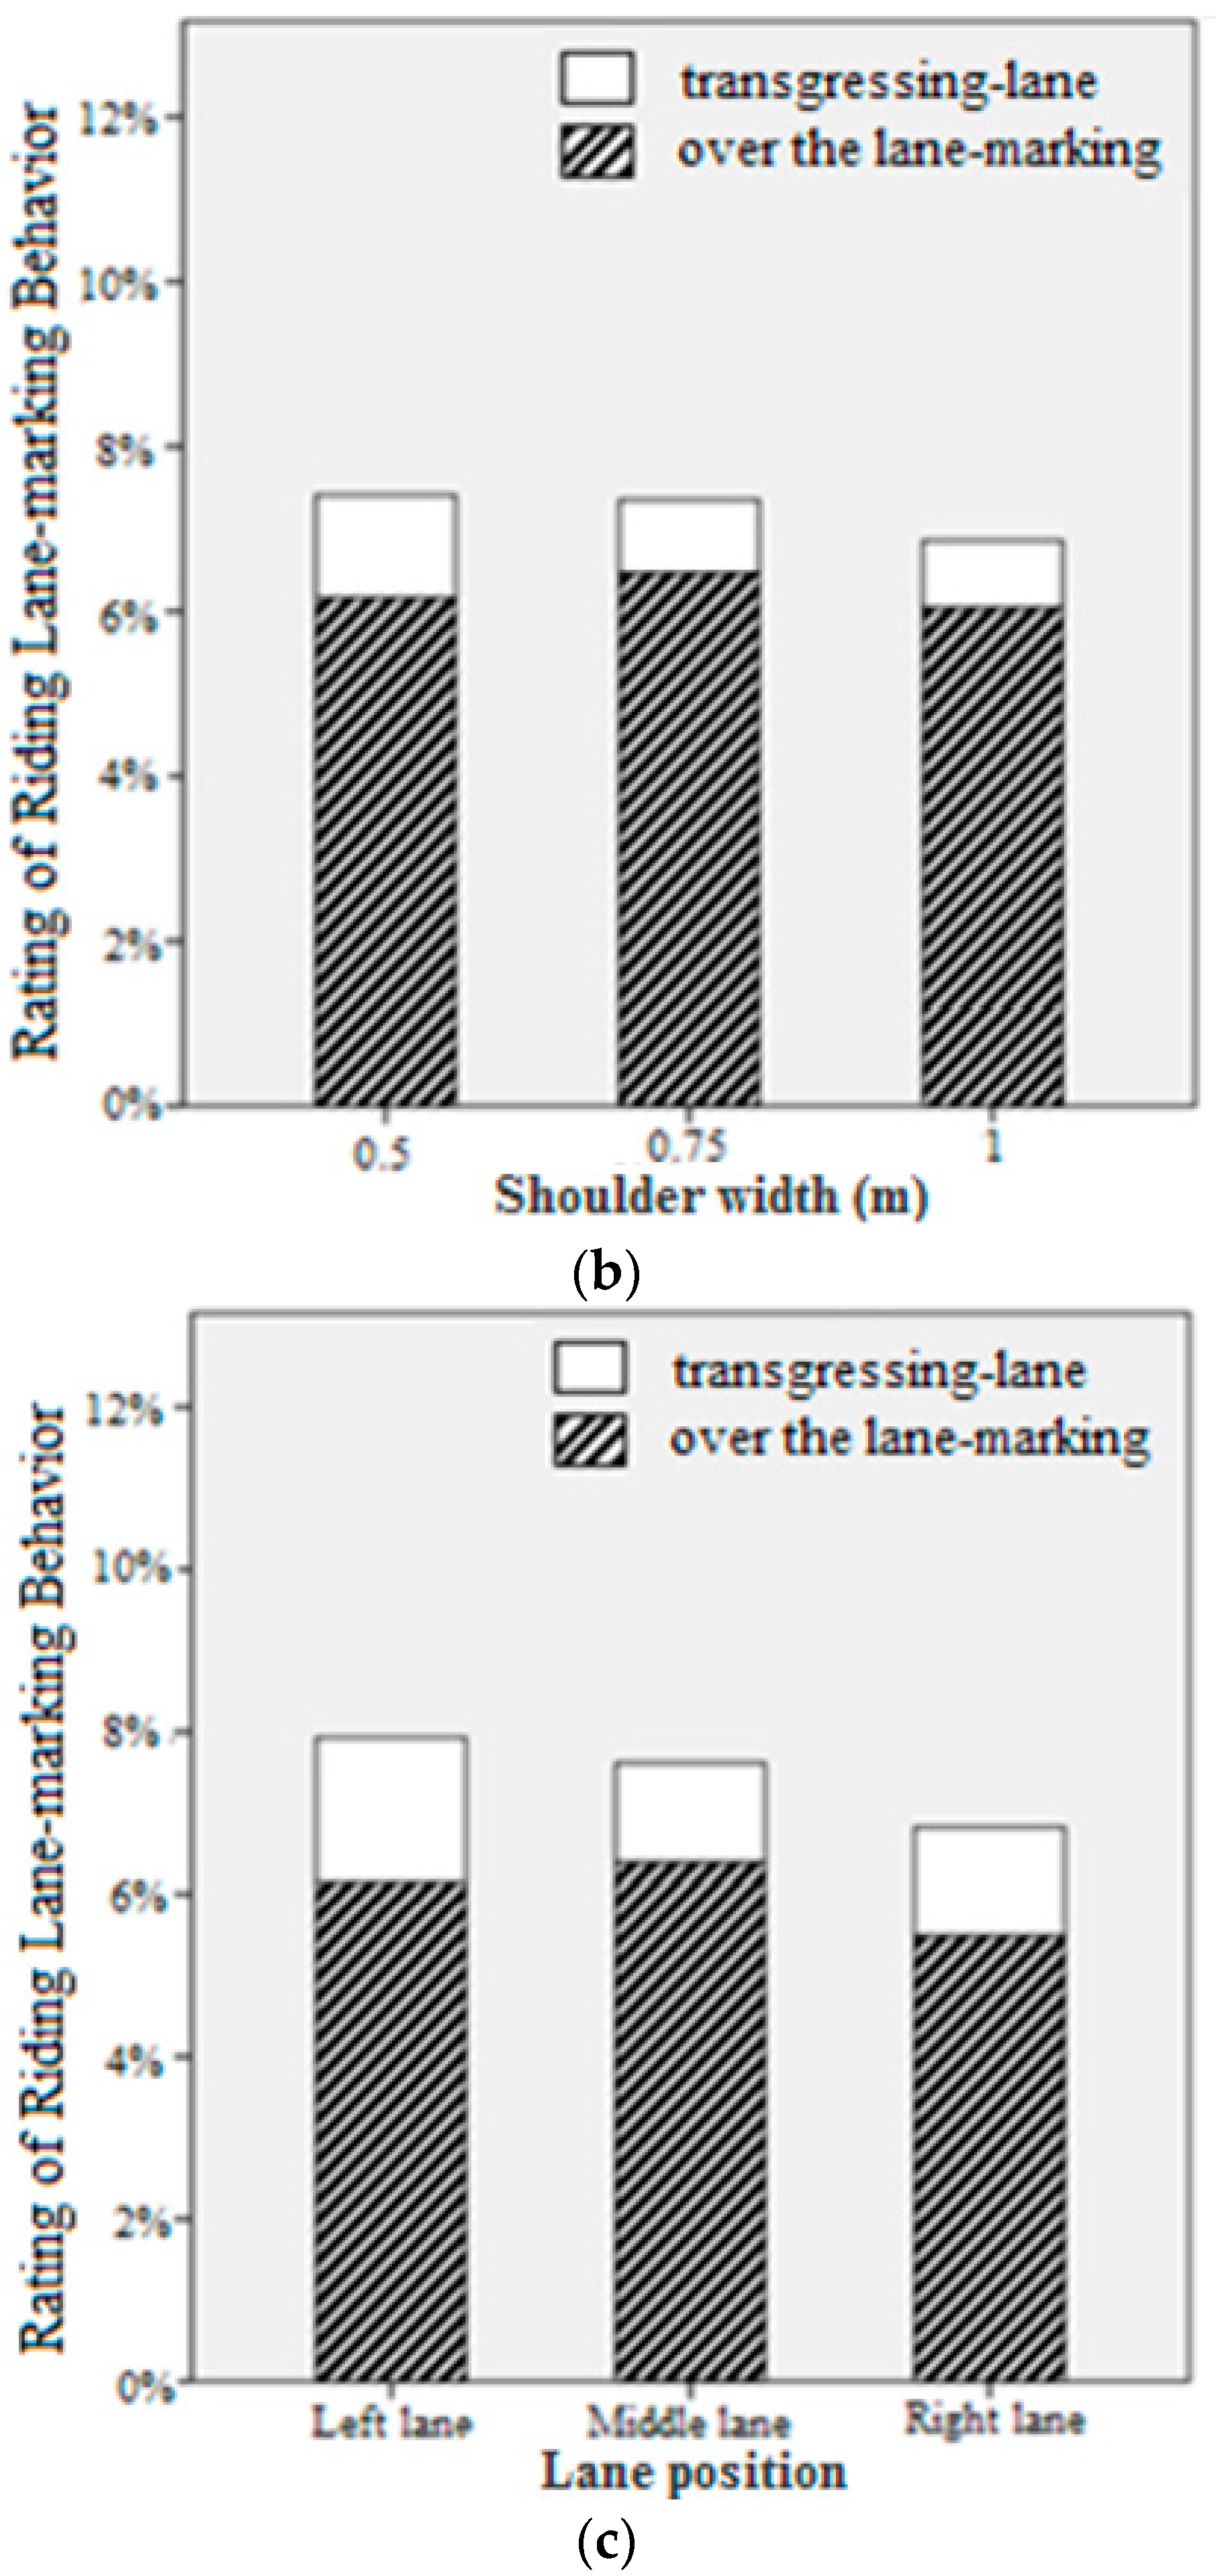
3.3.2. Objective Evaluation
4. Discussion
- Shoulder width did not have significant impact on average speed of vehicles in the middle lane. For the left and right lane, the effects of shoulder width on driving behavior were partially similar with lane width.
- With a narrow road shoulder, drivers on the right or left lane tended to drive far away from the wall, with some deviating into the other lane. As the shoulder got wider, the impact became insignificant.
- Participants drove faster and had a larger lane deviation in a wide shoulder compared to in a small one.
- Driver behavior was more affected by lane width compared to shoulder width, which is in line with driver perception as suggested in [25], where drivers determined the lateral position mainly by recognizing the position of the marking.
- Wide shoulder would bring the drivers high perception of safety and reduce the proportion of dangerous displacement, e.g., transgressing-lane driving.
5. Conclusions
Acknowledgments
Author Contributions
Conflicts of Interest
References
- Ronka, K.; Ritola, J.; Rauhala, K. Underground space in land-use planning. Tunn. Undergr. Space Technol. 1998, 13, 39–49. [Google Scholar] [CrossRef]
- Hoeven, F.V.D. A review of the impact of the RingRing study for multifunctional motorway tunnels in the Netherlands and beyond. Tunn. Undergr. Space Technol. 2011, 26, 292–309. [Google Scholar] [CrossRef]
- Amundsen, F.H.; Ranes, G. Studies on traffic accident in Norwegian road tunnels. Tunn. Undergr. Space Technol. 2000, 15, 3–11. [Google Scholar] [CrossRef]
- Permanent International Association of Road Congresses (PIARC). Human Factors and Road Tunnel Safety Regarding Users; Report R17; PIARC Technical Committee C3.3, Road Tunnel Operation: Paris, France, 2008. [Google Scholar]
- Yeung, J.S.; Wong, Y.D. Road traffic accidents in Singapore expressways tunnels. Tunn. Undergr. Space Technol. 2013, 38, 534–541. [Google Scholar] [CrossRef]
- Lemke, K. Road Safety in Tunnels; Transportation Research Record 1940; Transportation Research Board: Washington, DC, USA, 2000; pp. 170–174. [Google Scholar]
- Godley, S.T. A Driving Simulator Investigation of Perceptual Countermeasures to Speeding. Ph.D. Thesis, Monash University, Melbourne, Australia, 1999. [Google Scholar]
- Warrd, D.D.; Steyvers, F.J.J.M.; Brookhuis, K.A. How much visual road information is needed to drive safely and comfortably. Saf. Sci. 2004, 42, 639–655. [Google Scholar] [CrossRef]
- Fitzpatrick, K.; Carlson, P.; Brewer, M. Design Factors that Affect Driver Speed on Suburban Streets; Transportation Research Record 1751; Transportation Research Board: Washington, DC, USA, 2001; pp. 18–25. [Google Scholar]
- Ma, Y.; Yang, X.; Zeng, Y. Association analysis of urban road free-flow speed and lane width. J. Tongji Univ. (Natl. Sci.) 2009, 37, 1621–1626. [Google Scholar]
- Hadi, M.A.; Aruldhas, J.; Chow, L.F. Estimating Safety Effects of Cross-Section Design for Various Highway Types Using Negative Binomial Regression; Transportation Research Record 1500; Transportation Research Board: Washington, DC, USA, 1995; pp. 167–177. [Google Scholar]
- Horst, A.R.A.V.D.; Hogema, J.H. Driving Simulator Research on Safe Highway Design and Operation; Transportation Research Record 2248; Transportation Research Board: Washington, DC, USA, 2011; pp. 87–95. [Google Scholar]
- Wilde, G.J.S. The theory of risk homeostasis: Implications for safety and health. Risk Anal. 1982, 2, 209–226. [Google Scholar] [CrossRef]
- Chen, Y.R.; Zheng, S.W. Mechanism analysis of vehicle operating characteristic affected by visual environment of underground road. J. Tongji Univ. (Natl. Sci.) 2013, 41, 1031–1039. [Google Scholar]
- Martens, M.; Comte, S.; Kaptein, N. The Effects of Road Design on Speed Behavior: A Literature Review. The National Academies of Sciences, Engineering, and Medicine. 1997. Available online: http://virtual.vtt.fi/virtual/proj6/master/rep231.pdf (accessed on 4 October 2016).
- Godley, S.T.; Triggs, T.J.; Fildes, B.N. Perceptual lane width, wide perceptual road centre marking and driving speeds. Ergonomics 2004, 47, 237–256. [Google Scholar] [CrossRef] [PubMed]
- Knuiman, M.W.; Council, F.M.; Reinfurt, D.W. Association of Median Width and Highway Accident Rates; Transportation Research Record 1401; Transportation Research Board: Washington, DC, USA, 1993; pp. 70–82. [Google Scholar]
- Summala, H. Accident risk and driver behavior. Saf. Sci. 1996, 22, 103–117. [Google Scholar] [CrossRef]
- Stamatiadis, N.; Pigman, J.; Sacksteder, J.; Ruff, W.; Lord, D. Impact of Shoulder Width and Median Width on Safety; National Cooperative Highway Research Program (NCHRP), Report No. 633; Transportation Research Board: Washington, DC, USA, 2009. [Google Scholar]
- Zheng, S.W. Underground Expressway Vehicles Running Characteristics Study and Analysis of Mechanism Based on Visual Computing. Master’s Thesis, Tongji University, Shanghai, China, 2011. [Google Scholar]
- Tornros, J. Driving behavior in a real and a simulated road tunnel—A validation study. Accid. Anal. Prev. 1998, 30, 497–503. [Google Scholar] [CrossRef]
- Hirata, T. Traffic Safety Analysis in Underground Urban Expressway Using Driving Simulation System MOVIC-T4; Transportation Research Record 2184; Transportation Research Board: Washington, DC, USA, 2006; pp. 2592–2606. [Google Scholar]
- Rudin-Brown, C.M.; Young, K.L. Driver distraction in an unusual environment: Effects of text-messaging in tunnels. Accid. Anal. Prev. 2013, 50, 122–129. [Google Scholar] [CrossRef] [PubMed]
- Tamar, B.B.; David, S. Effect of shoulder width, guardrail and roadway geometry on driver perception and behavior. Accid. Anal. Prev. 2011, 43, 2142–2152. [Google Scholar]
- Akihiro, S.; Hideki, T.; Hidetsugu, O. A simulation study of driving performance in long tunnel. In Proceedings of the 6th Pacific Rim TransTech Conference, 1995 Vehicle Navigation and Information Systems Conference, International VNIS, A Ride into the Future, Seattle, WA, USA, 30 July–2 August 1995; pp. 96–103.
- Hirata, T.; Tetsuo, Y.; Tsuyoshi, T. Development of the driving simulation system MOVIC-T4 and its validation using field driving data. Tsinghua Sci. Technol. 2007, 2, 141–150. [Google Scholar]
- Manser, M.P.; Hancock, P.A. The influence of perceptual speed regulation on speed perception, choice and control: tunnel wall characteristics and influences. Accid. Anal. Prev. 2007, 39, 69–78. [Google Scholar] [CrossRef] [PubMed]
- Mcavoy, D.S.; Schattler, K.L.; Datta, T.K. Driving Simulator Validation for Nighttime Construction Work Zone Devices; Transportation Research Record 2015; Transportation Research Board: Washington, DC, USA, 2007; pp. 55–63. [Google Scholar]
- Cao, C.; Luo, Y.; Wang, J. Driving simulator validation for research on driving behavior at entrance of urban underground road. In Proceedings of the International Conference on Transportation Information & Safety, Wuhan, China, 25–28 June 2015; pp. 458–468.
- Ding, H.; Zhao, X.H.; Rong, J.; Zhong, L.D. Driving simulator study of effect of inside shoulder on vehicle operation. Adv. Mech. Eng. 2015, in press. [Google Scholar] [CrossRef]
- Lewis-Evans, B.; Charlton, S.G. Explicit and implicit processes in behavioral adaptation to road width. Accid. Anal. Prev. 2006, 38, 610–617. [Google Scholar] [CrossRef] [PubMed]
- Ministry of Housing and Urban-Rural Development of the People’s Republic of China (MOHURD). Specification for Design of Urban Expressway; CJJ129-2009; MOHURD: Beijing, China, 2009.
- Ministry of Housing and Urban-Rural Development of the People’s Republic of China (MOHURD). Code for Design of Urban Road Engineering; CJJ37-2012; MOHURD: Beijing, China, 2012.
- Liu, S.; Wang, J.H.; Zhang, L.F.; Fang, S.E. Characteristic and prediction model for operating speed model in urban underground road. J. Tongji Univ. (Natl. Sci.) 2015, 37, 1677–1683. [Google Scholar]


| No. of Scenario | 1 | 2 | 3 | 4 | 5 | 6 | 7 | 8 | 9 | 10 | 11 | 12 | 13 | 14 | 15 |
|---|---|---|---|---|---|---|---|---|---|---|---|---|---|---|---|
| Lane position | l | m | r | l | m | r | l | m | r | l | m | r | l | m | r |
| Lane width (m) | 2.85 | 3.00 | 3.25 | 3.50 | 3.75 | ||||||||||
| Shoulder width (m) | 0.5 | 0.75 | 1 | 0.5 | 0.75 | 1 | 0.5 | 0.75 | 1 | 0.5 | 0.75 | 1 | 0.5 | 0.75 | 1 |
| Lane Width (m) | Shoulder Width (m) | Average Speed (km/h) | Mean Value in Different Lanes (km/h) | |||||
|---|---|---|---|---|---|---|---|---|
| Left Lane | SD | Middle Lane | SD | Right Lane | SD | |||
| 2.85 | 0.5 | 57.23 | 59.29 | 7.43 | 56.12 | 7.11 | 56.18 | 6.45 |
| 0.75 | 60.01 | 62.98 | 8.21 | 56.51 | 9.86 | 59.29 | 10.31 | |
| 1 | 61.47 | 64.36 | 9.87 | 57.04 | 10.67 | 63.19 | 9.79 | |
| 3 | 0.5 | 63.82 | 67.01 | 9.36 | 64.23 | 9.41 | 60.78 | 8.18 |
| 0.75 | 67.51 | 70.19 | 8.96 | 64.72 | 7.55 | 65.14 | 11.27 | |
| 1 | 69.29 | 73.58 | 9.84 | 65.47 | 8.64 | 69.38 | 8.17 | |
| 3.25 | 0.5 | 69.06 | 71.79 | 9.57 | 70.1 | 10.39 | 65.46 | 9.96 |
| 0.75 | 73.17 | 73.53 | 8.51 | 71.52 | 8.51 | 73.06 | 8.55 | |
| 1 | 74.83 | 77.51 | 10.46 | 71.88 | 10.33 | 75.32 | 11.11 | |
| 3.5 | 0.5 | 77.58 | 78.14 | 7.65 | 79.45 | 9.75 | 76.85 | 10.73 |
| 0.75 | 80.11 | 80.61 | 11.88 | 79.45 | 10.37 | 79.69 | 8.15 | |
| 1 | 81.56 | 82.76 | 9.31 | 79.84 | 8.86 | 81.77 | 8.97 | |
| 3.75 | 0.5 | 84.13 | 84.16 | 12.86 | 86.15 | 8.25 | 81.92 | 11.65 |
| 0.75 | 88.05 | 87.23 | 13.37 | 88.93 | 11.01 | 87.98 | 14.42 | |
| 1 | 88.10 | 88.91 | 9.75 | 87.56 | 10.16 | 88.03 | 10.74 | |
| Lane Width (m) | Lane Position | Mean Value (m) | SD | Minimum (m) | Maximum (m) |
|---|---|---|---|---|---|
| 2.85 | Left | −0.16 | 0.32 | −0.70 | 0.46 |
| Middle | −0.05 | 0.34 | −0.63 | 0.59 | |
| Right | 0.12 | 0.32 | −0.44 | 0.65 | |
| 3 | Left | −0.13 | 0.35 | −0.76 | 0.59 |
| Middle | −0.03 | 0.36 | −0.7 | 0.66 | |
| Right | 0.1 | 0.33 | −0.55 | 0.70 | |
| 3.25 | Left | −0.11 | 0.38 | −0.85 | 0.67 |
| Middle | −0.03 | 0.41 | −0.8 | 0.75 | |
| Right | 0.08 | 0.35 | −0.62 | 0.80 | |
| 3.5 | Left | −0.08 | 0.42 | −0.95 | 0.80 |
| Middle | −0.01 | 0.47 | −0.9 | 0.87 | |
| Right | 0.07 | 0.40 | −0.76 | 0.88 | |
| 3.75 | Left | −0.06 | 0.45 | −1.01 | 0.9 |
| Middle | −0.02 | 0.49 | −0.95 | 0.95 | |
| Right | 0.05 | 0.42 | −0.85 | 0.97 |
© 2016 by the authors; licensee MDPI, Basel, Switzerland. This article is an open access article distributed under the terms and conditions of the Creative Commons Attribution (CC-BY) license (http://creativecommons.org/licenses/by/4.0/).
Share and Cite
Liu, S.; Wang, J.; Fu, T. Effects of Lane Width, Lane Position and Edge Shoulder Width on Driving Behavior in Underground Urban Expressways: A Driving Simulator Study. Int. J. Environ. Res. Public Health 2016, 13, 1010. https://doi.org/10.3390/ijerph13101010
Liu S, Wang J, Fu T. Effects of Lane Width, Lane Position and Edge Shoulder Width on Driving Behavior in Underground Urban Expressways: A Driving Simulator Study. International Journal of Environmental Research and Public Health. 2016; 13(10):1010. https://doi.org/10.3390/ijerph13101010
Chicago/Turabian StyleLiu, Shuo, Junhua Wang, and Ting Fu. 2016. "Effects of Lane Width, Lane Position and Edge Shoulder Width on Driving Behavior in Underground Urban Expressways: A Driving Simulator Study" International Journal of Environmental Research and Public Health 13, no. 10: 1010. https://doi.org/10.3390/ijerph13101010
APA StyleLiu, S., Wang, J., & Fu, T. (2016). Effects of Lane Width, Lane Position and Edge Shoulder Width on Driving Behavior in Underground Urban Expressways: A Driving Simulator Study. International Journal of Environmental Research and Public Health, 13(10), 1010. https://doi.org/10.3390/ijerph13101010