Evaluation of the Relationship between the Adenosine Triphosphate (ATP) Bioluminescence Assay and the Presence of Bacillus anthracis Spores and Vegetative Cells


Abstract
:1. Introduction
2. Experimental Section

| Item Description | Surface Area (cm2) |
|---|---|
| Aluminum-sheet metal (Steelworks, Cincinnati, OH, USA) | 100 |
| Bed mattress fabric—cut from old hospital mattress from a Hill-Rom Advance 2000 (Hill-Rom Holdings, Inc., Batesville, IN, USA) | 100 |
| Bed rail made of Polyvinyl Chloride (PVC)—cut from an old hospital bed from a Hill-Rom Advance 2000 | 100 |
| Carpet-coronet idolized esteemed berber similar to the weave used in the hospital made of nylone (Coronet, Dalton, GA, USA) | 100 |
| Ceramic tile-white (U. S. Ceramic Tile Company part of Roca Tile Group, Miami, FL, USA) | 110 |
| Chrome light switch cover—polished material similar to some faucets (Liberty Harware, Winston-Salem, NC, USA) | 50 |
| Keyboard (Dell, Round Rock, TX, USA) | 50 |
| Lexan polycarbonate sheet (Lowe’s, Omaha, NE, USA) | 100 |
| Nickel light switch cover—satin material similar to some faucets (Liberty Harware, Winston-Salem, NC, USA) | 100 |
| Paper (Boise White Paper, LLC, Boise, ID, USA) | 100 |
| Plastic Acrylic Sheet (Lowe’s, Omaha, NE, USA) | 100 |
| Plastic light switch cover (Cooper LightingUnbreakable, Peachtree City, GA, USA) | 80 |
| Porcelain tile—rialto Beige (Del Conca, Loudon, TN, USA) | 100 |
| PVC-ranch base molding (Royal Molding, Woodbridge, Ontario, Canada) | 112 |
| Stainless steel—T304 (Steelworks, Cincinnati, OH, USA) | 100 |
| Vinyl flooring—overlook II Sandstone (Armstrong, Lancaster, PA, USA) | 100 |
| Wood—stained similar to chair arms-Autumn Maple (Mullican Flooring, Johnson City, TN, USA) | 112.5 |
2.1. Inoculate Preparation
2.2. Culturable Microbiological Methods
2.3. ATP Bioluminescence Methods
2.4. Quality Control/Quality Assurance
2.5. Statistical Methods
3. Results and Discussion
| Target Concentration CFU/Surface | Variable | Mean | Standard Deviation | Median | Minimum | Maximum |
|---|---|---|---|---|---|---|
| Endospores 104 | Actual RLU/Surface | 2.15 × 101 | 1.47 × 101 | 1.67 × 101 | 8.00 × 100 | 6.63 × 101 |
| Adjusted RLU/Surface | 2.40 × 101 | 1.59 × 101 | 1.88 × 101 | 1.09 × 101 | 6.92 × 101 | |
| Actual CFU/Surface | 1.70 × 10³ | 7.61 × 10² | 1.73 × 10³ | 6.60 × 10² | 3.20 × 10³ | |
| Adjusted CFU/Surface | 1.96 × 10³ | 1.02 × 10³ | 2.04 × 10³ | 7.42 × 10² | 4.42 × 10³ | |
| Endospores 106 | Actual RLU/Surface | 2.82 × 101 | 1.48 × 101 | 2.70 × 101 | 9.33 × 100 | 6.67 × 101 |
| Adjusted RLU/Surface | 2.82 × 101 | 1.82 × 101 | 2.70 × 101 | 4.79 × 100 | 8.46 × 101 | |
| Actual CFU/Surface | 1.96 × 10⁵ | 1.19 × 10⁵ | 1.54 × 10⁵ | 5.93 × 10⁴ | 5.13 × 10⁵ | |
| Adjusted CFU/Surface | 2.21 × 10⁵ | 1.59 × 10⁵ | 2.15 × 10⁵ | 1.17 × 10⁴ | 5.97 × 10⁵ | |
| Endospores 108 | Actual RLU/Surface | 3.41 × 101 | 1.31 × 101 | 3.13 × 101 | 1.77 × 101 | 6.13 × 101 |
| Adjusted RLU/Surface | 5.33 × 101 | 2.30 × 101 | 4.69 × 101 | 1.95 × 101 | 9.84 × 101 | |
| Actual CFU/Surface | 1.65 × 10⁷ | 1.13 × 10⁷ | 1.28 × 10⁷ | 4.07 × 10⁶ | 4.67 × 10⁷ | |
| Adjusted CFU/Surface | 2.47 × 10⁷ | 1.54 × 10⁷ | 2.11 × 10⁷ | 6.59 × 10⁶ | 6.79 × 10⁷ | |
| Vegetative Cells 104 | Actual RLU/Surface | 9.81 × 10² | 7.55 × 10² | 1.09 × 10³ | 7.53 × 101 | 2.44 × 10³ |
| Adjusted RLU/Surface | 5.00 × 10³ | 6.24 × 10³ | 1.75 × 10³ | 1.37 × 10² | 2.09 × 10⁴ | |
| Actual CFU/Surface | 1.04 × 10³ | 7.13 × 10² | 8.47 × 10² | 2.77 × 10² | 2.72 × 10³ | |
| Adjusted CFU/Surface | 2.33 × 10³ | 8.71 × 10² | 2.26 × 10³ | 9.47 × 10² | 4.19 × 10³ | |
| Vegetative Cells 106 | Actual RLU/Surface | 6.68 × 10⁴ | 2.95 × 10⁴ | 7.48 × 10⁴ | 1.63 × 10⁴ | 1.17 × 10⁵ |
| Adjusted RLU/Surface | 5.98 × 10⁴ | 2.20 × 10⁴ | 5.97 × 10⁴ | 2.43 × 10⁴ | 1.05 × 10⁵ | |
| Actual CFU/Surface | 3.26 × 10⁵ | 2.66 × 10⁵ | 2.74 × 10⁵ | 4.33 × 10⁴ | 1.10 × 10⁶ | |
| Adjusted CFU/Surface | 2.82 × 10⁵ | 2.09 × 10⁵ | 2.11 × 10⁵ | 6.96 × 10⁴ | 7.98 × 10⁵ | |
| Vegetative Cells 108 | Actual RLU/Surface | 1.51 × 10⁵ | 6.76 × 10⁴ | 1.56 × 10⁵ | 3.28 × 10⁴ | 3.13 × 10⁵ |
| Adjusted RLU/Surface | 8.60 × 10⁵ | 6.16 × 10⁵ | 6.07 × 10⁵ | 1.26 × 10⁵ | 1.99 × 10⁶ | |
| Actual CFU/Surface | 4.77 × 10⁶ | 4.58 × 10⁶ | 3.30 × 10⁶ | 5.33 × 10⁵ | 1.60 × 10⁷ | |
| Adjusted CFU/Surface | 2.94 × 10⁷ | 3.70 × 10⁷ | 1.32 × 10⁷ | 1.06 × 10⁶ | 1.32 × 10⁸ |
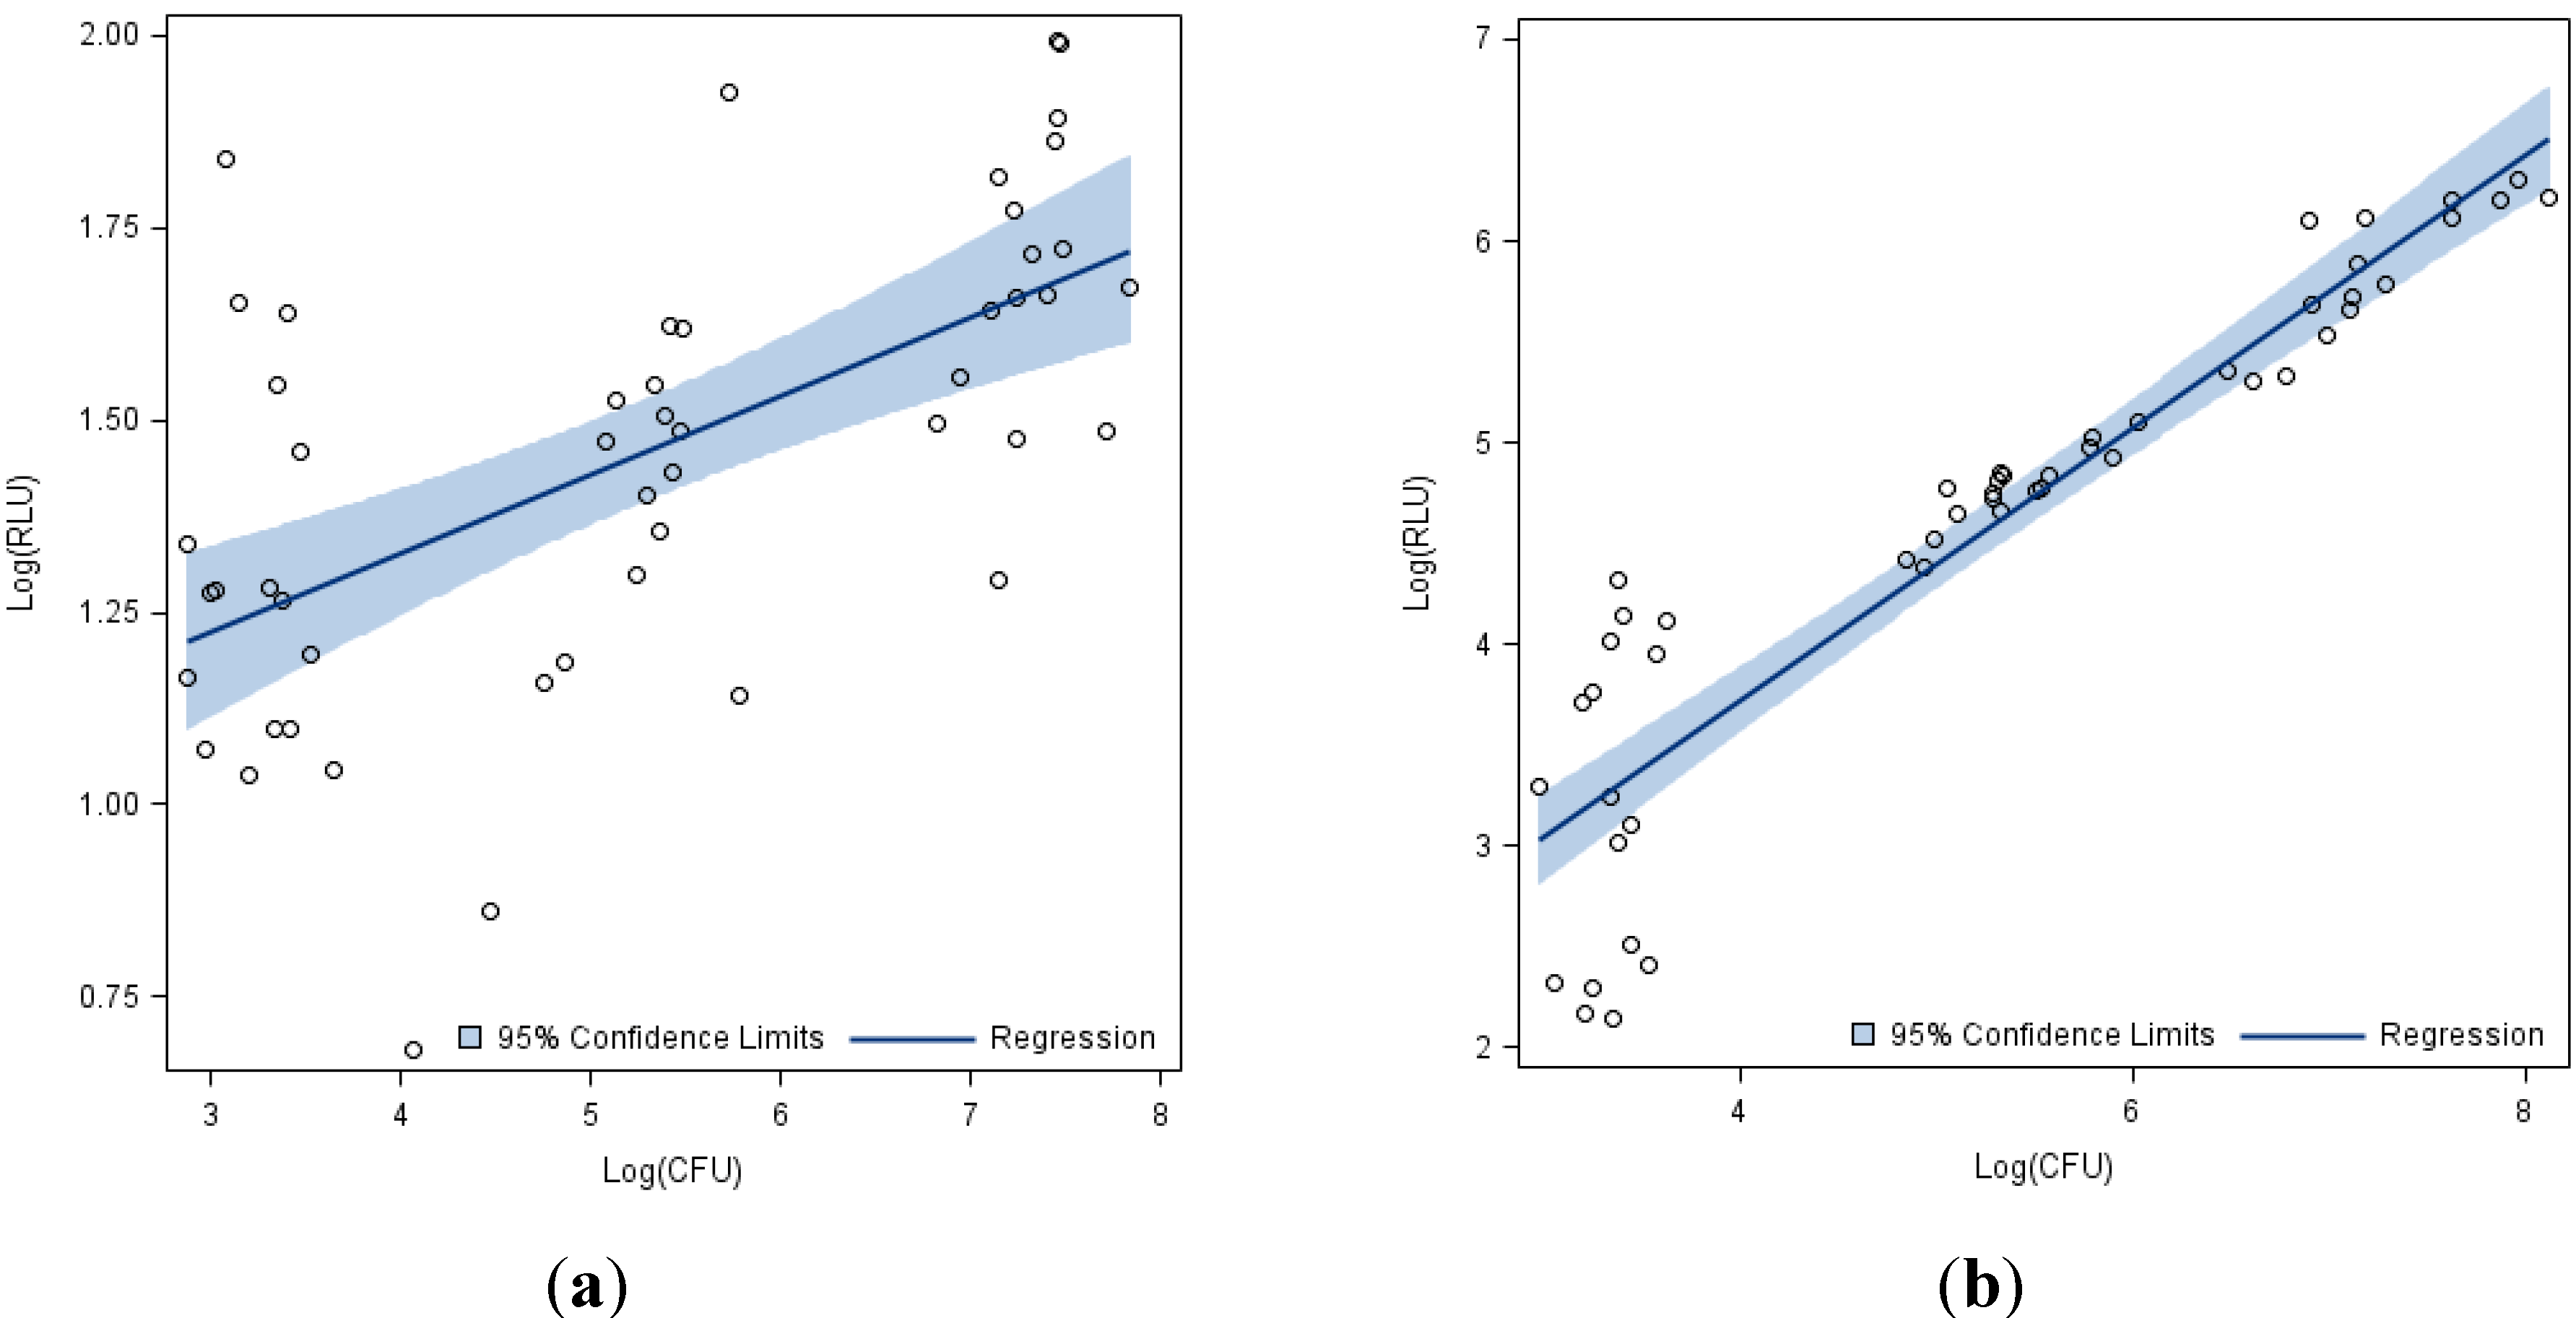
| Organism | Nominal Slurry Concentration CFU/Surface | N | Pearson Correlation Coefficient log(RLU) vs. log(CFU) | p-value |
|---|---|---|---|---|
| Endospores | 104 | 17 | −0.085 | 0.747 |
| 106 | 17 | 0.798 | <0.001 | |
| 108 | 17 | 0.340 | 0.182 | |
| All concentrations | 51 | 0.598 | <0.001 | |
| Vegetative Cells | 104 | 17 | 0.271 | 0.293 |
| 106 | 17 | 0.874 | <0.001 | |
| 108 | 17 | 0.886 | <0.001 | |
| All concentrations | 51 | 0.925 | <0.001 | |
| All organisms | All concentrations | 102 | 0.355 | <0.001 |
| Surface Material | Combined Vegetative Cells and Endospores | Vegetative Cells | Endospores | |||
|---|---|---|---|---|---|---|
| Pearson Correlation | p-value | Pearson Correlation | p-value | Pearson Correlation | p-value | |
| Aluminum | 0.284 | 0.254 | 0.995 | <0.001 | 0.574 | 0.106 |
| Bed mattress fabric | 0.259 | 0.300 | 0.970 | <0.001 | 0.843 | 0.004 |
| Bed rail | 0.320 | 0.196 | 0.986 | <0.001 | 0.484 | 0.187 |
| Carpet | 0.340 | 0.168 | 0.969 | <0.001 | 0.782 | 0.013 |
| Ceramic tile | 0.257 | 0.303 | 0.991 | <0.001 | −0.306 | 0.424 |
| Chrome light switch cover | 0.248 | 0.321 | 0.996 | <0.001 | 0.557 | 0.120 |
| Keyboard | 0.319 | 0.197 | 0.952 | <0.001 | 0.477 | 0.195 |
| Lexan polycarbonate | 0.516 | 0.028 | 0.991 | <0.001 | 0.937 | <0.001 |
| Nickel light switch cover | 0.421 | 0.082 | 0.989 | <0.001 | 0.780 | 0.013 |
| Paper | 0.500 | 0.035 | 0.931 | <0.001 | 0.668 | 0.049 |
| Plastic acrylic sheet | 0.308 | 0.214 | 0.989 | <0.001 | 0.697 | 0.037 |
| Plastic light switch cover | 0.476 | 0.054 | 0.990 | <0.001 | 0.669 | 0.070 |
| Porcelain tile | 0.462 | 0.054 | 0.989 | <0.001 | 0.778 | 0.014 |
| PVC | 0.288 | 0.247 | 0.985 | <0.001 | 0.727 | 0.027 |
| Stainless steel | 0.528 | 0.024 | 0.981 | <0.001 | 0.377 | 0.318 |
| Vinyl flooring | 0.195 | 0.438 | 0.998 | <0.001 | 0.844 | 0.004 |
| Wood-stained | 0.231 | 0.357 | 0.994 | <0.001 | −0.006 | 0.989 |
4. Conclusions
Acknowledgments
Author Contributions
Conflicts of Interest
References
- Hugh-Jones, M.; Blackburn, J. The ecology of Bacillus anthracis. Mol. Aspects Med. 2009, 30, 356–367. [Google Scholar] [CrossRef]
- Titball, R.W.; Turnbull, P.C.; Hutson, R.A. The monitoring and detection of Bacillus anthracis in the environment. Soc. Appl. Bacteriol. Symp. Ser. 1991, 20, S9–S18. [Google Scholar]
- Lester, R.; Beaton, S.; Carnie, J.; Barbis, D.; Rouch, G. A case of human anthrax in Victoria. Commun. Dis. Intell. 1997, 4, 47–48. [Google Scholar]
- Reddy, R.; Parasadini, R.; Rao, P.; Uthappa, C.K.; Murhekar, M.V. Outbreak of cutaneous anthrax in Musalimandugu village, Chittoor district, Andhra Pradesh, India, July–August 2001. J. Infect. Dev. Ctries. 2012, 6, 695–699. [Google Scholar]
- Anaraki, S.; Addiman, S.; Nixon, G.; Krahé, D.; Ghosh, R.; Brooks, T.; Lloyd, G.; Spencer, R.; Walsh, A.; McCloskey, B.; Lightfoot, N. Investigations and control measures following a case of inhalation anthrax in east London in a drum maker and drummer, October 2008. Euro Surveill. 2008, 13. Available online: http://www.eurosurveillance.org/ViewArticle.aspx?ArticleId=19076 (accessed on 18 December 2008). [Google Scholar]
- Centers for Disease Control and Prevention. Gastrointestinal Anthrax after an Animal-hide Drumming Event—New Hampshire and Massachusetts, 2009. In Morbidity and Mortality Weekly Report (MMWR); Centers for Disease Control and Prevention: Atlanta, GA, USA, 2010; Volume 59, pp. 872–877. [Google Scholar]
- Jernigan, D.B.; Raghunathan, P.L.; Bell, B.P.; Brechner, R.; Bresnitz, E.A.; Butler, J.C.; Cetron, M.; Cohen, M.; Doyle, T.; Fischer, M.; et al. Investigation of bioterrorism-related anthrax, United States, 2001: Epidemiologic findings. Emerg. Infect. Dis. 2002, 8, 1019–1028. [Google Scholar] [CrossRef]
- Greenfield, R.A.; Drevets, D.A.; Machado, L.J.; Voskuhl, G.W.; Cornea, P.; Bronze, M.S. Bacterial pathogens as biological weapons and agents of bioterrorism. Amer. J. Med. Sci. 2002, 323, 300–315. [Google Scholar]
- Martin, S. The role of biological weapons in international politics: The real military revolution. J. Strategic. Stud. 2002, 1, 63–98. [Google Scholar] [CrossRef]
- Poulis, J.A.; de Pipijper, M.; Mossel, D.A.; Dekkers, P.P. Assessment of cleaning and disinfection in the food industry with the rapid ATP-bioluminescenc technique combined with the tissue-fluid contamination test and a conventional microbiological method. Int. J. Food Microbiol. 1993, 20, 109–116. [Google Scholar] [CrossRef]
- Shama, G.; Malik, D.J. The uses and abuses of rapid bioluminescence-based ATP assays. Int. J. Hyg. Environ. Health 2013, 216, 115–125. [Google Scholar] [CrossRef]
- Mulvey, D.; Redding, P.; Roberston, C.; Woodall, C.; Kingsmore, P.; Bedwell, D.; Dancer, S.J. Finding a benchmark for monitoring hospital cleanliness. J. Hosp. Infect. 2011, 77, 25–30. [Google Scholar] [CrossRef]
- Smith, P.W.; Gibbs, S.G.; Sayle, H.; Hewlett, A.; Rupp, M.E.; Iwen, P.C. Observations on hospital room contamination testing. Healthc. Infect. 2013, 18, 10–13. [Google Scholar] [CrossRef]
- Smith, P.W.; Sayles, H.; Hewlett, A.; Cavalieri, R.J.; Gibbs, S.G.; Rupp, M.E. A study of three methods for assessment of hospital environmental cleaning. Healthc. Infect. 2013, 18, 80–85. [Google Scholar] [CrossRef]
- Baweja, R.B.; Zaman, M.S.; Mattoo, A.R.; Sharma, K.; Tripathi, V.; Aggarwal, A.; Dubey, G.P.; Kurupati, R.K.; Ganguli, M.; Chaudhury, N.K.; et al. Properties of Bacillus anthracis spores prepared under various environmental conditions. Arch. Microbiol. 2008, 189, 71–79. [Google Scholar]
- Murray, P.R.; Baron, E.J.; Jorgensen, J.H.; Landry, M.L.; Pfaller, M.A. Manual of Clinical Microbiology, 9th ed.; American Society for Microbiology: Washington, DC, USA, 2007. [Google Scholar]
- Setlow, B.; Cowan, A.E.; Setlow, P. Germination of spores of Bacillus subtilis with dodecylamine. J. Appl. Microbiol. 2003, 95, 637–648. [Google Scholar] [CrossRef]
- Venkateswaran, K.; Hattori, N.; Kern, R. ATP as a biomarker of viable microorganisms in clean-room facilities. J. Microbiol. Meth. 2003, 52, 367–377. [Google Scholar] [CrossRef]
- Isukapalli, S.S.; Lioy, P.J.; Georgopoulos, P.G. Mechanistic modeling of emergency events: Assessing the impact of hypothetical releases of anthrax. Risk Anal. 2008, 28, 723–740. [Google Scholar] [CrossRef]
- Office of Pesticide Programs, U.S. Environmental Protection Agency. Standard Operating Procedure for AOAC Use Dilution Method for Testing Disinfectants. Available online: http://www.epa.gov/pesticides/methods/atmpmethods/MB-05-12.pdf (accessed on 21 May 2014).
© 2014 by the authors; licensee MDPI, Basel, Switzerland. This article is an open access article distributed under the terms and conditions of the Creative Commons Attribution license (http://creativecommons.org/licenses/by/3.0/).
Share and Cite
Gibbs, S.G.; Sayles, H.; Colbert, E.M.; Hewlett, A.; Chaika, O.; Smith, P.W. Evaluation of the Relationship between the Adenosine Triphosphate (ATP) Bioluminescence Assay and the Presence of Bacillus anthracis Spores and Vegetative Cells. Int. J. Environ. Res. Public Health 2014, 11, 5708-5719. https://doi.org/10.3390/ijerph110605708
Gibbs SG, Sayles H, Colbert EM, Hewlett A, Chaika O, Smith PW. Evaluation of the Relationship between the Adenosine Triphosphate (ATP) Bioluminescence Assay and the Presence of Bacillus anthracis Spores and Vegetative Cells. International Journal of Environmental Research and Public Health. 2014; 11(6):5708-5719. https://doi.org/10.3390/ijerph110605708
Chicago/Turabian StyleGibbs, Shawn G., Harlan Sayles, Erica M. Colbert, Angela Hewlett, Oleg Chaika, and Philip W. Smith. 2014. "Evaluation of the Relationship between the Adenosine Triphosphate (ATP) Bioluminescence Assay and the Presence of Bacillus anthracis Spores and Vegetative Cells" International Journal of Environmental Research and Public Health 11, no. 6: 5708-5719. https://doi.org/10.3390/ijerph110605708
APA StyleGibbs, S. G., Sayles, H., Colbert, E. M., Hewlett, A., Chaika, O., & Smith, P. W. (2014). Evaluation of the Relationship between the Adenosine Triphosphate (ATP) Bioluminescence Assay and the Presence of Bacillus anthracis Spores and Vegetative Cells. International Journal of Environmental Research and Public Health, 11(6), 5708-5719. https://doi.org/10.3390/ijerph110605708