Article

Synergistic Anticancer Activity of Fucoidan from Lessonia trabeculata Combined with Chemotherapeutic Agents in 4T1 Breast Spheroids

by
Rosa María Condori Macuri
*,
Libertad Alzamora-Gonzales
*,
Erasmo Honorio Colona-Vallejos
,
Raisa Teresa Cruz Riquelme
,
Laura Inés Pecho Chávez
,
Jherson Oscar Cisneros Gutierrez
and
Victor Alonso Montejo Anlas
Research Group Immunomodulators and Antitumor of Natural and Synthetic Origen, Immunology Laboratory, Universidad Nacional Mayor de San Marcos, Lima 11-0058, Peru
*
Authors to whom correspondence should be addressed.
Mar. Drugs 2025, 23(12), 451; https://doi.org/10.3390/md23120451
Submission received: 1 September 2025 / Accepted: 16 September 2025 / Published: 26 November 2025
(This article belongs to the Special Issue Marine Natural Products as Anticancer Agents, 5th Edition)

Abstract

Triple-negative breast cancer (TNBC) is known for being aggressive and potentially resistant to chemotherapy. This means that new ways to improve cancer treatments are a priority. So, the anticancer effect of binary combinations of fucoidan (FuLt) and the chemotherapeutic agents doxorubicin, paclitaxel, and 5-fluorouracil was evaluated. The Chou-Talalay combination index method was used to do this. This method allows the assessment of interactions between products by determining synergism, additive effect and antagonism with combination index <1, =1 and >1, respectively. Synergistic indices (SIs) were selected and applied to 4T1 homotypic spheroids. Oxidative stress caused by SIs was determined after 72 h by measuring the production of ROS and NO in both homotypic and heterotypic spheroids. Three SIs with an inhibitory effect of at least ≥ 0.50 and a dose reduction index > 1 were selected. Considering the experimental and simulated SI, twelve, nineteen, and seven SIs were found for FuLt with doxorubicin, paclitaxel, and 5-fluorouracil, respectively. The highest levels of ROS and NO occurred at 12 and 72 h, respectively, in homotypic and heterotypic spheroids, indicating an immunomodulatory effect in heterotypic spheroids. These results suggest that the synergistic combination of FuLt with chemotherapeutic agents improves drug efficacy and modulates redox dynamics in 4T1 spheroids. Furthermore, FuLt alone exhibits cytotoxic properties.

Graphical Abstract

1. Introduction

Breast cancer is the most common malignant neoplasm in the female population worldwide, with around 2.3 million new cases reported each year [1]. Its incidence is expected to continue rising, with an estimated 29.5 million associated deaths predicted by 2040 [2]. Triple-negative breast cancer (TNBC) is a heterogeneous group of tumours with an aggressive clinical profile characterised by metastasis and recurrence. TNBC has the worst prognosis of all subtypes [3]. The absence of classical breast tumour markers (oestrogen receptors, progesterone receptors and human epidermal growth factor receptor 2) limits therapeutic options. Systemic chemotherapy using anthracyclines and taxanes is the most common treatment and cornerstone of clinical management [3,4]. In addition to these limited therapeutic options, patients face challenges such as drug resistance [4] and an impaired quality of life due to the adverse effects of treatment.
Some of the chemotherapy drugs commonly used for TNBC include doxorubicin (DOX), paclitaxel (PTX) and 5-fluorouracil (5-FU). DOX is an anthracycline which damages genetic material and alters iron and calcium metabolism, thereby inducing apoptosis and autophagy [5]. PTX, is a taxane derived from the yew tree. It causes cell cycle arrest by inhibiting mitotic spindle function, leading to apoptosis [6]. PTX is also characterised by its ability to induce autophagy in tumour stem cells, a process that has been identified as one of the causes of chemoresistance [6]. Similarly, 5-FU acts on actively dividing cells by inhibiting RNA replication and thymidylate synthase, ultimately blocking DNA replication [7]. However, this can lead to chemoresistance, as well as neurological and cardiac toxicity, myelosuppression, and other side effects.
Due to the limited treatment options available and the aggressive nature of the disease, developing effective therapies is crucial. These include combination therapeutic regimens, where the proper application of polychemotherapy can enhance treatment efficiency [8]. Adjuvant natural therapies have also been proposed to improve the effectiveness of chemotherapy, either by increasing its anticancer potential or by immunomodulation, which could reduce the medication’s harmful side effects [9].
Currently, a total of twenty-eight bioactive compounds with proven antitumor activity are undergoing clinical trials in phases I to III [10,11]. Fucoidan, a polysaccharide extracted from brown seaweed, stands out among the marine-derived compounds with scientific evidence supporting their anticancer and immunomodulatory properties [12]. Its composition varies and includes fucose, sulphate, uronic acid, galactose, xylose, mannose, rhamnose, glucose and arabinose. It has been shown to be non-toxic and is currently marketed as a functional supplement in several countries [13]. Fucoidan from Lessonia trabeculata (FuLt) has demonstrated cytotoxic activity against TNBC 4T1 cells in both monolayer and three-dimensional cultures [14], whilst reducing cytotoxicity against VERO cells [15,16]. Furthermore, FuLt has been shown to be non-toxic to both RAW264.7 cells [17] and human peripheral blood mononuclear cells [18].
Numerous studies have explored the use of fucoidan in chemotherapics combinations against various types of neoplastic cells, reporting enhanced cytotoxic activity, increased apoptosis, reduced tumour cell migration and decreased recurrence in both preclinical [19,20,21,22,23] and clinical trials [24]. The synergistic effect of two or more compounds is more than just the sum of their individual effects. Rather, it requires a more specific analysis based on their kinetics and dynamics [25]. Therefore, we consider it necessary to explore and validate the possible synergy between FuLt and conventional chemotherapeutic drugs through mathematical analysis that supports their combined use.
Reactive oxygen species (ROS) and reactive nitrogen species (RNS) play an important role in the tumour microenvironment [26]. Excessive intracellular ROS accumulation can have anticancer effects, including the inhibition of the cell cycle, the suppression of nucleotide and ATP synthesis, and the activation of pro-apoptotic pathways mediated by proteins such as p53 and caspases 9 and 3/7. It can also activate endoplasmic reticulum stress and induce ferroptosis [27]. Conversely, low concentrations of NO can promote angiogenesis and evasion of the immune response, whereas high levels can promote apoptosis, cellular senescence, and immunogenic cell death [28].
Following on from our previous findings of cytotoxicity and immunomodulation on a TNBC 4T1 3D model using fucoidan from L. trabeculata and a DOX [14]. This study aimed to determine the synergistic activity of the combination of FuLt and three chemotherapeutic drugs (DOX, PTX and 5-FU) in homotypic TNBC 4T1 spheroids. We also investigated the oxidative effect of these combinations on both homotypic and heterotypic spheroids (4T1 cells and mouse splenocytes). Both the experimental and simulated doses were obtained using the Chou-Talalay method. FuLt + PTX was found to be the most effective combination, providing the highest selectivity index (SI) at the lowest dose. Furthermore, FuLt’s pro-oxidant capacity was revealed through increased ROS and NO levels in both homotypic and heterotypic spheroid cultures. These results emphasise the importance of considering redox balance as a critical factor in the efficacy of combined anticancer therapies, as well as its potential link with cytotoxicity. It is recommended that the SI approach be applied to an in vivo TNBC 4T1 model in order to evaluate its potential progression to clinical trials.

2. Results

2.1. Effect of FuLt on the Viability of Homotypic TNBC 4T1 Spheroids

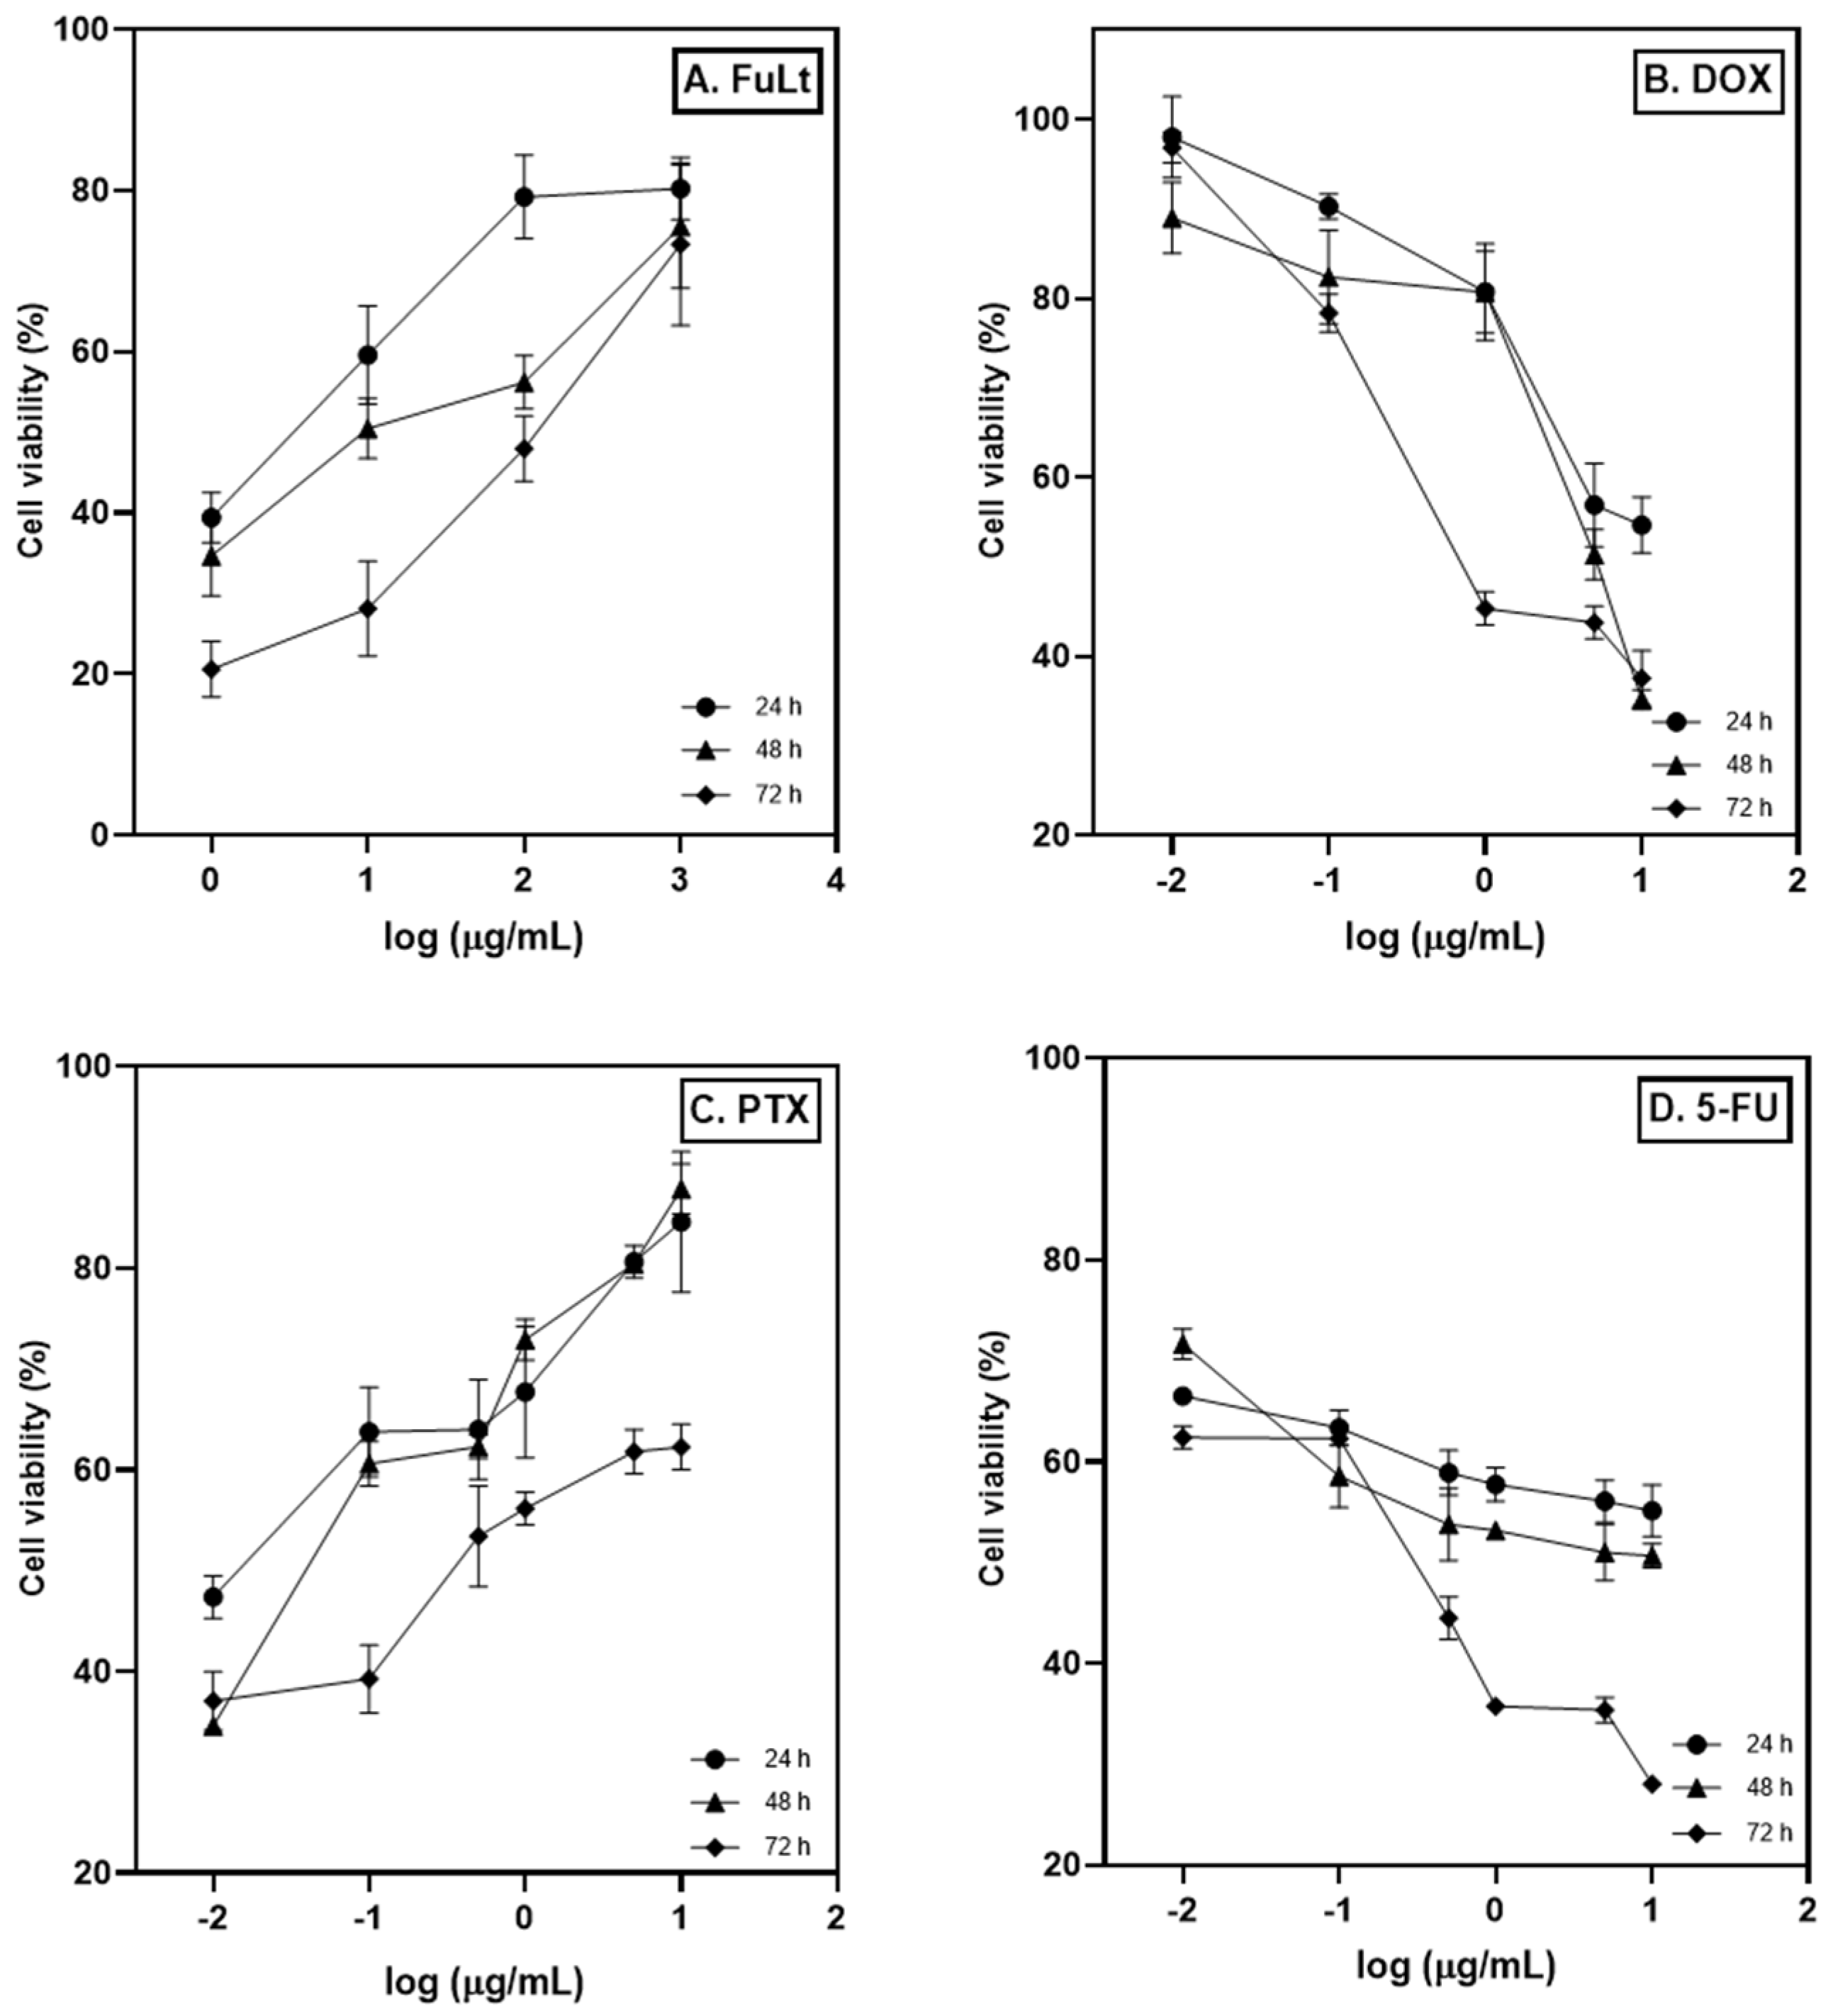
A strong cytotoxic effect was obtained for FuLt-treated 4T1 spheroids at concentrations of 1, 10, 100 and 1000 μg/mL compared to NC (* p < 0.05, ** p < 0.01, *** p < 0.001) in evaluations performed after 24, 48 and 72 h (Figure 1A).
Spheroids treated with 1, 5 and 10 μg/mL of DOX exhibited significant, concentration-dependent cytotoxicity at the evaluated time points. In contrast, 0.1 μg/mL only proved effective after 48 h of treatment (Figure 1B).
PTX inhibited spheroid viability at all three evaluated time points. In contrast, a concentration of 10 μg/mL only reduced viability after 72 h of treatment (Figure 1C). 5-FU produced significant cytotoxicity compared to the NC (* p < 0.05, ** p < 0.01, *** p < 0.001) and exhibited a concentration-dependent effect (0.01–10 μg/mL) at all three time points (Figure 1D). Cytotoxicity for FuLt and PTX showed an inverse relationship to concentration.

2.2. Half-Maximal Inhibitory Concentration (IC50)

The IC50 values for FuLt, DOX, PTX and 5-FU on 4T1 spheroids were determined at 24, 48 and 72 h using GraphPad Prism software (Table 1). The IC50 values were obtained based on the logarithm concentration of the treatments (µg/mL) versus the spheroids’ percentage cell viability (Figure 2). These values indicate the performance and cytotoxic potency of FuLt and the chemotherapeutic agents used. Potency is defined as the concentration of a compound required to produce a 50% reduction in cell viability. Therefore, the results from Table 1 can be expressed as PTX > 5-FU > DOX > FuLt.

2.3. Cytotoxic Effect Based on the Chou-Talalay Method

Cytotoxicity data were obtained by performing an MTT assay on each drug against TNBC 4T1 spheroids. Concentration-response curves were then generated using CompuSyn software version 1.0, and the following parameters were calculated: the drug-affected fraction (fa), the drug potency (Dm), the shape of the concentration-response curve (m) and the linear correlation coefficient (r), as described in the original equation by Chou and Talalay [25] (Table 2). Extended data are shown in the Supplementary Materials.
As shown in Table 2, all treatments inhibited cell growth. The Dm values (corresponding to the IC50) of FuLt, DOX, PTX and 5-FU for all time points evaluated are almost identical to those obtained using GraphPad Prism software.

2.4. SI for FuLt and Three Chemotherapeutics Against TNBC 4T1 Spheroids

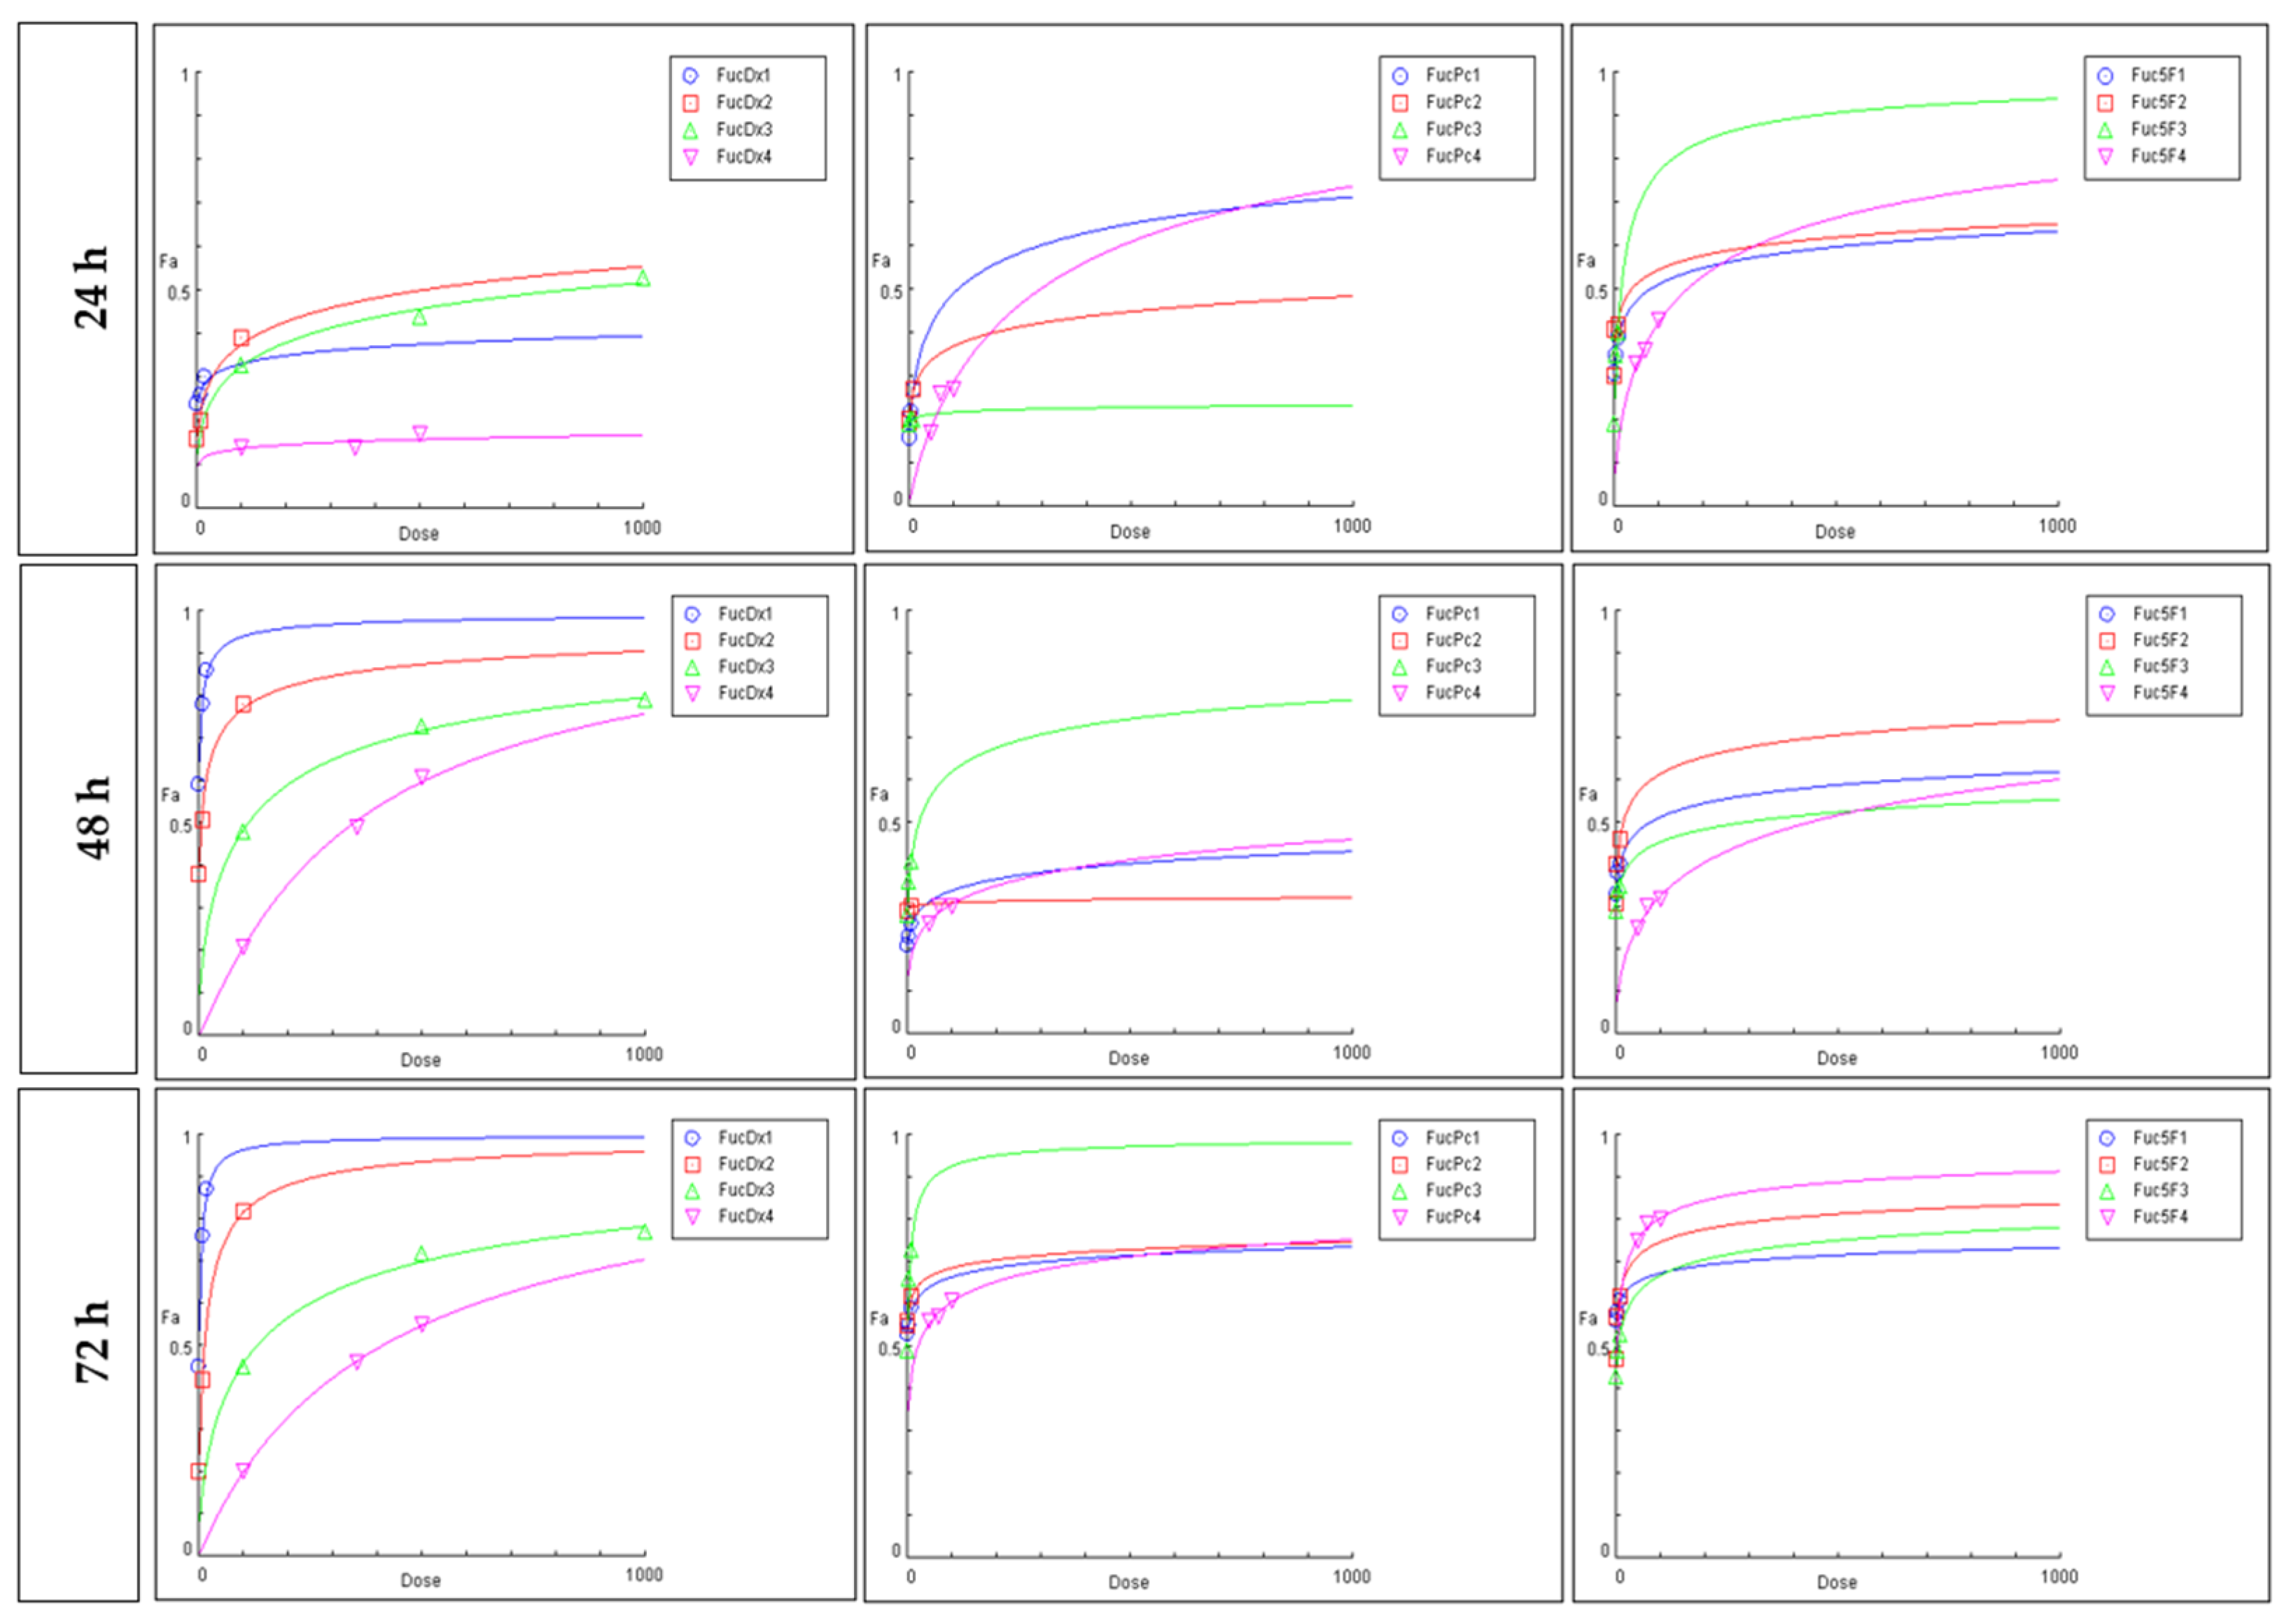
MTT cytotoxicity assays were performed for different binary combinations at three time points to provide an in vitro analysis of the pharmacological interaction (synergism, antagonism or additivity interactions) between FuLt and the selected antineoplastic agents. Figure 3 shows the concentration-response curves generated for each binary combination. In all cases, the curve was flat sigmoidal (m < 1), except for the 175:1 ratio for FuLt + DOX at 48 h of treatment. All r values of the curves were greater than 0.94, indicating compliance with the law of mass action, with r = 1 representing complete or ideal compliance [25].
Combination ratios were proposed based on the fa values of each treatment (Table 2). Three combination scenarios were considered for each chemotherapy drug and FuLt. Four experimental combination concentrations were selected and evaluated after 24, 48 and 72 h. The results are presented in Table 3, Table 4 and Table 5, and the raw data for each binary combination can be found in the Supplementary Materials.
Combinatorial concentrations with a synergistic effect (CI < 1) are numbered from one to twenty-five (superscript) in Table 3, Table 4 and Table 5. Six SIs were identified for FuLt + DOX, fourteen for FuLt + PTX, and five for FuLt + 5-FU.
Only SI3 and SI20 exhibited a synergistic effect at fa ≥ 0.5, suggesting a pharmacodynamic interaction that can inhibit 50% of spheroid-forming cells. Additionally, they have a DRI > 1 for at least one of their components. This suggests that, when combined, the concentrations of chemotherapeutic agents used with fucoidan are lower than those used in non-combination treatments. This makes SI3 and SI20 the most promising experimental SI.
At the same time, the CompuSyn software version 1.0 generates simulated combinatorial doses from the processed experimental data (Tables S1–S3). These tables summarise the simulated pharmacodynamic interactions with fa ≥ 0.5. Six simulated SI values were obtained for FuLt + DOX, five for FuLt + PTX, and two for FuLt + 5-FU. The sum of the experimental and simulated doses yielded twelve for FuLt + DOX, nineteen for FuLt + PTX, and seven for FuLt + 5-FU. FuLt + PTX is the most promising combination, presenting the highest number of SIs with lower total doses.
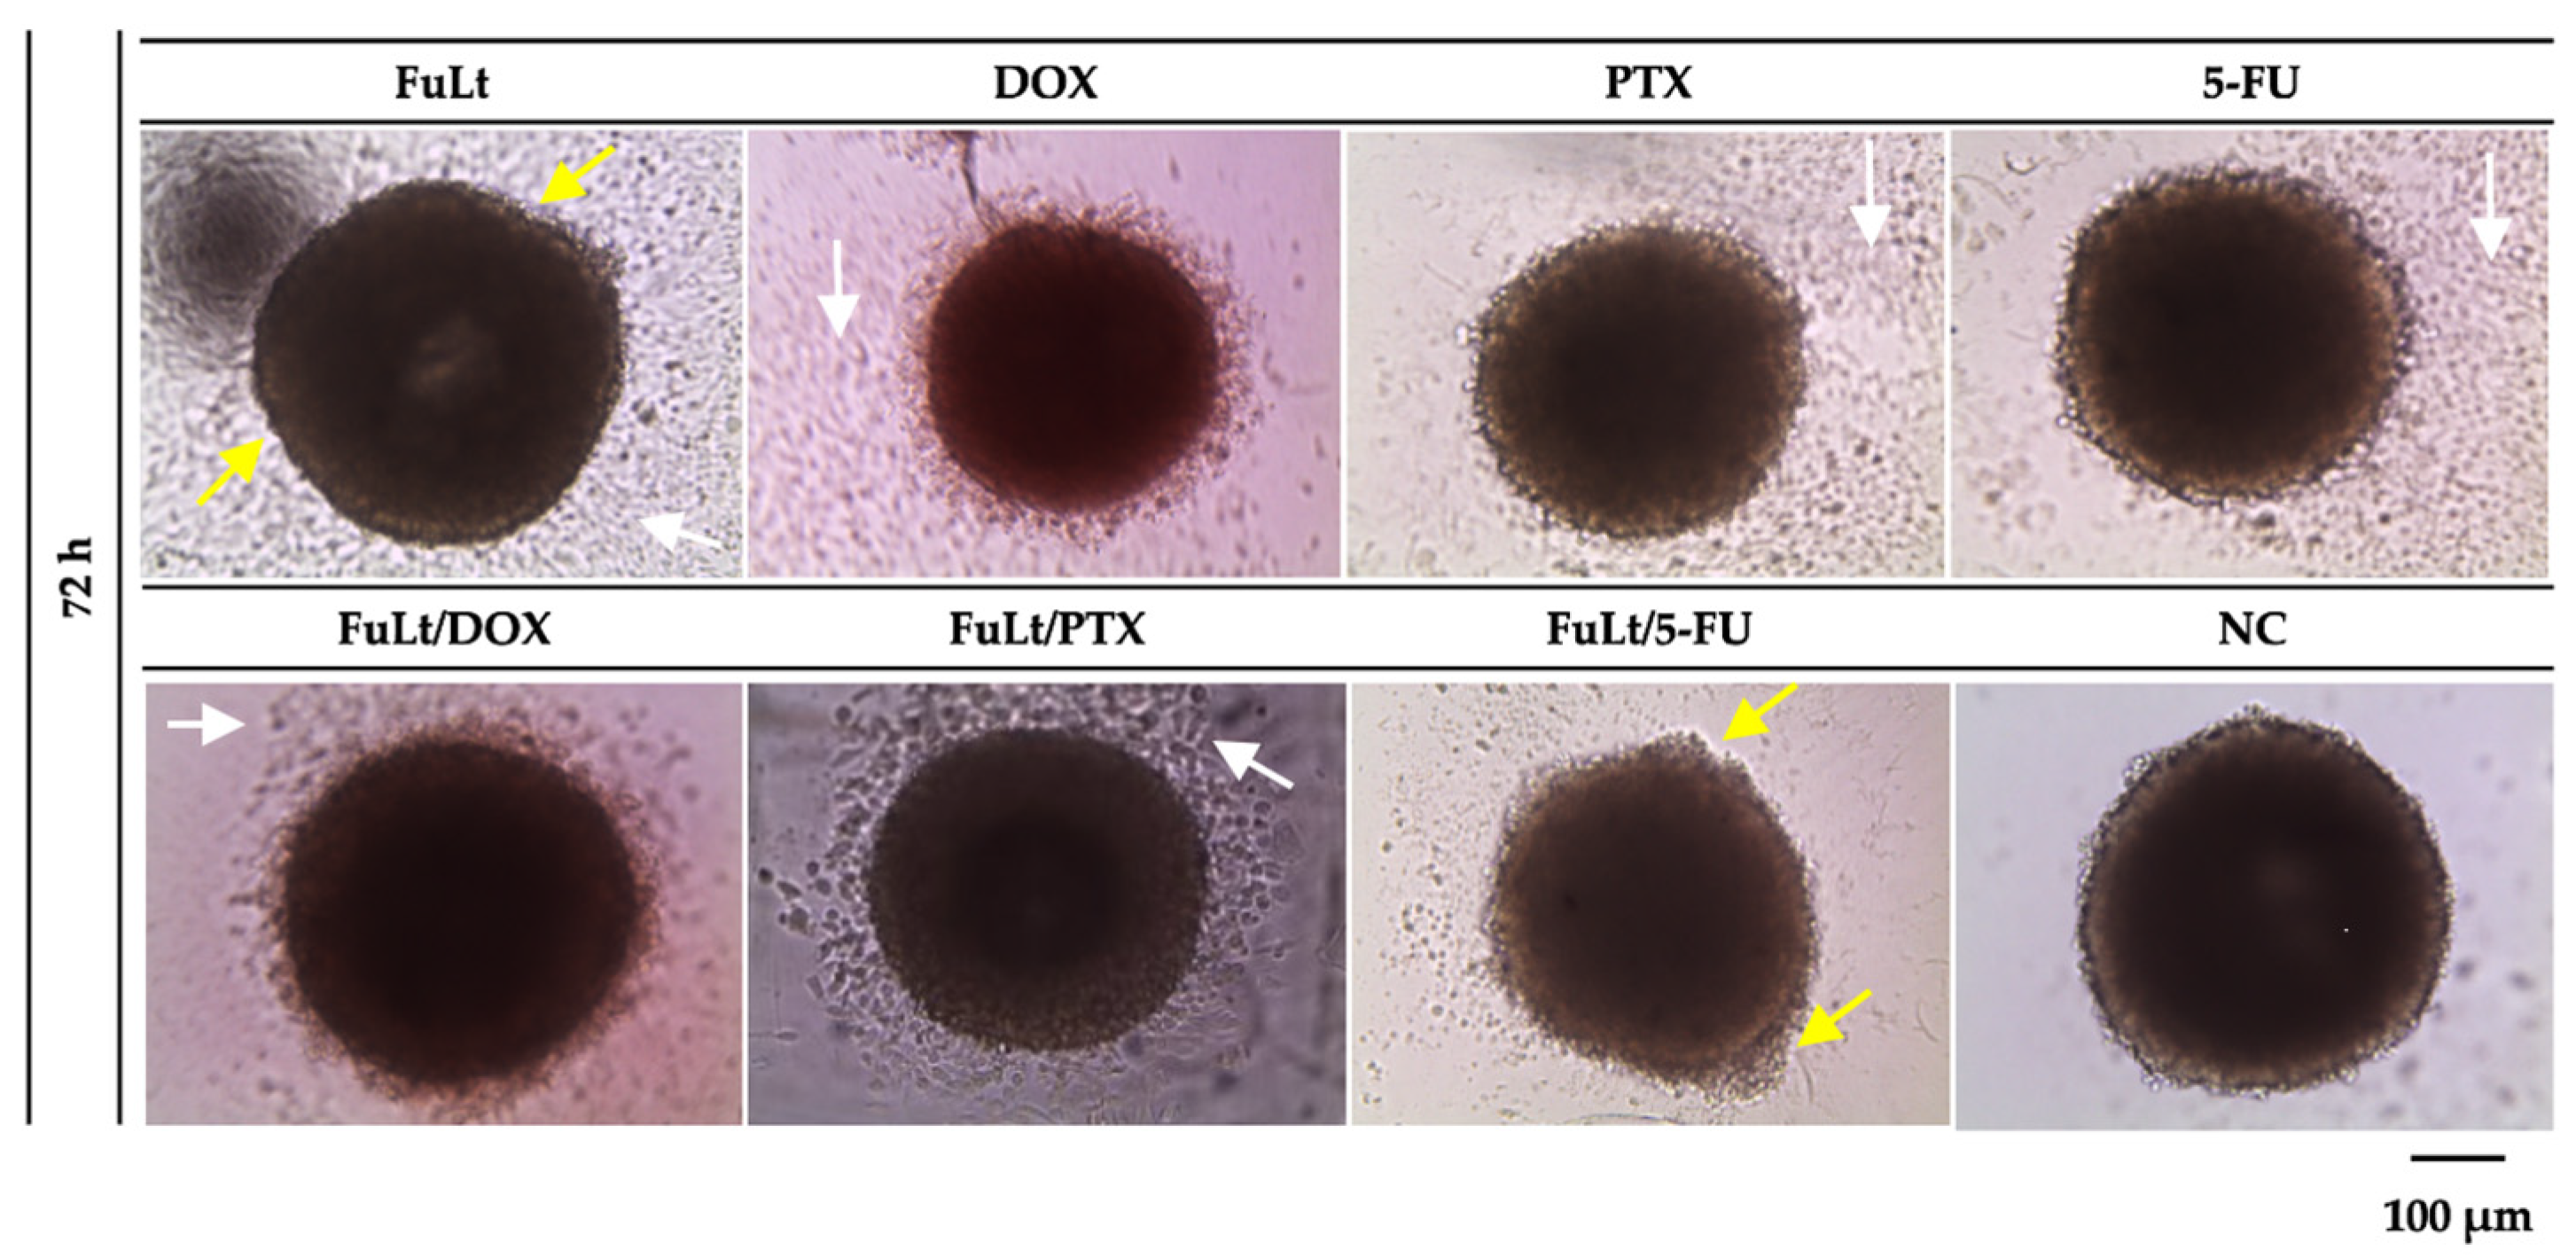
We observed the cytotoxic effects of the treatments applied using light microscopy. These effects included cell detachment from the spheroids and deformation of the spheroids themselves (Figure 4).

2.5. Oxidative Stress Caused by FuLt, Three Chemotherapeutic Agents and Three SIs in Homotypic and Heterotypic Spheroids

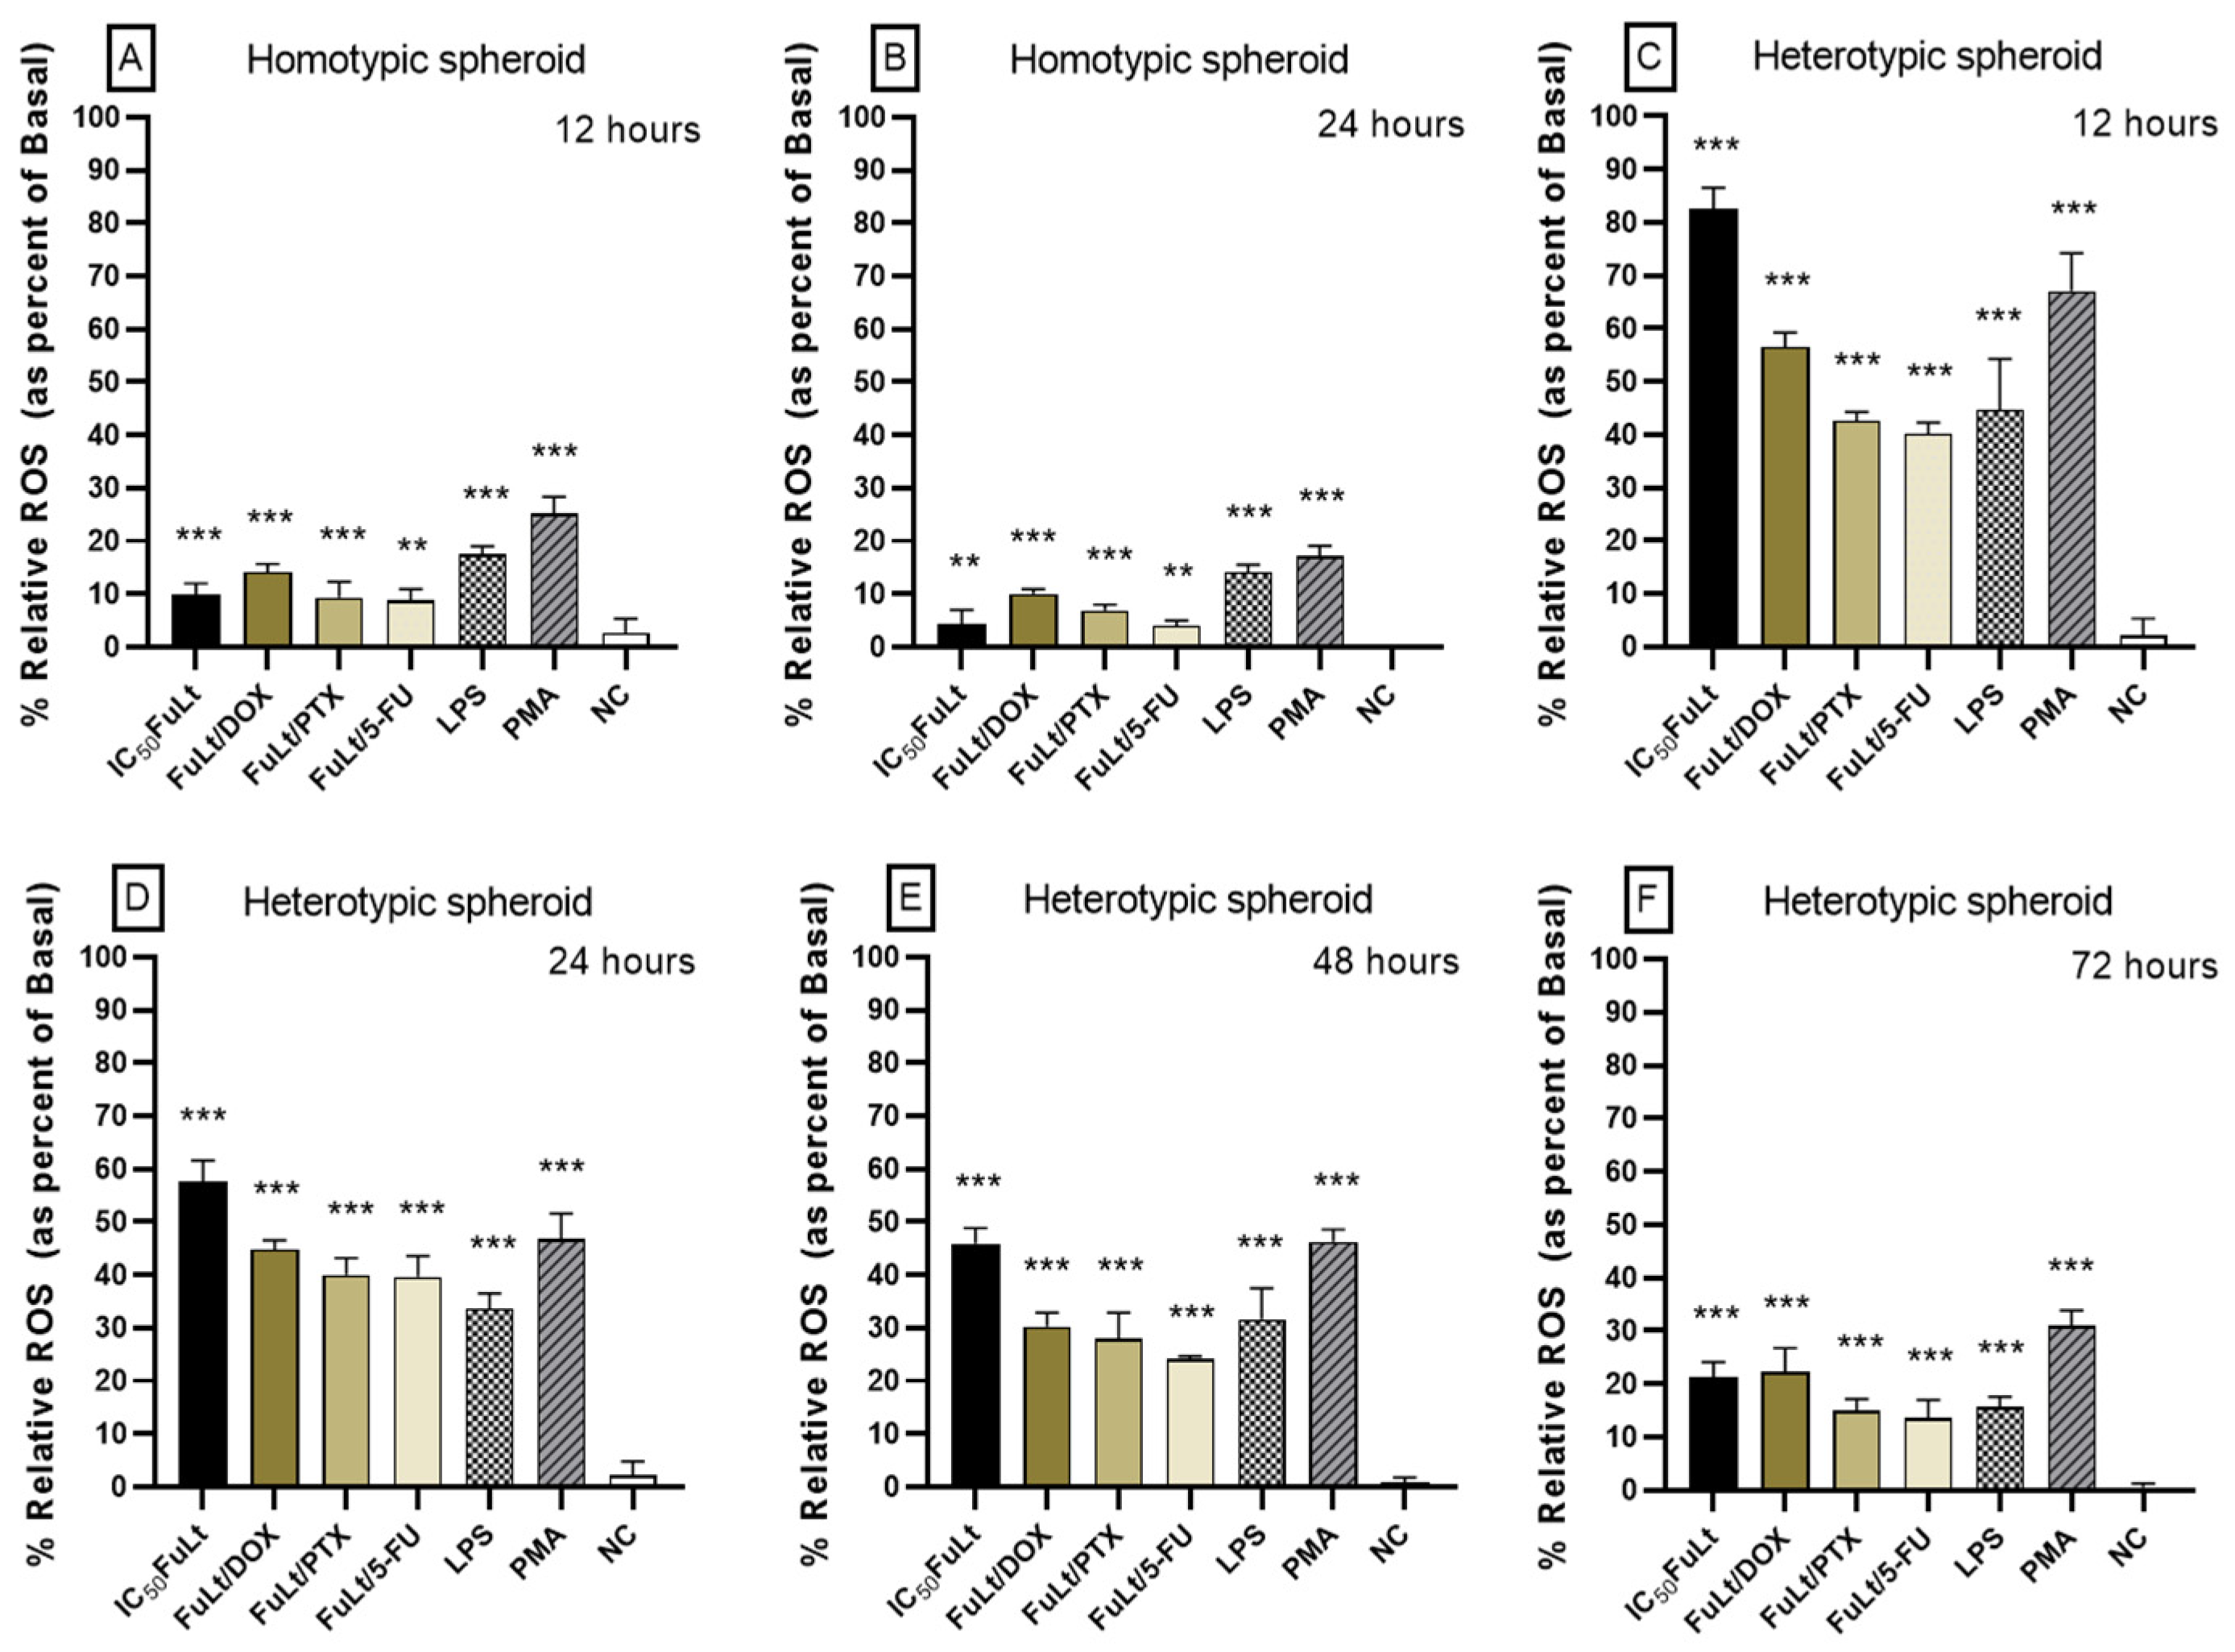
The relative production of ROS in homotypic spheroids (Figure 5A,B) treated with SI was higher after 12 h than after 24 h (p < 0.001 and p < 0.01, respectively). From 48 h onwards, low and insignificant amounts of ROS were produced compared to baseline production and were not plotted. In heterotypic spheroids (Figure 5C–F), ROS production decreased gradually from 12 to 72 h of treatment (p < 0.001). ROS production was higher in heterotypic spheroids than in homotypic spheroids.
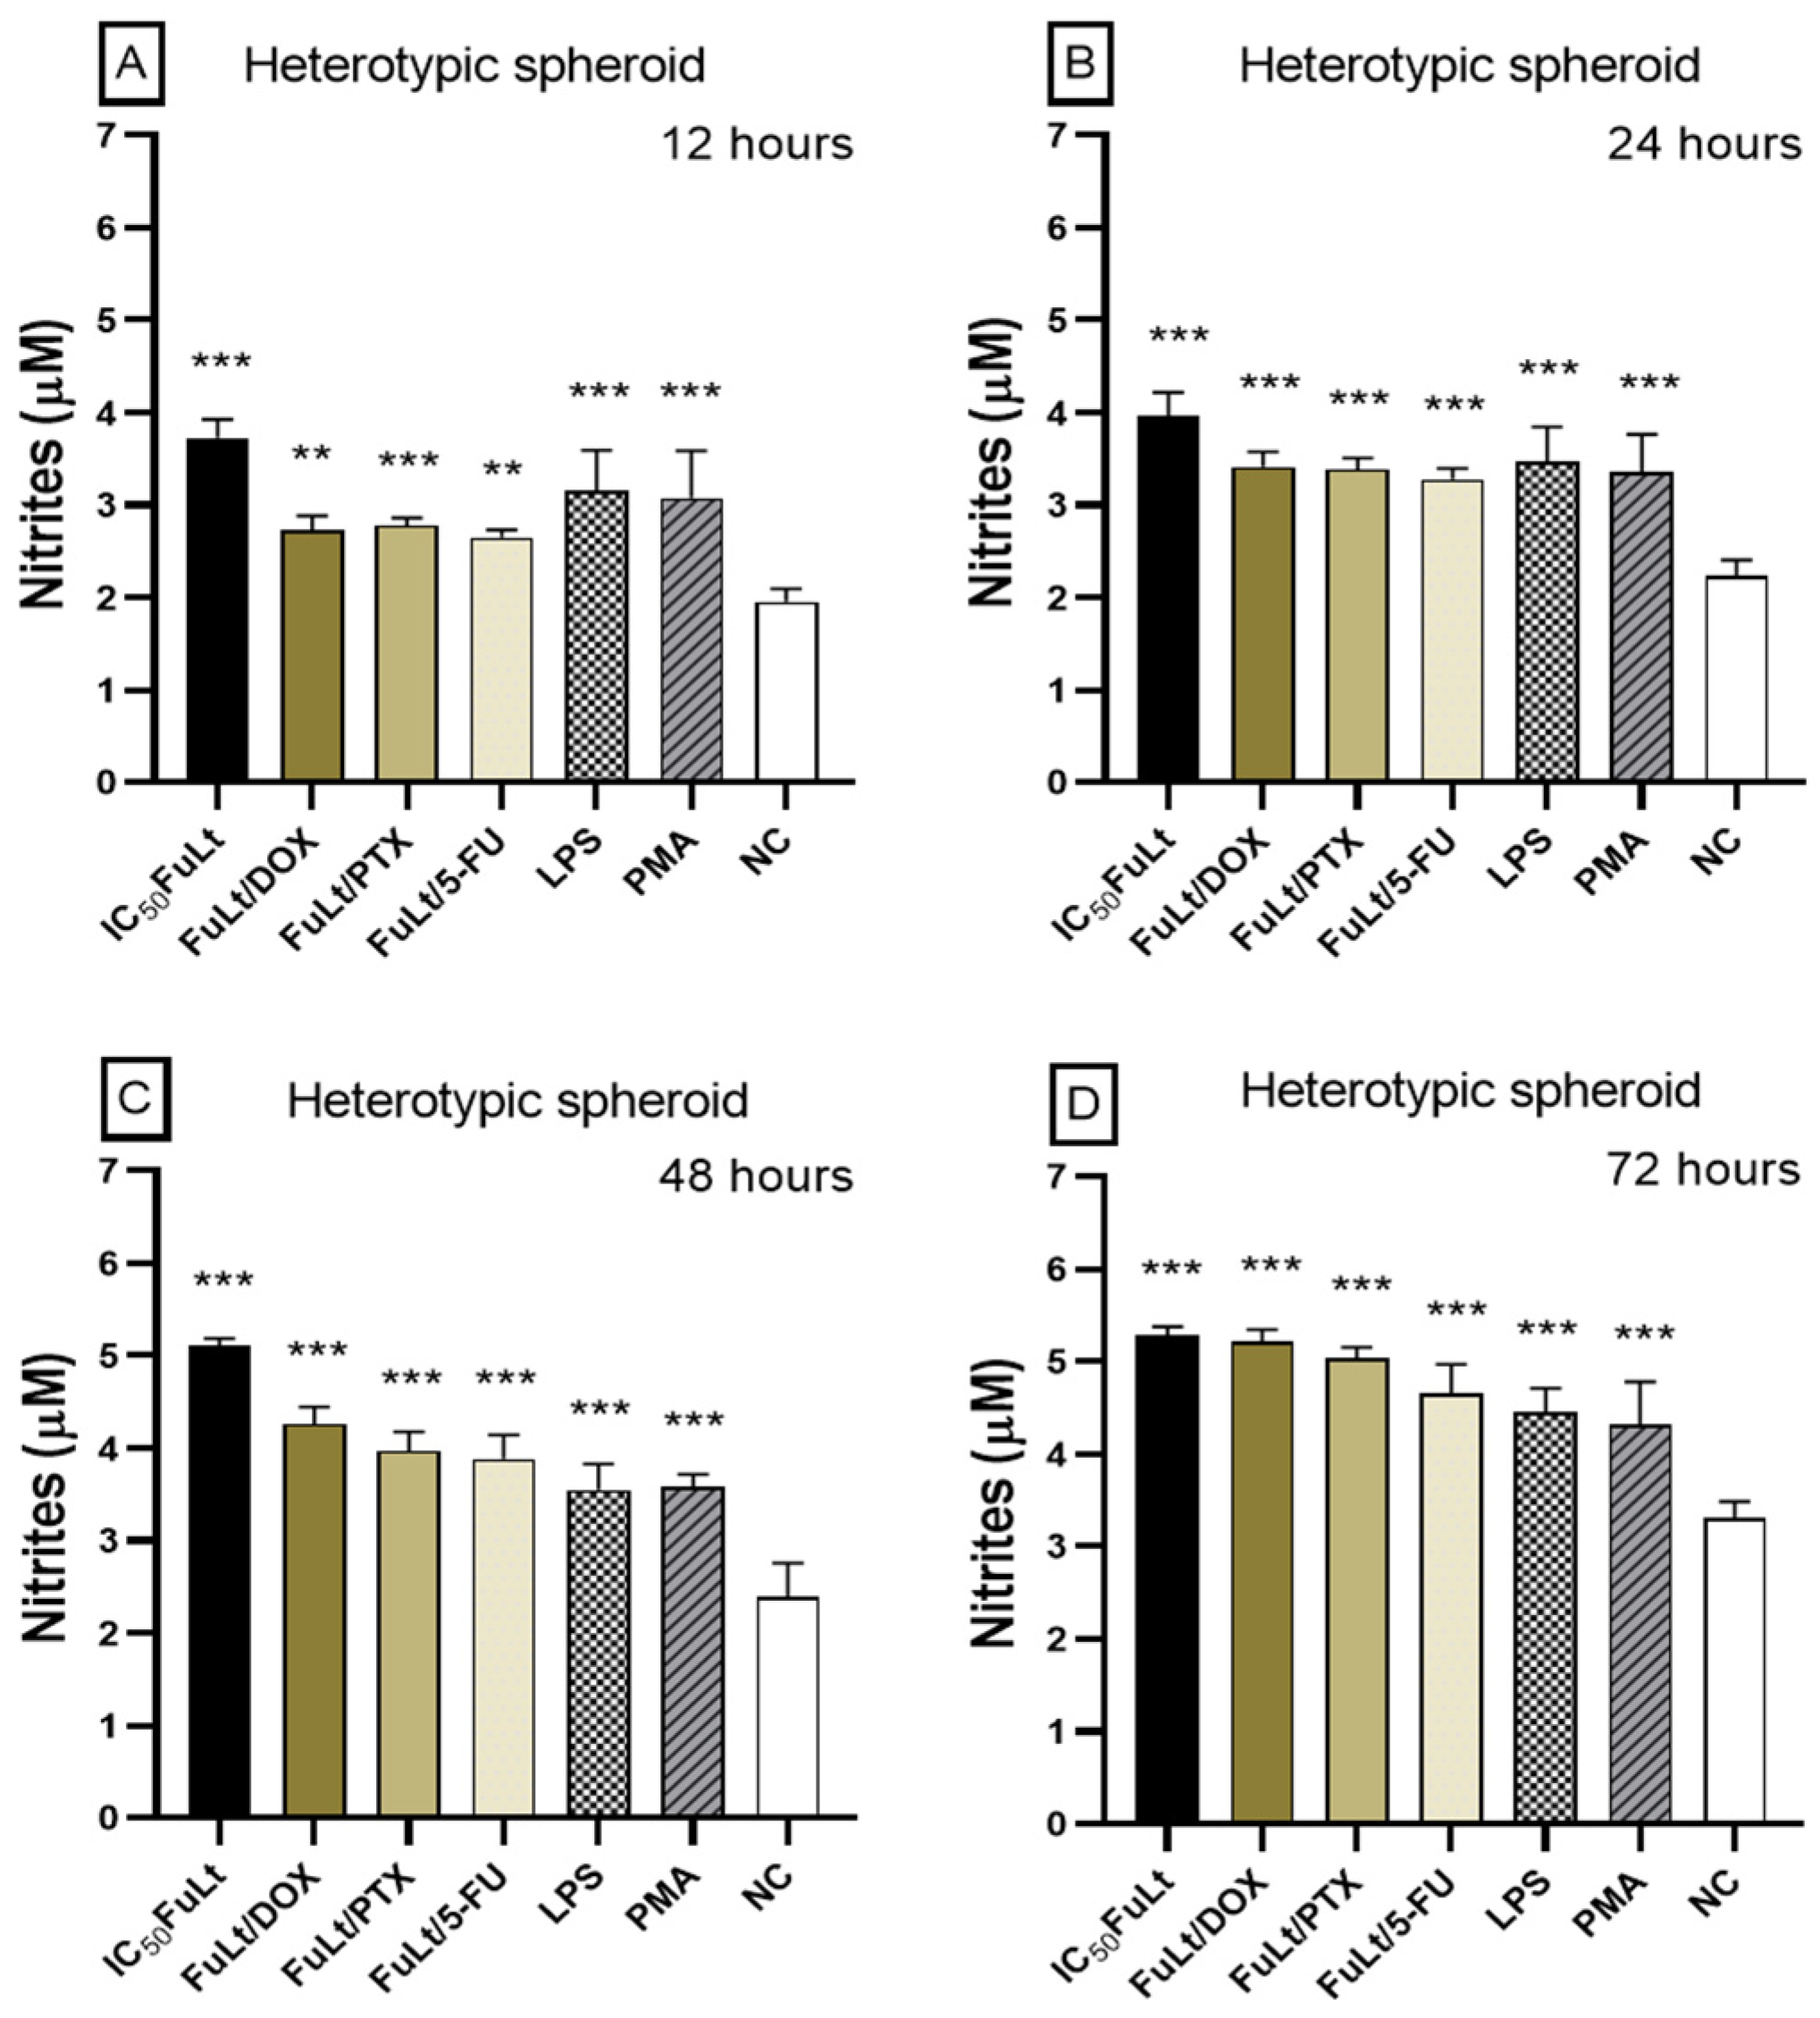
Furthermore, non-significant increase in nitric oxide (NO) was observed in homotypic spheroids treated with the SIs of the three chemotherapeutic agents. In heterotypic spheroids, the concentration of NO increased after 12 h, reaching its maximum after 72 h (Figure 6A–D) (p < 0.001 and p < 0.01). Additional assays with homotypic spheroids revealed an increase in NO with FuLt IC50 (p < 0.001) at 12, 24, 48 and 72 h (Figure S2).

3. Discussion

Accumulating evidence on the anticancer effects of fucoidans extracted from brown algae has prompted further study of FuLt [14,15,16]. This approach addresses one of the main challenges in treating this type of cancer: chemoresistance [29].
The cytotoxic potential of FuLt was evaluated individually in homotypic TNBC 4T1 spheroids. The observed cytotoxicity at concentrations between 1 and 1000 µg/mL is consistent with previous studies on fucoidans from other brown algal species against breast cancer cell. For example, studies on human breast cancer T-47D cells have reported similar results with Alaria sp., Saccharina japonica [30,31], and Undaria pinnatifida [31] at concentrations between 200 and 800 µg/mL. Fucoidan extracted from Undaria pinnatifida has been demonstrated to exhibit cytotoxic properties at 200 to 1000 µg/mL against MCF-7 cells [32]. Similarly, fucoidan derived from Fucus vesiculosus has been shown to exhibit cytotoxic properties against MDA-MB-231 cells at 90 to 120 µg/mL [33], 50 to 100 µg/mL [34], and 100 to 1600 µg/mL [22]. Fucoidan from F. vesiculosus (90 to 200 µg/mL) was cytotoxic against 4T1 cells [33,35,36]. And Fucoidan from Laminaria japonica (400 µg/mL) was cytotoxic against MDA-MB-231 cells [37]. All these studies were conducted in monolayer cultures. Previous studies by our research group revealed the cytotoxic effects of FuLt on 4T1 cell monolayers at concentrations of 1000–10,000 µg/mL [15,16], while concentrations of 1–10,000 µg/mL were effective in 4T1 spheroids [14]. Chen et al. reported Fucoidan from Laminaria japonica treatment prevented MDA-MB-231 mammosphere formation in a dose-dependent manner (500 to 1000 µg/mL) [37].
Chemical properties could be the reason for the differences in cytotoxic potency between fucoidans from different seaweed sources. The presence of sugars, the concentration and position of sulphated residues, and the molecular weight could all directly influence biological activity [31]. FuLt presents 59% of total sugars and 5.7% of sulphates. Mak et al. extracted fucoidan from Undaria pinnatifida (New Zealand) with a significantly higher sulphate content (15%) and a uronic acid content of 1.24%, but did not specify the total sugar content [32]. Hsu et al. [33], Chen et al. [34], Xue et al. [35,36] and Zhang et al. [22] all used a commercially available fucoidan from F. vesiculosus with a sulphation level of 7–11%. No data on total sugars were provided. Meanwhile, Chen et al. used fucoidan with a higher sulphate content (35.4%) [37]. Vishchuk et al. [31] observed a close relationship between the position and quantity of sulphate groups and the greater cytotoxic effect of fucoidan from U. pinnatifida (54% total sugars, 29% sulphates) relative to that from S. japonica (56% total sugars, 23% sulphates). The balance between moderate sulphate levels and a high total sugar content may be key to FuLt’s robust antitumor activity in the breast cancer model used, even though its sulphation level is lower compared to other extracts. However, further structural characterisation (e.g., of the specific sulphation pattern, branching, and monosaccharide distribution) is crucial to better understand the impact of these variables on its mechanism of action.
FuLt exhibited an inverse relationship between its concentrations and its cytotoxic activity. Lower concentrations were more cytotoxic than higher ones. This relationship was previously reported by Condori et al. in TNBC 4T1 spheroids [14]. One possible explanation is the hormesis effect, characterised by increased efficacy at low concentrations and reduced efficacy at higher doses [38]. This effect has been documented for analogues such as fucoxanthin in fibroblast monolayers [39], for compounds such as resveratrol in human umbilical vein endothelial monolayers [40], and for curcumin in both human bladder [41] and normal fibroblast monolayers [42].
A study investigating the effects of Fucus evanescens fucoidan on malignant melanoma SK-MEL-28 cells revealed significant differences in treatment outcomes between two- and three-dimensional cell cultures. The study revealed that fucoidan prevented proliferation of SK-MEL-28 cells in monolayer but had no effect on three-dimensional cell cultures [43]. The present study provides data on the anticancer efficacy of FuLt against TNBC 4T1 cells, which is comparable to that reported by other researchers [30,31,32,33,34,35,36,37]. The advantage of FuLt is that it is also effective in a three-dimensional 4T1 model.
Nováková et al. demonstrated the synergistic effect of fucoidan and glycosaminoglycans on the cytotoxicity of homotypic Hepa-1c1c7 hepatocellular carcinoma spheroids [44]. The literature does not describe any synergistic effects between FuLt and the three chemotherapeutic agents tested on 4T1 cells or other TNBC cell lines, but there are reports indicating increased toxicity when fucoidans from other brown algal species are combined with DOX on breast cancer cells such as MDA-MB-231 [21,22], 4T1 [21] and MCF-7 [22] in monolayer. However, antagonistic interactions between Fucus vesiculosus fucoidan and DOX have also been reported in breast, ovarian and cervical cancer cells [20]. These interactions were found using Tallarida’s method.
FuLt and PTX treatments produced the highest number of SI. Our finding is consistent with the observed synergy between fucoidan from Undaria pinnatifida and PTX, and fucoidan from Fucus vesiculosus and PTX, in ovarian, cervical, and different breast cancer cell lines in monolayer, as determined using Tallarida’s method [20]. Using the Jin method of the modified probability sum test [45], Obluchinskaya et al. also reported synergy between fucoidan from Fucus vesiculosus and PTX in HeLa G-63 cells [23]. Moreover, it has been demonstrated that different concentrations of fucoidan from Cladosiphon navae-caledoniae in combination with PTX increase the level of cytotoxicity in MDA-MB-231 and MCF-7 [46]. However, synergy was not calculated.
The study by Huang et al. involving human colorectal cancer cells revealed that the anticancer activity of Sargassum hemiphyllum fucoidan improved when combined with 5-FU [19]. Furthermore, a clinical trial involving patients with unresectable advanced colorectal cancer demonstrated that those who received Cladosiphon okamuranus fucoidan in combination with 5-FU and oxaliplatin experienced fewer chemotherapy-related adverse effects [24]. In both studies, the synergy of the treatments was not calculated. Our findings demonstrate that FuLt can interact synergistically with conventional chemotherapeutic drugs DOX, PTX and 5-FU. Identifying synergistic combinations using a quantitative approach strengthens the scientific basis for considering FuLt as an adjuvant in combination therapies, helping to overcome chemoresistance.
Three SIs were validated by quantifying ROS and NO in homotypic 4T1 spheroids and heterotypic (4T1 + splenocytes) spheroids. In homotypic spheroids, ROS production at 12 and 24 h would indicate the early activation of oxidative stress following treatment. The IS were validated by quantifying ROS and NO in both homotypic and heterotypic (4T1 + splenocytes) spheroids. ROS production was observed at 12 and 24 h in homotypic spheroids, indicating early activation of oxidative stress following exposure to the treatments. Studies using cell monolayers, such as that conducted by Banafa et al. on MCF-7 cells, have shown an increase in ROS production 24 h after fucoidan treatment from Fucus vesiculosus [47]. Similarly, Zhang et al. obtained a peak in ROS production at 30 min when using fucoidan from Cladosiphon novae-caledoniae on the same cell line, and demonstrated its relationship with the activation of MAPK and Bcl-2-dependent apoptotic pathways [48]. Fucoidan from Fucus vesiculosus has been reported to increase ROS in the following cell lines: ES-2 and OV-90 (ovarian cancer) [49]; CAL27 and Ca9-22 (oral carcinoma) [50]; and SKM-1 (leukaemia) [51].
Regarding combination treatment, Zhang et al. [46] used fucoidan from Cladosiphon novae-caledoniae and PTX, demonstrating an increase in ROS in MDA -MB-231 and MCF-7 monolayers after 48 h. However, the present study, which used both homotypic and heterotypic spheroids, observed ROS depletion after 48 h of treatment. This suggests either early oxidative activity and depletion at the time of quantification, or the activation of intracellular antioxidant systems by tumour cells [52].
In treatments involving three SIs on spheroids, heterotypic cells exhibited significantly higher ROS levels than homotypic cells after 12 and 24 h. This suggests that immune cells in the tumour microenvironment may be able to amplify the oxidative response. It has been demonstrated that activated splenocytes, which consist mainly of macrophages, neutrophils and T cells, increase the pro-oxidant component by producing hydrogen peroxide and superoxide [52], as well as cytokines such as IL-1β, IL-6 and TNF-α, which activate ROS-dependent cell death pathways [53]. Culturing human neutrophils with 10 µg/mL of fucoidan from Undaria pinnatifida increased the production of the pro-inflammatory cytokines IL-1β, IL-6, IL-8 and TNF-α after 24 h [54]. In murine macrophage cultures treated with 100 µg/mL of 98% pure commercial fucoidan, IL-1β production increased after 4 h [55]. Kar et al. found that ROS production increased in macrophages obtained ex vivo from mice infected with Leishmania donovani and subsequently treated with 50 µg/mL of fucoidan from F. vesiculosus for 48 h [56].
In addition to reactive oxygen species, other redox mediators, such as NO, which is an inducer of nitrosative stress, play a key role in the cellular response to stress. In the homotypic spheroid, evidence of a production profile from lower to higher NO concentration was only observed in the FuLt treatment between 12 and 72 h, which is related to the antitumor activity of fucoidan. Similarly, Jin et al. reported an increase in NO production after 48 h in human leukaemia cells treated with fucoidan (150 g/mL) from F. vesiculosus only [57]. In addition, they confirmed that fucoidan activates caspases 3, 8 and 9 in the presence of NO. This suggests that apoptosis is one of the mechanisms by which fucoidan induces cell death.
Similarly to our findings, the highest NO production occurred after 72 h of treatment with the three SI. Other authors have reported increased NO levels in mouse splenocytes treated with fucoidan from Undaria pinnatifida and Fucus vesiculosus after 48 h [58] and 96 h [59], respectively. The difference in our assays is that we used heterotypic spheroids, in which the immune cells present in the splenocytes that form part of the tumour immune microenvironment enhance the antitumor response [60]. In addition, these authors reported increased levels of IFN-γ, TNF-α and IL-6. The latter two of these cytokines are related to the induction of NO production [61].
Overall, the results obtained reveal a redox compensation phenomenon whereby sustained NO production indicates an immunomodulatory response that offsets the initial oxidative damage caused by ROS. This is due to the cytotoxicity exhibited by FuLt and the IC50 values of the three chemotherapeutic agents evaluated on homotypic and heterotypic spheroids.
Despite the promising results, the study has limitations. While it is important to determine the presence of certain secondary metabolites, such as polyphenols and terpenoids, the concentration of fucoidan used in the study due to the extraction method means that the antineoplastic effect can be attributed to this product. Although the FuLt used is ultrafiltrable, its molecular weight must be accurately determined. In vivo model trials should also evaluate the pharmacokinetics of FuLt, including parameters such as dissolution, bioavailability, distribution, metabolism and elimination.

4. Materials and Methods

4.1. Chemicals

According to data provided by Peruvian Seaweeds SA (PSW SA) (Lima, Peru), specimens of L. trabeculata were collected in San Nicolás Bay (15°15′39″ S, 75°13′47″ W), Marcona district, Nasca province, Peru. The fucoidan (FuLt) obtained from this seaweed was 83.4% pure and contained 59% of total sugars and 5.7% of sulphates. The cation content (g%g) was as follows: Na+ (0.71%), K+ (0.65%), Ca2+ (7.1%) and Mg2+ (0.33%). The fucoidan was obtained by acid extraction. The lyophilised fucoidan was dissolved in RPMI-1640 medium supplemented with 10% foetal bovine serum (cRPMI). It was then treated with ultrasound (Qsonica Q55 model) and sterilised by filtration using 0.22 µm membranes to produce ultrafiltrable fucoidan.
Reagents of analytical grade were purchased from Sigma-Aldrich (St. Louis, MO, USA): Doxorubicin hydrochloride (cat# D1515); paclitaxel (cat# T7191), 5-fluorouracil (cat# F6627), sodium bicarbonate (cat# S5761), penicillin–streptomycin solution (cat# P4333), Dimethyl sulfoxide (DMSO, cat# 472301), 3-(4,5-Dimethyl-2-thiazolyl)-2,5-diphenyl-2H-tetrazolium bromide (MTT reagent, cat# M5655), sodium pyruvate (cat# P5280), Nitro blue Tetrazolium Chloride (NBT, cat# N6876), lipopolysaccharides from Escherichia coli 0111:B4 (LPS, cat# L4130), and phorbol myristate acetate (PMA, cat# P1585).
Reagents purchased from GIBCO (New York, NY, USA) were RPMI-1640 (cat# 31800-022) and ACK lysis buffer (cat#A10492-01). Fetal Calf Serum (FCS) was purchased from Biowest (Bradenton, FL, USA, cat# S1620), Trypsin-EDTA was purchased from Pan Biotech (Aidenbach, Germany, cat# P10-023500), Amphotericin B was purchased from Gibco (Paris, France, cat# 15290018), Griess Reagent System was purchased from Promega (Fitchburg, WI, USA, cat# G2930), and Ketamine/xylacine Injectable Solution for veterinary use was purchased from Ket-A-Xyl® (Lima, Peru).

4.2. Animals

Six nulliparous female BALB/c mice, aged six weeks and weighing approximately 20 ± 2 g, were purchased from the Instituto Nacional de Salud (Lima, Peru) for the in vitro experiments. The mice were acclimatised for five days in the Biotherium of the Faculty of Biological Sciences (Universidad Nacional Mayor de San Marcos, Lima, Perú). They were fed water and food (commercial dry pellets for mice) ad libitum, and kept under consistent temperature conditions (23 ± 1 °C) and a 12:12 light/dark photoperiod.
The animals were anaesthetised with a lethal dose of 300 µL ketamine/xylacine (100 mg/20 mg/kg body weight). Their spleens were removed to isolate splenocytes for the formation of heterotypic spheroids. All experimental procedures adhered to the regulations for using laboratory animals, as outlined by the Bioethics Committee of Faculty of Biological Sciences (Code:059-2023-CBE-FCB-UNMSM, Universidad Nacional Mayor de San Marcos, Lima, Peru).

4.3. Cell Culture Conditions

The 4T1 cell line is an epithelial lineage which adheres to surfaces and is known to develop the characteristic triple-negative mammary tumour phenotype in mice. This cell line was obtained from the Cell Bank of Rio de Janeiro, Brazil (code BCRJ0022). The cells were cultivated in cRPMI consisting of 0.2% sodium bicarbonate, 1% sodium pyruvate, 1% penicillin–streptomycin and 0.05% amphotericin B, in accordance with standard culture conditions (37 °C, 95% humidity and 5% CO2).

4.4. Formation of 4T1 Homotypic Spheroids

The cells were cultured in cRPMI in round-bottom microplates (1 × 10⁴ cells per well), which were coated with 50 µL of 1.5% agarose for 15 min, using the liquid overlayer method [31]. The plates were then centrifuged at 2000 rpm for 5 min to facilitate cohesion and spheroid formation. The plates were then incubated for 96 h under standard conditions without replacing the medium.

4.5. Formation of the Heterotypic Spheroid

For this assay, splenocytes were extracted from mice according to the protocol described by Nilofar Danishmalik et al. [62]. The spleen was cut into small pieces, after which the resulting suspension was passed through a 70 µm cell strainer. Red blood cells were removed from the cell suspension using lysis buffer, after which the suspension was centrifuged at 1500 rpm with cRPMI to remove debris. The same conditions were used for culturing 1 × 10⁴ cells per well in a final volume of 200 µL as for homotypic spheroids. The microplates were then centrifuged at 2000 rpm for 5 min and incubated under the same conditions as the homotypic spheroids [14]. The entire procedure was performed under sterile conditions.

4.6. Viability Assay

The MTT reduction assay was used to analyse spheroids treated with FuLt and DOX, PTX or 5-FU. The FuLt dilutions used were 1, 10, 100 and 1000 μg/mL. For the chemotherapeutic agents, the dilutions were 0.01, 0.1, 0.5, 1, 5 and 10 μg/mL. The spheroids were incubated with FuLt, DOX, PTX or 5-FU at the specified concentrations for 24, 48 or 72 h under standard conditions. The results represent the mean of four spheroids per condition in three independent experiments.
Untreated spheroids were used as the negative control. 50 μg/mL of MTT was added to each well. The wells were incubated for a further 4 h, after which the formazan crystals were diluted with 100 μL of DMSO per well. All experiments were performed in quadruplicate. Absorbance was measured at 570 nm (with a 630 nm reference) using a BioTek Epoch 2 spectrophotometer (Winooski, VT, USA).

4.7. Determination of the Half-Maximal Inhibitory Concentration (IC50)

Cell viability was calculated as a percentage using the following formula:
C e l l   v i a b i l i t y   %   o f   c o n t r o l = 100 × A b s o r b a n c e   o f   t r e a t e d   s p h e r o i d s A b s o r b a n c e   o f   c o n t r o l   s p h e r o i d s
Concentration-effect inhibition curves were constructed from these values by plotting the logarithm of the concentrations against the percentage cell viability. The IC50 was obtained using GraphPad Prism software (version 8.01, San Diego, CA, USA) and the non-linear regression model.

4.8. Determining the Optimal Binary Combination Using the Chou-Talalay Method

The combination index (CI) indicates the type of drug–drug interaction that is occurring: CI = 1 represents an additive effect, CI < 1 represents a synergistic effect, and CI > 1 represents an antagonistic effect [19].
To determine whether the proposed treatments exhibit synergism, antagonism or additivity, the cytotoxicity data obtained in Section 4.4 were calculated individually using the following formula:
C y t o t o x i c i t y = 1 A b s o r b a n c e   o f   t r e a t e d   s p h e r o i d s A b s o r b a n c e   o f   b l a n k A b s o r b a n c e   o f   c o n t r o l   s p h e r o i d s   A b s o r b a n c e   o f   b l a n k
These data were entered into CompuSyn software version 1.0 (ComboSyn, Inc., Paramus, NJ, USA) to generate dose-effect curves showing the pharmacodynamic interactions of the two compounds, based on the median effect equation from the Chou–Talalay method.
f a f u = D D m m
fa corresponds to the fraction of the cells affected by the drug, and fu corresponds to the fraction of the cells unaffected by the drug (fu = 1 − fa). The ratio of the two is equal to the drug concentration or dose (D). Drug potency is represented by ‘Dm’, where ‘m’ represents the shape of the dose-effect curve (i.e., sigmoidal or hyperbolic) [20]. The degree of conformity of the data to the law of mass action is indicated by the r-value. If r = 1, this is known as ideal conformity [19].
The unified equation, the mean effect equation of the mass action law developed by Chou and Talalay, allows the derivation of more than 300 enzyme dynamics equations to be summarised [19], thus giving a mathematical basis for the effects shown by drugs used in combination.
Only the effective combinatorial doses produced by CompuSyn software version 1.0 that resulted in 50% cytotoxicity of the spheroids and were synergistic were chosen.

4.9. Oxidative Activity

To evaluate oxidative stress, one SI was selected for each combination of FuLt with a chemotherapeutic agent. SIs obtained at 72 h with fa ≥ 0.5 and DRI > 1 in at least one component were chosen. The SIs tested were: FuLt-DOX (ratio 1:1, total dose 2 µg/mL), FuLt-PTX (ratio 1:1, total dose 1 µL) and FuLt-5-FU (ratio 2:1, total dose 0.33 µL). Phosphatidylinositol myristoyl myo-inositol 3-phosphate 4-phosphatidylinositol (PMA) and Escherichia coli lipopolysaccharide (LPS) were used as oxidative stress inducers. The assays were performed using homotypic and heterotypic spheroids (one spheroid per well) for 72 h (n = 6).
ROS quantification was performed by NBT reduction, according to the method described by Blockhuys et al. The spheroids were transferred to a flat-bottomed microplate and washed twice with 150 µL of 1× PBS to remove any residual cRPMI. Then, 30 µL of NBT was added to each well and the plate was incubated at 37 °C for 120 min, protected from light. The plate was then washed with PBS and the formazan crystals dissolved with 120 µL of 2 M KOH and 140 µL of DMSO. Absorbance was measured at 630 nm [63]. The percentage of NBT reduction was calculated using the following formula:
%   N B T   c e l l   r e d u c t i o n = O D   s a m p l e O D   n e g a t i v e   c o n t r o l O D   n e g a t i v e   c o n t r o l ×   100
NO quantification was performed using the Griess method, following the manufacturer’s instructions. Fifty microlitres of supernatant were collected from each culture, and nitrite (NO2) production was measured. Nitrite is a stable metabolite derived from NO. Then, 50 μL of sulfanilamide solution was added and the mixture was incubated for 10 min, protected from light, at room temperature. A solution of 50 µL of NED (N-1-naphthylenediamine dihydrochloride) was added and the sample was incubated under the same conditions. Absorbance was measured using a spectrophotometer (Biotek EPOCH2) at 520 nm. The nitrite concentration was determined by interpolating the obtained values in the standard nitrite curve. Additional assays were performed to quantify the production of ROS and NO using the IC50 values of FuLt, DOX, PTX and 5-FU (Figures S1–S3).

4.10. Statistical Analysis

The data were analysed using GraphPad Prism 8.01 (San Diego, CA, USA). All results are representative of at least three independent experiments yielding similar results. Results are expressed as the mean ± SD. Statistical significance was assessed using a one-way for cytotoxicity assays and two-way ANOVA for oxidative assays. Differences were considered statistically significant when p < 0.05, represented as follows: *** p < 0.001, ** p < 0.01, * p < 0.05.

5. Conclusions

The present study demonstrated that FuLt acts synergistically with the chemotherapeutic agents DOX, PTX and 5-FU, significantly enhancing their anticancer activity and inhibiting the growth of homotypic spheroids. These combinations exhibited remarkable cytotoxic efficacy, inducing redox dynamics characterised by elevated ROS and NO production, particularly in heterotypic spheroids. In these models, immune cells present in splenocytes, such as macrophages, neutrophils, dendritic cells and lymphocytes, contribute to the formation of a tumour microenvironment that favours the activation of the immune response. The generation of ROS and NO supports the hypothesis that FuLt exerts an immunomodulatory effect in combination with the evaluated chemotherapeutic agents, with the potential to induce events compatible with immunogenic cell death. Together, these findings emphasise the therapeutic potential of FuLt and highlight the importance of exploring compounds derived from marine resources, such as L. trabeculata, for developing new cancer treatment strategies.

Supplementary Materials

The following supporting information can be downloaded at: https://www.mdpi.com/article/10.3390/md23120451/s1, Table S1. Resume of CI values simulated by CompuSyn software, version 1.0, for binary combinations of FuLt and DOX. Table S2. Resume of CI values simulated by CompuSyn software, version 1.0, for binary combinations of FuLt and PTX. Table S3. Resume of CI values simulated by CompuSyn software, version 1.0, for binary combinations of FuLt and 5-FU. Figure S1. Relative ROS production. Figure S2. Nitrites production in 4T1 homotypic spheroids treated with IC50 FuLt: Fucoidan from L. trabeculata (100 µg/mL). Figure S3. Nitrites production in heterotypic spheroids of splenocytes and 4T1 cells treated with IC50 FuLt: Fucoidan from L. trabeculata (100 µg/mL), IC50 DOX: doxorubicin (2 µg/mL), IC50 PTX: paclitaxel (0.5 µg/mL), and IC50 5-FU: 5-fluorouracil (0.5 µg/mL).

Author Contributions

Conceptualization, L.A.-G.; methodology, L.A.-G. and R.M.C.M.; writing—original draft preparation, R.M.C.M. and L.A.-G.; writing—review and editing, L.A.-G., R.M.C.M. and E.H.C.-V.; formal analysis, L.A.-G. and R.M.C.M.; software, R.M.C.M.; collection of experimental data, R.M.C.M., E.H.C.-V., R.T.C.R., L.I.P.C., J.O.C.G. and V.A.M.A.; project administration and funding acquisition, L.A.-G. All authors have read and agreed to the published version of the manuscript.

Funding

This research was funded by Universidad Nacional Mayor de San Marcos, project PCONFIGI code B24100451, and Multidisciplinary project code B2010002m.

Institutional Review Board Statement

This study was approved by Bioethics Committee of Faculty of Biological Sciences, Universidad Nacional Mayor de San Marcos (Lima, Perú) with Approval Code:059-2023-CBE-FCB-UNMSM. Approval Date: 13 December 2023.

Data Availability Statement

The authors declare that all relevant data supporting the findings of this study are available within the article and its Supplementary Materials files or from the corresponding authors upon request.

Acknowledgments

We would like to thank the company PSW S.A. for supplying us with Lessonia trabeculata fucoidan and for providing us with a technical data sheet detailing its composition.

Conflicts of Interest

The authors declare no competing interests. The authors are solely responsible for the content and writing of this article.

References

  1. Bray, F.; Laversanne, M.; Sung, H.; Ferlay, J.; Siegel, R.L.; Soerjomataram, I.; Jemal, A. Global cancer statistics 2022: GLOBOCAN estimates of incidence and mortality worldwide for 36 cancers in 185 countries. CA Cancer J. Clin. 2024, 74, 229–263. [Google Scholar] [CrossRef] [PubMed]
  2. Ferlay, J.; Ervik, M.; Lam, F.; Laversanne, M.; Colombet, M.; Mery, L.; Piñeros, M.; Znaor, A.; Soerjomataram, I.; Bray, F. Global Cancer Observatory: Cancer Today; International Agency for Research on Cancer: Lyon, France, 2024. [Google Scholar]
  3. Obidiro, O.; Battogtokh, G.; Akala, E.O. Triple Negative Breast Cancer Treatment Options and Limitations: Future Outlook. Pharmaceutics 2023, 15, 1796. [Google Scholar] [CrossRef]
  4. Qayoom, H.; Wani, N.A.; Alshehri, B.; Mir, M.A. An Insight into the Cancer Stem Cell Survival Pathways Involved in Chemoresistance in Triple-Negative Breast Cancer. Future Oncol. 2021, 17, 4185–4206. [Google Scholar] [CrossRef]
  5. Sritharan, S.; Sivalingam, N. A comprehensive review on time-tested anticancer drug doxorubicin. Life Sci. 2021, 278, 119527. [Google Scholar] [CrossRef]
  6. Škubník, J.; Svobodová Pavlíčková, V.; Ruml, T.; Rimpelová, S. Autophagy in cancer resistance to paclitaxel: Development of combination strategies. Biomed. Pharmacother. 2023, 161, 114458. [Google Scholar] [CrossRef]
  7. Valencia-Lazcano, A.A.; Hassan, D.; Pourmadadi, M.; Shamsabadipour, A.; Behzadmehr, R.; Rahdar, A.; Medina, D.I.; Díez-Pascual, A.M. 5-Fluorouracil nano-delivery systems as a cutting-edge for cancer therapy. Eur. J. Med. Chem. 2023, 246, 114995. [Google Scholar] [CrossRef]
  8. Zagami, P.; Carey, L.A. Triple negative breast cancer: Pitfalls and progress. NPJ Breast Cancer 2022, 8, 95. [Google Scholar] [CrossRef] [PubMed]
  9. Luque-Bolivar, A.; Pérez-Mora, E.; Villegas, V.E.; Rondón-Lagos, M. Resistance and Overcoming Resistance in Breast Cancer. Breast Cancer Targets Ther. 2020, 12, 211–229. [Google Scholar] [CrossRef]
  10. Wu, L.; Ye, K.; Jiang, S.; Zhou, G. Marine Power on Cancer: Drugs, Lead Compounds, and Mechanisms. Mar. Drugs 2021, 19, 488. [Google Scholar] [CrossRef]
  11. Shinde, P.; Banerjee, P.; Mandhare, A. Marine natural products as source of new drugs: A patent review (2015–2018). Expert. Opin. Ther. Pat. 2019, 29, 283–309. [Google Scholar] [CrossRef] [PubMed]
  12. Sanniyasi, E.; Gopal, R.K.; Damodharan, R.; Arumugam, A.; Sampath Kumar, M.; Senthilkumar, N.; Anbalagan, M. In vitro anticancer potential of laminarin and fucoidan from Brown seaweeds. Sci. Rep. 2023, 13, 14452. [Google Scholar] [CrossRef]
  13. Yu, H.; Zhang, Q.; Farooqi, A.A.; Wang, J.; Yue, Y.; Geng, L.; Wu, N. Opportunities and challenges of fucoidan for tumors therapy. Carbohydr. Polym. 2024, 324, 121555. [Google Scholar] [CrossRef]
  14. Condori-Macuri, R.; Gonzales, L.A.; Cruz-Riquelme, R.; Colona-Vallejos, E.C.V.E.; Chauca-Torres, N. Antitumor and immunomodulatory activity of fucoidan from the brown alga Lessonia trabeculata (Lessoniaceae) on breast cancer spheroids. Rev. Biol. Trop. 2023, 71, e54918. [Google Scholar] [CrossRef]
  15. Toccas-Salas, M.; Alzamora-Gonzales, L.; Colona-Vallejos, E.; Escobar-Guzmán, E.; Chávez, J.A.; Apumayta, E.V. Actividad citotóxica y antiproliferativa de un extracto rico en fucoidan de Lessonia trabeculata sobre células de adenocarcinoma mamario murino 4T1. An. Fac. Med. 2023, 84, 295–301. [Google Scholar] [CrossRef]
  16. Cruz Riquelme, R.T.; Colona-Vallejos, E.H.; Alzamora-Gonzales, L.; Condori Macuri, R.M. Fucoidan from Lessonia trabeculata Induces Apoptosis through Caspase Dependent and Caspase-Independent Activation in 4T1 Breast Adenocarcinoma In Vitro. Mar. Drugs 2024, 22, 251. [Google Scholar] [CrossRef]
  17. Yan, C.; Pan, M.; Geng, L.; Zhang, Q.; Hu, Y.; Wang, J.; Ye, S. A novel enzyme-assisted one-pot method for the extraction of fucoidan and alginate oligosaccharides from Lessonia trabeculata and their bioactivities. J. Oceanol. Limnol. 2024, 42, 1998–2012. [Google Scholar] [CrossRef]
  18. Colona-Vallejos, E.H.; Alzamora-Gonzales, L.; Chávez Pérez, J.; Apumayta Suárez, E.V.; Chang Avila, I. Incremento de la viabilidad, producción de especies reactivas de oxígeno, IL-1 y TNF-α en células mononucleares de sangre periférica humana tratadas con fucoidan de Lessonia trabeculata. Rev. Peru. Biol. 2019, 26, 291–300. [Google Scholar] [CrossRef]
  19. Huang, C.W.; Chen, Y.C.; Yin, T.C.; Chen, P.J.; Chang, T.K.; Su, W.C.; Ma, C.J.; Li, C.C.; Tsai, H.L.; Wang, J.Y. Low-Molecular-Weight Fucoidan as Complementary Therapy of Fluoropyrimidine-Based Chemotherapy in Colorectal Cancer. Int. J. Mol. Sci. 2021, 22, 8041. [Google Scholar] [CrossRef] [PubMed]
  20. Mathew, L.; Burney, M.; Gaikwad, A.; Nyshadham, P.; Nugent, E.K.; Gonzalez, A.; Smith, J.A. Preclinical Evaluation of Safety of Fucoidan Extracts from Undaria pinnatifida and Fucus vesiculosus for Use in Cancer Treatment. Integr. Cancer Ther. 2017, 16, 572–584. [Google Scholar] [CrossRef] [PubMed]
  21. Pawar, V.K.; Singh, Y.; Sharma, K.; Shrivastav, A.; Sharma, A.; Singh, A.; Meher, J.G.; Singh, P.; Raval, K.; Kumar, A.; et al. Improved chemotherapy against breast cancer through immunotherapeutic activity of fucoidan decorated electrostatically assembled nanoparticles bearing doxorubicin. Int. J. Biol. Macromol. 2019, 122, 1100–1114. [Google Scholar] [CrossRef]
  22. Zhang, N.; Xue, M.; Wang, Q.; Liang, H.; Yang, J.; Pei, Z.; Qin, K. Inhibition of fucoidan on breast cancer cells and potential enhancement of their sensitivity to chemotherapy by regulating autophagy. Phytother. Res. 2021, 35, 6904–6917. [Google Scholar] [CrossRef]
  23. Obluchinskaya, E.D.; Pozharitskaya, O.N.; Lapina, I.M.; Kulminskaya, A.A.; Zhurishkina, E.V.; Shikov, A.N. Comparative Evaluation of Dynamic Maceration and Ultrasonic Assisted Extraction of Fucoidan from Four Arctic Brown Algae on Its Antioxidant and Anticancer Properties. Mar. Drugs 2025, 23, 230. [Google Scholar] [PubMed]
  24. Ikeguchi, M.; Yamamoto, M.; Arai, Y.; Maeta, Y.; Ashida, K.; Katano, K.; Miki, Y.; Kimura, T. Fucoidan reduces the toxicities of chemotherapy for patients with unresectable advanced or recurrent colorectal cancer. Oncol. Lett. 2011, 2, 319–322. [Google Scholar] [CrossRef] [PubMed]
  25. Chou, T.C. Drug Combination Studies and Their Synergy Quantification Using the Chou-Talalay Method. Cancer Res. J. 2010, 70, 440–446. [Google Scholar] [CrossRef] [PubMed]
  26. Mijatović, S.; Savić-Radojević, A.; Plješa-Ercegovac, M.; Simić, T.; Nicoletti, F.; Maksimović-Ivanić, D. The Double-Faced Role of Nitric Oxide and Reactive Oxygen Species in Solid Tumors. Antioxidants 2020, 9, 374. [Google Scholar] [CrossRef]
  27. Huang, R.; Chen, H.; Liang, J.; Li, Y.; Yang, J.; Luo, C.; Tang, Y.; Ding, Y.; Liu, X.; Yuan, Q.; et al. Dual Role of Reactive Oxygen Species and their Application in Cancer Therapy. J. Cancer 2021, 12, 5543–5561. [Google Scholar] [CrossRef]
  28. Jiang, W.; Dong, W.; Li, M.; Guo, Z.; Wang, Q.; Liu, Y.; Bi, Y.; Zhou, H.; Wang, Y. Nitric Oxide Induces Immunogenic Cell Death and Potentiates Cancer Immunotherapy. ACS Nano 2022, 16, 3881–3894. [Google Scholar] [CrossRef]
  29. Lee, J. Current Treatment Landscape for Early Triple-Negative Breast Cancer (TNBC). J. Clin. Med. 2023, 12, 1524. [Google Scholar] [CrossRef]
  30. Vishchuk, O.S.; Tarbeeva, D.V.; Ermakova, S.P.; Zvyagintseva, T.N. Structural Characteristics and Biological Activity of Fucoidans from the Brown Algae Alaria sp. and Saccharina japonica of Different Reproductive Status. Chem. Biodivers. 2012, 9, 817–828. [Google Scholar] [CrossRef]
  31. Vishchuk, O.S.; Ermakova, S.P.; Zvyagintseva, T.N. Sulfated polysaccharides from brown seaweeds Saccharina japonica and Undaria pinnatifida: Isolation, structural characteristics, and antitumor activity. Carbohydr. Res. 2011, 346, 2769–2776. [Google Scholar] [CrossRef]
  32. Mak, W.; Wang, S.K.; Liu, T.; Hamid, N.; Li, Y.; Lu, J.; White, W.L. Anti-Proliferation Potential and Content of Fucoidan Extracted from Sporophyll of New Zealand Undaria pinnatifida. Front. Nutr. 2014, 1, 9. [Google Scholar] [CrossRef]
  33. Hsu, H.Y.; Lin, T.Y.; Hwang, P.A.; Tseng, L.M.; Chen, R.H.; Tsao, S.M.; Hsu, J. Fucoidan induces changes in the epithelial to mesenchymal transition decreases metastasis by enhancing ubiquitin-dependent TGFβ receptor degradation in breast cancer. J. Carcinog. 2013, 34, 874–884. [Google Scholar] [CrossRef] [PubMed]
  34. Chen, S.; Zhao, Y.; Zhang, Y.; Zhang, D. Fucoidan induces cancer cell apoptosis by modulating the endoplasmic reticulum stress cascades. PLoS ONE 2014, 9, e108157. [Google Scholar] [CrossRef]
  35. Xue, M.; Ge, Y.; Zhang, J.; Wang, Q.; Hou, L.; Liu, Y.; Sun, L.; Li, Q. Anticancer Properties Mechanisms of Fucoidan on Mouse Breast Cancer In Vitro In Vivo. PLoS ONE 2012, 7, e43483. [Google Scholar] [CrossRef]
  36. Xue, M.; Ge, Y.; Zhang, J.; Liu, Y.; Wang, Q.; Hou, L.; Zheng, Z. Fucoidan Inhibited 4T1 Mouse Breast Cancer Cell Growth In Vivo and In Vitro Via Downregulation of Wnt/β-Catenin Signaling. Nutr. Cancer 2013, 65, 460–468. [Google Scholar] [CrossRef]
  37. Chen, L.M.; Yang, P.P.; Al Haq, A.T.; Hwang, P.A.; Lai, Y.C.; Weng, Y.S.; Chen, M.A.; Hsu, H.L. Oligo-Fucoidan supplementation enhances the effect of Olaparib on preventing metastasis and recurrence of triple-negative breast cancer in mice. J. Biomed. Sci. 2022, 29, 70. [Google Scholar] [CrossRef] [PubMed]
  38. Schirrmacher, V. Less Can Be More: The Hormesis Theory of Stress Adaptation in the Global Biosphere and Its Implications. Biomedicines 2021, 9, 293. [Google Scholar] [CrossRef] [PubMed]
  39. Denis, E.; Papurina, T.; Koliada, A.; Vaiserman, A. Evaluation of the Stimulating and Protective Effects of Fucoxanthin Against Human Skin Fibroblasts: An In Vitro Study. Res. Ther. 2019, 2, 124. [Google Scholar]
  40. Posadino, A.M.; Giordo, R.; Cossu, A.; Nasrallah, G.K.; Shaito, A.; Abou-Saleh, H.; Eid, A.H.; Pintus, G. Flavin Oxidase-Induced ROS Generation Modulates PKC Biphasic Effect of Resveratrol on Endothelial Cell Survival. Biomolecules 2019, 9, 209. [Google Scholar] [CrossRef]
  41. Kamat, A.M.; Sethi, G.; Aggarwal, B.B. Curcumin potentiates the apoptotic effects of chemotherapeutic agents and cytokines through down-regulation of nuclear factor-kappaB and nuclear factor-kappaB-regulated gene products in IFN-alpha-sensitive and IFN-alpha-resistant human bladder cancer cells. Mol. Cancer Ther. 2007, 6, 1022–1030. [Google Scholar] [CrossRef]
  42. Lima, C.F.; Pereira-Wilson, C.; Rattan, S.I.S. Curcumin induces heme oxygenase-1 in normal human skin fibroblasts through redox signaling: Relevance for anti-aging intervention. Mol. Nutr. Food Res. 2011, 55, 430–442. [Google Scholar] [CrossRef]
  43. Malyarenko, O.S.; Malyarenko, T.V.; Usoltseva, R.V.; Silchenko, A.S.; Kicha, A.A.; Ivanchina, N.V.; Ermakova, S.P. Fucoidan from brown algae Fucus evanescens potentiates the anti-proliferative efficacy of asterosaponins from starfish Asteropsis carinifera in 2D and 3D models of melanoma cells. Int. J. Biol. Macromol. 2021, 185, 31–39. [Google Scholar] [CrossRef] [PubMed]
  44. Nováková, E.; Zima, J.; Špaglová, M.; Labudová, M.; Šupolíková, M. Synergistic Antiproliferative Effects of Chondroitin Sulfate and Fucoidan in Tumor-derived Spheroids: Insights From a 3D Cell Culture Approach. Eur. Pharm. J. 2025, 71, 25–33. [Google Scholar] [CrossRef]
  45. Jin, Z.J. About the evaluation of drug combination. Acta Pharmacol. Sin. 2004, 25, 146–147. [Google Scholar]
  46. Zhang, Z.; Teruya, K.; Yoshida, T.; Eto, H.; Shirahata, S. Fucoidan Extract Enhances the Anti-Cancer Activity of Chemotherapeutic Agents in MDA-MB-231 and MCF-7 Breast Cancer Cells. Mar. Drugs 2013, 11, 81–98. [Google Scholar] [CrossRef]
  47. Banafa, A.M.; Roshan, S.; Liu, Y.Y.; Chen, H.J.; Chen, M.J.; Yang, G.X.; He, G.Y. Fucoidan induces G1 phase arrest and apoptosis through caspases-dependent pathway and ROS induction in human breast cancer MCF-7 cells. J. Huazhong Univ. Sci. Technol. Med. Sci. 2013, 33, 717–724. [Google Scholar] [CrossRef]
  48. Zhang, Z.; Teruya, K.; Eto, H.; Shirahata, S. Fucoidan Extract Induces Apoptosis in MCF-7 Cells via a Mechanism Involving the ROS-Dependent JNK Activation and Mitochondria-Mediated Pathways. PLoS ONE 2011, 6, e27441. [Google Scholar] [CrossRef]
  49. Bae, H.; Lee, J.Y.; Yang, C.; Song, G.; Lim, W. Fucoidan Derived from Fucus vesiculosus Inhibits the Development of Human Ovarian Cancer via the Disturbance of Calcium Homeostasis, Endoplasmic Reticulum Stress, and Angiogenesis. Mar. Drugs 2020, 18, 45. [Google Scholar] [CrossRef]
  50. Shiau, J.P.; Chuang, Y.T.; Yang, K.H.; Chang, F.R.; Sheu, J.H.; Hou, M.F.; Jeng, J.H.; Tang, J.Y.; Chang, H.W. Brown Algae-Derived Fucoidan Exerts Oxidative Stress-Dependent Antiproliferation on Oral Cancer Cells. Antioxidants 2022, 11, 841. [Google Scholar] [CrossRef] [PubMed]
  51. Wei, C.; Xiao, Q.; Kuang, X.; Zhang, T.; Yang, Z.; Wang, L. Fucoidan inhibits proliferation of the SKM-1 acute myeloid leukaemia cell line via the activation of apoptotic pathways and production of reactive oxygen species. Mol. Med. Rep. 2015, 12, 6649. [Google Scholar] [CrossRef] [PubMed]
  52. Jelic, M.D.; Mandic, A.D.; Maricic, S.M.; Srdjenovic, B.U. Oxidative stress and its role in cancer. J. Cancer Res. Ther. 2021, 17, 22. [Google Scholar] [CrossRef]
  53. Yu, W.; Tu, Y.; Long, Z.; Liu, J.; Kong, D.; Peng, J.; Wu, H.; Zheng, G.; Zhao, J.; Chen, Y.; et al. Reactive Oxygen Species Bridge the Gap between Chronic Inflammation and Tumor Development. Oxidative Med. Cell. Longev. 2022, 2022, 2606928. [Google Scholar] [CrossRef] [PubMed]
  54. Jin, J.O.; Yu, Q. Fucoidan delays apoptosis and induces pro-inflammatory cytokine production in human neutrophils. Int. J. Biol. Macromol. 2015, 73, 65–71. [Google Scholar] [CrossRef] [PubMed]
  55. Li, H.; Liu, Y.; Teng, Y.; Zheng, Y.; Zhang, M.; Wang, X.; Cheng, H.; Xu, J.; Chen, X.; Zhao, X.; et al. Enhancement of seaweed polysaccharides (fucoidan and laminarin) on the phagocytosis of macrophages via activation of intelectin in blunt snout bream (Megalobrama amblycephala). Front. Mar. Sci. 2023, 10, 1124880. [Google Scholar] [CrossRef]
  56. Kar, S.; Sharma, G.; Das, P.K. Fucoidan cures infection with both antimony-susceptible and -resistant strains of Leishmania donovani through Th1 response and macrophage-derived oxidants. J. Antimicrob. Chemother. 2011, 66, 618–625. [Google Scholar] [CrossRef]
  57. Jin, J.O.; Song, M.G.; Kim, Y.N.; Park, J.I.; Kwak, J.Y. The mechanism of fucoidan-induced apoptosis in leukemic cells: Involvement of ERK1/2, JNK, glutathione, and nitric oxide. Mol. Carcinog. 2010, 49, 771–782. [Google Scholar] [CrossRef]
  58. Jang, J.Y.; Moon, S.Y.; Joo, H.G. Differential effects of fucoidans with low and high molecular weight on the viability and function of spleen cells. Food Chem. Toxicol. 2014, 68, 234–238. [Google Scholar] [CrossRef]
  59. Choi, E.; Kim, A.; Kim, Y.; Hwang, J. Immunomodulating activity of arabinogalactan and fucoidan in vitro. J. Med. Food 2005, 8, 446–453. [Google Scholar] [CrossRef]
  60. Rajbhandary, S.; Dhakal, H.; Shrestha, S. Tumor immune microenvironment (TIME) to enhance antitumor immunity. Eur. J. Med. Res. 2023, 28, 169. [Google Scholar] [CrossRef]
  61. Morris, R.M.; Mortimer, T.O.; O’Neill, K.L. Cytokines: Can Cancer Get the Message? Cancers 2022, 14, 2178. [Google Scholar] [CrossRef]
  62. Nilofar Danishmalik, S.; Lee, S.H.; Sin, J.I. Tumor regression is mediated via the induction of HER263-71- specific CD8+ CTL activity in a 4T1.2/HER2 tumor model: No involvement of CD80 in tumor control. Oncotarget 2017, 8, 26771–26788. [Google Scholar] [CrossRef] [PubMed]
  63. Blockhuys, S.; Vanhoecke, B.; Smet, J.; De Paepe, B.; Van Coster, R.; Bracke, M.; De Wagter, C. Unraveling the mechanisms behind the enhanced MTT conversion by irradiated breast cancer cells. Radiat. Res. 2013, 179, 433–443. [Google Scholar] [CrossRef] [PubMed]
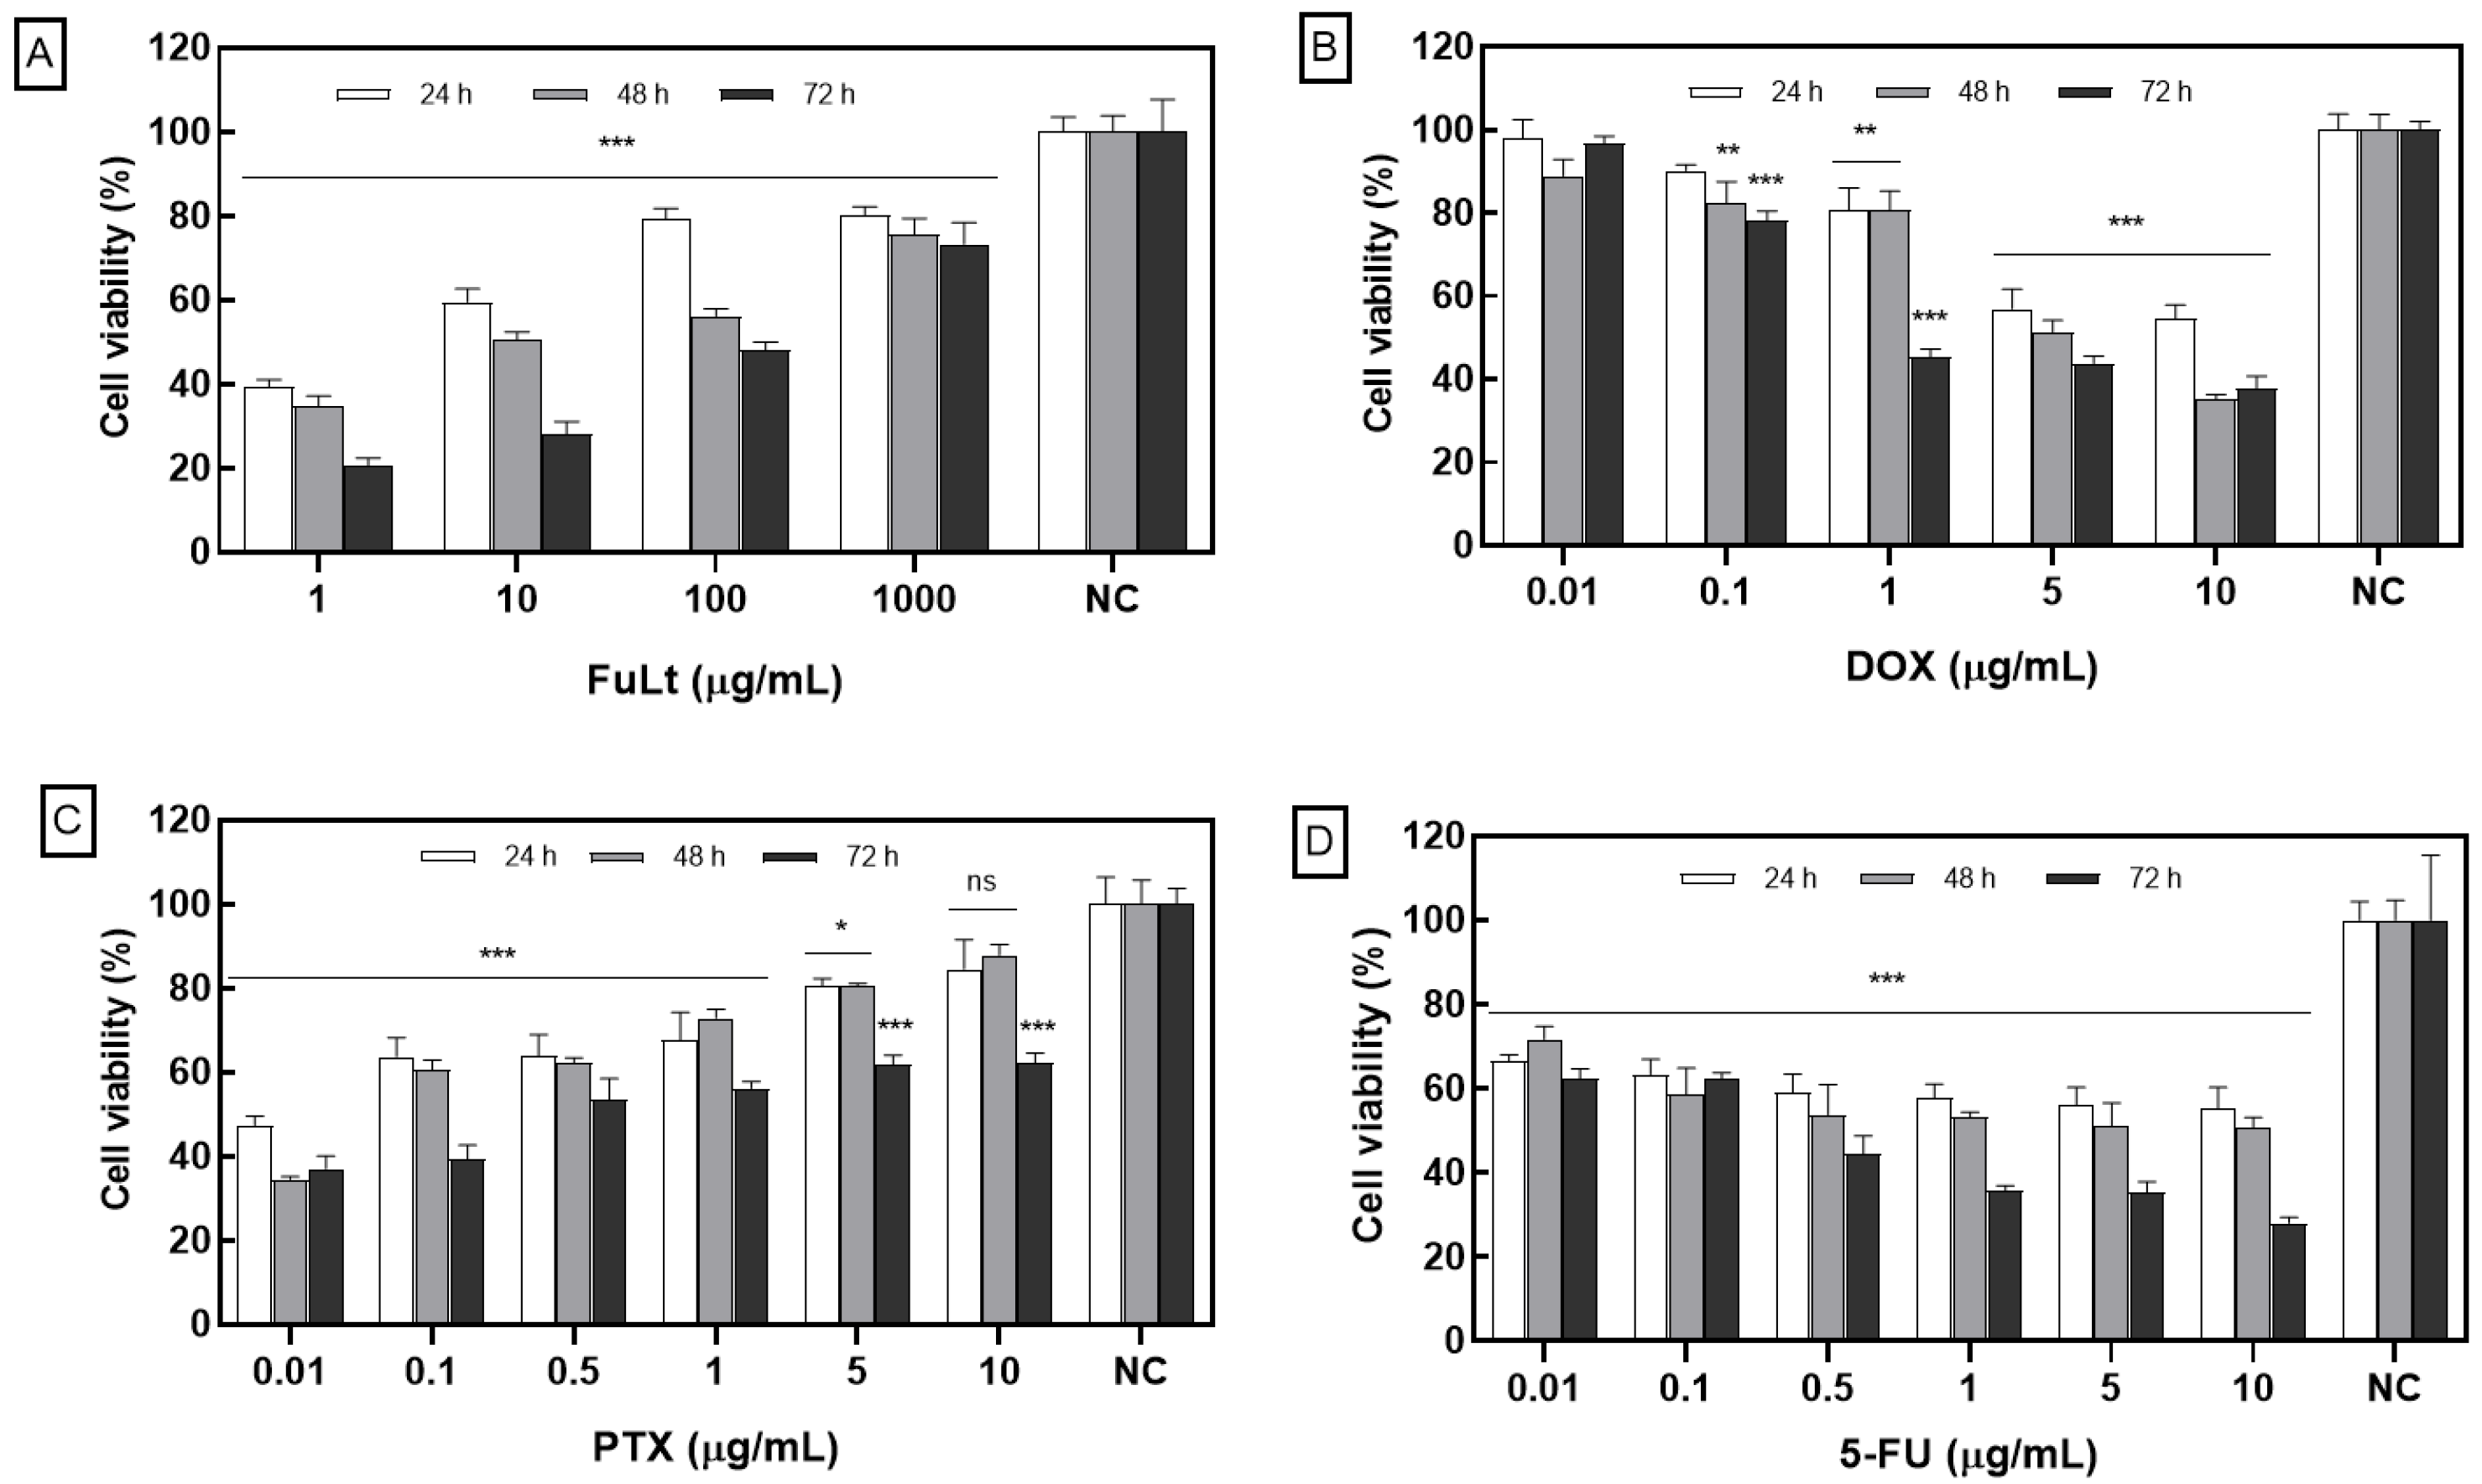
Figure 1. Cytotoxic effect of fucoidan and chemotherapeutic agents against 4T1 triple negative breast cancer (TNBC) spheroids: (A) fucoidan from L. trabeculata (FuLt), (B) doxorubicin (DOX), (C) paclitaxel (PTX) and (D) 5-fluorouracil (5-FU) for 24 h, 48 h and 72 h. Data are presented as mean ± SD (All experiments were performed in quadruplicate). *** p < 0.001; ** p < 0.01; * p < 0.05; ns = not significant; NC: negative control (untreated spheroids).
Marinedrugs 23 00451 g001
Figure 2. Half-maximal inhibitory concentration (IC50) of TNBC 4T1 spheroids. (A) fucoidan from L. trabeculata (FuLt), (B) doxorubicin (DOX), (C) paclitaxel (PTX) and (D) 5-fluorouracil (5-FU). Data are presented as the mean ± SD (All experiments were performed in quadruplicate).
Marinedrugs 23 00451 g002
Figure 3. Concentration-effect curves for binary combinations between FuLt and three chemotherapeutic agents. FucDx = ratio between fucoidan from L. trabeculata and doxorubicin, FucPc = ratio between fucoidan from L. trabeculata and paclitaxel, Fuc5F = ratio between fucoidan from L. trabeculata and 5-fluorouracil. Where m > 1 is sigmoidal, m < 1 is flat sigmoidal and m = 1 is hyperbolic. fa: fraction inhibition, m: slope of the median effect plot.
Marinedrugs 23 00451 g003
Figure 4. Cytotoxic effects of L. trabeculata fucoidan (FuLt), doxorubicin (DOX), paclitaxel (PTX) and 5-fluorouracil (5-FU), as well as three syner-gistic combinations, were examined on 4T1 spheroids after 72 h of treat-ment. The negative control (NC) refers to untreated spheroids with an av-erage diameter of 440 µm ± 0.02. The white arrows indicate significant cellular debris around the spheroids. The yellow arrows indicate defor-mation of the spheroids.
Marinedrugs 23 00451 g004
Figure 5. Relative ROS production in 4T1 homotypic and heterotypic spheroids (splenocytes + 4T1 cells), treated with IC50 dose of FuLt and with DOX, PTX and 5-FU synergistic doses. (A,B) in 4T1 homotypic spheroids; (CF) in heterotypic spheroids. FuLt: Fucoidan from L. trabeculate); DOX: doxorubicin; PTX: paclitaxel; 5-FU: 5-fluorouracil. Positive controls were used as oxidative stress inducers: LPS (Escherichia coli lipopolysaccharide) and PMA (phorbol myristate acetate). NC: negative control (untreated spheroids). Data are presented as mean ± SD (n = 6, the number of mouse spleens used is represented by n). *** p < 0.001; ** p < 0.01.
Marinedrugs 23 00451 g005
Figure 6. Nitrites production in heterotypic spheroids of splenocytes and 4T1 cells treated with IC50 FuLt: Fucoidan from L. trabeculata and synergistic doses between FuLt and DOX: doxorubicin, PTX: paclitaxel and 5-FU: 5-fluorouracil. (A) 12 h, (B) 24 h, (C) 48 h and (D) 72 h. LPS: lipopolysaccharide from Escherichia coli and PMA: phorbol myristate acetate were used as inducers of oxidative stress. NC: negative control (untreated spheroids). Data are presented as mean ± SD (n = 6). *** p < 0.001; ** p < 0.01.
Marinedrugs 23 00451 g006
Table 1. IC50 of L. trabeculata fucoidan and three chemotherapy drugs on TNBC 4T1 spheroids.
IC50 (μg/mL)
Time (h)FuLtDOXPTX5-FU
243120.025
481550.052
7210020.50.5
FuLt: fucoidan from L. trabeculata, DOX: doxorubicin, PTX: paclitaxel, 5-FU: 5-fluorouracil, and IC50: half-maximal inhibitory concentration. Note: The IC50 values for FuLt and PTX should be interpreted with caution, as their dose–response curves show an inverse proportionality to the applied concentration. This non-monotonic behaviour can produce apparent deviations in the IC50 values that do not reflect the progressive inhibition observed at later stages (Figure 1 and Figure 2).
Table 2. Concentration-response curves of the inhibitory effect of FuLt, DOX, PTX and 5-FU. Assays were performed on 4T1 spheroids following treatment for 24, 48 or 72 h.
Treatments Parameters
FuLt.DOXPTX5-FUfamDmrmDmrmDmr
24 h48 h72 h24 h48 h72 h
1 0.610.650.790.282.730.950.2413.50.970.3485.690.98
10 0.390.490.72
100 0.210.440.52
1000 0.20.240.27
0.01 0.020.110.030.5311.40.990.366.50.910.562.160.95
0.1 0.10.180.22
1.0 0.190.190.55
5.0 0.430.490.56
10.0 0.450.650.62
0.01 0.530.660.630.250.020.960.350.060.980.170.380.96
0.1 0.360.390.61
0.5 0.360.380.47
1.0 0.320.270.44
5.0 0.190.20.38
10.0 0.150.120.38
0.010.330.060.380.0710.80.990.44.730.930.220.170.95
0.10.370.150.4
0.50.410.430.56
1.00.420.440.64
5.00.440.470.65
10.00.450.470.72
FuLt: fucoidan from L. trabeculata, DOX: doxorubicin, PTX: paclitaxel, 5-FU: 5-fluorouracil, fa: fraction inhibition, m: slope of the median effect plot, Dm: median inhibitory concentration, r: linear correlation coefficient.
Table 3. Data summary of concentration-effect curves of binary combinations between FuLt and DOX against TNBC 4T1 spheroids, after 24, 48 and 72 h of treatment.
FuLt + DOX (μg/mL)ParametersDRIInteraction
HoursRatioTotal
Concentration
faCI ValuemDmrFuLtDOX
241:120.240.78 1.76 × 1021.29synergism 1
100.263.210.123.26 × 1040.922.39 × 1010.32antagonism
200.34.53 5.830.23antagonism
10:120.160.37 5.99 × 1022.73synergism 2
100.21.120.324.99 × 1020.984.49 × 1010.91additive
1000.398.47 0.150.54antagonism
100:11000.333.14 0.363.02antagonism
5000.447.64 × 1010.358.16 × 1020.990.011.46antagonism
10000.535.59 × 102 0.001.44antagonism
175:11000.141.57 1.93 × 1010.66antagonism
1750.145.580.104.800.665.440.19antagonism
5000.175.52 1.690.20antagonism
481:120.590.39 2.961.79 × 101synergism 3
100.787.29 × 1010.621.151.000.014.32 × 101antagonism
200.861.45 × 103 0.009.86 × 101antagonism
10:120.380.13 5.74 × 1019.28synergism 4
100.510.920.456.920.991.268.02additive
1000.781.33 × 103 0.0023.74antagonism
100:11000.485.44 0.195.29antagonism
5000.732.33 × 1030.621.11 × 1021.000.002.06 × 101antagonism
10000.791.85 × 104 0.002.57 × 101antagonism
175:11000.213.37 3.43 × 1010.30antagonism
1750.492.24 × 1011.08 × 1053.46 × 1021.000.052.94antagonism
5000.612.38 × 102 0.008.02antagonism
721:120.450.67 1.55 × 1021.51synergism 5
100.762.030.902.561.000.583.42antagonism
200.873.16 × 101 0.036.56antagonism
10:120.21.02 2.79 × 1030.98additive
100.420.790.751.37 × 1011.002.44 × 1011.33synergism 6
1000.829.23 × 101 0.013.62antagonism
100:11000.451.30 1.561.52antagonism
5000.729.35 × 1010.631.31 × 1020.990.012.38antagonism
10000.774.05 × 102 0.001.91antagonism
175:11000.23.15 5.10 × 1010.32antagonism
1750.463.800.984.12 × 1021.000.390.81antagonism
5000.551.14 × 101 0.101.11antagonism
FuLt: fucoidan from L. trabeculata, DOX: doxorubicin, fa: inhibitory effect, CI value: combinatorial index, m: slope of the median effect plot, Dm: median inhibitory concentration, r: linear correlation coefficient, DRI: Dose Reduction Index. CI = 1, additive effect; CI < 1, synergistic effect; and CI > 1, antagonistic effect. The superscript counts the synergistic indices in Table 3, Table 4, Table 5 and Tables S1–S3.
Table 4. Data summary of concentration-effect curves of binary combinations between FuLt and PTX against TNBC 4T1 spheroids, after 24, 48 and 72 h of treatment.
FuLt + PTX (μg/mL)ParametersDRIInteraction
HoursRatioTotal DosefaCI ValuemDmrFuLtPTX
242:120.160.05 8.29 × 1022.19 × 101synergism 7
50.220.550.411.10 × 1021.008.11 × 1011.84synergism 8
100.273.25 1.53 × 1010.31antagonism
1:110.190.08 1.05 × 1031.28 × 101synergism 9
20.20.200.211.34 × 1030.994.17 × 1024.96synergism 10
100.274.82 2.05 × 1010.21antagonism
10:120.190.03 2.88 × 1023.51 × 101synergism 11
50.20.100.043.31 × 10150.909.17 × 1011.09 × 101synergism 12
100.20.21 4.58 × 1015.46synergism 13
100:1500.170.10 1.72 × 1012.21 × 101synergism 14
700.261.100.852.94 × 1020.901.771.85additive
1000.271.91 1.031.06antagonism
482:120.210.25 2.56 × 1033.94synergism 15
50.230.890.174.99 × 1030.986.28 × 1021.13synergism 16
100.262.83 1.60 × 1020.35antagonism
1:110.290.65 1.13 × 1031.53synergism 17
20.291.310.022.70 × 10170.965.67 × 1020.77antagonism
100.37.51 9.28 × 1010.13antagonism
10:120.280.21 3.83 × 1024.84synergism 18
50.361.520.362.62 × 1011.003.28 × 1010.67antagonism
100.415.61 6.790.18antagonism
100:1500.260.47 2.15 × 1012.38synergism 19
700.31.190.281.76 × 1030.866.700.96antagonism
1000.31.70 4.690.67antagonism
722:120.533.59 4.51 × 1010.28antagonism
50.551.44 × 1010.150.990.961.42 × 1010.07antagonism
100.597.53 × 101 4.400.01antagonism
1:110.554.31 9.49 × 1010.23antagonism
20.561.09 × 1010.130.250.994.21 × 1010.09antagonism
100.622.36 × 102 4.060.00antagonism
10:120.500.40 5.30 × 1012.64synergism 20
50.666.01 × 1010.652.020.992.680.02antagonism
100.738.43 × 102 0.500.00antagonism
100:1500.566.58 0.850.19antagonism
700.571.15 × 1010.302.39 × 1010.950.540.10antagonism
1000.614.07 × 101 0.230.03antagonism
FuLt: fucoidan from L. trabeculata, PTX: paclitaxel, fa: inhibitory effect, CI value: combinatorial index, m: slope of the median effect plot, Dm: median inhibitory concentration, r: linear correlation coefficient, DRI: Dose Reduction Index. CI = 1, additive effect; CI < 1, synergistic effect; and CI > 1, antagonistic effect. The superscript counts the synergistic indices in Table 3, Table 4, Table 5 and Tables S1–S3.
Table 5. Data summary of concentration-effect curves of binary combinations between FuLt and 5-FU against TNBC 4T1 spheroids, after 24, 48 and 72 h of treatment.
FuLt + 5-FU (μg/mL)ParametersDRIInteraction
HoursRatioTotal DosefaCI ValuemDmrFuLt5-FU
242:120.312.82 × 102 3.82 × 1010.00antagonism
50.356.24 × 1010.228.05 × 1011.007.980.02antagonism
100.391.29 × 101 2.15 × 1050.08antagonism
1:110.33.99 × 102 1.21 × 1020.00antagonism
20.411.320.193.88 × 1010.781.07 × 1010.82antagonism
100.424.06 1.840.28antagonism
10:120.194.69 × 105 2.88 × 1020.00antagonism
50.351.72 × 1010.661.61 × 1010.975.850.06antagonism
100.42.67 1.360.52antagonism
100:1500.336.25 × 101 0.740.02antagonism
700.361.75 × 1010.621.64 × 1020.980.330.07antagonism
1000.431.29 × 101 0.082.48antagonism
482:120.330.82 1.95 × 1021.23synergism 21
50.381.220.197.65 × 1010.993.13 × 1010.84antagonism
100.42.02 1.10 × 1010.52antagonism
1:110.310.77 7.62 × 1021.30synergism 22
20.40.590.261.61 × 1010.947.34 × 1011.73synergism 23
100.461.76 5.280.64antagonism
10:120.290.36 3.12 × 1022.83synergism 24
50.340.520.182.87 × 1020.964.74 × 1012.01synergism 25
100.350.94 1.97 × 1011.12additive
100:1500.251.63 2.68 × 1010.63antagonism
700.31.350.504.34 × 1020.966.700.84antagonism
1000.321.67 3.170.74antagonism
722:120.561.30 3.16 × 1010.79antagonism
50.582.280.130.320.989.940.46antagonism
100.612.75 3.450.41antagonism
1:110.475.00 2.44 × 1020.20antagonism
20.571.610.241.100.923.74 × 1010.63antagonism
100.623.29 4.060.33antagonism
10:120.433.83 1.08 × 1020.26antagonism
50.493.190.256.071.002.12 × 1010.32antagonism
100.533.17 6.620.33antagonism
100:1500.751.47 × 101 0.075.43 × 101antagonism
700.794.00 × 1010.413.250.940.031.10 × 102antagonism
1000.86.84 × 101 0.011.02 × 102antagonism
FuLt: fucoidan from L. trabeculata, 5-FU: 5-fluorouracil, fa: inhibitory effect, CI value: combinatorial index, m: slope of the median effect plot, Dm: median inhibitory concentration, r: linear correlation coefficient, DRI: Dose Reduction Index. CI = 1, additive effect; CI < 1, synergistic effect; and CI > 1, antagonistic effect. The superscript counts the synergistic indices in Table 3, Table 4, Table 5 and Tables S1–S3.
Disclaimer/Publisher’s Note: The statements, opinions and data contained in all publications are solely those of the individual author(s) and contributor(s) and not of MDPI and/or the editor(s). MDPI and/or the editor(s) disclaim responsibility for any injury to people or property resulting from any ideas, methods, instructions or products referred to in the content.