1. Introduction
As part of our ongoing investigations into the chemistry of Australian microbes, we applied a global natural products social (GNPS) [
1] molecular network analysis to a library of Australian terrestrial and marine bacteria and fungi to identify those most likely to produce natural products with unprecedented (unreported) molecular formulas. Among the many microbes prioritized by this approach was
Aspergillus noonimiae CMB-M0339, isolated from a marine sediment collected off Perth, Western Australia. The GNPS analysis revealed that an M1 agar plate cultivation of CMB-M0339 was capable of producing new chemistry, tentatively attributed to the class of indole diterpenes (IDT). To access this new chemistry, we employed a cultivation profiling strategy using a miniaturized 24-well plate approach (MATRIX) to map the metabolomes of CMB-M0339 under 33 different cultivation conditions. Using this approach, we determined that D400 solid-phase cultivation was optimal for IDT production. Following scaled-up cultivation and chemical analysis, we subsequently reported on the new IDT amino acid conjugates, noonindoles A–F (2022 [
2]), and related glycosides, noonindoles G–L (2023 [
3]). While this initial investigation employed a MATRIX analysis to identify conditions optimal for the production of noonindoles, it also became apparent that CMB-M0339 was capable of producing additional chemistry. For example, during cultivation in either Sabouraud dextrose (SD) or potato dextrose (PD) media, under either solid or broth conditions, the production of noonindoles was downregulated in favor of a new set of natural products featuring a different and distinctive UV-vis chromophore and a unique molecular formula (C
19H
16N
2O
4 and C
19H
16N
2O
5). In this report, we describe the chemical analysis of a scaled-up SDA cultivation of CMB-M0339, which resulted in the production, isolation, characterization and structure elucidation of noonazines A–C (
1–
3) as new examples of a rare class of 2,6-diketopiperazines, along with the known coelomycin (
4), and a new azaphilone, noonaphilone A (
5) (
Figure 1).
2. Results
The EtOAc extract of a scaled up SDA (120 plates) cultivation of CMB-M0339 was subjected to sequential solvent trituration across
n-hexane, CH
2Cl
2 and MeOH, with the CH
2Cl
2 solubles subsequently fractionated by preparative and semi-preparative reversed-phase HPLC to yield
1–
5 (
Scheme S1). Based on their UV-vis (UPLC-DAD) chromophores, the metabolites
1–
4 were attributed to a common structure class that differed from that of
5. Significantly, HRESI(+)–MS analysis of
4 revealed a molecular formula (M+Na
+, ∆ppm −0.4, C
18H
14N
2O
4) which, together with an analysis of the NMR (CDCl
3) data (
Table S5,
Figures S29–S33), identified it as the known 2,6-diketopiperazine coelomycin. First reported from a PD broth cultivation of the Thai seed-derived fungus,
Menisporopsis theobromae BCC 3975 (2006 [
4]),
4 was subsequently reported as coelomycin from an unidentified Spanish salt marsh leaf litter-derived Coelomycete fungus (2010 [
5]). What follows is an account of the structure elucidation of the new metabolites
1–
3 and
5.
HRESI(+)–MS analysis of
1 revealed a molecular formula (M+Na
+, ∆ppm 0.3, C
19H
16N
2O
4) consistent with an analogue (+CH
2) of
4, with an analysis of the NMR data for
1 (DMSO-
d6,
Table 1 and
Table S2,
Figures S9–S13; CDCl
3,
Figures S14 and S15) confirming the presence of an
N-methoxy moiety (
δH 4.07,
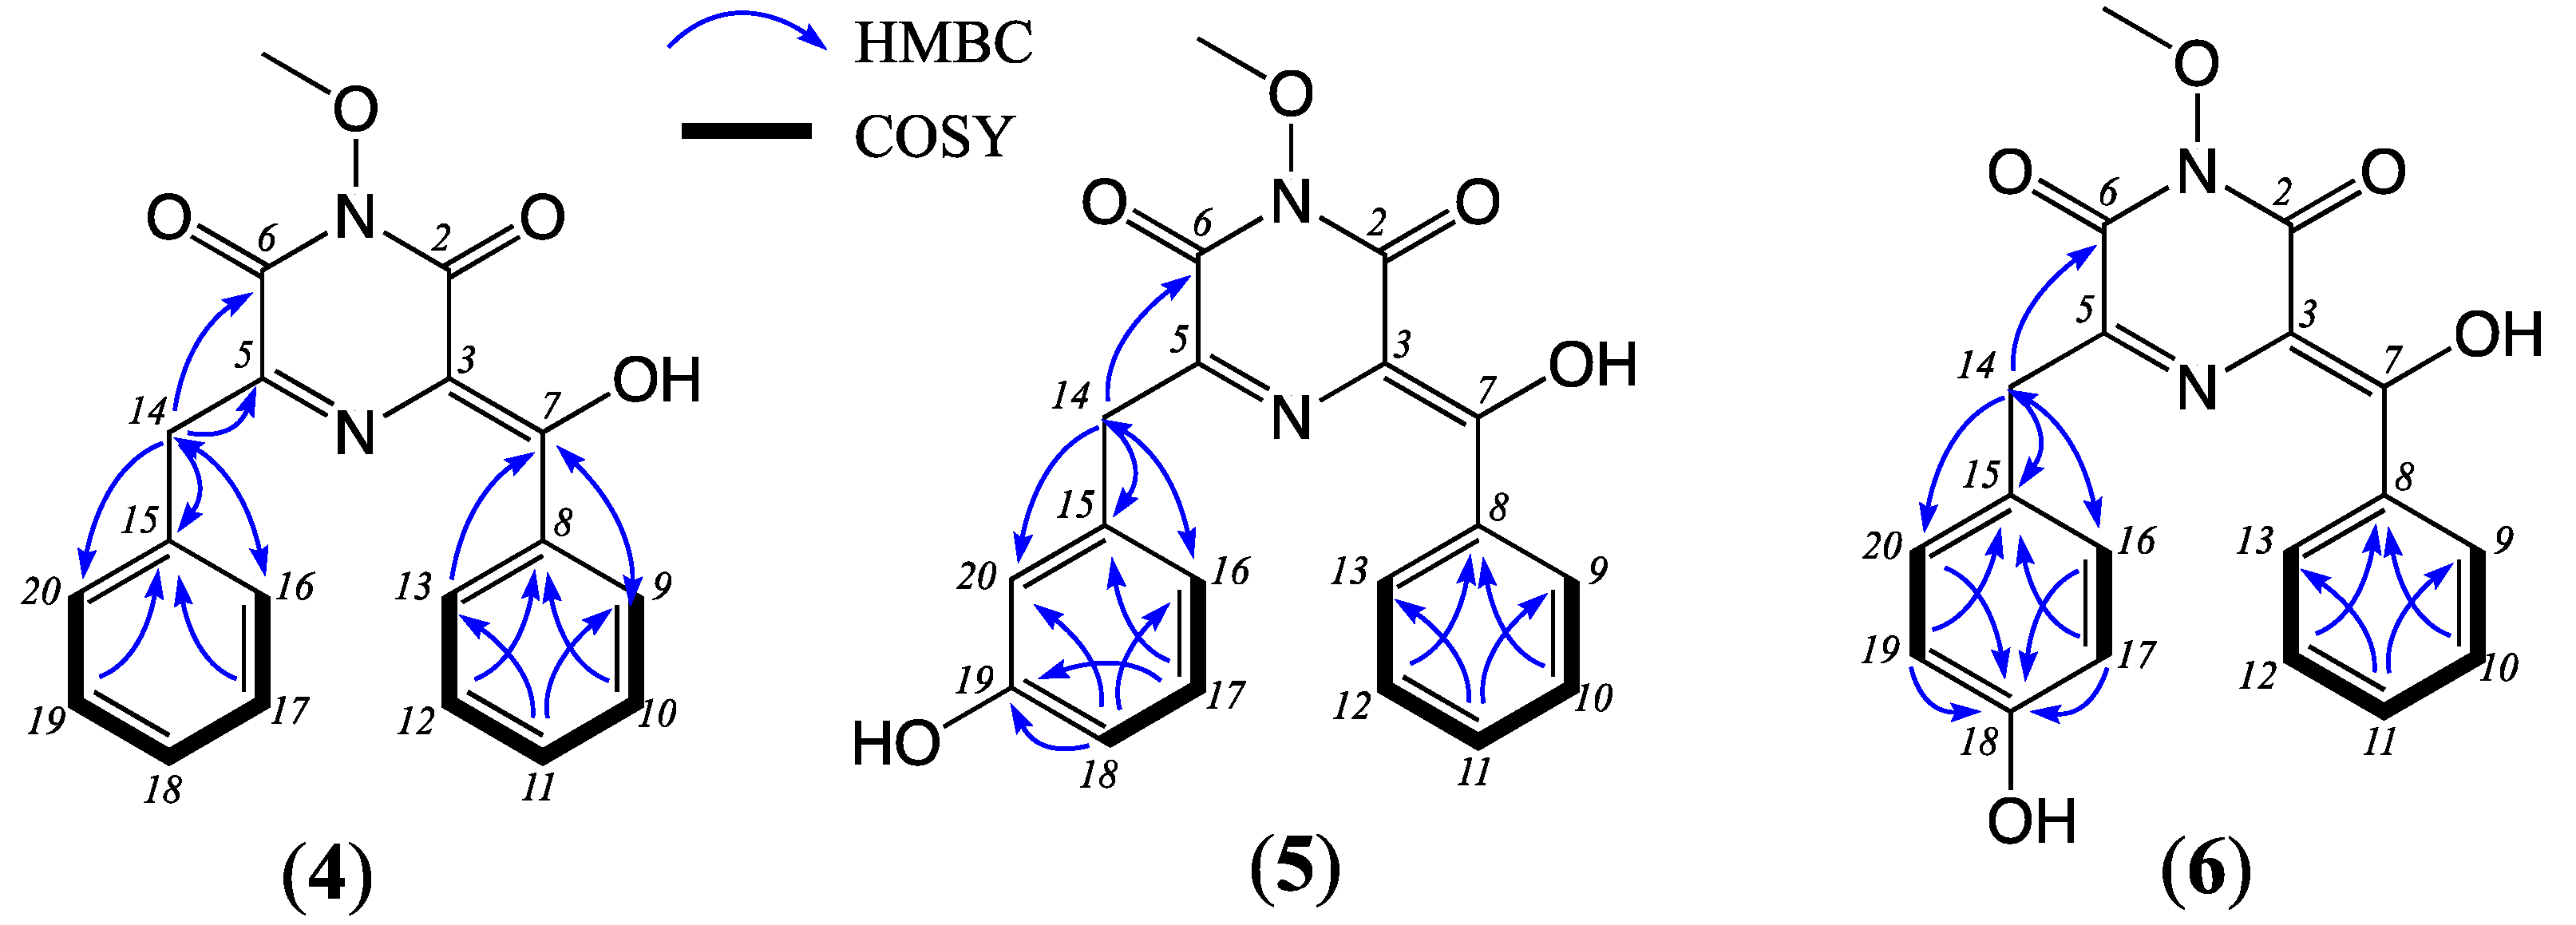
δC 64.6). The structure of noonazine A (
1) was confirmed using diagnostic 2D NMR (DMSO-
d6) correlations (
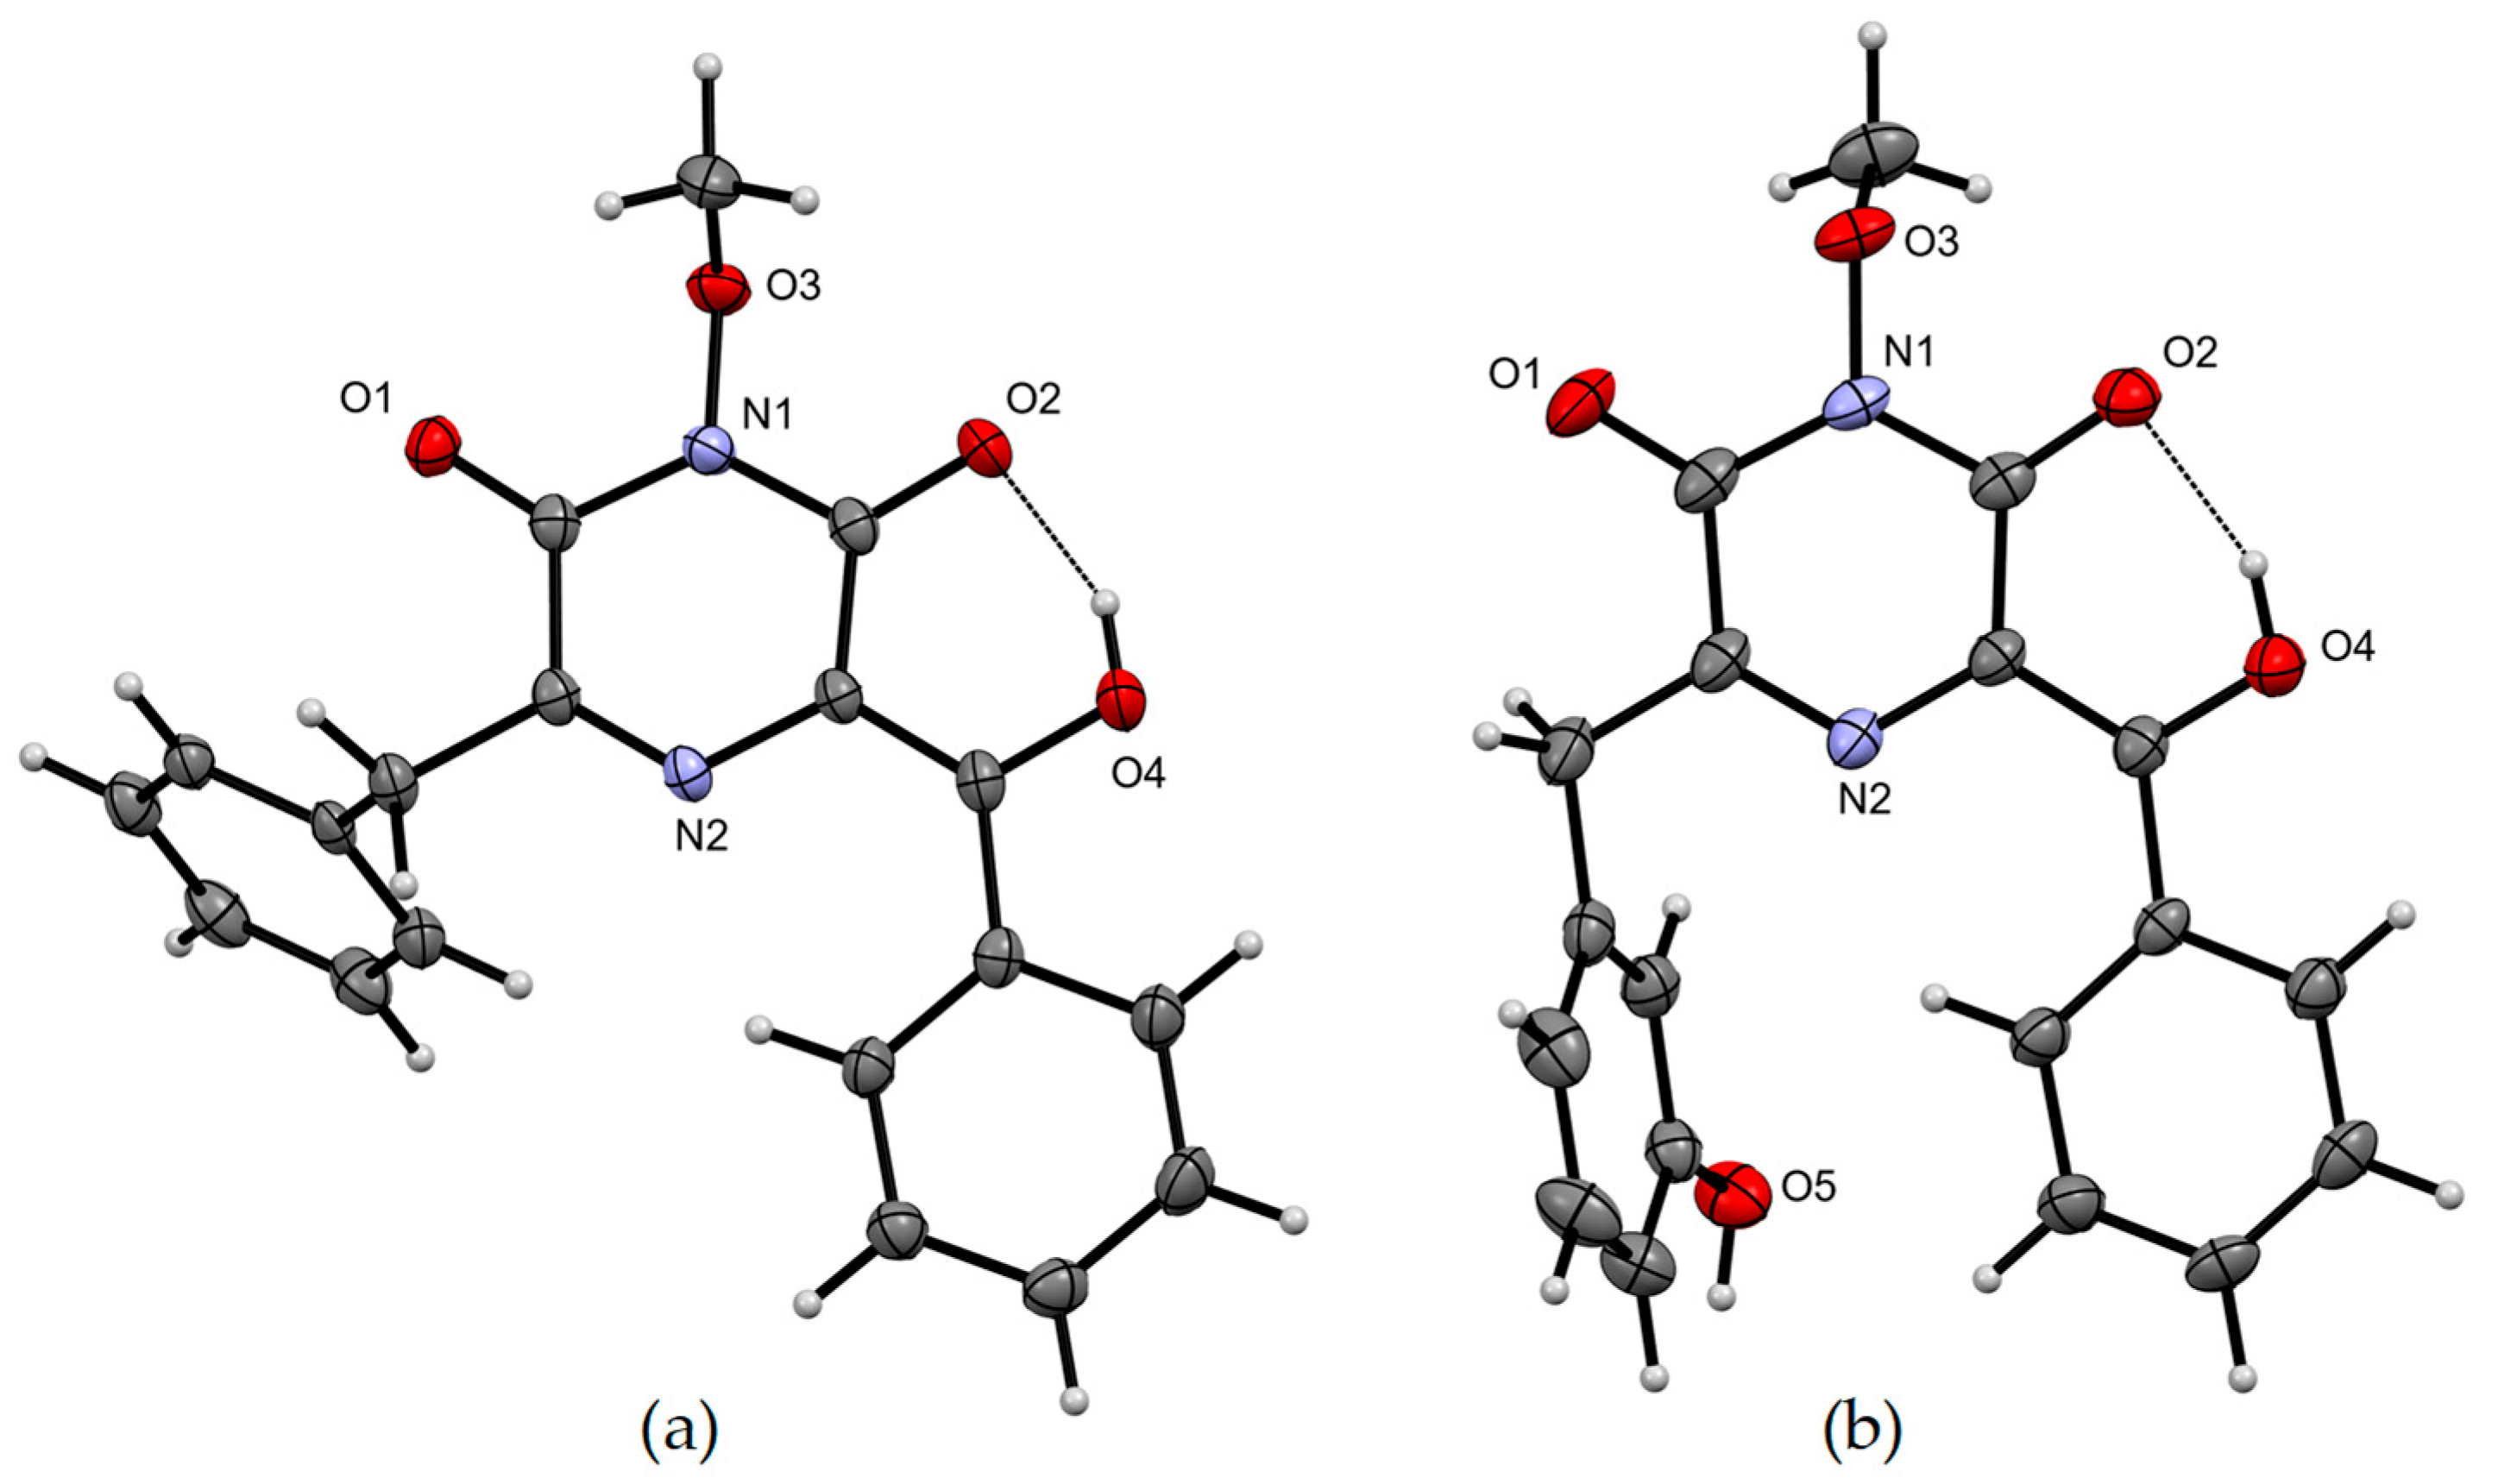
Figure 2) and a single crystal X-ray crystallographic analysis (
Figure 3,
Tables S7–S8). Although not previously reported as a natural product,
1 had been described as a semi-synthetic derivative of
4 [
4,
5]. The
N-oxy-2,6-diketopiperazine moiety evident in
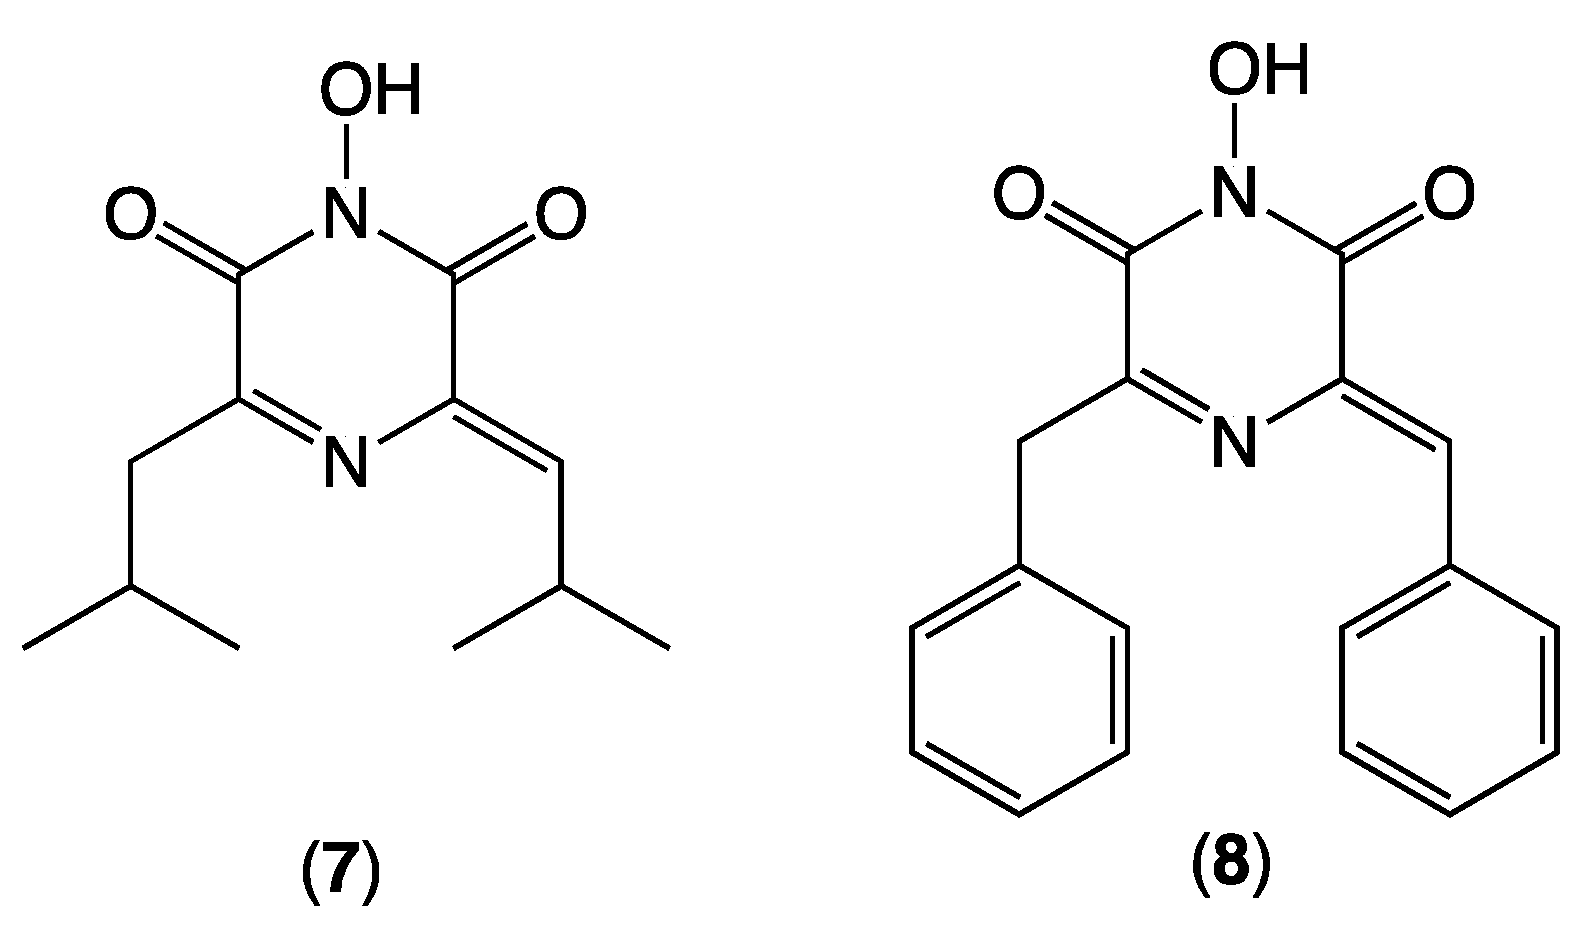
1 is particularly rare, and only four structurally characterized examples exist in the Cambridge Structural Database, including coelomycin (
4) and synthetic analogues of the fungal natural products flutamide (
7) and sclerominol (
8) (see discussion below).
HRESI(+)–MS analysis of
2 revealed a molecular formula (M+Na
+, ∆ppm −2.5, C
19H
16N
2O
5) consistent with an oxidized (+O) analogue of noonazine A (
1). A comparison of the NMR (DMSO-
d6) data for
2 (
Table 1 and
Table S3,
Figures S17–S21) with
1, including diagnostic 2D NMR correlations (
Figure 2), attributed the principal difference to inclusion of a 19-OH moiety in
2, as is evident from the absence of H-19 and a downfield chemical shift of C-19 (
δC 157.3). The structure for noonazine B (
2) was confirmed using single crystal X-ray crystallographic analysis (
Figure 3,
Tables S9–S10).
HRESI(+)–MS analysis of
3 revealed a molecular formula (M+Na
+, ∆ppm −0.9, C
19H
16N
2O
5) isomeric with noonazine B (
2). A comparison of 1D and 2D NMR data (DMSO-
d6) for
3 (
Table 1 and
Table S4,
Figure 3 and
Figures S23–S27) with
2 attributed the principal difference to a
para versus
meta phenol regiochemistry, establishing the structure for noonazine C (
3), as shown.
An HRESI(+)–MS analysis of
5 revealed a molecular formula (M+Na
+, ∆ppm 5.0, C
24H
20O
7) requiring 15 double bond equivalents (DBE). An analysis of the 1D NMR (DMSO-
d6) data for
5 (
Table 2 and
Table S6,
Figures S35–S40) revealed resonances for two ketone (
δC 184.6, 190.0) and two ester/lactone/carboxylic acid (
δC 167.4, 168.7) carbonyls, ten sp
2 methines (
δH 6.02–8.49,
δC 106.0–151.0) and six additional sp
2 quaternary carbons (
δC 109.8, 111.0, 122.8, 139.0, 158.7, 165.4), accounting for 12 DBE and requiring that
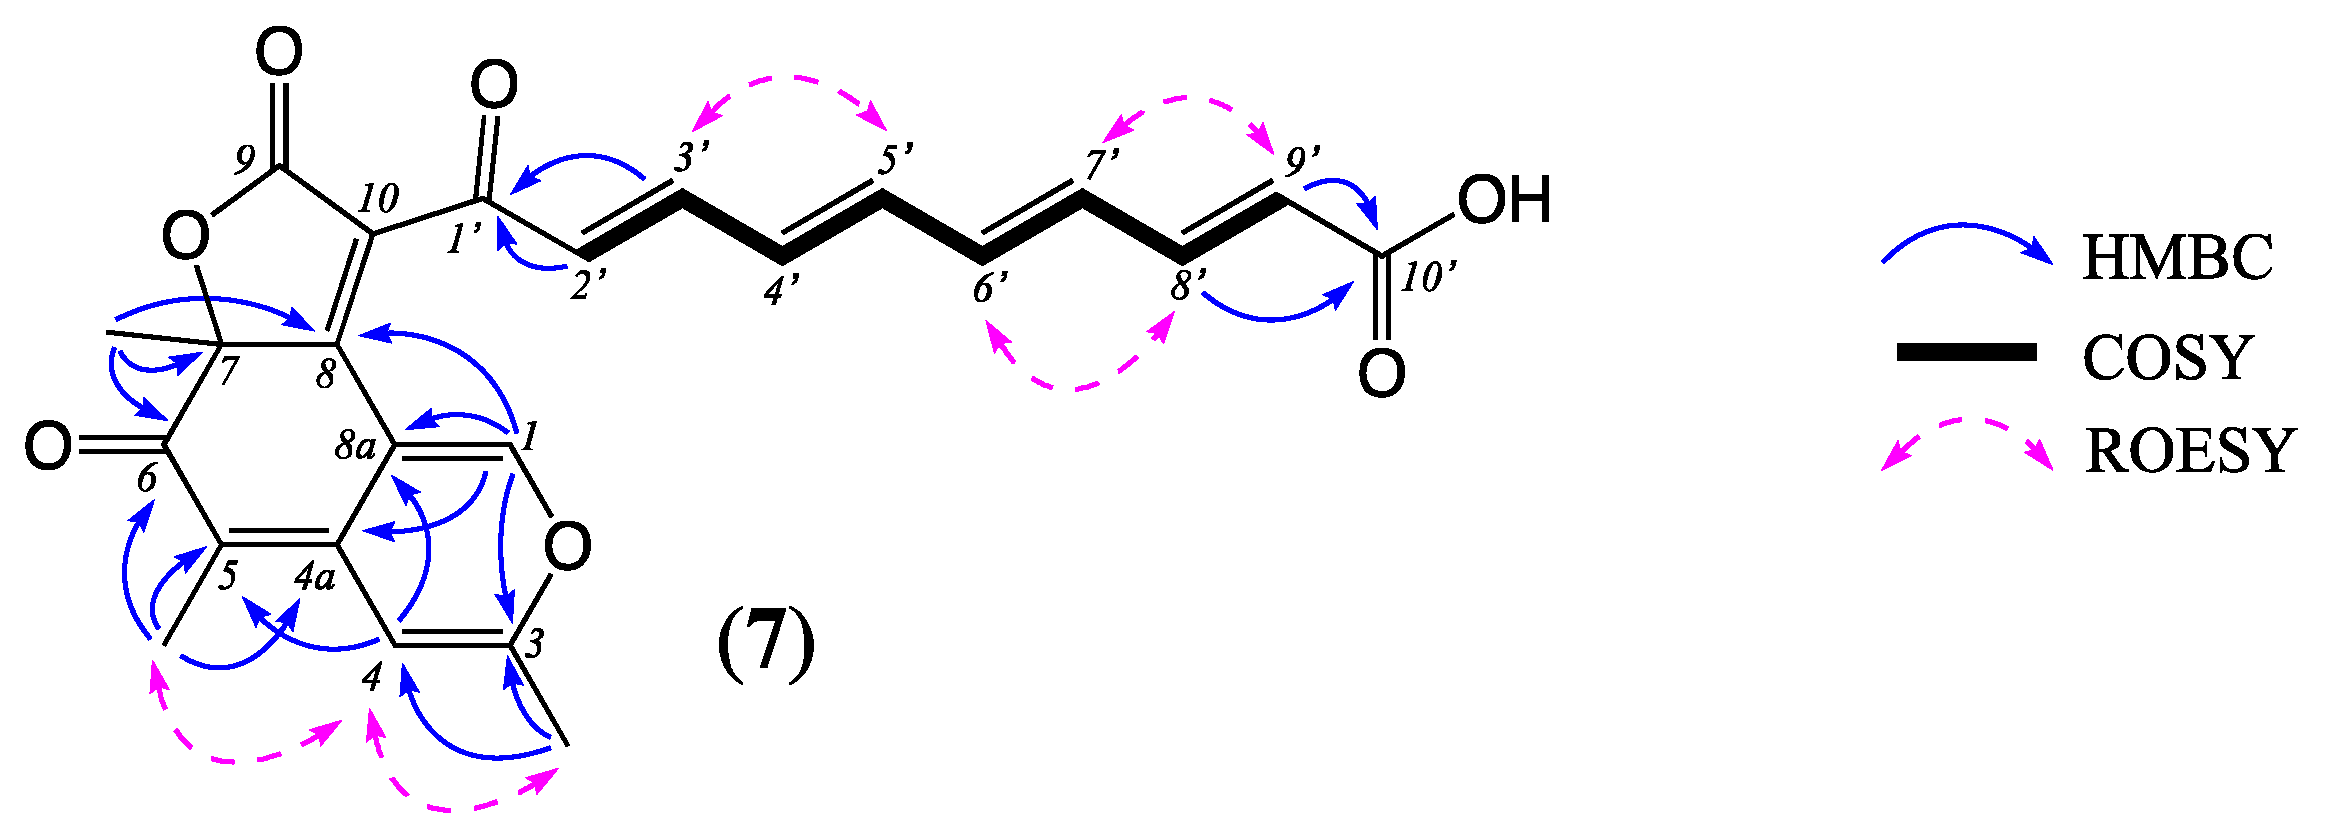
5 be tricyclic. Taken together with diagnostic 2D NMR correlations (
Figure 4), these observations permit the assembly of three structure subunits. Subunit A comprises a linear conjugated 2,4,6,8-decatetraene flanked by a carboxylic acid (C-10′,
δC 167.4) and a ketone (C-1′,
δC 184.6), with an all
E configuration evident from ROESY correlations between H-3′ and H-5′, H-6′ and H-8′, and H-7′ and H-9′, and characteristic
J values for ∆
2′,3′ (15.0 Hz), ∆
4′,5′ (15.0 Hz), ∆
6′,7′ (14.9 Hz) and ∆
8′,9′ (15.2 Hz). Subunit B comprises the isochroman scaffold pyrone-quinone bicyclic core common to the well-known class of polyketide fungal metabolites, the azaphilones, with the 3-Me and 5-Me substitutions evident from ROESY correlations to H-4 and HMBC correlations from 3-Me to C-3 and C-4, and from 5-Me to C-4a, C-5 and C-6. HMBC correlations from H-1 and 7-Me to C-8 confirmed closure of the ring A–B bicycle. Subunit C accounts for the remaining two carbons, with C-9 attributed to an ester/lactone carbonyl (
δC 168.7) and C-10 to a quaternary sp
2 carbon (
δC 122.8). To accommodate the deshielded
13C NMR shift for the quaternary sp
3 C-7 (
δC 87.5) (i.e., substituted by oxygen) and sp
2 C-8 (
δC 165.4) (i.e., part of an α,β-unsaturated ketone/lactone), subunits A–C were assembled to arrive at the planar structure for noonaphilone A (
5).
While the planar ring A–C motif in
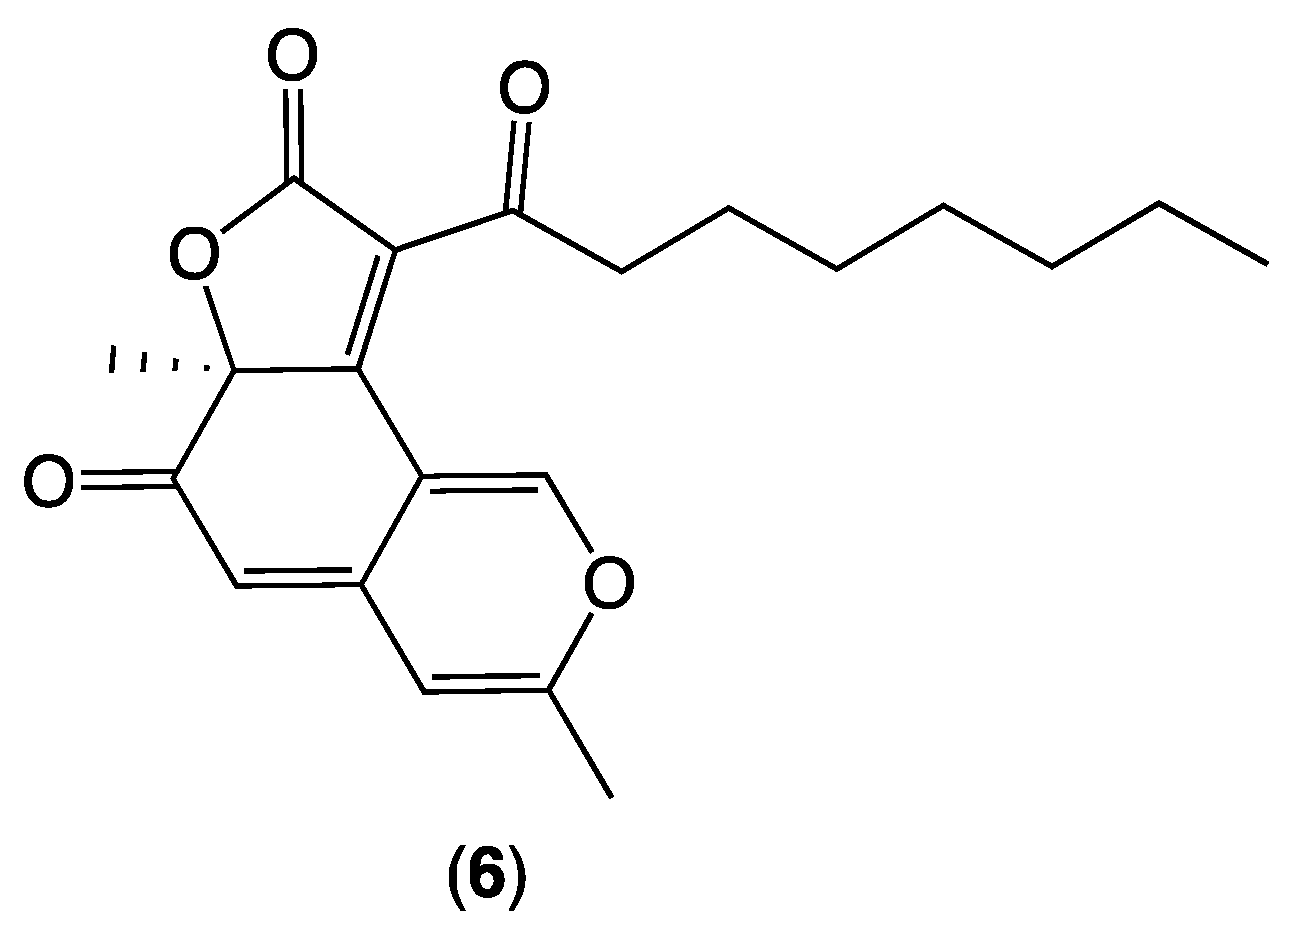
5 is unprecedented in the scientific literature, known fungal metabolites share the motif less the 5-Me, including deflectin 1a (
6) from
Aspergillus deflectus [
6]. Initially assigned a 7
R absolute configuration, the structure for
6 was subsequently revised to 7
S on the basis of total synthesis [
7] (
Figure 5). Interestingly, a comparison of the experimentally measured optical properties for the natural product
5 ([ϕ]
D −3746; [α]
D21 −892.0 (
c 0.03, EtOAc)) with those reported for synthetic
6 ([ϕ]
D +1534; [α]
D21 +431.0 (
c 5, EtOAc)), including CD spectra (
Figure S42), supports the assignment of the antipodal 7
R absolute configuration for noonaphilone A (
5).
3. Discussion
The noonazines A–C (
1–
3) and the co-metabolite coelomycin (
4) are rare examples of naturally occurring 2,6-diketopiperazines (2,6-DKP), with the only other reports limited to flutamide (
7) from the Nambian dung-derived fungus
Delitschia conferstaspora (1995 [
8]) and sclerominol (
8) from hypovirulent isolates of the fungal plant pathogen
Sclerotinia minor (2003 [
9]) (
Figure 6), with
7 reported to selectively inhibit the cap-dependant transcriptase of influenza A and B [
10]. In addition to being a rare 2,6-DKP,
2 is noteworthy in that it incorporates the uncommon non-proteinogenic amino acid
meta-tyrosine (
m-Tyr), more typically associated with
Streptomyces natural products such as the immunosuppressant sanglifehrin [
11,
12], uridyl peptide antibiotic pacidamycins [
13,
14,
15,
16] and the related sansanmycins [
17], napsamycins [
18] and mureidomycins [
19,
20,
21].
A plausible biosynthetic pathway capable of delivering the 2,6-DKPs
1–
4 and
8 (
Scheme 1) could proceed via a Phe starter (i) undergoing oxidation to phenylpyruvate (ii) prior to formation of the Schiff base (iii) ahead of transformation (one or more steps) to either the hydroxamic acid (iv) or
O-Me-hydroxamate (v). Subsequent oxidation and cyclization-mediated termination could deliver the imides
4 and
8 from (iv) and
1–
3 from (v). As an alternative to proceeding via (v),
4 could undergo methylation with or without further oxidation to yield
1–
3 directly.
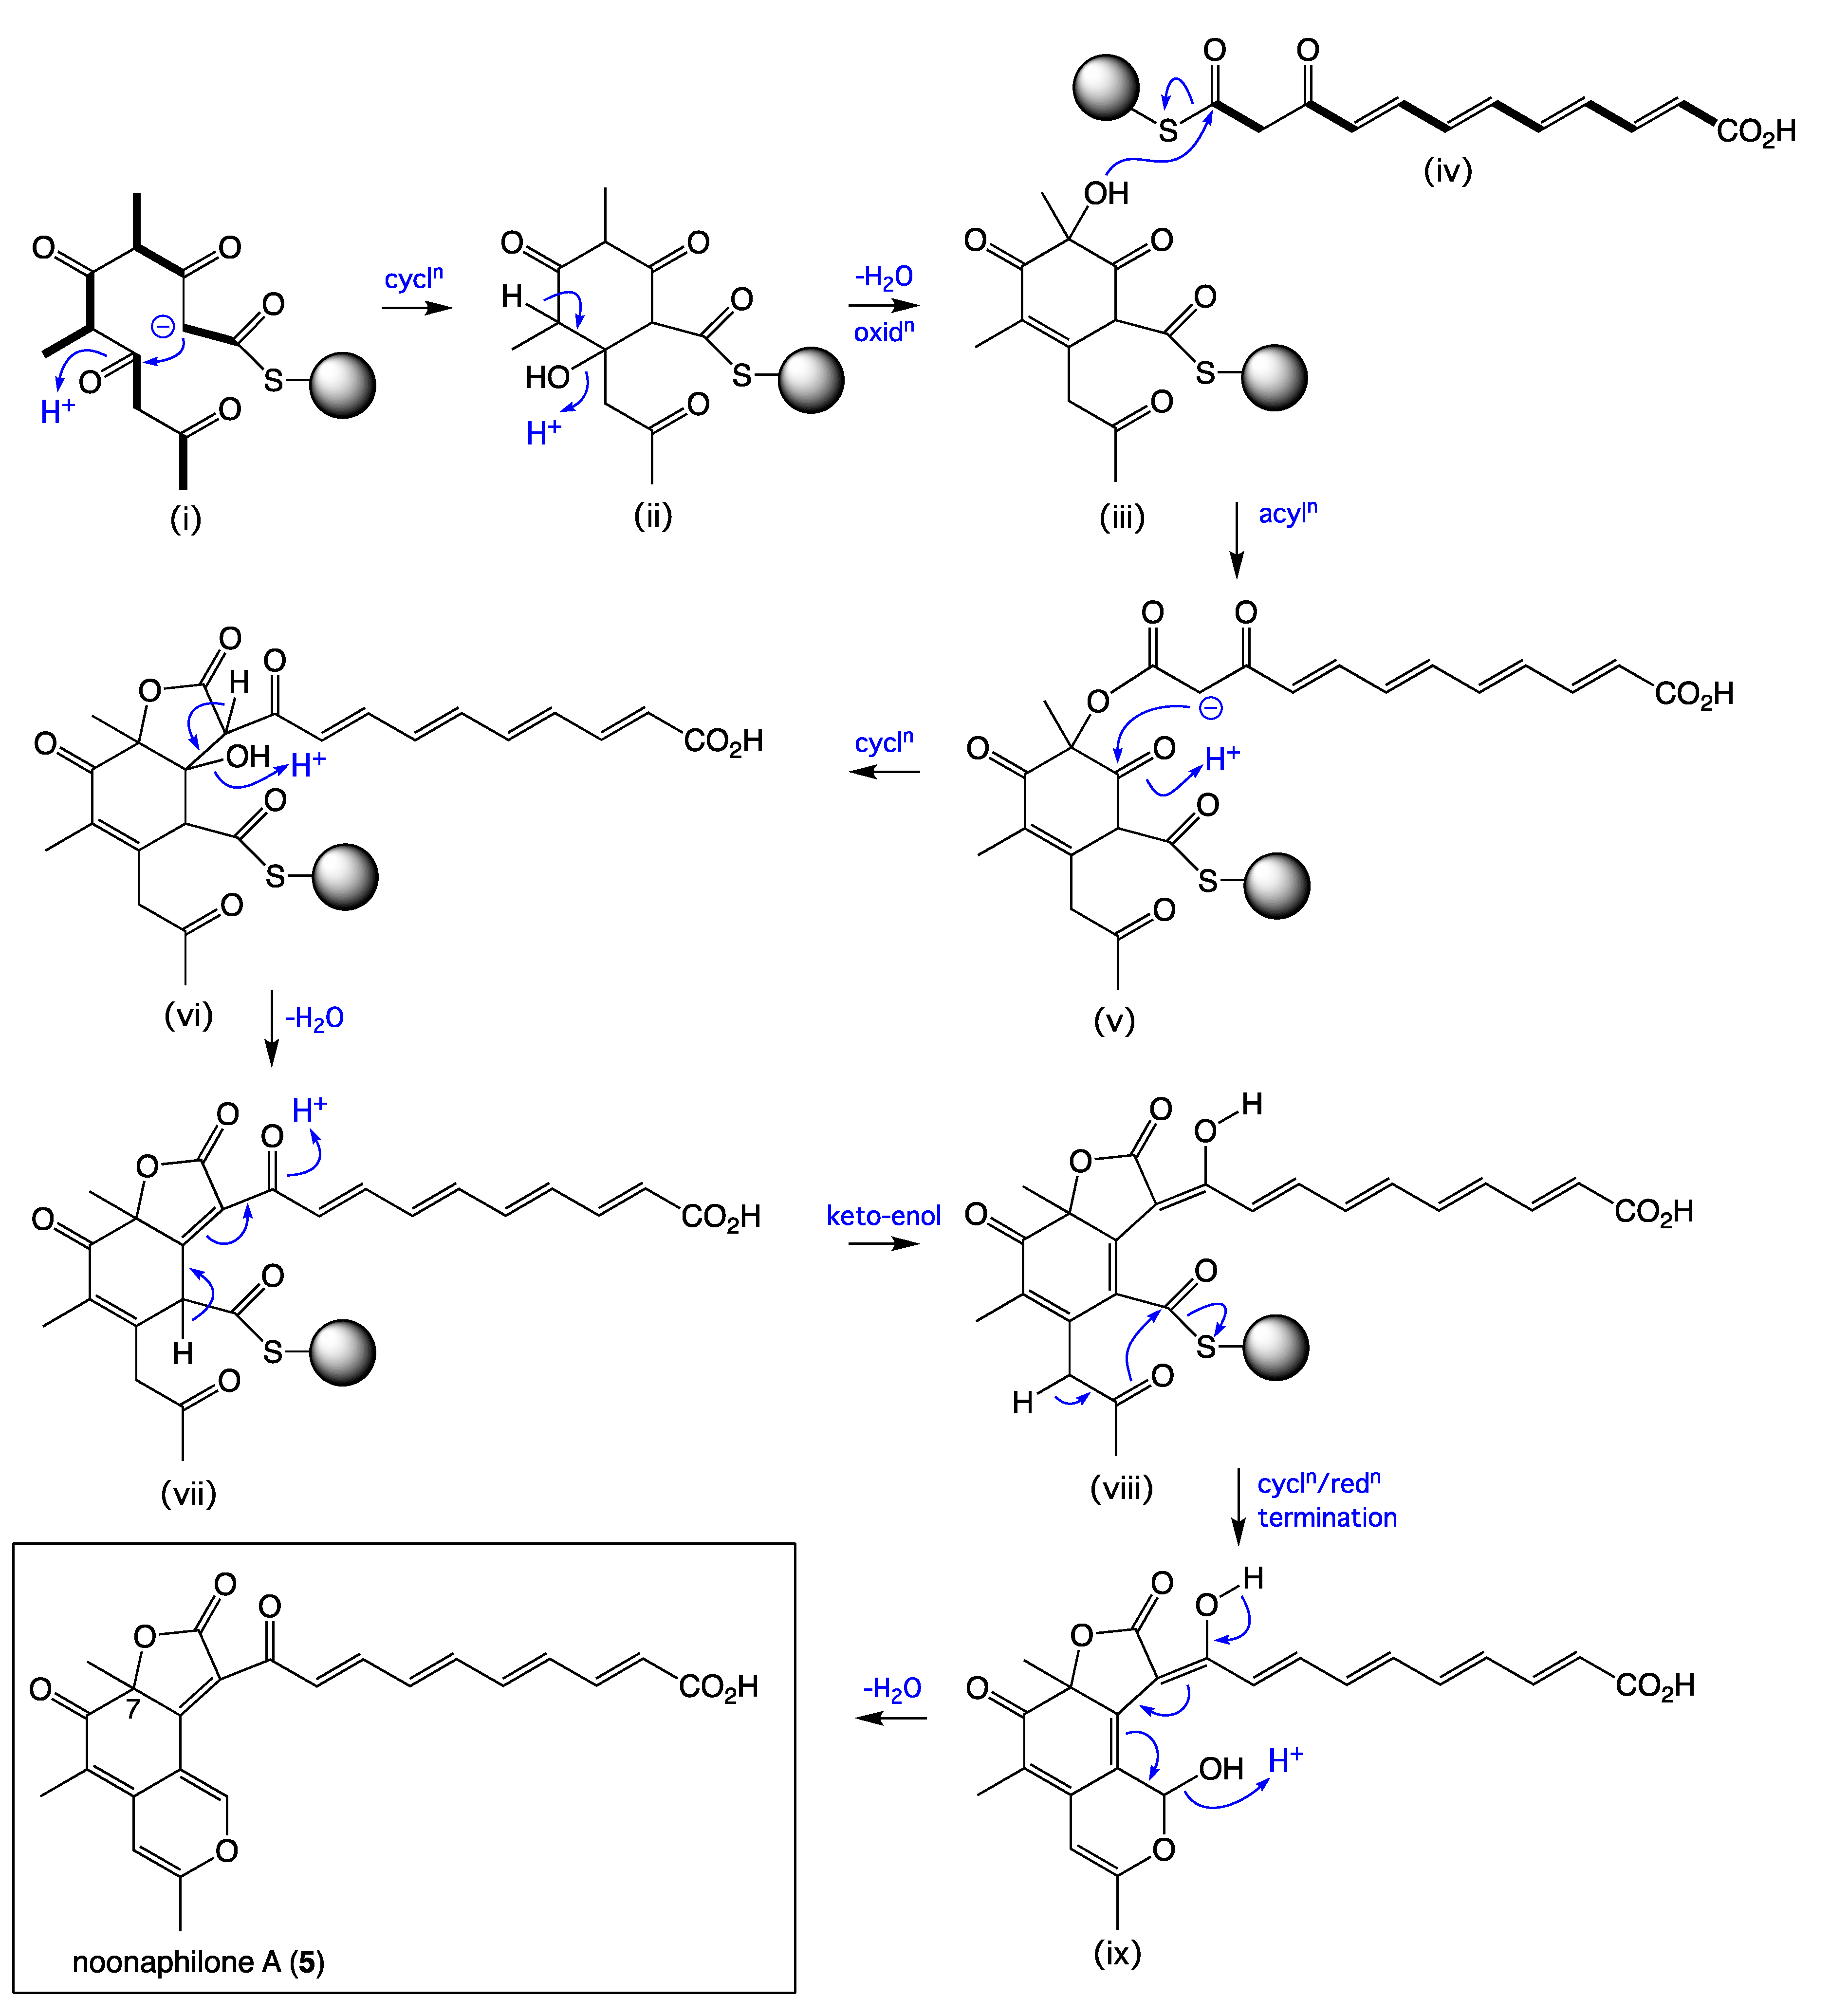
A plausible polyketide synthetase (PKS) biosynthetic pathway leading to
5 (
Scheme 2) could proceed via a typical PKS cascade assembly of three acetate and two propionate residues to arrive at the acyclic intermediate (i), with intramolecular cycloaddition to (ii), and dehydration and oxidation to (iii), followed by acylation with a parallel polyketide polyene (iv) to yield the ester (v). The latter is set up to undergo a second intramolecular cycloaddition to yield (vi) with concomitant loss of water to (vii), followed by keto-enol tautomerization to (viii) and cyclization-mediated termination (and reduction) to (ix), with a facile dehydration yielding
5. This pathway highlights the importance of a stereochemical outcome of the C-7 oxidation in the transformation from (ii) to (iii), which sets up the 7
R absolute configuration for
5. A comparable pathway with the opposite C-7 oxidation stereochemical outcome, and with acylation of (iii) with a shorter saturated polyketide, could explain the 7
S absolute configuration of deflectin 1a (
6).
The natural products
1–
5 did not inhibit the growth (IC
50 > 30 μm) of the fungus
Candida albicans ATCC10231, the Gram-negative bacterium
Escherichia coli ATCC11775, Gram-positive
Bacillus subtilis ATCC6633 and
Staphylococcus aureus ATCC25923 (
Figure S43), or human colorectal (SW620) or lung (NCI-H460) carcinoma cells (IC
50 > 30 μm) (
Figure S44), with the exception of
4, which exhibited modest inhibition of
S. aureus (IC
50 3.4 μm).
4. Materials and Methods
4.1. General Experimental Procedures
Chemicals were purchased from Sigma-Aldrich or Merck (Macquarie Park, NSW, Australia) unless otherwise specified. Solvent extractions were performed using analytical-grade solvents, while HPLC, UPLC and HPLC-MS analyses employed HPLC-grade solvents supplied by Labscan or Sigma-Aldrich (Macquarie Park, NSW, Australia) and filtered/degassed through a 0.45 μm polytetrafluoroethylene (PTFE) membrane prior to use. Deuterated solvents were purchased from Cambridge Isotopes (Tewksbury, MA, USA). Microorganisms were manipulated under sterile conditions in a Laftech class II biological safety cabinet and incubated in either an MMM Friocell incubator (Lomb Scientific, Taren Point, NSW, Australia) or an Innova 42R incubator shaker (John Morris, NSW, Australia) at 26.5 °C. Semi-preparative and preparative HPLCs were performed using Agilent 1100 series HPLC instruments (Mulgrave, Australia) with corresponding detectors, fraction collectors and software. Analytical UPLC chromatograms were obtained on an Agilent 1290 infinity UPLC instrument equipped with a diode array multiple wavelength detector (Zorbax C8 RRHD 1.8 μm, 50 × 2.1 mm column, gradient elution at 0.417 mL/min over 2.50 min from 90% H2O/MeCN to 100% MeCN with an isocratic 0.01% TFA/MeCN modifier). UPLC-QTOF analyses were performed on an Agilent 6545 Q-TOF instrument equipped with an Agilent 1290 Infinity II UHPLC (Zorbax C8 RRHD 1.8 μm, 50 × 2.1 mm column, gradient elution at 0.417 mL/min over 2.5 min from 90% H2O/MeCN to 100% MeCN with an isocratic 0.1% formic acid/MeCN modifier). Chiroptical measurements ([α]D) were obtained on a JASCO P-1010 polarimeter in a 100 × 2 mm cell at specified temperatures. Nuclear magnetic resonance (NMR) spectra were acquired on a Bruker Avance 600 MHz spectrometer (Bremen, Germany) with either a 5 mm PASEL 1H/D-13C Z-Gradient probe or 5 mm CPTCI 1H/19F-13C/15N/DZ-Gradient cryoprobe, controlled by TopSpin 2.1 software, at 25 °C in DMSO-d6, with referencing to residual 1H or 13C solvent resonances (DMSO-d6: δH 2.50 and δC 39.50). High-resolution ESIMS spectra were obtained on a Bruker micrOTOF mass spectrometer (Bremen, Germany) by direct injection in MeOH at 3 μL/min using sodium formate clusters as an internal calibrant. Structural assignments were made with additional information from gCOSY, gHSQC and gHMBC experiments.
4.2. Fungal Isolation and DNA Taxonomic Analysis
A marine sediment collected in 2008 from a location off Perth, Western Australia, was used to inoculate an M1 agar plate (inclusive of 3.3% artificial sea salt), which was incubated at 27 °C for 10–14 days, after which colony selection yielded an array of isolates, including fungus CMB-M0339. Genomic DNA was extracted from the mycelia of CMB-M0339 using the DNeasy Plant Mini Kit (Qiagen) as per the manufacturers protocol, and the 18s rRNA genes were amplified by PCR using the universal primers ITS-1 (5′-TCCGTAGGTGAACCTGCGG-3′) and ITS-4 (5′-TCCTCCGCTTATTGATATGC-3′) purchased from Sigma-Aldrich. The PCR mixture (50 μL) containing 1 μL of genomic DNA (20–40 ng), 200 μM of each deoxynucleoside triphosphate (dNTP), 1.5 mM MgCl
2, 0.3 μM of each primer, 1 U of
Taq DNA polymerase (Fisher Biotec) and 5 μL of PCR buffer was amplified using the following conditions: initial denaturation at 95 °C for 3 min, 30 cycles in series at 94 °C for 30 s (denaturation), 55 °C for 60 s (annealing) and 72 °C for 60 s (extension), followed by one cycle at 72 °C for 6 min. PCR products were purified with a PCR purification kit (Qiagen, Victoria, Australia) and examined using agarose gel electrophoresis, with DNA sequencing performed by the Australian Genome Research Facility (AGRF) at The University of Queensland. A BLAST analysis (NCBI database) of the resulting CMB-M0339 ITS gene sequence (
Figures S2–S5, GenBank accession no. OP132523) revealed 92.5% identity with the fungal strain
Aspergillus noonimiae.
4.3. Global Natural Products Social (GNPS) Molecular Networking
Aliquots (1 μL) of CMB-M0339 cultivation extract (100 μg/mL in MeOH) were analysed on an Agilent 6545 Q-TOF LC/MS equipped with an Agilent 1290 Infinity II UPLC system (Zorbax C
8, 0.21 μm, 1.8 × 50 mm column, gradient elution at 0.417 mL/min over 2.5 min from 90% H
2O/MeCN to MeCN with an isocratic 0.1% formic acid/MeCN modifier). UPLC-QTOF-(+) MS/MS data acquired for all samples at a collision energy of 35 eV were converted from Agilent MassHunter data files (.d) to an mzXML file format using MSConvert software (ProteoWizard 3.0.23199 64-bit) and transferred to the GNPS server (gnps.ucsd.edu). Molecular networking was performed using the GNPS data analysis workflow [
22] employing the spectral clustering algorithm with a cosine score of 0.5 and a minimum of 6 matched peaks. The resulting spectral network was imported into Cytoscape version 3.7.1 [
23] and visualized using a ball–stick layout, where nodes represent parent mass, and cosine score was reflected by edge thickness. Also, group abundances were set as pie charts, which reflected the intensity of MS signals. MS/MS fragmentation analysis was performed on the same machine for ions detected in the full scan range at an intensity above 1000 counts at ten scans/sec, with an isolation width of ~4
m/
z using fixed collision energy and a maximum of 3 selected precursors per cycle. General instrument parameters included gas temperature at 325 °C, drying gas at 10 L/min, nebulizer at 20 psig, sheath gas temperature at 400 °C, fragmentation Volta at 180 eV and skimmer at 45 eV.
4.4. MATRIX Cultivation Profiling
The fungus CMB-M0339 was cultured in a 24-well plate microbioreactor in 11 different media for 10–14 days in solid phase (27 °C), as well as in static (30 °C) and shaken broths (30 °C, 190 rpm) [
24], with regular monitoring of growth (
Figure S6). At this point, wells were individually extracted with EtOAc (2 mL), and the organic phase was centrifuged (13,000 rpm, 3 min) and dried under N
2 at 40 °C to yield 33 extracts. Individual extracts were redissolved in MeOH (30 μL) containing calibrant (2,4-dinitrophenoldecane ether, 50 mg/mL), and aliquots (1 mL) were subjected to both (i) UPLC-DAD analysis (Zorbax C
8 1.8 μm, 2.1 × 50 mm column, gradient elution at 0.417 mL/min over 2.52 min from 90% H
2O/MeCN to 100% MeCN, followed by 0.83 min isocratic elution with MeCN, inclusive of an isocratic 0.01% TFA/MeCN modifier) (
Figure S7) and (ii) GNPS analysis (
Figure S8). This process identified solid-phase D400 as the optimal culture conditions for producing targeted CMB-M0339 natural products.
4.5. Scaled-Up Cultivation and Fractionation
The fungus CMB-M0339 was subjected to a scaled-up SDA cultivation (120 plates) at 27.0 °C for 8 days, after which the combined agar and fungal mycelia were harvested and extracted with EtOAc (2 × 2 L), filtered and concentrated in vacuo at 40 °C to yield an extract (990.7 mg). This extract was sequentially triturated with n-hexane (20 mL), CH2Cl2 (20 mL) and MeOH (20 mL) and concentrated in vacuo to afford n-hexane (12.3 mg), CH2Cl2 (868.9 mg) and MeOH (93.0 mg) soluble fractions. A portion of the CH2Cl2-soluble fraction (600.0 mg) was subjected to preparative reversed-phase HPLC (Phenomenex Luna-C8 10 μm, 250 × 21.2 mm column, gradient elution at 20 mL/min over 20 min from 90% H2O/MeCN to 100% MeCN with constant 0.1% TFA/MeCN modifier) and semi-preparative reversed-phase HPLC (Zorbax C8 5 μm, 9.4 × 250 mm column, isocratic elution at 3 mL/min over 20 min with 63% H2O/MeCN and an isocratic 0.1% TFA/MeCN modifier; Zorbax C18 5 μm, 9.4 × 250 mm column, isocratic elution at 3 mL/min over 30 min with 60% H2O/MeCN and an isocratic 0.1% TFA/MeCN modifier) to yield 1 (15.0 mg, 1.5%), 2 (1.5 mg, 0.1%), 3 (1.4 mg, 0.1%), 4 (1.4 mg, 0.1%) and 5 (8.0 mg, 0.1%) (Scheme S1) (Note: all % yields are weight-to-weight estimates based on unfractionated EtOAc extract).
4.6. Characterization of Metabolites 1–5
Noonaphilone A (
5): reddish-orange solid; [α]
D21 -892 (
c 0.03, EtOAc); NMR (DMSO-
d6),
Table 1 and
Table S6,
Figures S35–S40; HRESI(+)–MS
m/
z, 443.1123 [M+Na]
+ (calculated for C
24H
20O
7Na, 443.1101) (
Figure S41).
4.7. Phylogenetic Comparison of CMB-M0339 with Related Strains
A phylogenetic tree obtained by PhyML Maximum Likelihood analysis was constructed using the top similar 18S rRNA sequences displayed after BLAST on the Refseq RNA NCBI database using CMB-M0339 18S rRNA as queries (
Figures S2–S5). The JC69 model was used to infer phylogeny sequences [
25]. Sequence alignments were produced with the MUSCLE program [
26]. A phylogenetic tree was constructed using the UGENE program using the aforementioned models and visualized using Ugene’s tree view [
27].
4.8. X-ray Crystallography
Crystallographic data (CuKα radiation 1.54184 A°, 2θmax = 125°) were collected on an Oxford Diffraction Gemini S Ultra CCD diffractometer with the crystal cooled to 190 K with an Oxford Cryosystems Desktop Cooler. Data reduction and empirical absorption corrections were carried out with the CrysAlisPro program (Oxford Diffraction version 171.38.46). The structure was solved by direct methods with SHELXT and refined with SHELXL [
28]. The thermal ellipsoid diagrams were generated with Mercury [
29]. All crystallographic calculations were carried out within the WinGX graphical user interface [
30]. The crystal data for
4 and
5 in CIF format were deposited in the CCDC database (CCDC 2352835 and 2352836, respectively) (
Tables S7–S10).
4.9. Antifungal Assay
The fungus
Candida albicans ATCC10231 was streaked onto a Luria–Bertani (LB) agar plate and was incubated at 37 °C for 48 h, after which a colony was transferred to fresh LB broth (15 mL) and the cell density adjusted to 10
4–10
5 CFU/mL. Test compounds were dissolved in DMSO and diluted with H
2O to prepare 600 µM stock solutions (20% DMSO), which were serially diluted with 20% DMSO to provide concentrations from 600 µM to 0.2 µM in 20% DMSO. An aliquot (10 µL) of each dilution was transferred to a 96-well microtiter plate, and freshly prepared fungal broth (190 µL) was added to prepare final concentrations of 0.01–30 µM in 1% DMSO. The plates were incubated at 27 °C for 48 h, and the optical density of each well was measured spectrophotometrically at 600 nm using a POLARstar Omega plate (BMG LABTECH, Offenburg, Germany). Amphotericin B was used as the positive control (40 µg/mL in 10% DMSO). The IC
50 value was calculated as the concentration of the compound or antibiotic required for 50% inhibition of the bacterial cells using Prism 9.0 (GraphPad Software Inc., La Jolla, CA, USA) (
Figure S43).
4.10. Antibacterial Assay
The test bacteria (Gram-negative
Escherichia coli ATCC11775, and Gram-positive
Staphylococcus aureus ATCC25923 and
Bacillus subtilis ATCC6633) were streaked onto an LB agar plate and incubated at 37 °C for 24 h, after which a colony was transferred to fresh LB broth (15 mL), and the cell density was adjusted to 10
4–10
5 CFU/mL. Test compounds were dissolved in DMSO and diluted with H
2O to produce 600 µM stock solutions (20% DMSO), which were serially diluted with 20% DMSO to prepare concentrations from 600 µM to 0.2 µM in 20% DMSO. An aliquot (10 µL) of each dilution was transferred to a 96-well microtiter plate, and freshly prepared microbial broth (190 µL) was added to provide final concentrations of 0.01–30 µM in 1% DMSO. The plates were incubated at 37 °C for 24 h, and the optical density of each well was measured spectrophotometrically at 600 nm using a POLARstar Omega plate (BMG LABTECH, Offenburg, Germany). Rifampicin was used as the positive control (40 µg/mL in 10% DMSO) for Gram-positive bacteria, and a mixture of rifampicin and ampicillin was used as the positive control for Gram-negative bacteria. The IC
50 value was calculated as the concentration of the compound or antibiotic required for 50% inhibition of the bacterial cells using Prism 9.0 (GraphPad Software Inc., La Jolla, CA, USA) (
Figure S43).
4.11. Cytotoxicity Assays
Human colorectal (SW620) and lung carcinoma (NCI-H460) cells were seeded evenly in a 96-well microplate (2000 cells/well in 180 μL of Roswell Park Memorial Institute (RPMI) 1640 medium supplemented with 10% FBS (fetal bovine serum)), and the plate was incubated for 18 h (37 °C; 5% CO
2) to allow the cells to attach. Test compounds were dissolved in 5% DMSO (
v/
v), and dilutions were generated from 300 μM to 300 nM. Aliquots (20 μL) of each dilution (or 5% aqueous DMSO for the negative control and 5% aqueous SDS for the positive control) were added to the plate in duplicate. After 68 h of incubation (37 °C; 5% CO
2), a solution of 3-(4,5-dimethylthiazol-2-yl)-2,5-diphenyltetrazolium bromide (MTT; Sigma, USA) in phosphate buffered saline (PBS) was added to each well to a final concentration of 0.4 mg/mL, and the plates were incubated for a further 4 h (37 °C; 5% CO
2), after which the medium was carefully aspirated and precipitated formazan crystals were dissolved in DMSO (100 μL/well). The absorbance of each well at 580 nm was measured with a PowerWave XS Microplate Reader from Bio-Tek Instruments, Inc. (Vinooski, VT, USA), and IC
50 values were calculated as the concentration of the compound required for 50% inhibition of the cancer cells using Prism 9.0 from GraphPad Software, Inc. (La Jolla, CA, USA) (
Figure S44).

