Abstract
Background: CDK4/6 (Cyclin-dependent kinases 4/6) are the key promoters of cell cycle transition from G1 phase to S phase. Thus, selective inhibition of CDK4/6 is a promising cancer treatment. Methods: A total of 52,765 marine natural products were screened for CDK4/6. To screen out better natural compounds, pharmacophore models were first generated, then the absorption, distribution, metabolism, elimination, and toxicity (ADMET) were tested, followed by molecular docking. Finally, molecular dynamics simulation was carried out to verify the binding characteristics of the selected compounds. Results: Eighty-seven marine small molecules were screened based on the pharmacophore model. Then, compounds 41369 and 50843 were selected according to the ADMET and molecular docking score for further kinetic simulation evaluation. Finally, through molecular dynamics analysis, it was confirmed that compound 50843 maintained a stable conformation with the target protein, so it has the opportunity to become an inhibitor of CDK4/6. Conclusion: Through structure-based pharmacophore modeling, ADMET, the molecular docking method and molecular dynamics (MD) simulation, marine natural compound 50843 was proposed as a promising marine inhibitor of CDK4/6.
1. Introduction
The uncontrolled cyclin D-CDK4/6-INK4-RB (Cyclin-dependent kinases 4/6-retinoblastoma protein) signaling pathway is usually associated with the abnormal proliferation of tumor cells [1]. Furthermore, in the G1 to S phases of the cell cycle, the uncontrolled signal pathway leads to the over phosphorylation of RB and the excessive separation of E2F transcription factors, which eventually leads to the uncontrollable proliferation of cells [2,3,4,5]. In addition, breast cancer is closely related to the anomalous expression of this pathway [6]. Therefore, inhibiting the expression of CDK4/6 can play a key role in the treatment of tumors [7,8]. Moreover, CDKs are a conserved kinase family [9]. Amino acid sequence analysis showed that CDK4 and CDK6 proteins have 71% similar sequences, which leads to their similar functions [10]. The crystal structures of CDK4/6 selected in this study and the Ramachandran plot are shown in Supplementary Figure S1. It is worth mentioning that the Ramachandran plot reflects the rationality of the selected CDK4 and CDK6 structures to a certain extent. The key amino acids at the active site of CDK4/6 ATP include His-95, Val-96, Asp-97 and Thr-102, and His-100, Val101, Asp-102 and Thr-107, respectively [11,12]. The confirmation of the above crystal structure and the key amino acids at the active site provides a structural basis for the discovery of CDK4/6 inhibitors.
At present, some achievements have been made in the development of CDK4/6 inhibitors, resulting in the emergence of many selective inhibitors: Palbociclib, Abemaciclib, Ribociclib, Trilaciclib and so on [13,14,15,16]. Clinical trials of these drugs in the treatment of cancer have also been carried out worldwide. Most clinical trials are the combination of CDK4/6 inhibitors and other drugs (such as tyrosine kinase inhibitors, HER2, EGFR inhibitors, PI3K kinase inhibitors, etc.) [17]. In addition, the latest generation of CDK inhibitors can selectively inhibit CDK4/6 while having little effect on other CDKs and maintain good anticancer effects while obtaining acceptable toxicity. However, drug resistance to approved CDK4/6 inhibitors has emerged and gradually increased [18].
Due to the vast marine environment, marine organisms are regarded as the most abundant source of bioactive natural products, and the compounds obtained from them reflect their biological diversity [19]. In the past few years, with the full exploitation of other resources, the marine environment has generated a new research field, and many drugs from marine natural products have entered clinical trials [20]. Recent studies have pointed out that 170 marine natural products and their synthetic analogues have strong anticancer biological activities [21]. In addition to anticancer activities, marine natural products have structural characteristics different from other environmental natural products and have a variety of biological activities, such as antibacterial, antiviral and antiinflammatory [22]. Therefore, marine natural products have received an increasing amount of attention from scientists. Natural products are the best choice for the source of new drugs [23,24]. We collected three marine natural product databases. The Seaweed Metabolite Database (SWMD), Comprehensive Marine Natural Product Database (CMNPD) and Marine Natural Product Database (MNPD) [25,26,27], and screened two small molecules of marine origin with CDK4/6 inhibitory potential from the databases by a series of computer-assisted methods.
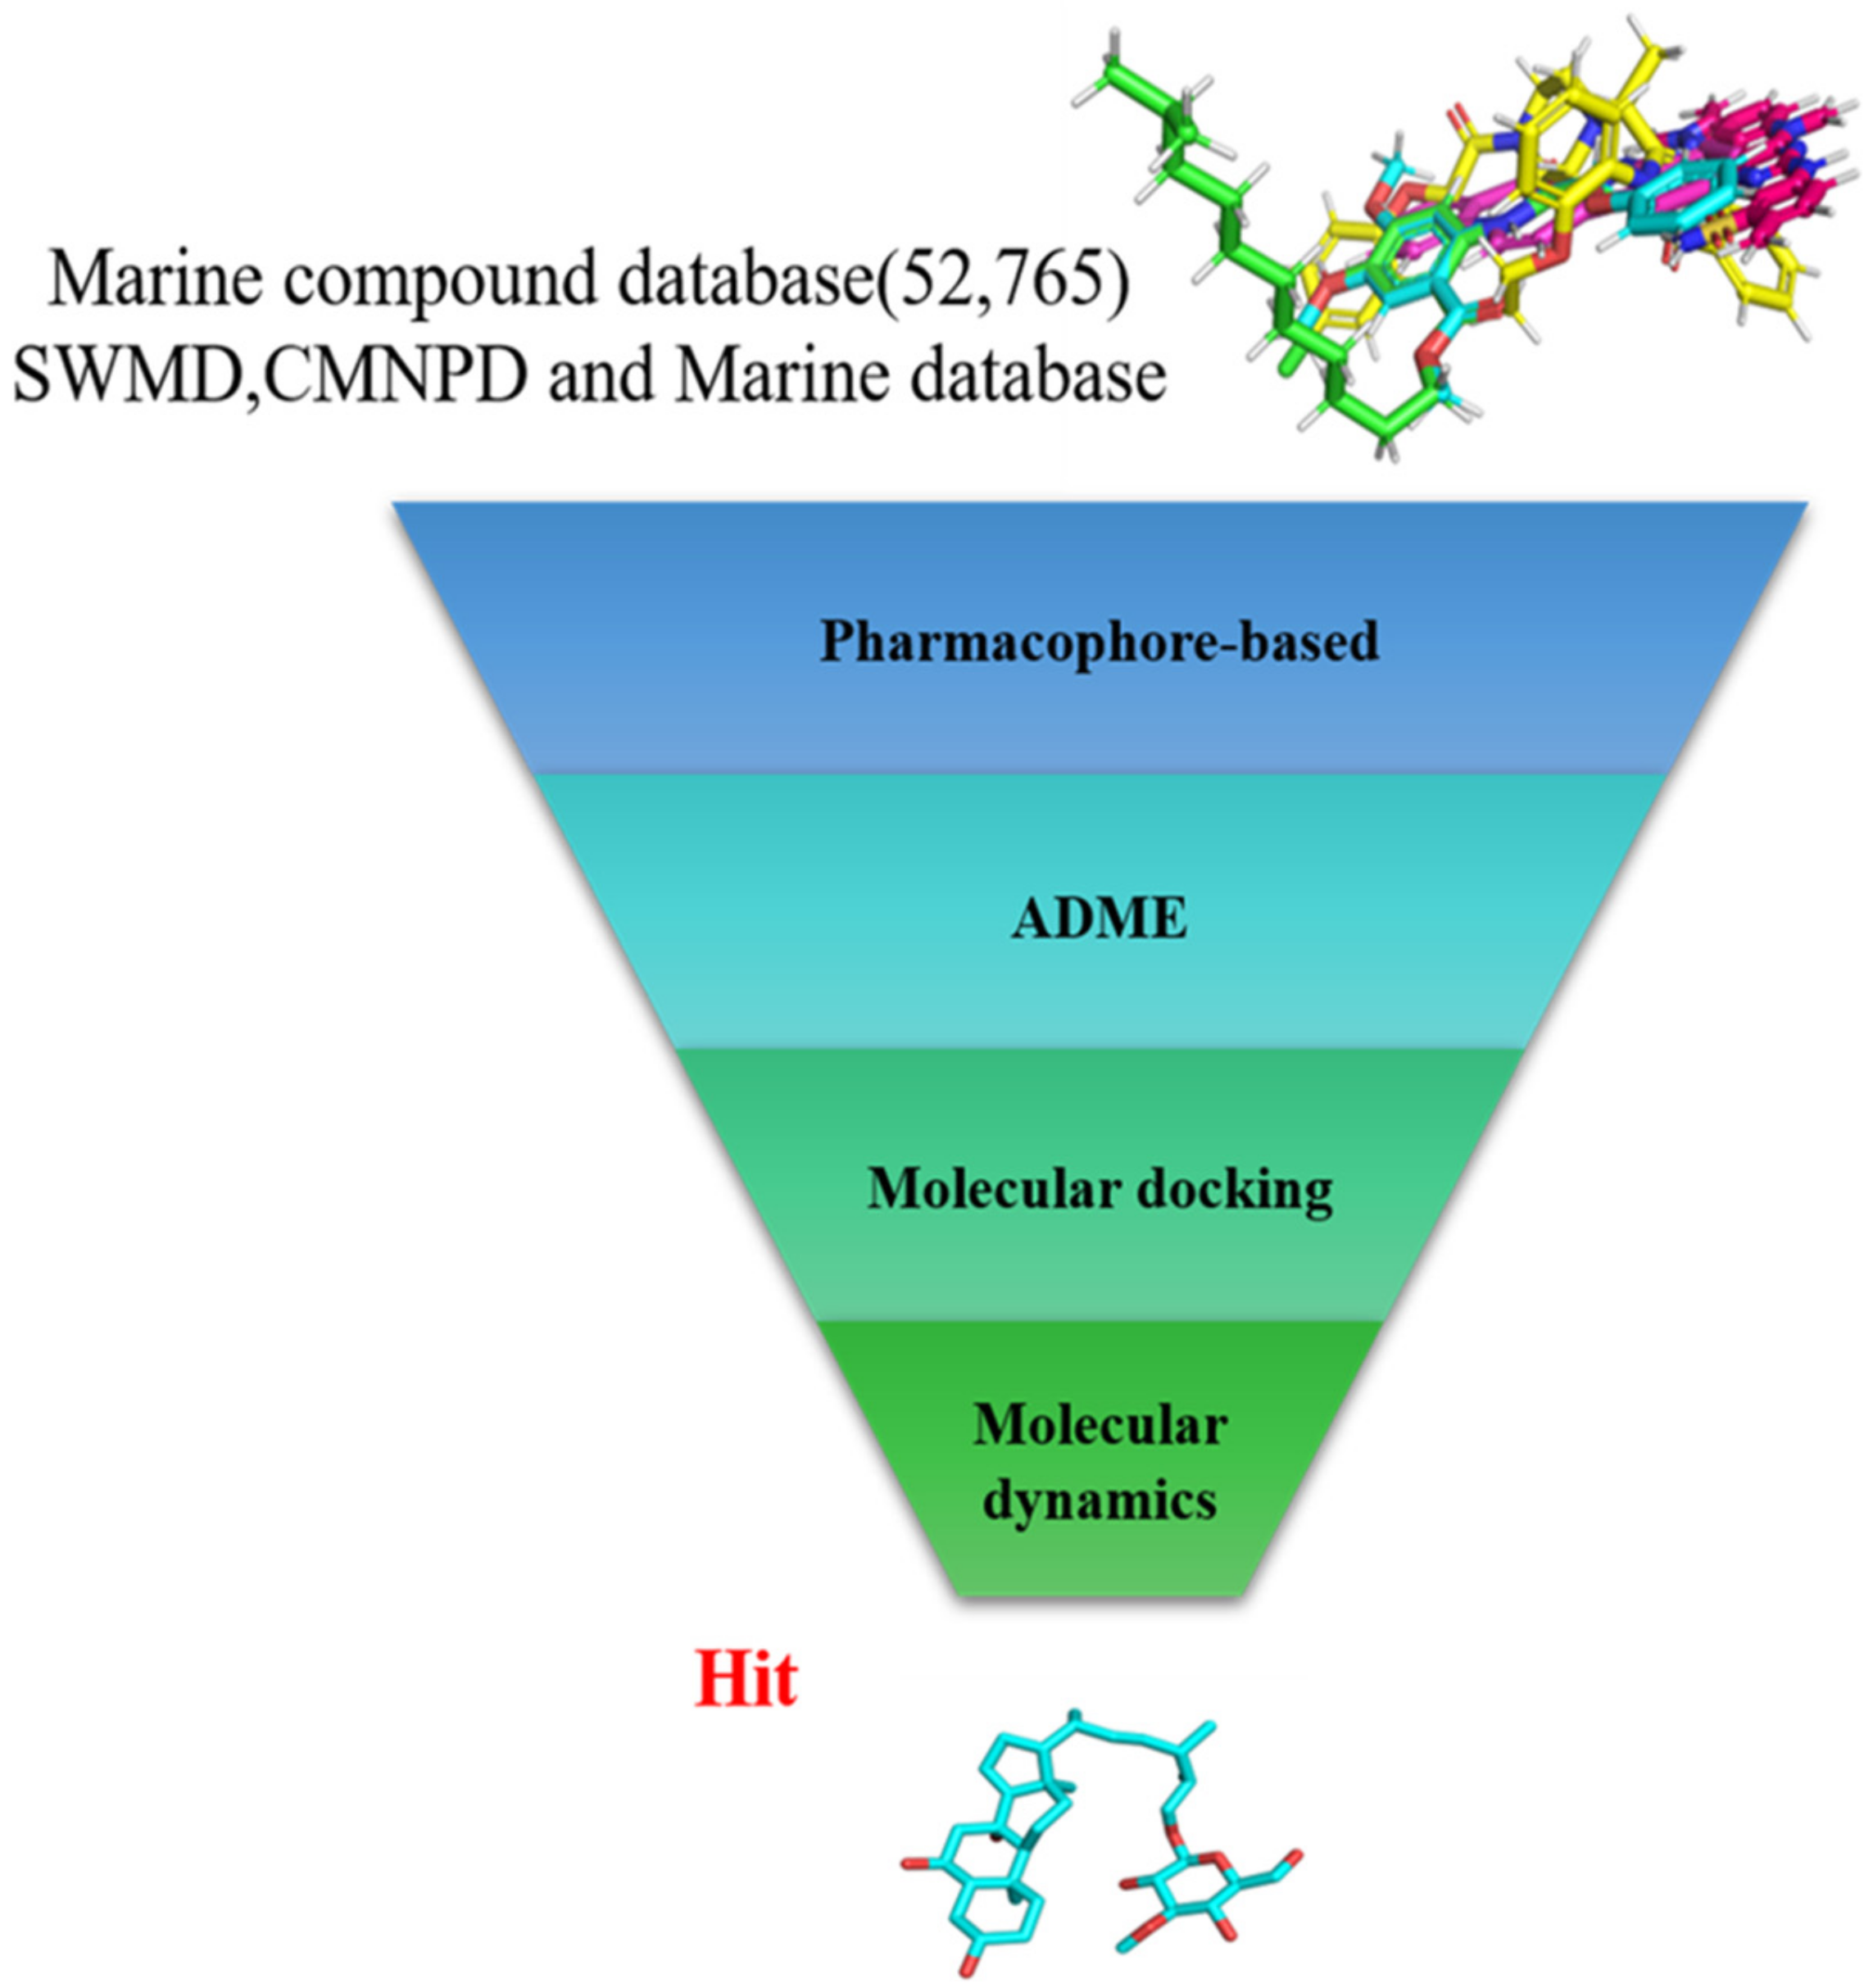
In the present study, we found two new chemical inhibitors with CDK4/6 inhibitory properties by pharmacophore modeling, ADMET property prediction, molecular docking and molecular dynamics (MD) simulation methods [28] (Figure 1).

Figure 1.
Workflow of this study: marine compound database construction, a pharmacophore, ADMET, molecular docking, and molecular dynamics.
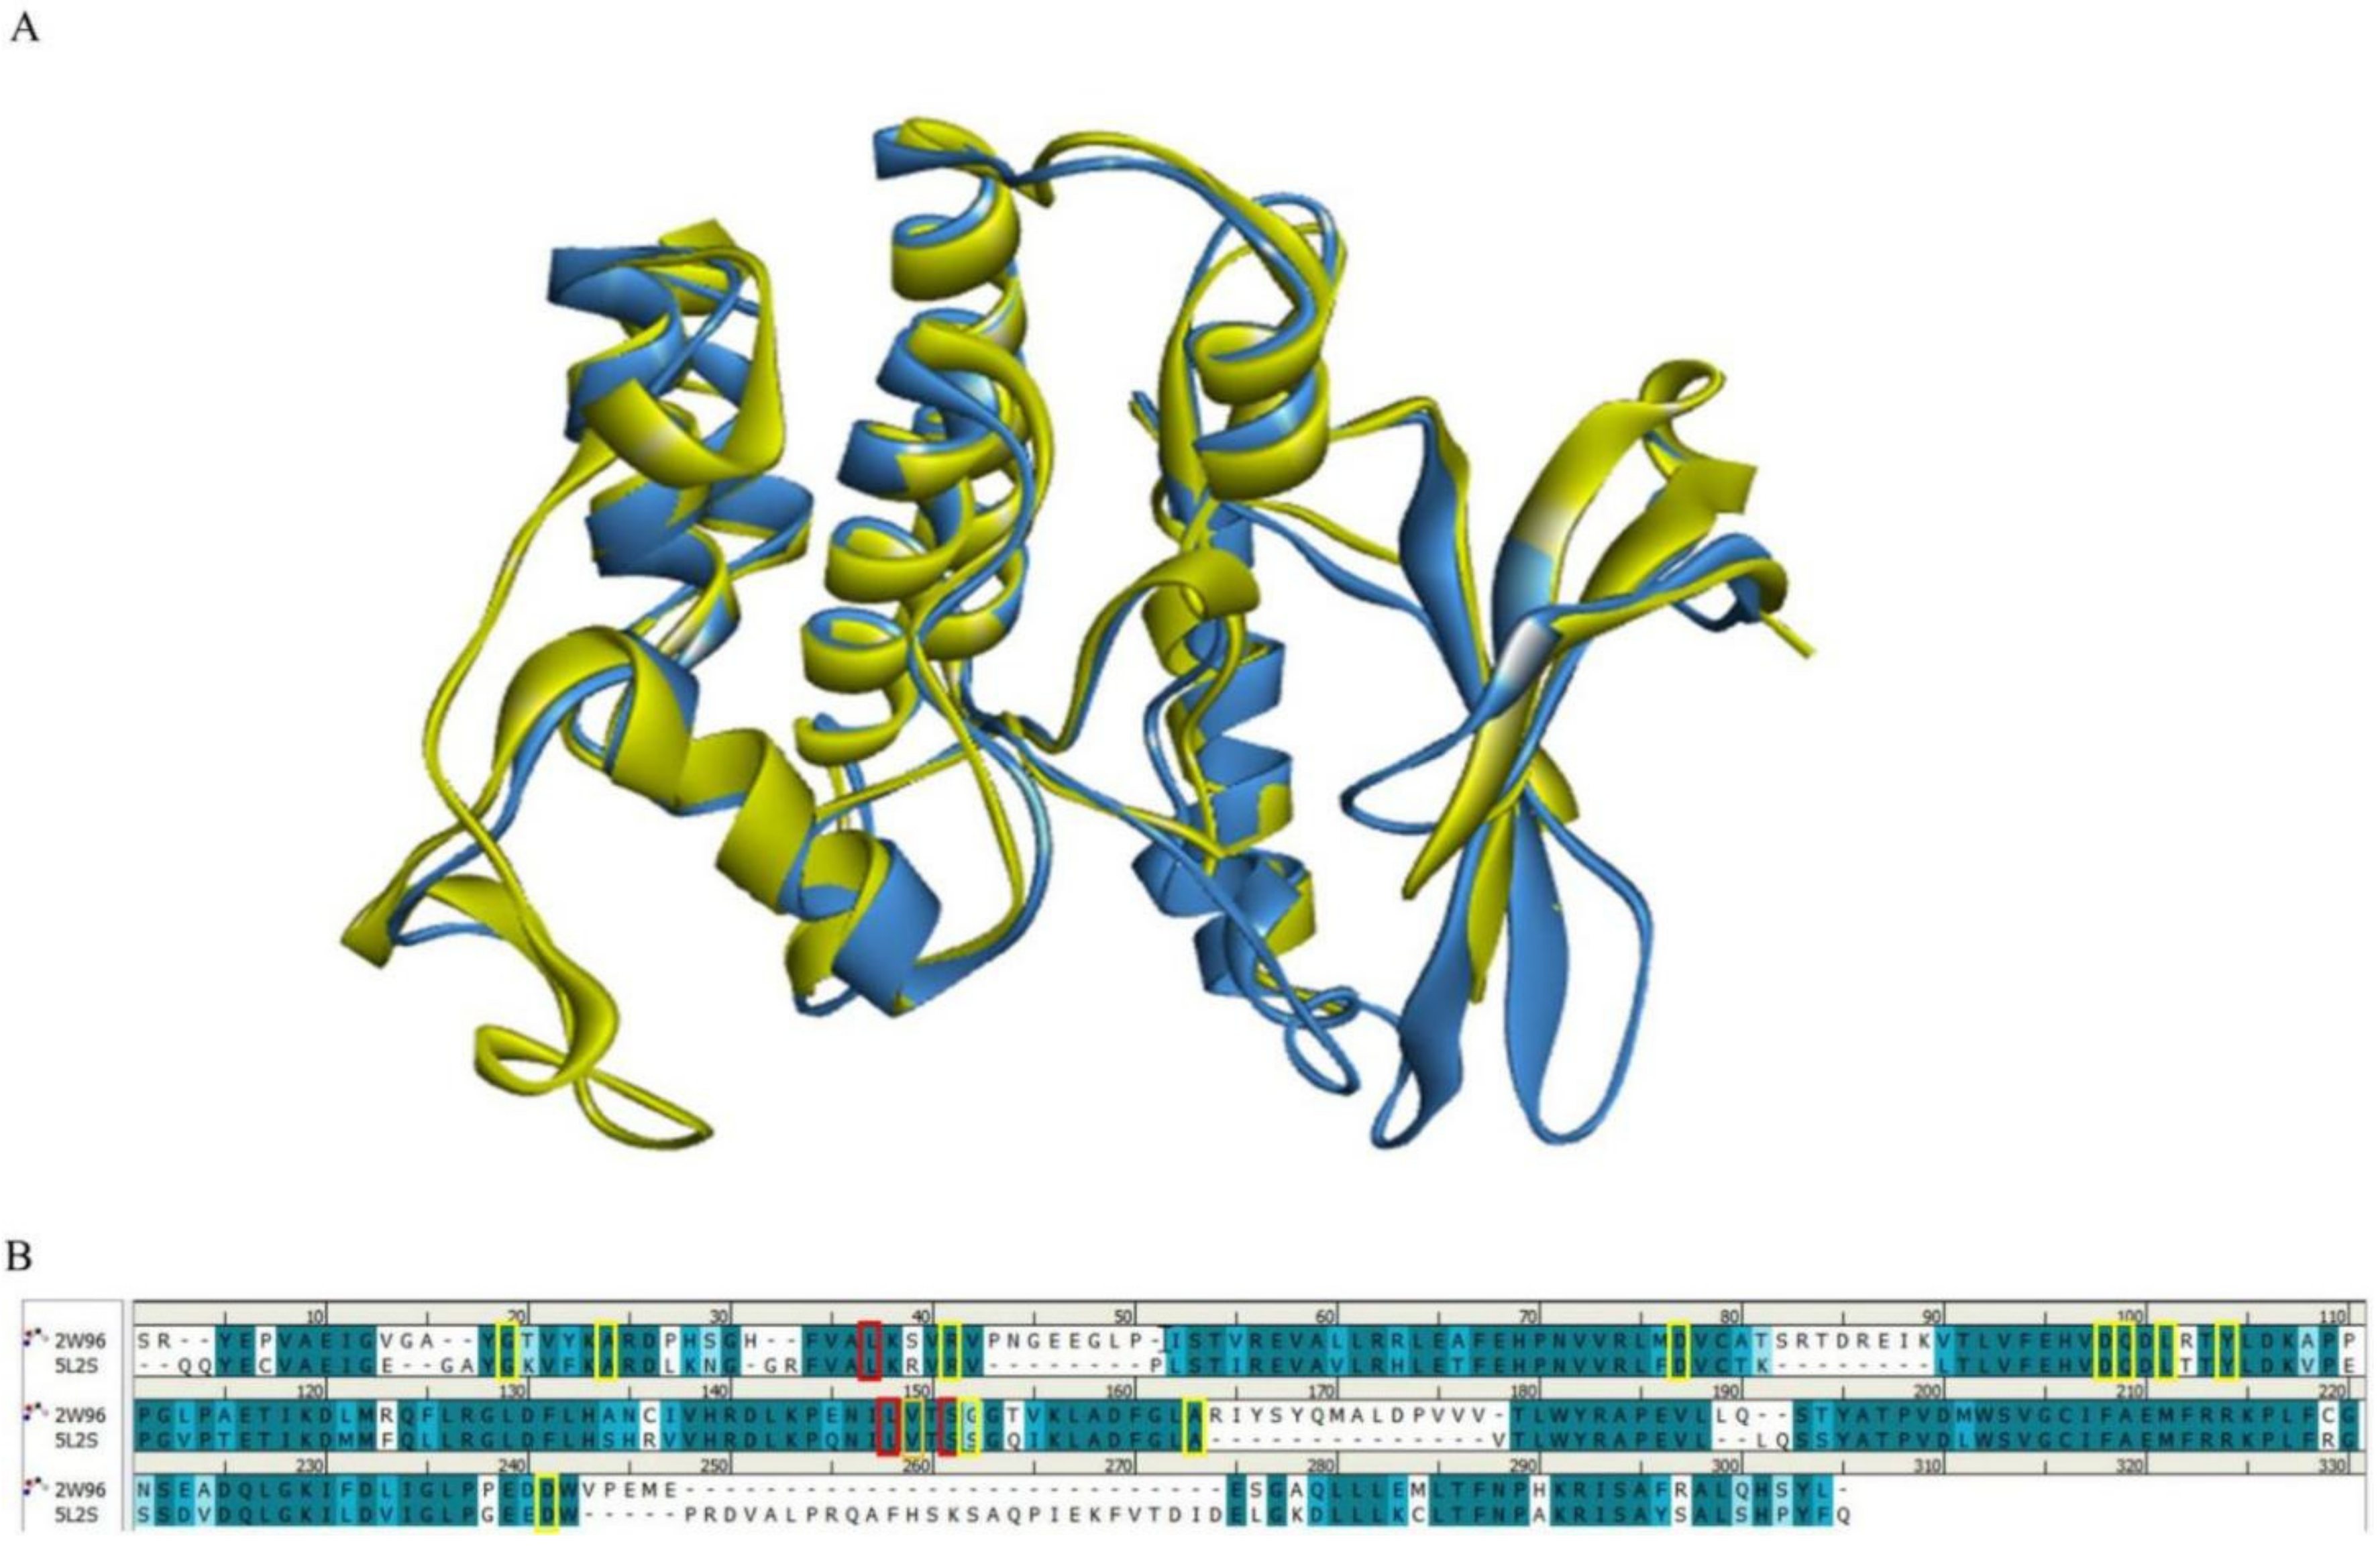
Considering that CDK4 is a dimer and that the active residues of both proteins are mainly in the A-chain, we only compared the stacked A-chain structures of CDK4 and CDK6. The Alignment C-α distance cutoff was set as 2.5, and length cutoff was set as 50. The RMSD (in angstrom) for the two protein structures was 1.1380. It is generally accepted that a smaller RMSD value means a higher overlap in protein spatial structure, and an RMSD value of less than 2 Å is good [29].
Figure 2 shows a comparison of the A-chain sequences of CDK4 and CDK6. The PDB structure-defining active site boundary residues of CDK4 are highlighted in red and the PDB structure-defining active site boundary residues of CDK6 are highlighted in yellow. The darker cyan residue pairs represent that they are identical, the lighter the blue the greater the difference between the residue pairs and the white residue pairs represent that they are completely different in origin. It is easy to see that the active site boundary residues of both structural A-chains are almost always highly homologous. It is worth noting that we are studying here the protein structure active residues published by PDB.

Figure 2.
Comparison of CDK4/6 protein structures and key residues. (A) Schematic representation of the superimposed CDK4 and CDK6 structures. The CDK4 (PDB: 2W96) structure is shown in blue and the CDK6 (PDB: 5L2S) structure is shown in yellow. (B) Comparison of the amino acid sequences of CDK4 (PDB: 2W96) and CDK6 (PDB: 5L2S). Residues defining the active site boundary are highlighted in red for the PDB structure of CDK4 and in yellow for the PDB structure of CDK6.
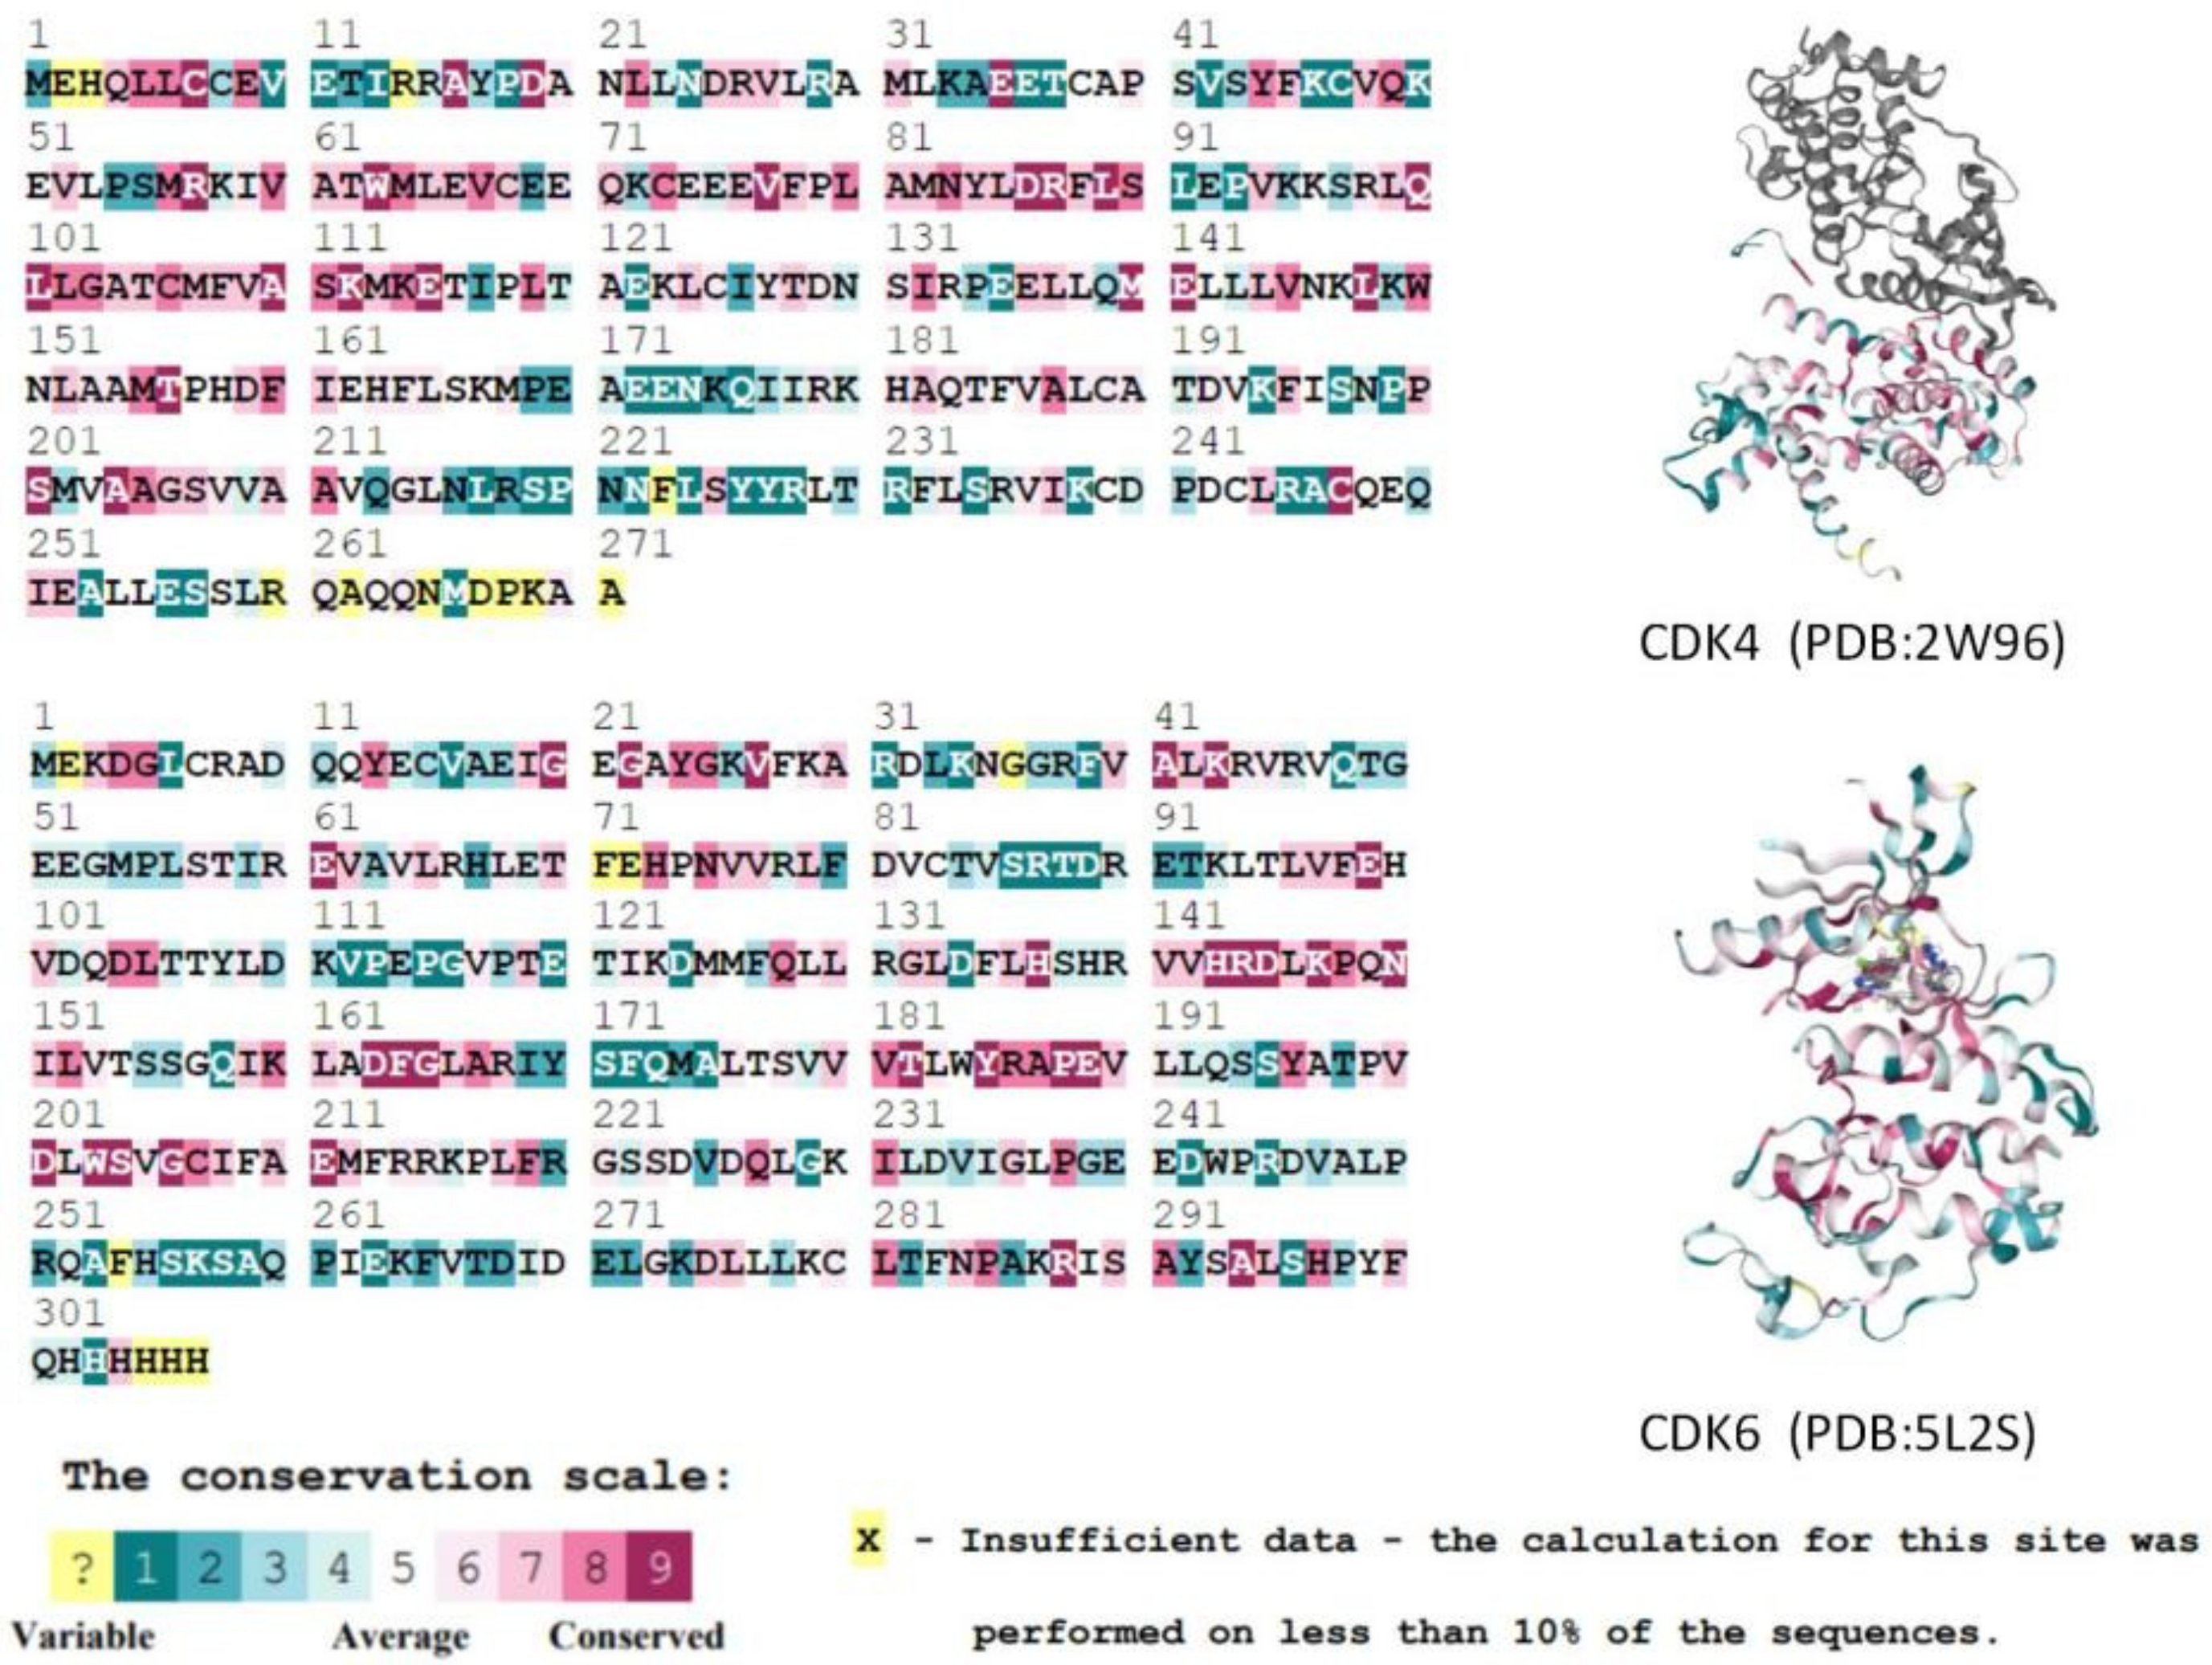
In addition, we calculated evolutionary conserved scores for residues using the ConSurf-DB online tool for two selected CDK protein structures (CDK4: 2W96; CDK6: 5L2S). Consecutive conserved scores were divided into discrete classes of nine levels, with level 1 indicating the most variable residues and level 9 indicating the most conserved position. Figure 3 shows the conservativeness of the sequences of residues in the A-chain of the CDK4 and CDK6 proteins. Key residues in the ATP-binding pocket of the CDK4/6 proteins [11,12] are all considered to have a moderate (class 5) or higher conservativeness score. In summary, it is known that the active binding site residues of CDK4/6 are highly homologous and conserved, and thus do not affect the binding of any ligands to the protein.

Figure 3.
Comparison of CDK4 and CDK6 protein A-chain residue sequences and conservativeness. Higher scoring levels indicate higher conservativeness of residues. In this case, the yellow residues (which do not contain the active residues of the proteins) could not be classified by the conservativeness grade due to their low frequency of occurrence in the database.
2. Results
2.1. Pharmacophore Models: Construction, Selection and Application
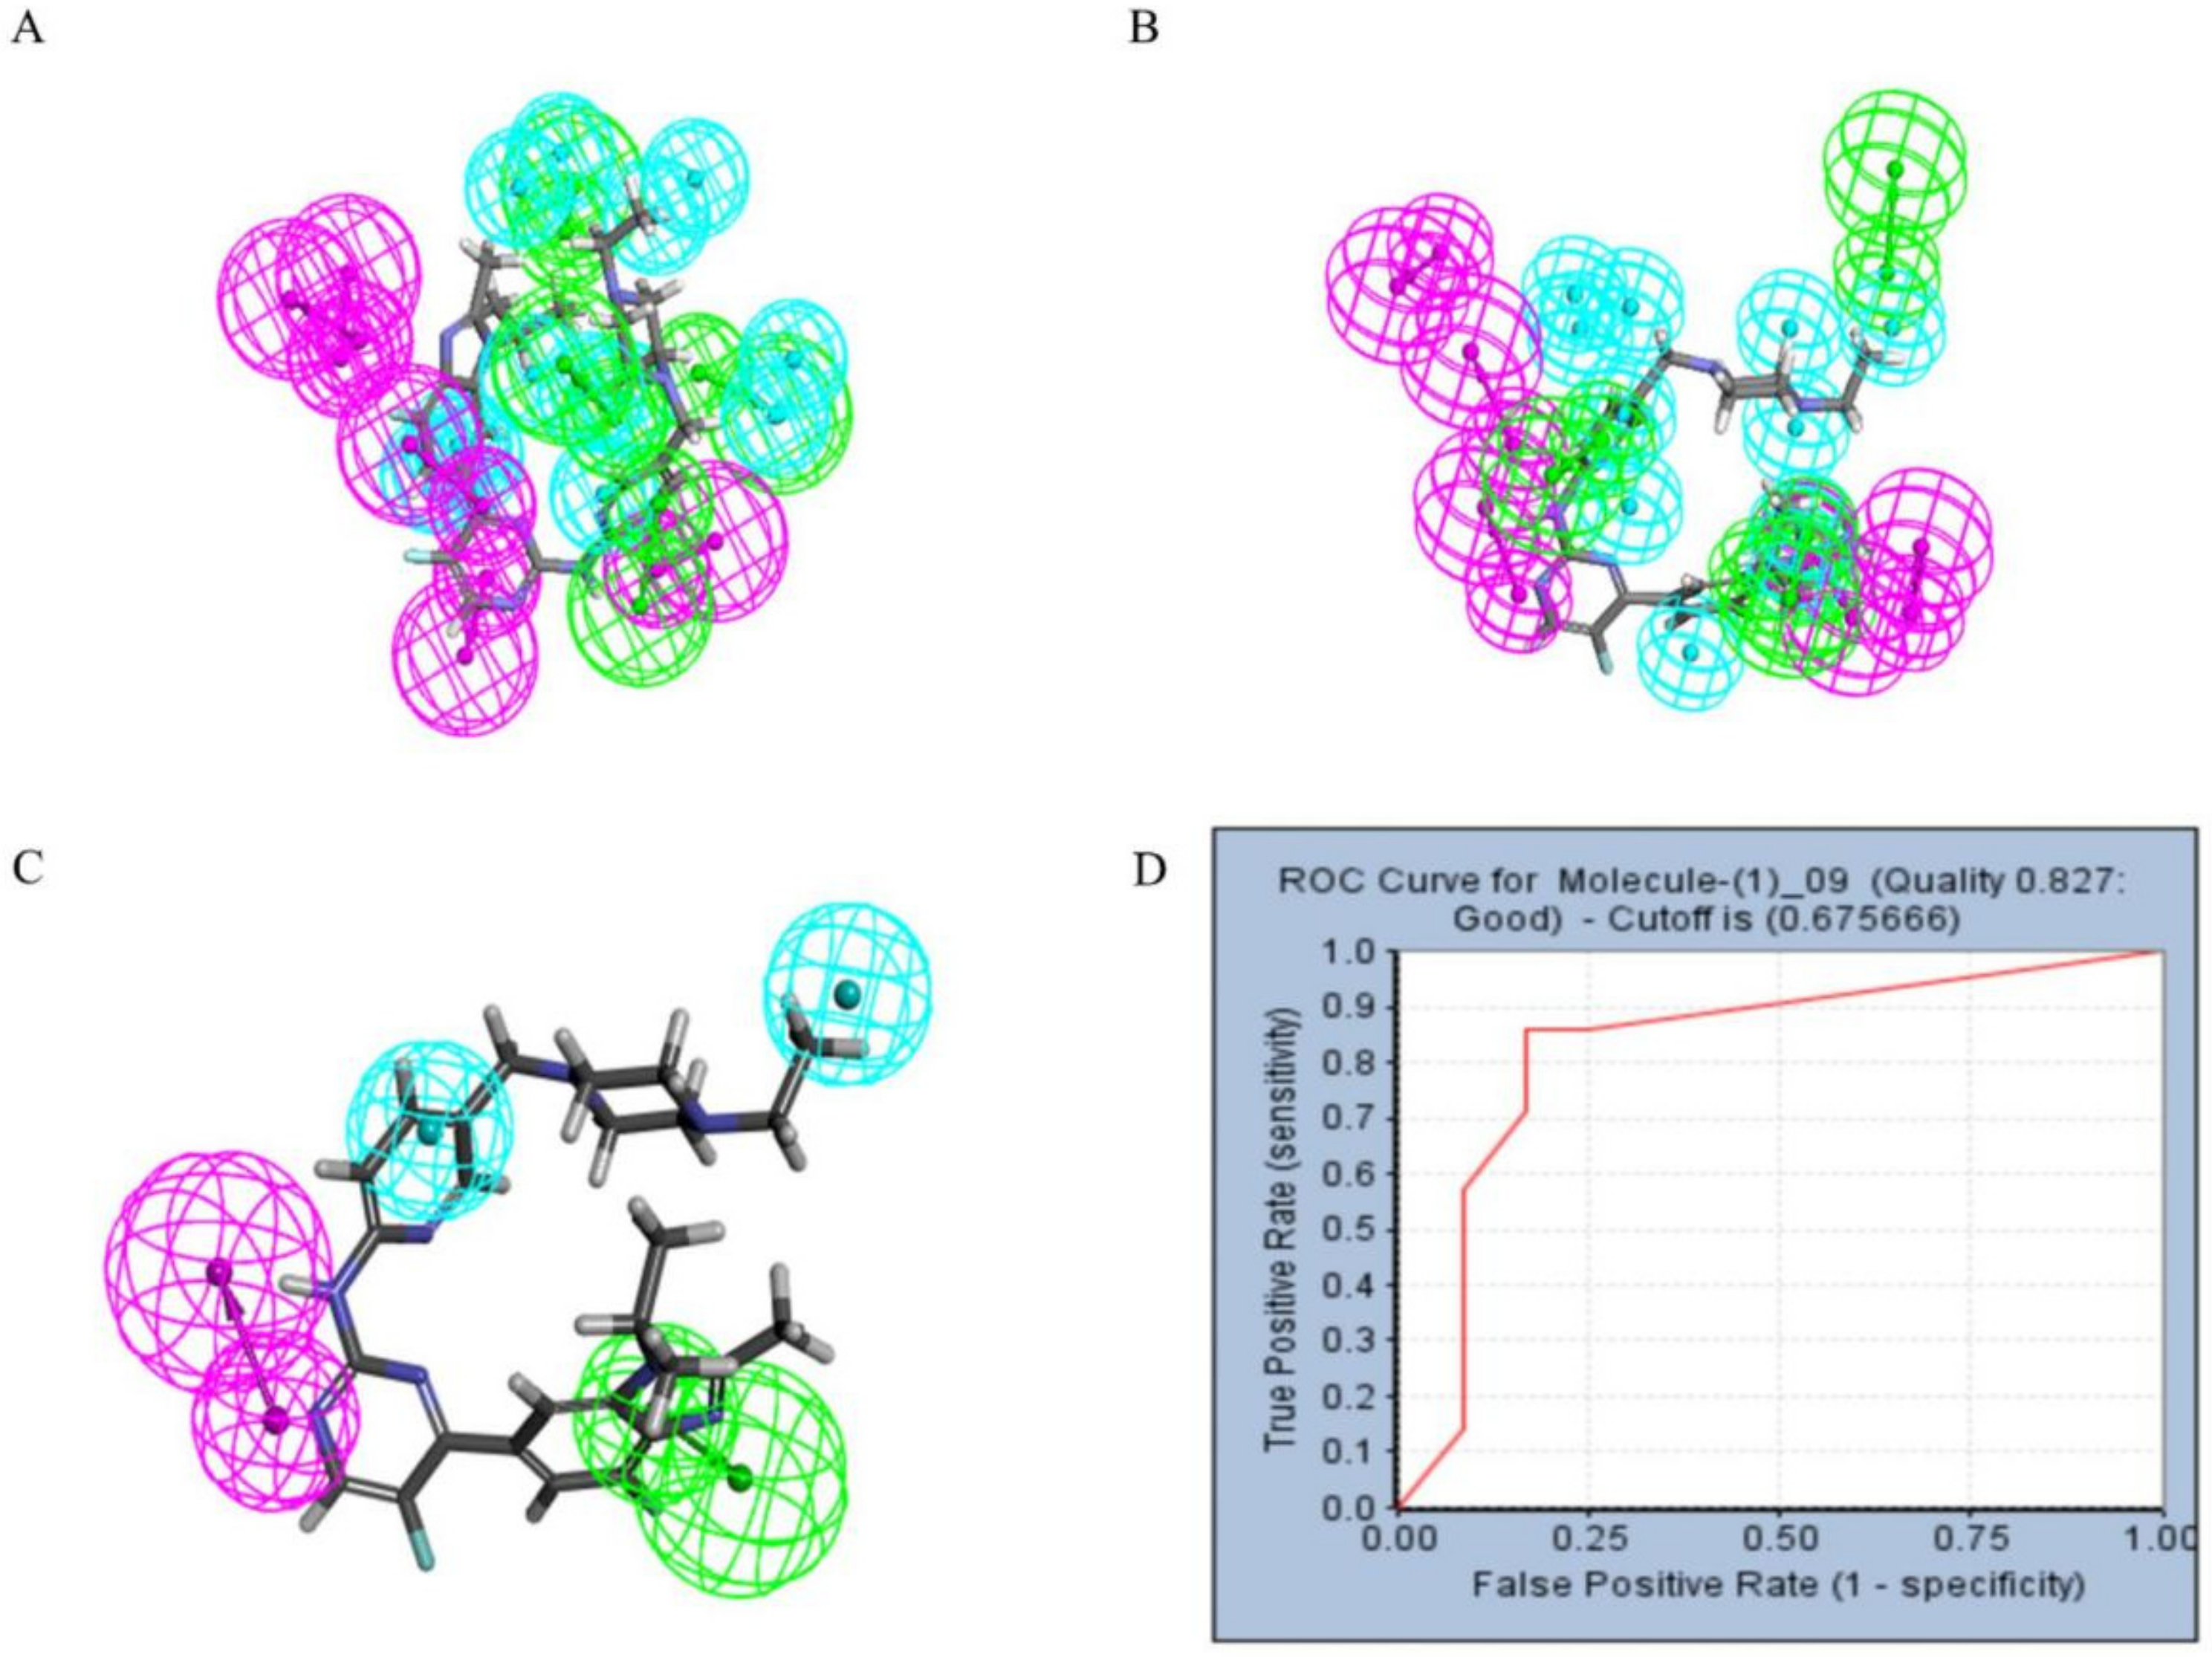
Pharmacophore models can be used to simulate the active conformation of ligand molecules through conformational search and molecular superimposition and can be used to infer and interpret possible interaction patterns between receptor and ligand molecules. Ten common feature pharmacophore models were built with the Discovery Studio platform. The results show that all 10 pharmacophore models have good active/inactive molecule recognition. Figure 4a shows the models 01–05 and Figure 4b illustrates the pharmacophore models 06–10. As shown in Table 1, the pharmacophore model Phar09 (HHDA) had the lowest false positive and false negative error rates and the highest sensitivity for the test set molecules. In addition, the area under the curve (AUC) for Phar09 was 0.827, confirming the model’s ability to identify positive molecules well (Figure 4d). The superimposed effect of Abemaciclib with Phar09 can be seen in Figure 4c. A library of 50,000 molecules of marine compounds was screened with the model Phar09. All molecules were pretreated with the Prepare Ligand program. The marine drug library was screened using Pharmacophore 09, and 87 molecules with a fit value greater than 3.50 were selected for further study.

Figure 4.
The pharmacophore model and receiver operating characteristic (ROC) curve validation. Hydrophobic group features are shown as blue spheres, hydrogen bond acceptor features are shown as purple spheres and hydrogen bond donor features are shown as green spheres. (A) Pharmacophore model 01–05. (B) Pharmacophore model 06–10. (C) Coincidence effect drawing of Abemaciclib and pharmacophore 09. (D) ROC curve.

Table 1.
The characteristic composition, the number of true/false positive and negative molecules, and the sensitivity of 10 pharmacophore models were constructed. Feature “H” stands for hydrophobic group, while feature “A”, “D” stand for hydrogen bond acceptor and hydrogen bond donor, respectively.
2.2. Absorption, Distribution, Metabolism, Excretion, and Toxicity (ADMET) Analysis
The pharmacokinetic method of ADMET (drug absorption, distribution, metabolism, excretion, and toxicity) is important in drug design and drug screening. We built a prediction process in Discovery Studio. We analyzed the ADMET descriptors of 87 marine molecules selected by pharmacophore. This research was carried out through the Calculate Molecular Properties function of the Discovery Studio platform. The blood–brain barrier permeability (BBB), water solubility, intestinal absorbance, hepatotoxicity and CYP2D6 enzyme inhibition descriptors of the drug were predicted. The blood–brain barrier permeability of all compounds was predicted to be “undefined”, indicating that the blood–brain barrier permeability of all 20 compounds was outside of the 99% confidence ellipse [30]. Except for the blood–brain barrier permeability of the drug not being successfully predicted, the rest of the properties were described in a numerical or hierarchical manner. To efficiently select the molecules with better medicinal properties, we removed all the compounds with hepatotoxicity and CYP2D6 inhibition, and the water solubility, intestinal absorbance, hepatotoxicity and CYP2D6 inhibition values of the remaining 20 molecules are shown in Table 2. Among them, the range of water solubility grade is 1–5. The higher the grade goes, the better solubility the water has. The intestinal absorption rate is also divided into 1–5 grades. For hepatotoxicity and CYP2D6 enzyme inhibition, the negative value of the compound is inversely proportional to the cytochrome enzyme inhibition activity. Twenty compounds were predicted to have moderate water solubility and intestinal absorption; their hepatotoxicity and cytochrome enzyme inhibition was low, suggesting that they have good proprietary medicine properties.
Table 2.
Twenty molecules‘ water solubility, intestinal absorption, hepatotoxicity and CYP2D6 enzyme inhibition descriptor properties.
2.3. Molecular Docking
Molecular docking can be used to explore the optimal binding mode between compounds and targets. Therefore, to further screen the compounds with good target inhibitory activity, we used CDK4 and CDK6 protein structures as targets for Libdock [31] molecular docking, and their Libdock scores and pharmacophore-screened Fit Values are listed in Table 3. The active sites of CDK4 (PDB ID:2W96) were Asp-99, Asp-140, Lys-142, Tyr-17 and Thr-172. The docking radius was set to 17. CDK6 (PDB ID:5L2S) took the original ligand as the center and set the sphere with a docking radius of 10 as the active site. The structure of the protein was optimized and hydrogenated by the Clean Protein program in advance. Docking preference was set as high quality, the number of spatial hotspots was set to 100 and the ligand conformation generation method was BEST to perform operations. To distinguish and determine which molecules had the better target binding activity, we selected the positive molecule Abemaciclib for the molecular docking study, and compounds with docking scores higher than Abemaciclib were considered valuable for further studies. The results, as shown in Table 3, indicate that all 20 molecules and CDK6 structures had higher Libdock scores, and seven of them had better scores than positive controls; but, generally speaking, there was no significant difference in docking scores between these 20 molecules and Abemaciclib. However, only three molecules bound to the active residues of the CDK4 structure, which were molecules 20551, 50843 and 41369.The docking scores of the latter two were higher than those of the positive control Abemaciclib, and they also had better docking scores with the CDK6 structure. Therefore, we chose the two molecules to dock with the two targets with higher precision CDOCKER and analyzed the interaction force between them in detail.
Table 3.
Libdock scores of 20 selected molecules and positive control Abemaciclib with CDK4/6.
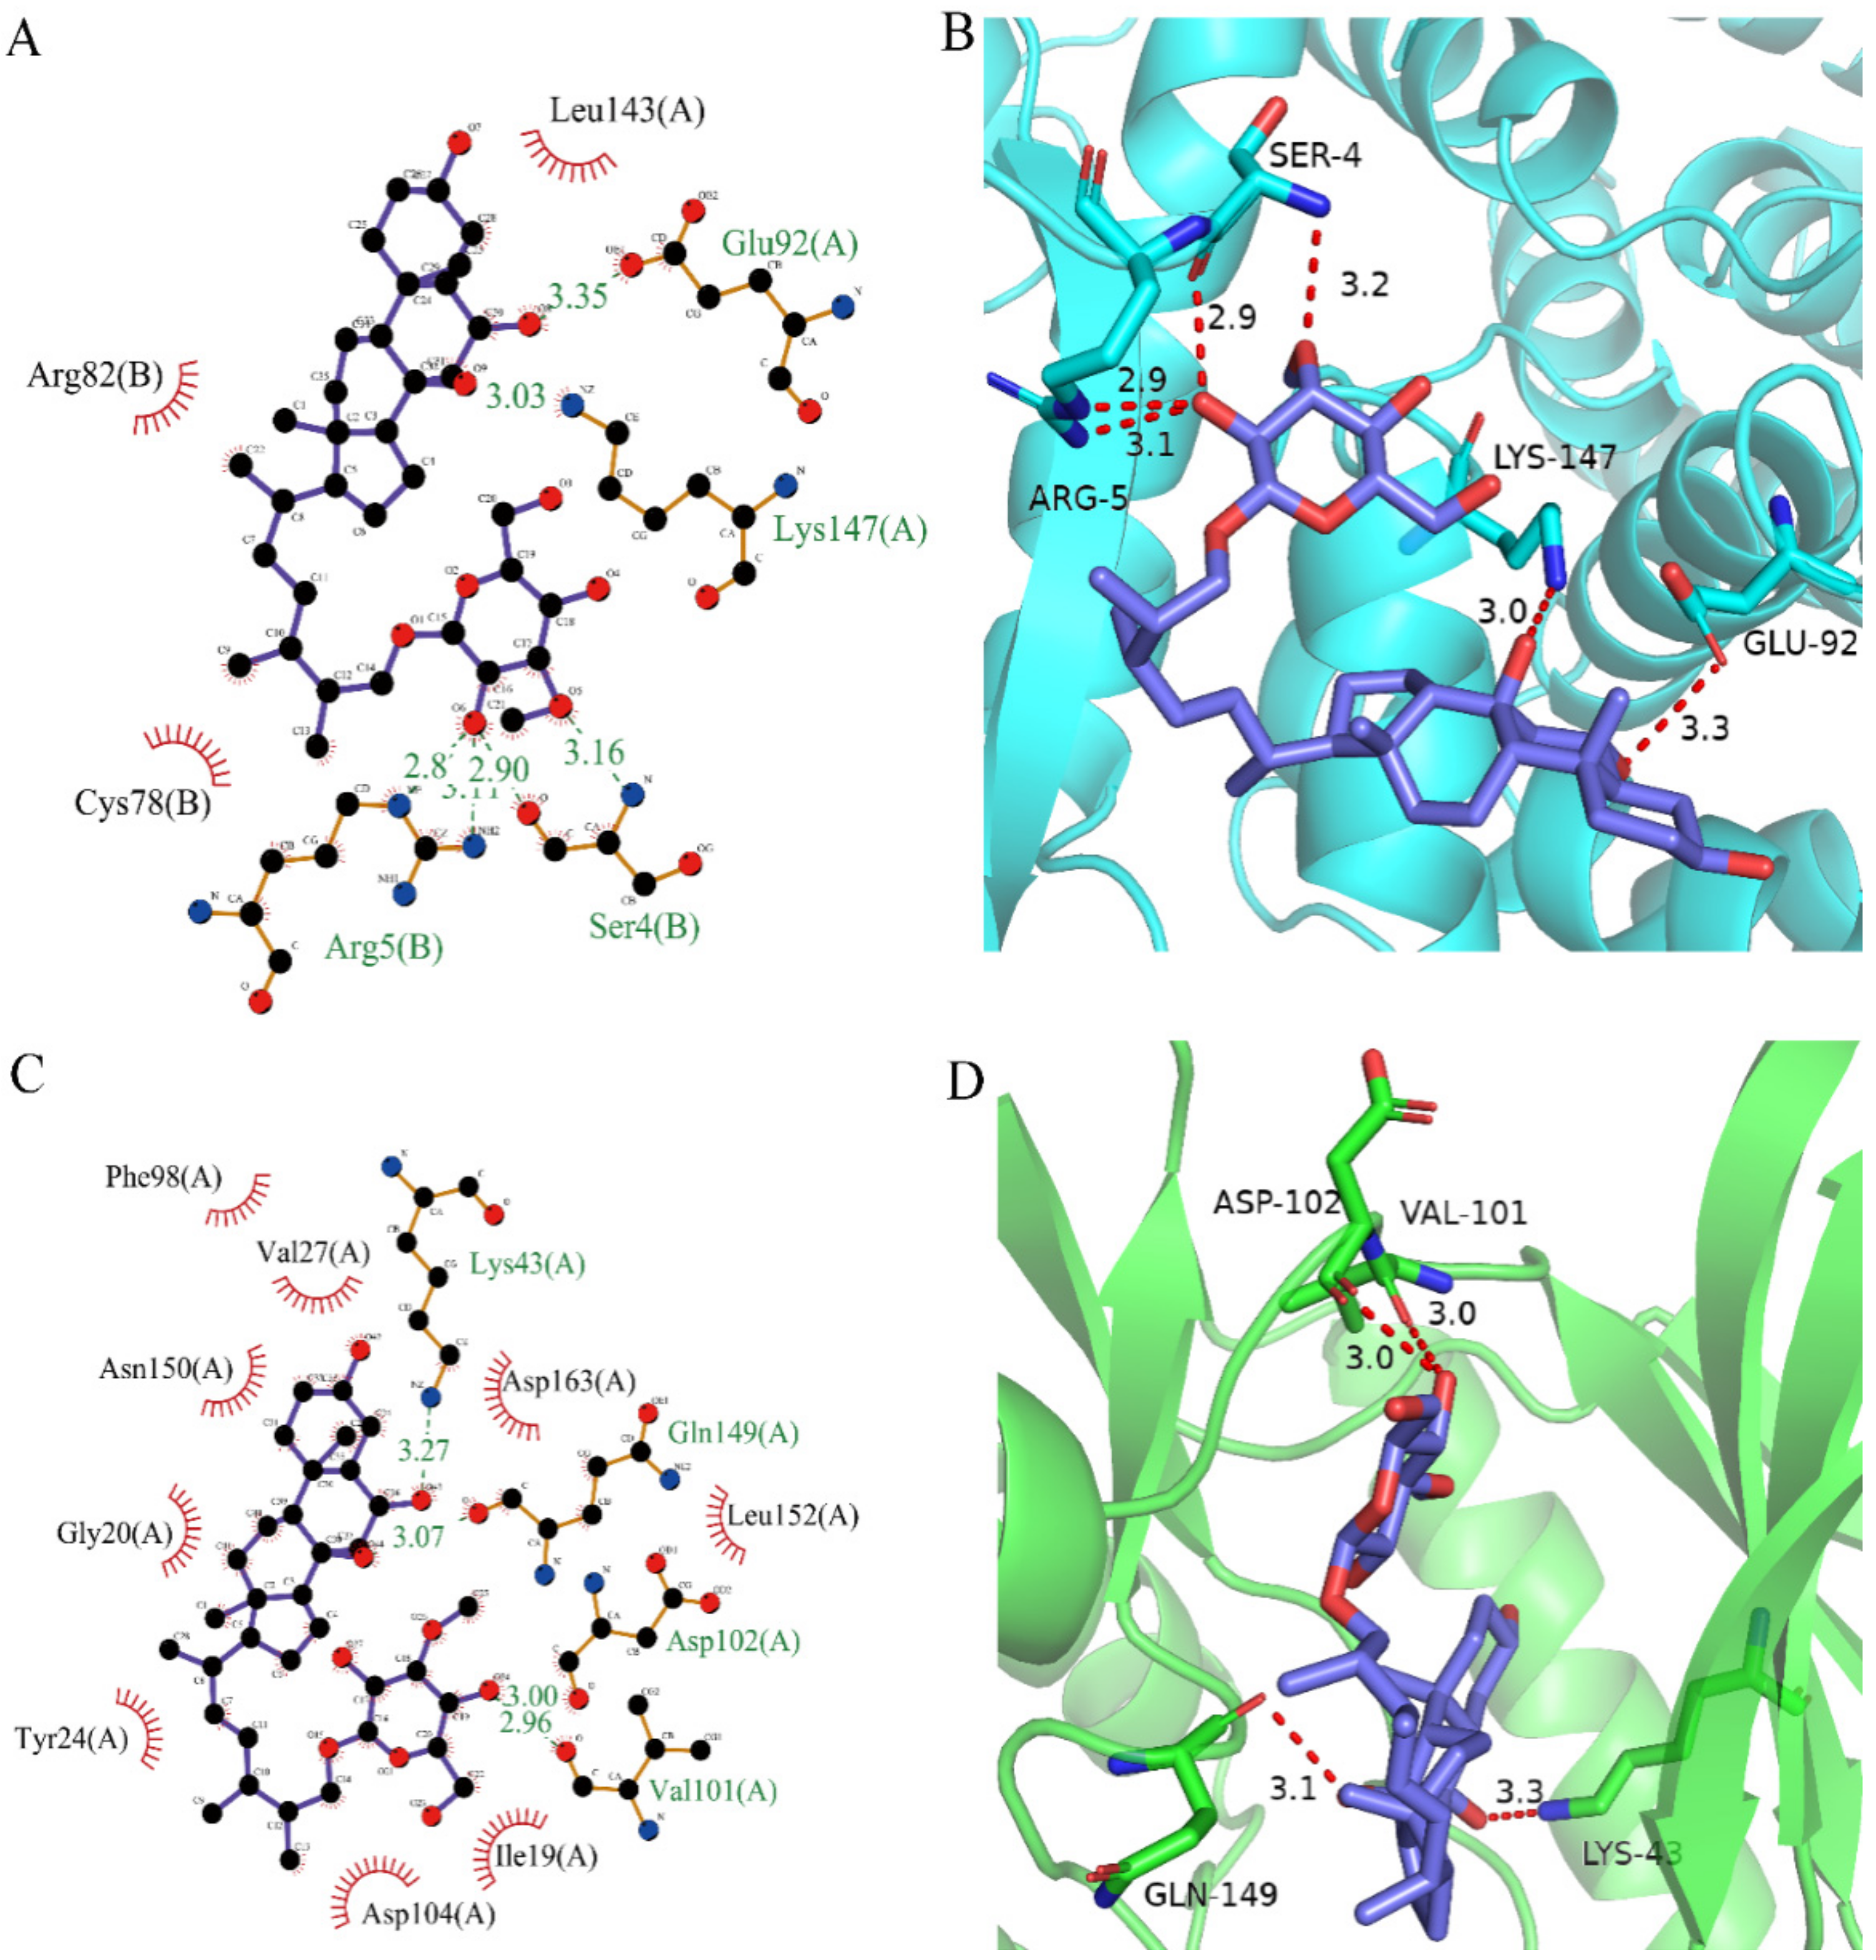
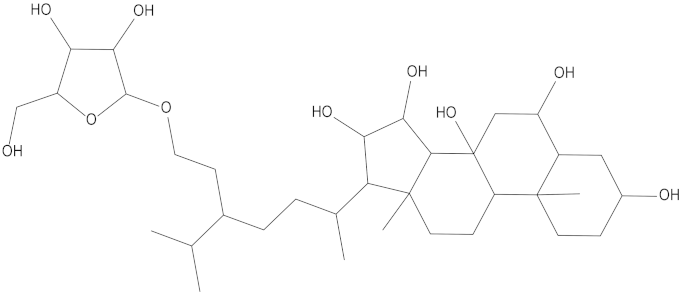
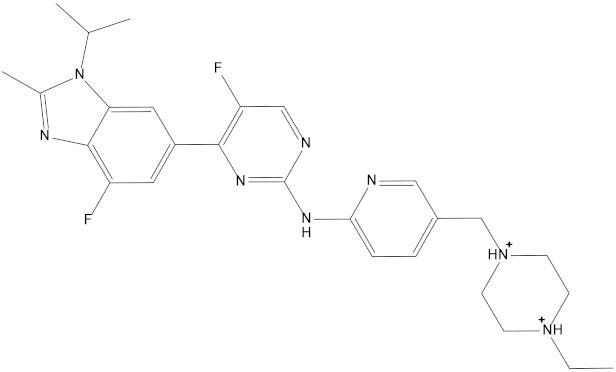
After analyzing and comparing the docking scores (Table 3), we selected the first two molecules with the highest sum of docking scores with the two targets and used the CDOCKER program to study their interaction with the receptors. The two molecules were finely docked. In the CDOCKER docking program, we used the charmM force field to deal with the protein structure and ligands. Finally, the docking results of compounds 41369 and 50843 with CDK4/6 are shown in Figure 5 and Figure 6. The interaction diagram (Figure 5a) and three-dimensional binding pattern diagram (Figure 5b) of compound 41369 with CDK4 shows that the compound formed hydrogen bonding interactions with the side chain of protein B-chain residue Asp-76. For CDK6, compound 41369 formed hydrogen bonding interactions with the side chain of residue Lys-147 of the A-chain, the backbone of residues Ile-19 and Glu-99 (Figure 5c). Furthermore, the three-dimensional docking pattern of CDK6 with compound 41369 is shown in Figure 5d. The hydrogen bonding interaction between N and O on more residues indicates that compound 41369 and CDK4/6 had some interaction force. Furthermore, as seen in Figure 6a, compound 50843 formed hydrogen bonding interactions with residues Lys-147, Glu-92, Ser-4 and Arg-5 of CDK4, indicating tight binding (Figure 6b). For CDK6, compound 50843 formed hydrogen bonds with the side chain of A-chain residue Lys-43, and the backbone of residues Gln-149, Asp-102 and Val-101 (Figure 6c). Similarly, the three-dimensional docking pattern of CDK6 with compound 50843 is also shown in Figure 6d. Combined with the reported results, the A-chain residue Val-101 is necessary for the binding of CDK6 to the inhibitor, which could also provide guidance for future chemical optimization of this compound.
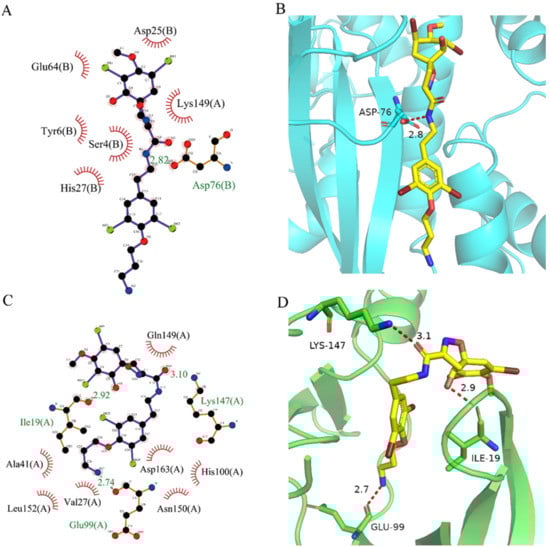
Figure 5.
Analysis of binding mode between compound 41369 and CDK4/6. (A) A 2D interaction schematic of compound 41369 with CDK4. Hydrogen bonds are shown as green dashed lines, hydrophobicity is in red lines. (B) A 3D binding mode of compound 41369 with CDK4. Hydrogen bonds are shown as red dashed lines, while compound 41369 is shown in golden yellow. (C) A 2D interaction schematic of compound 41369 with CDK6. Hydrogen bonds are shown as green dashed lines, hydrophobicity is in red lines. (D) A 3D binding mode of compound 41369 with CDK6. Hydrogen bonds are shown as red dashed lines, while compound 50843 is shown in golden yellow.

Figure 6.
Analysis of binding mode between compound 50843 and CDK4/6. (A) A 2D interaction schematic of compound 50843 with CDK4. Hydrogen bonds are shown as green dashed lines, hydrophobicity is in red lines. (B) A 3D binding mode of compound 50843 with CDK4. Hydrogen bonds are shown as red dashed lines, while compound 50843 is shown in blue. (C) A 2D interaction schematic of compound 50843 with CDK6. Hydrogen bonds are shown as green dashed lines, hydrophobicity is in red lines. (D) A 3D binding mode of compound 50843 with CDK6. Hydrogen bonds are shown as red dashed lines, while compound 50843 is shown in blue.
2.4. RMSD and RMSF Analysis
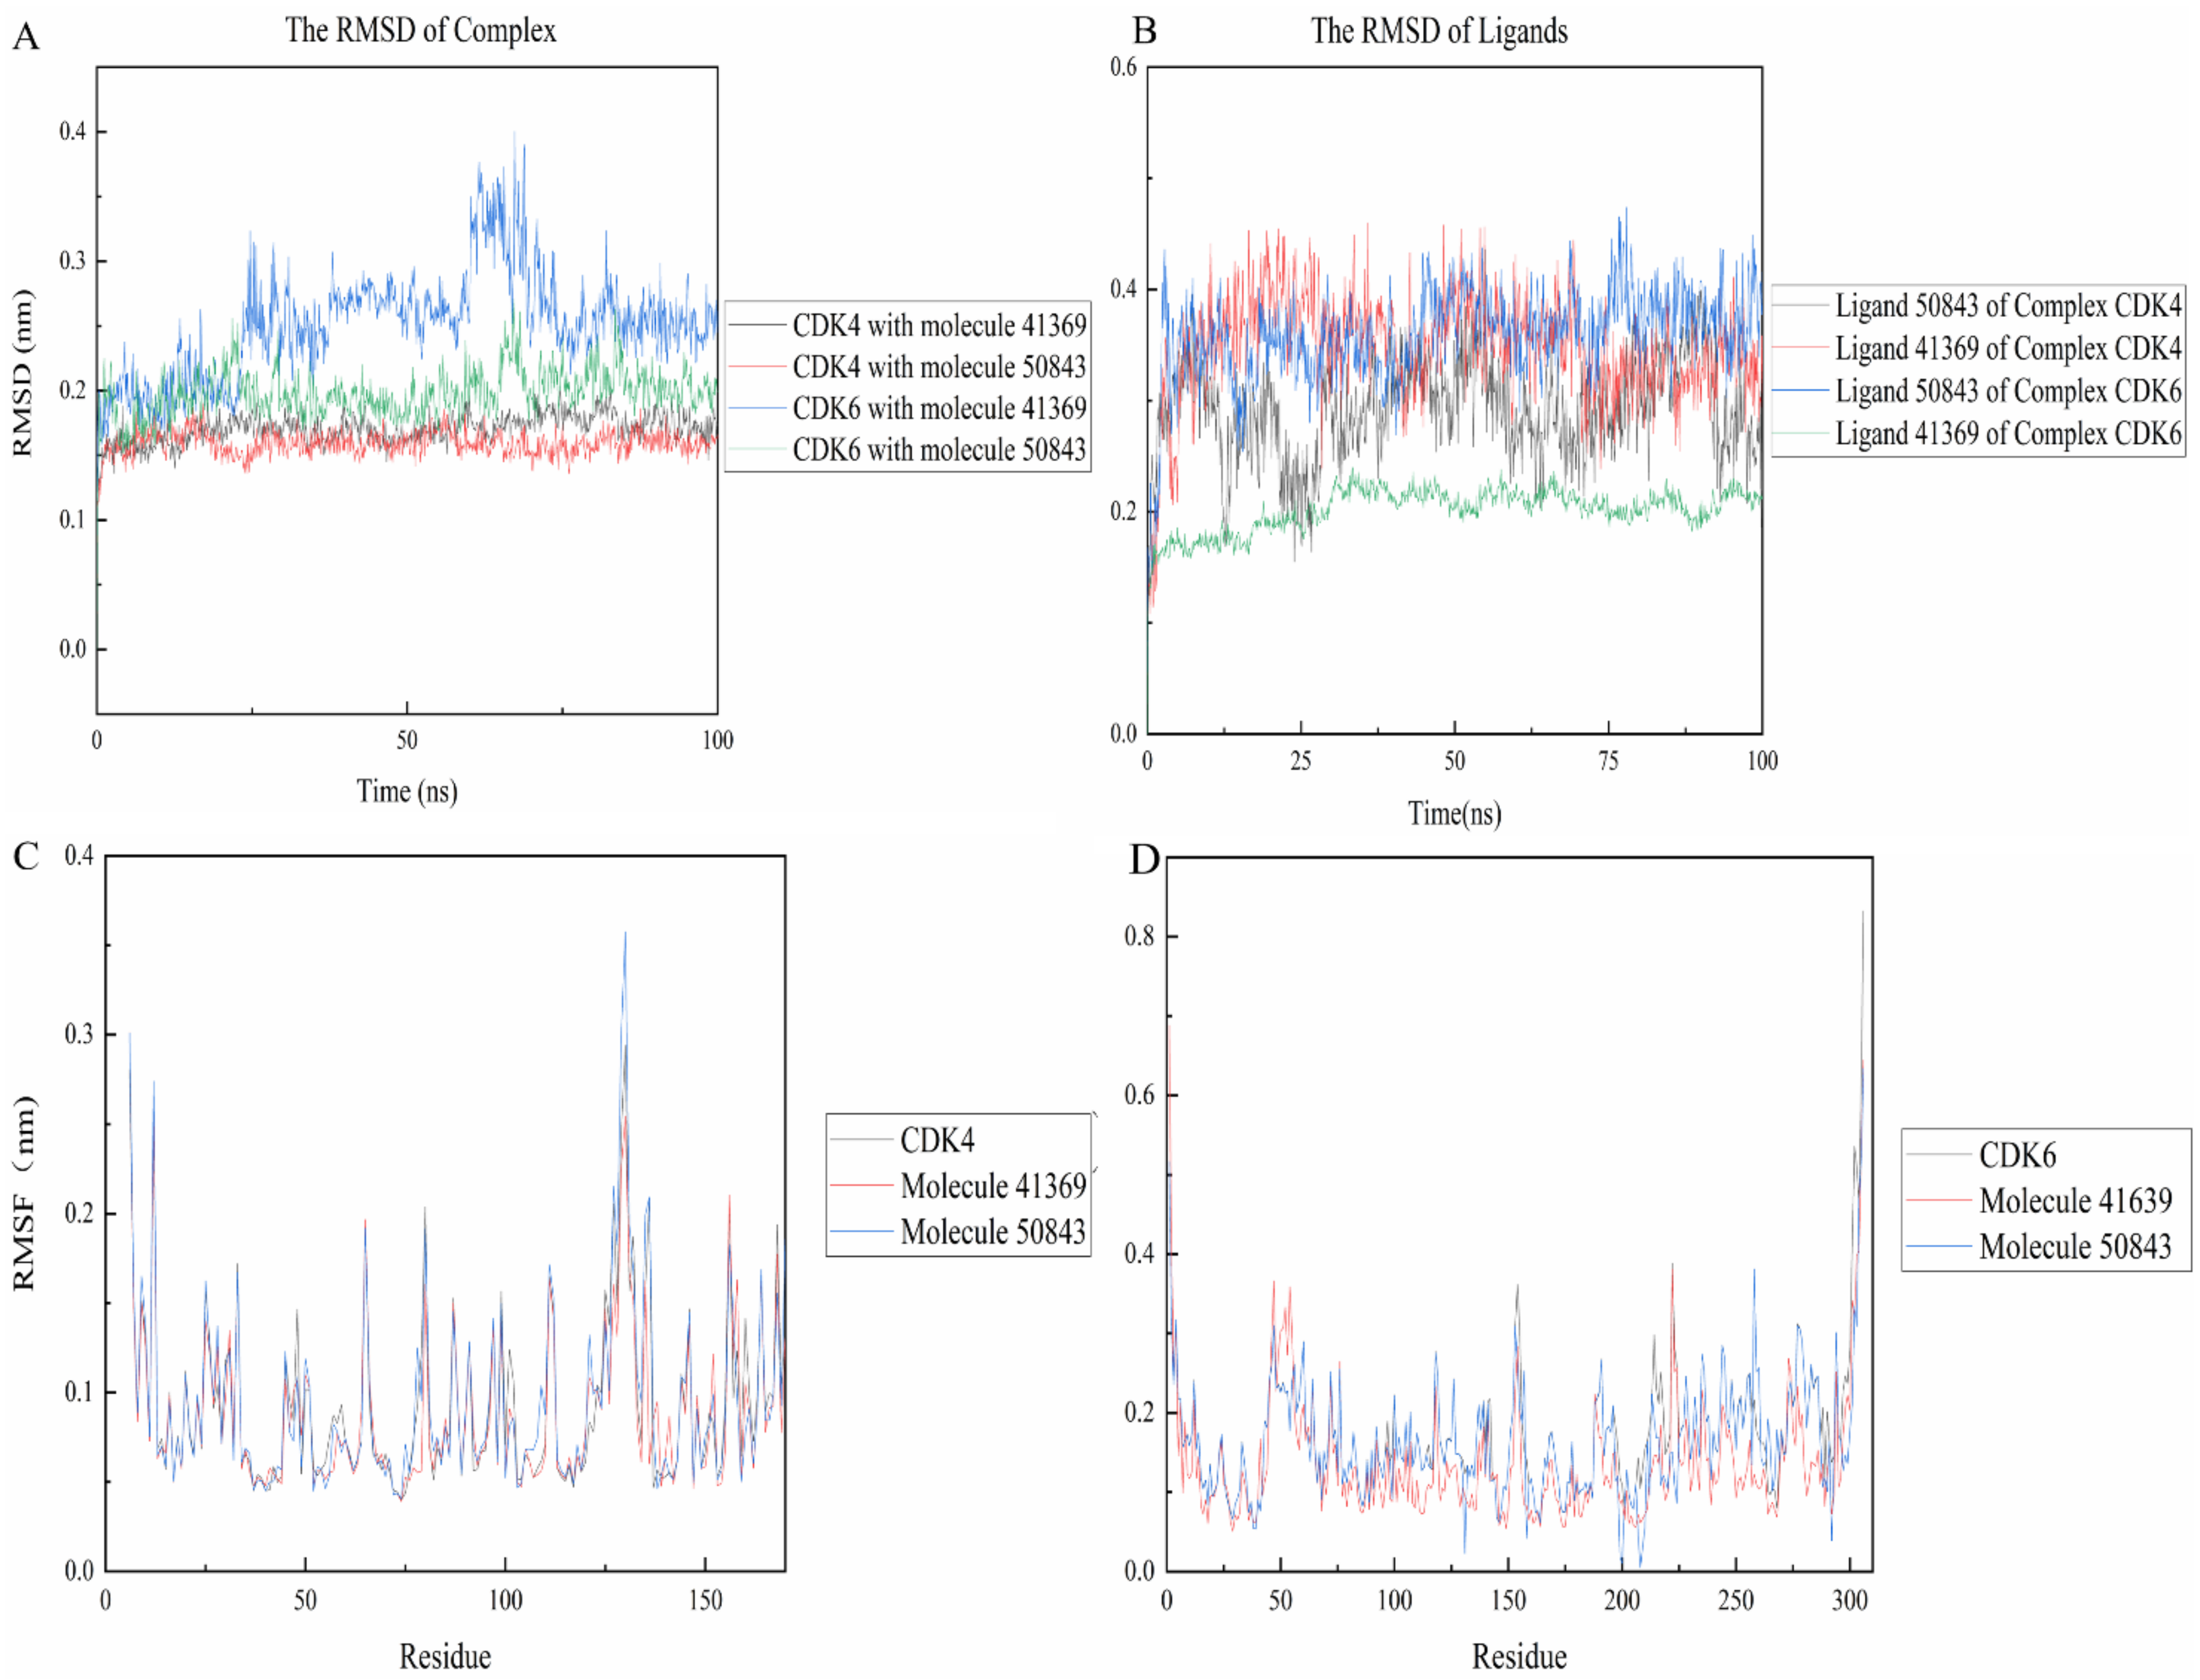
The RMSD between two protein structures was used to describe the differences in their atomic positions, which can reflect the stability of the whole system. As shown in Figure 7, the complexes were more stable than their own receptor in the 100 ns simulation, while CDK4 and compound 50843 ended up stable at 0.15 nm and the simulation process did not fluctuate too much, and the same compound 41369 finally stabilized at 0.17 nm (Figure 7a). For CDK6, we found that the 41369 complex fluctuated at the beginning of 57 ns and finally stabilized at 62 ns with the RMSD value being 0.25 nm. Interestingly, the RMSD value of the 50843 complex did not fluctuate too much in the process of the 100 ns simulation and the RMSD value was 0.2 nm. The last four systems were able to reach a stable state in the simulation process. For the RMSD values of ligands in the system, compounds 41369 and 50843 remained stable in the simulation process of 100 ns and finally balanced in an appropriate range (Figure 7b).
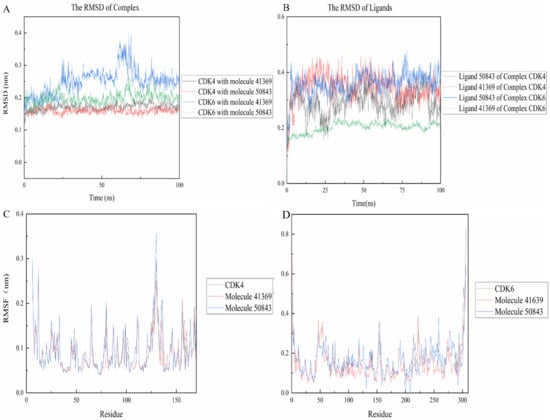
Figure 7.
RMSD and RMSF plots of compound 50843 and 41369 with CDK4/6. (A) The RMSD of complexes. CDK4 and compound 41369 is shown as black lines, CDK4 and compound 50843 is in the red line, CDK6 and compound 41369 is shown as blue lines, CDK6 and compound 50843 is in the green line. (B) The RMSD of ligands. Ligand 50843 of complex CDK4 is shown as black lines, Ligand 41369 of complex CDK4 is shown as red lines, Ligand 50843 of complex CDK6 is shown as blue lines, Ligand 41369 of complex CDK6 is shown as green lines. (C) The RMSF of complexes and CDK4. CDK4 is shown as black lines, compound 41369 is in the red line and compound 50843 is in the blue line. (D) The RMSF of complexes and CDK6. CDK6 is shown as black lines, compound 41369 is in the red line and compound 50843 is in the blue line.
The RMSF refers to the root mean square displacement of each amino acid of a certain frame conformation compared with the average conformation, which is used to determine the flexibility of a region of a protein. Firstly, it can be seen from Figure 7c that the three systems all show high RMSF values near the binding pocket, which to a certain extent indicates that the pocket is more flexible. In contrast, compound 50843 increases the flexibility of the pocket slightly, but the RMSF value of the pocket is within an acceptable range; for CDK6 we focus on residue Val-101, compound 50843 has a hydrogen bond with Val-101 of CDK6. It was found that the RMSF value of val-101 decreases (Figure 7d). In terms of flexibility, the four complex systems exhibited minor fluctuation, and the comprehensive RMSD and RMSF compounds 41369 and 50843 could stably bind to CDK4/6.
2.5. The Hydrogen Bond Analysis
During the simulation, the ligand formed a certain number of hydrogen bonds with the protein, and the number and survival time of these hydrogen bonds also reflected the binding degree of the ligand to the protein. In Figure 8a, compound 41369 had too few hydrogen bonds for a period of time in the simulation, while compound 50843 formed more hydrogen bonds with CDK4 overall and survived longer (Figure 8b). As for CDK6, there was always hydrogen bond interaction during the complex system in the 100 ns simulation process. The hydrogen bond formed by compound 41369 and CDK6 fluctuated at the simulated 40 ns (Figure 8c). In Figure 8d, it is shown that CDK6 and compound 50843 fluctuated in the early stages of the simulation, and the hydrogen bond fluctuated in the simulation process. It is able to be seen from these figures that compounds 41369 and 50843 formed hydrogen bonds with the CDK4/6 simulation process and survived for a long time.
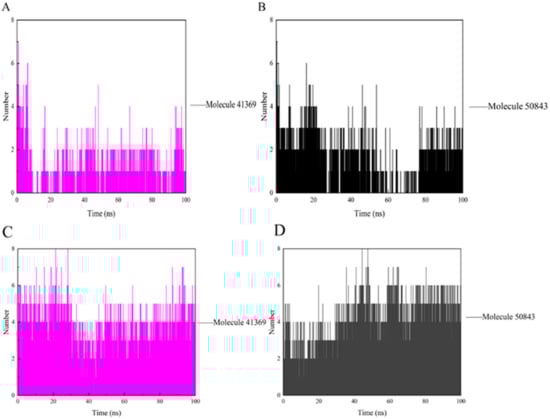
Figure 8.
The hydrogen bond of CDK4/6 with compound 41369 and 50843. (A) Compound 41369 (magenta) with CDK4. (B) Compound 50843 (black) with CDK4. (C) Compound 41369 (magenta) with CDK6. (D) Compound 50843 (black) with CDK6.
2.6. Solvent Accessible Surface Area and Radius of Gyration Analysis
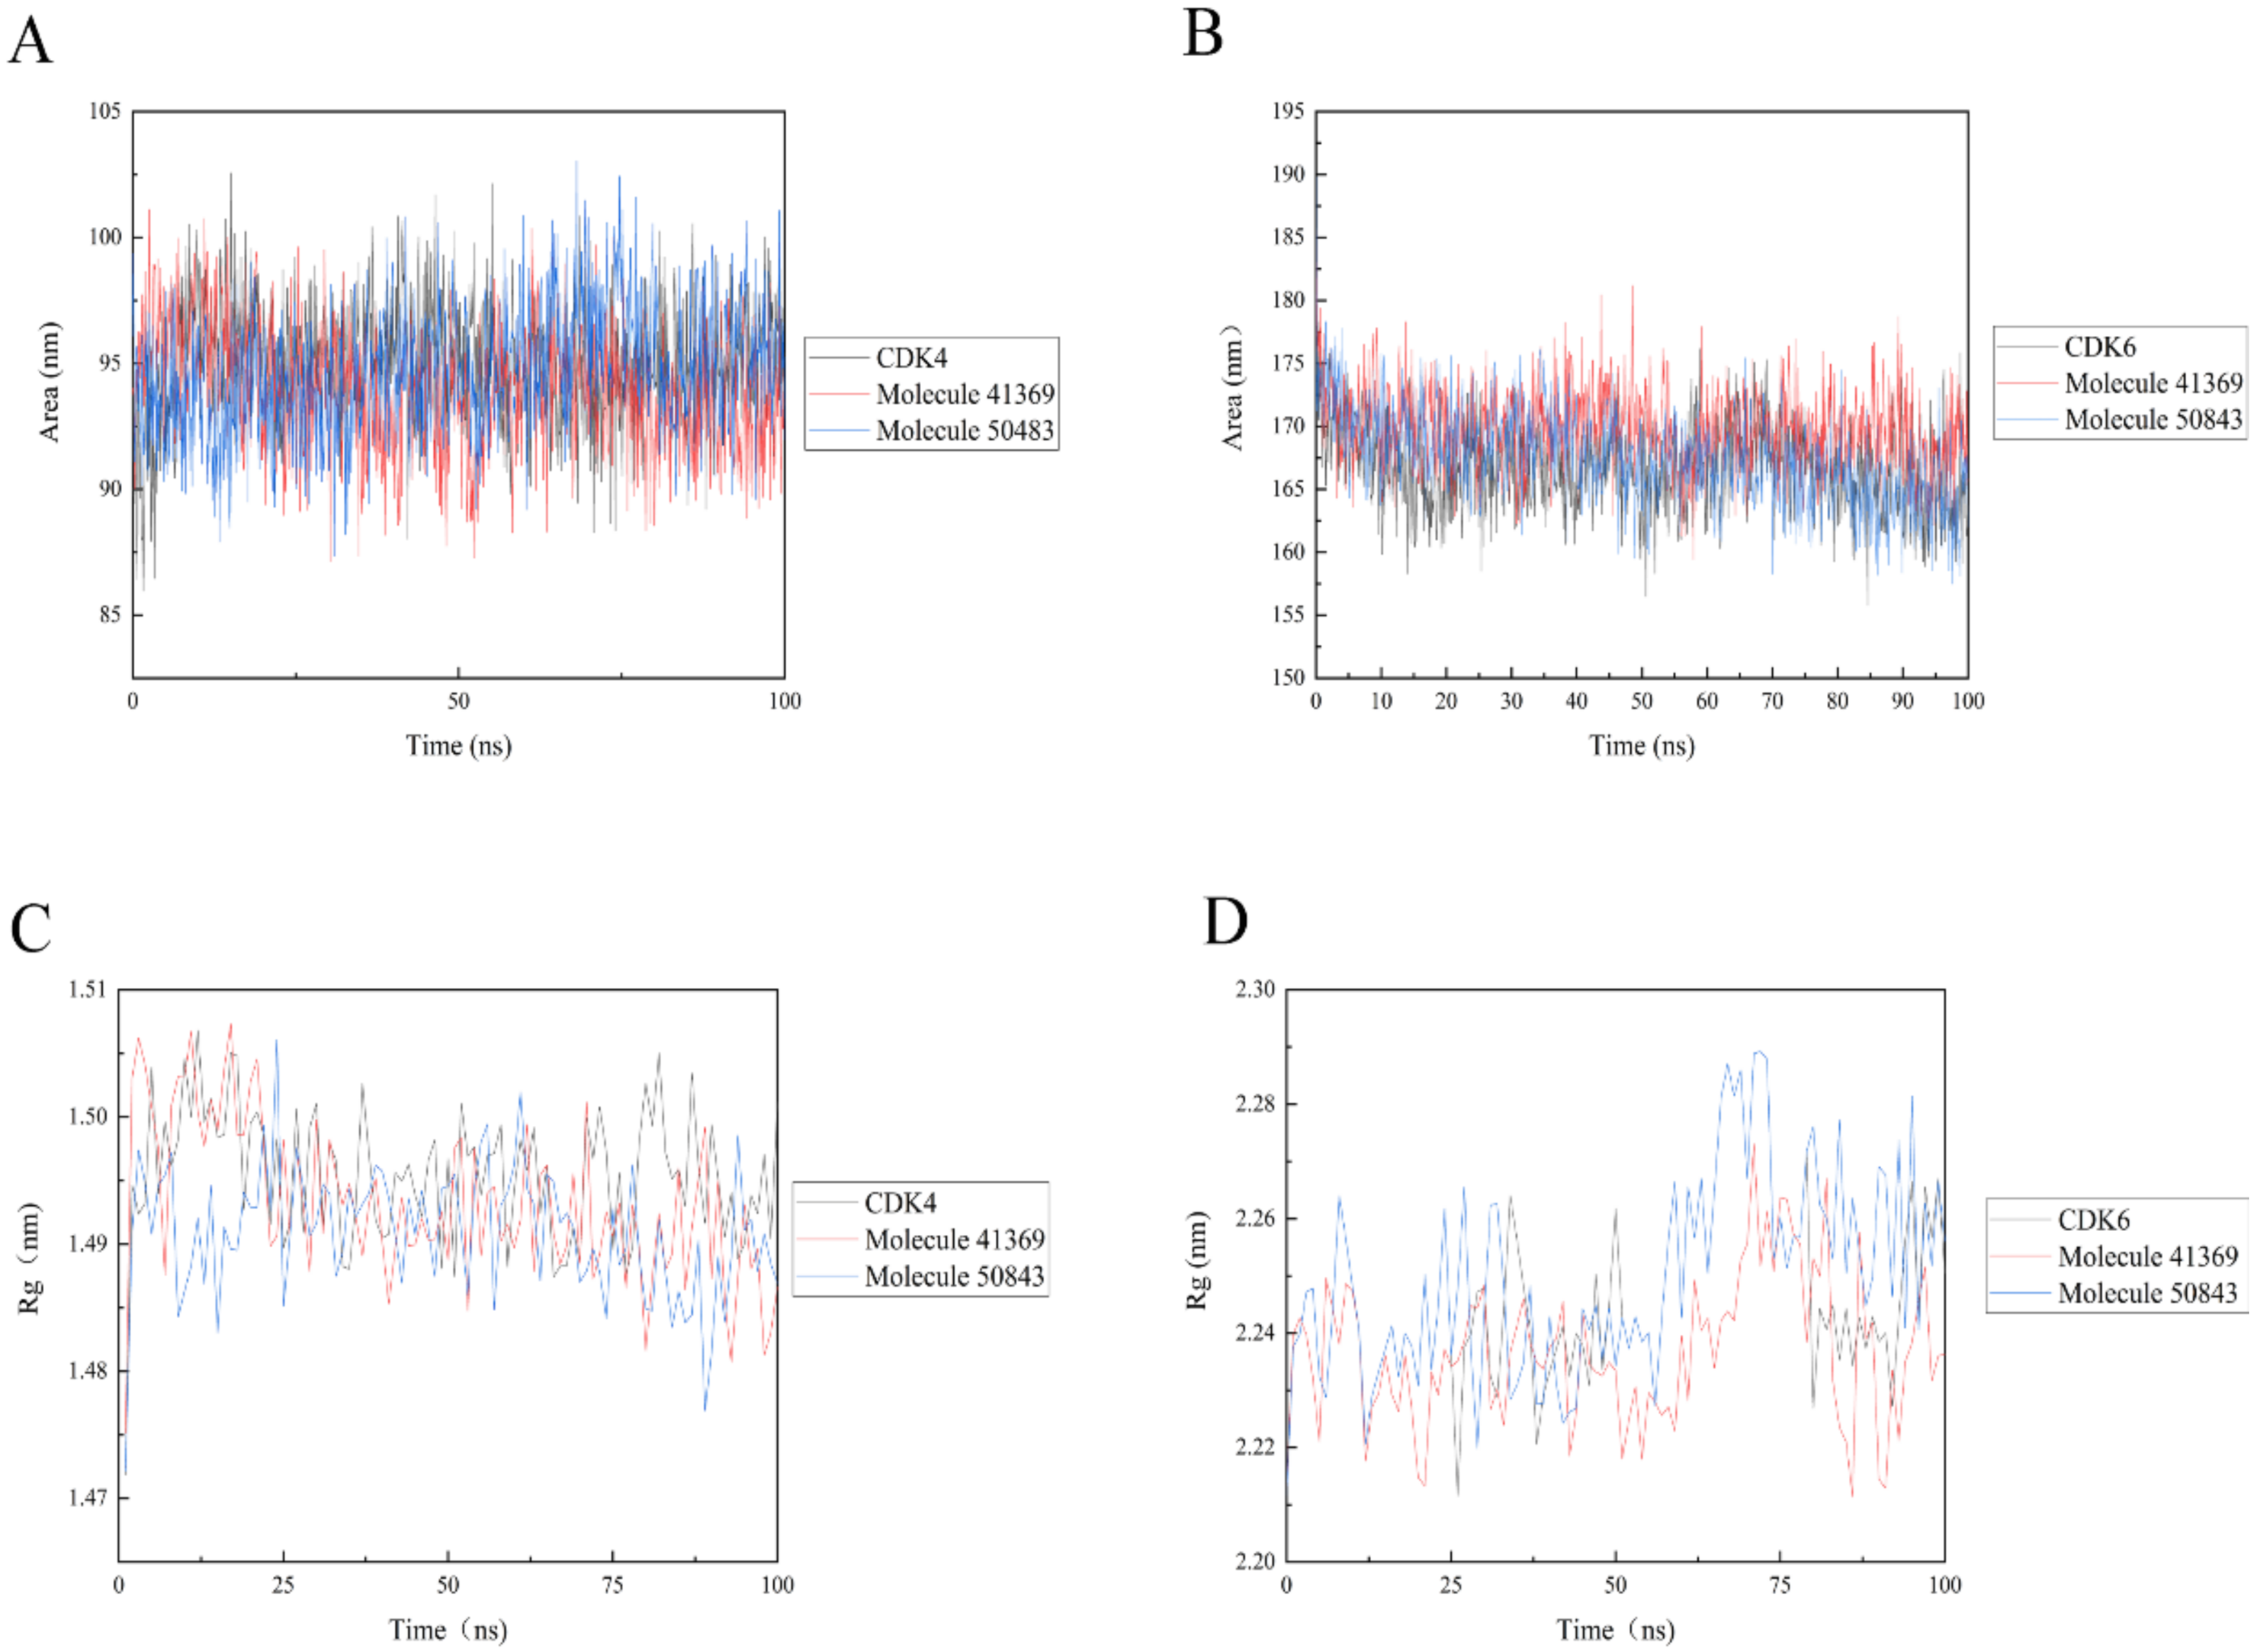
Solvent accessible surface area (SASA) analysis can be used to indicate the solvent accessible surface area of the entire complex. The final simulation results show that the SASA values of the protein complexes (see Figure 9) are relatively stable during the trajectory; in Figure 9a, the complex systems all show lower SASA values. The complex system of CDK6 shows a higher SASA value, indicating that the complex system of compounds 41369 and 50843 with CDK6 found it easier to approach the solvent (Figure 9b).

Figure 9.
Solvent accessible surface area (SASA) and radius of gyration (Rg) of 100 ns simulation process. (A) SASA plots of compound 50843 (blue) and 41369 (red) with CDK4 (black). (B) SASA plots of compound 50843 (blue) and 41369 (red) with CDK6 (black). (C) Rg plots of compound 50843 (blue) and 41369 (red) with CDK4 (black). (D) Rg plots of compound 50843 (blue) and 41369 (red) with CDK6 (black).
The radius of gyration (Rg) indicates the firmness of the protein structure. As shown in Figure 9, the average Rg values of CDK4 with compounds 50843 and 41369 were lower than 2.3 nm (Figure 9c), while a similar pattern was shown in the systems complexed with CDK6, and the average Rg values of these systems were lower than 1.5 nanometer; it is worth mentioning that the Rg value of compound 50843 with the CDK6 system was lower (Figure 9d). The results show that the compactness of the complex was maintained during the simulation.
2.7. Protein–Ligand Interaction Energy Analysis
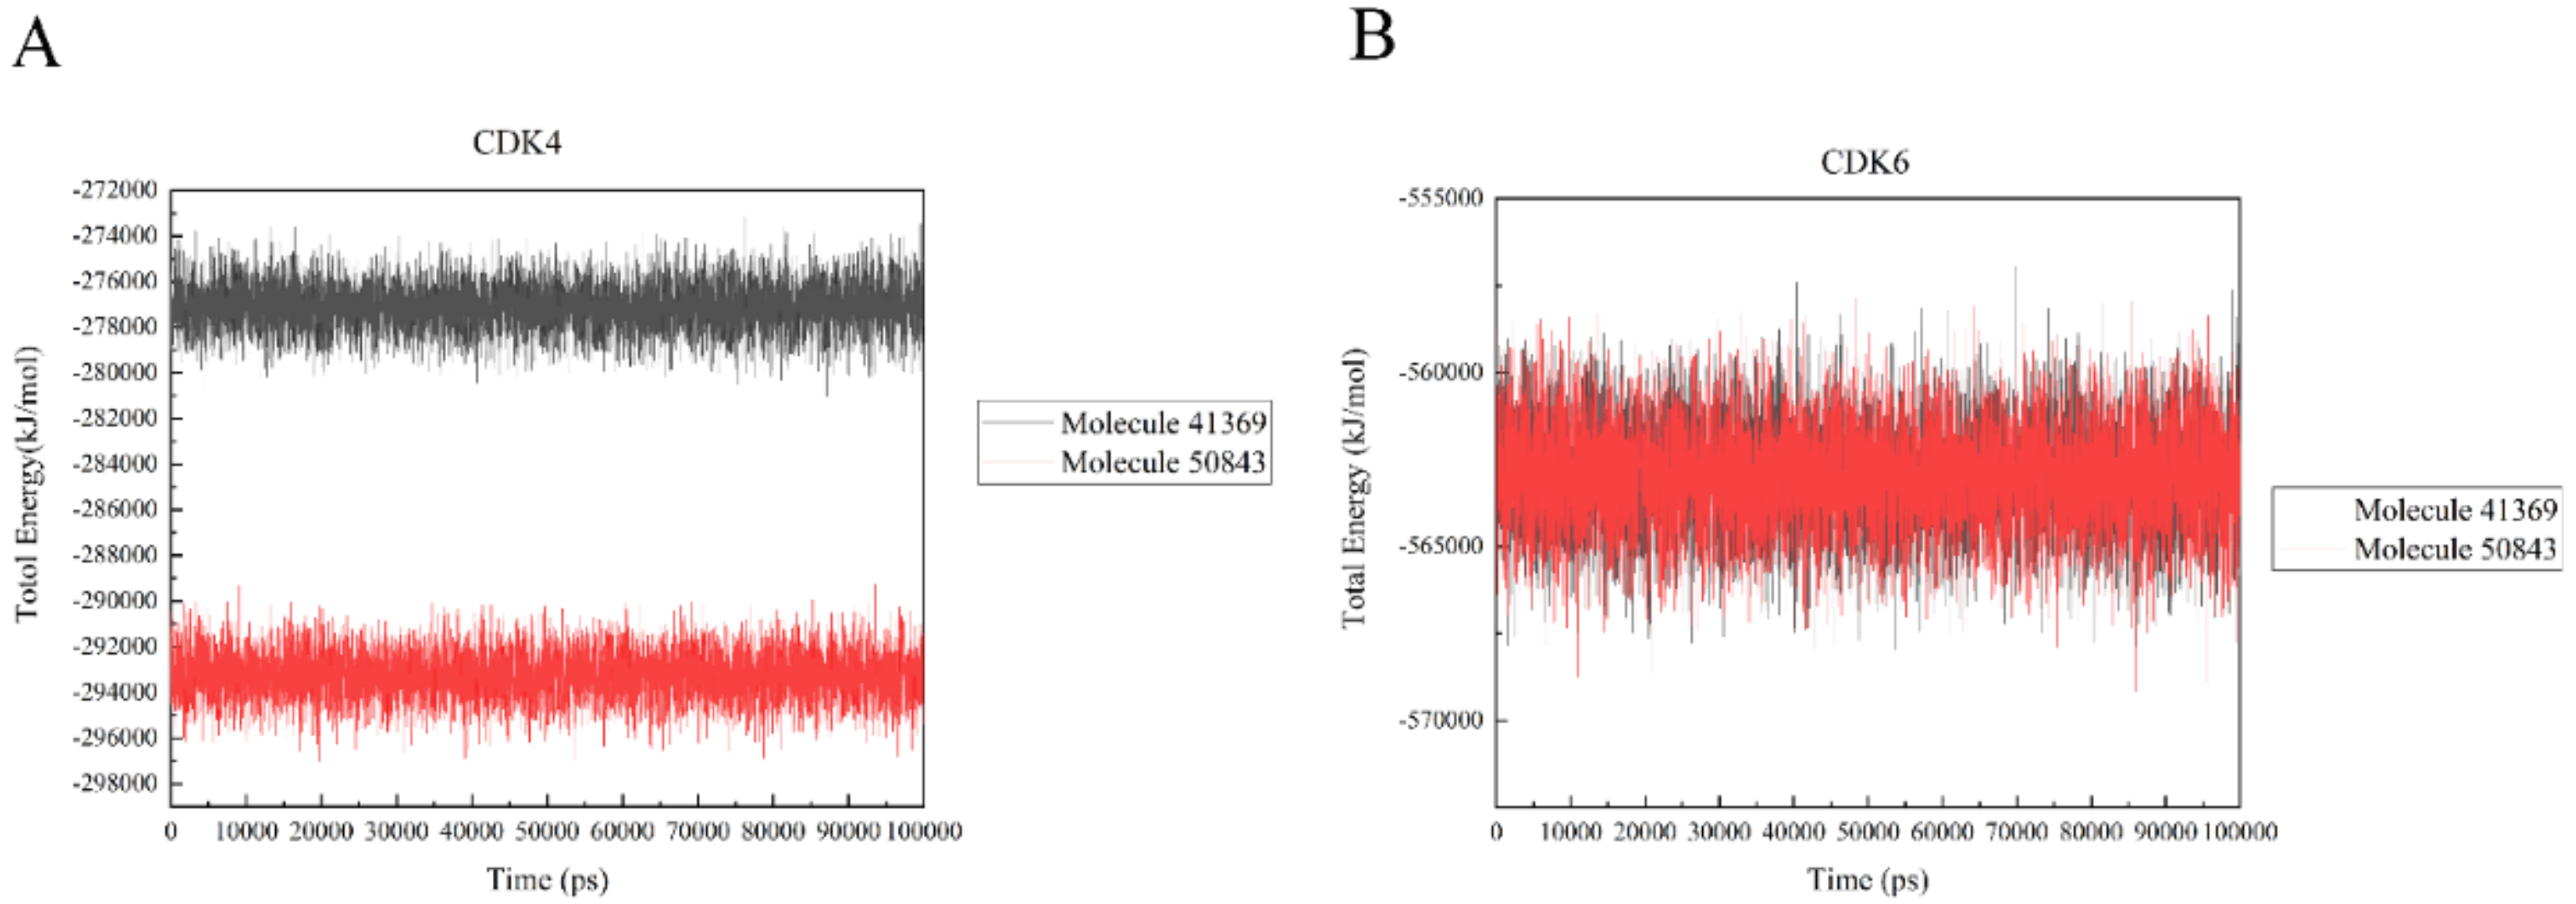
In a bid to quantify the interaction strength between the ligand and receptor, the non-bonding interaction energy between the two needs to be calculated; we used the gmx_energy program to calculate the energy change of the ligand and protein during the simulation. It is vital to note that the values here are not free energies or binding energies. Figure 10a shows that the estimated total energy value between compound 41369 and CDK4 is −277,000 kJ/mol, while the total energy value of compound 50843 is −293,000 kJ/mol; CDK6 and compounds 41369 and 50843 are both −562,000 kJ/mol (Figure 10b). The results show that the interaction of compound 50843 with CDK4/6 is stronger in this energy numerical calculation.

Figure 10.
The total energy of CDK4/6 with molecule 41369 and 50843. (A) The total energy of compound 41369 (black) and 50843 (red) with CDK4. (B) The total energy of compound 41369 (black) and 50843 (red) with CDK6.
2.8. MM-PBSA Analysis
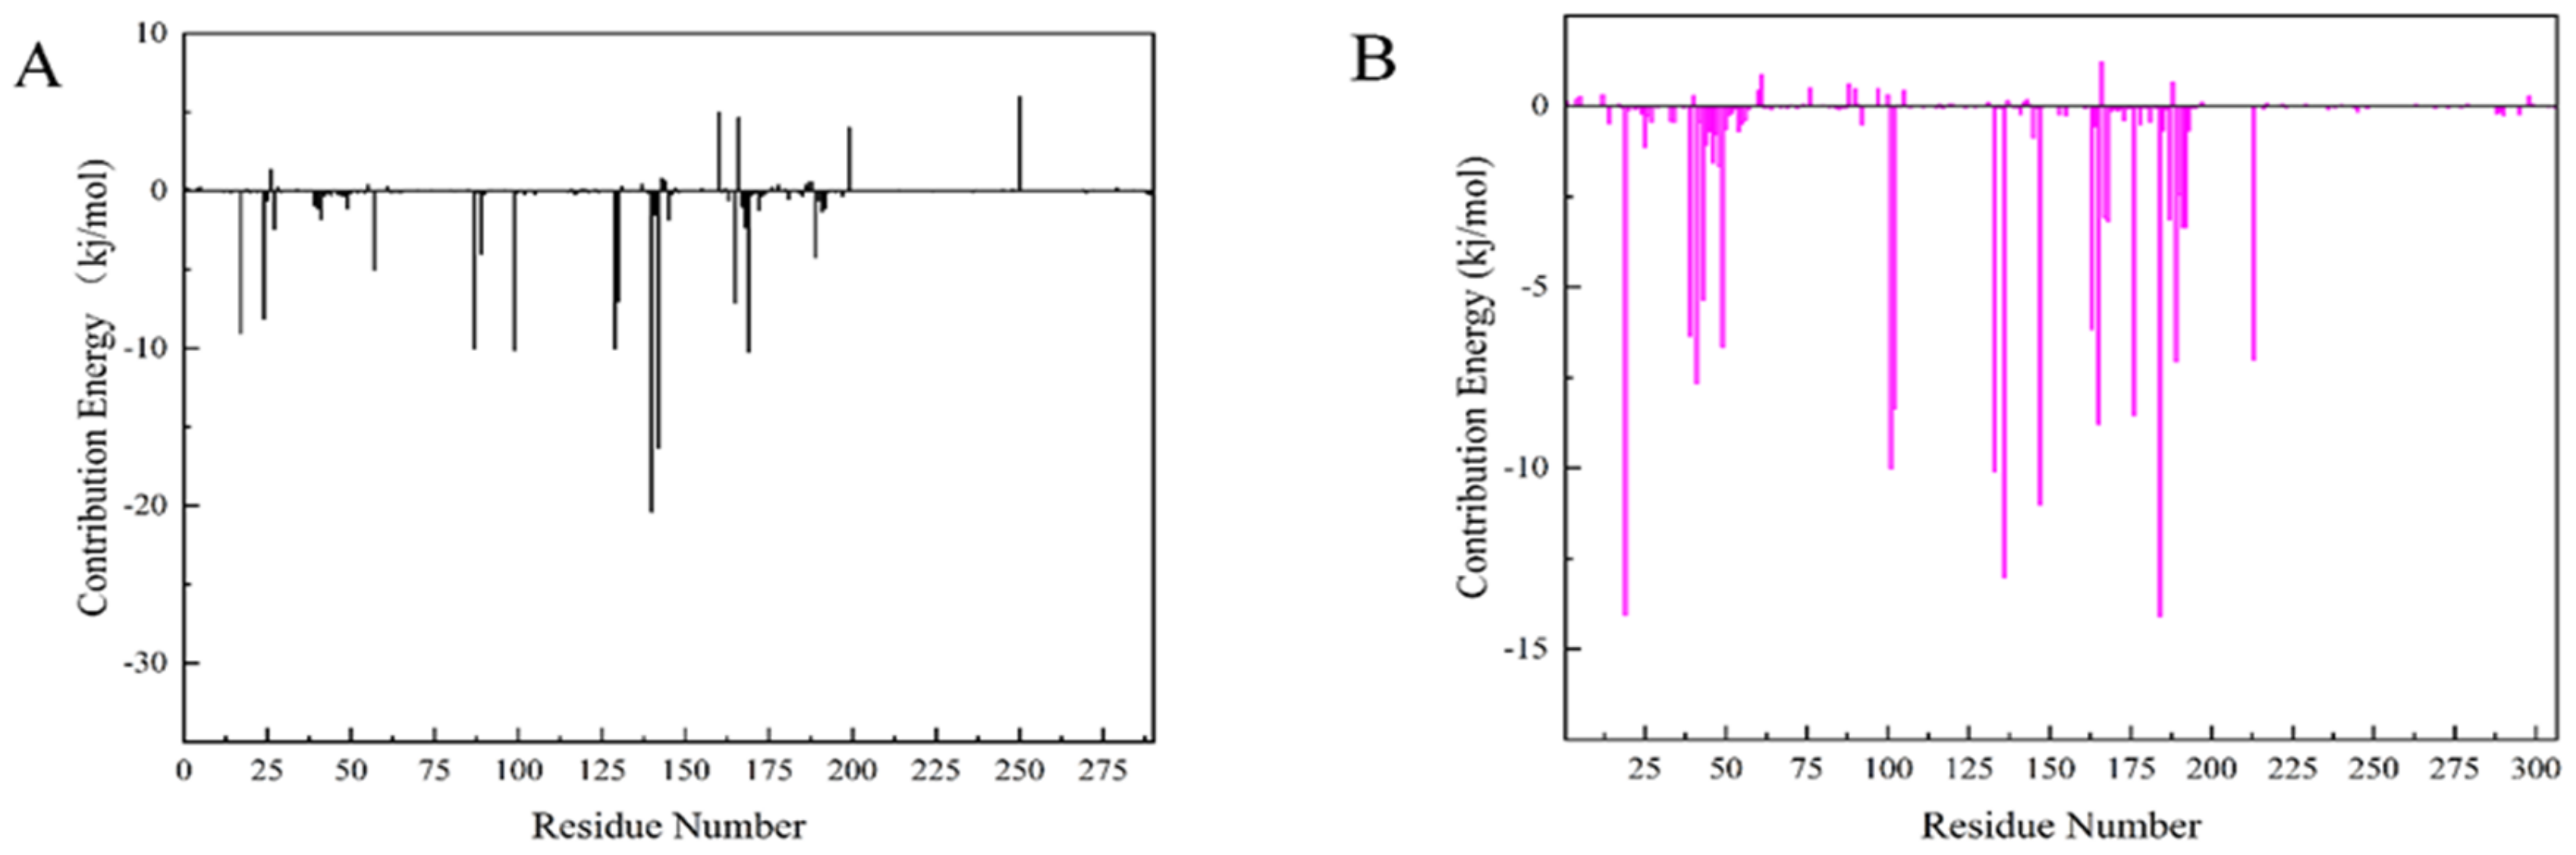
The Molecular mechanics Poisson Boltzmann surface area (MM-PBSA) method is prevalent in the estimation of the free binding energy between CDK4 and CDK6 with compound 50843. From the aspects of structural stability and flexibility and the simulation results of quantitative interaction, we finally selected compound 50843 for MM-PBSA calculation. The binding free energy component of each complex with compound 50843 was calculated in a time step of 1 ns in a molecular dynamics simulation of 100 ns. It can be seen from Table 4 that the binding free energies of compound 50843 and CDK4/6 are −154.655 kJ/mol and −212.082 kJ/mol respectively, which are also contributed to by van der Waals force to a great extent. Therefore, according to the energy calculation of MM-PBSA, a stronger binding interaction with protein was established. To further analyze the interaction between compound 50843 and protein, we decomposed the binding free energy of MM-PBSA into the energy contribution of each protein residue to evaluate the key binding residues; that is, the residues with higher energy contribution to the binding free energy. It can be seen from Figure 11a that the key residues in compound 50843 and CDK4 are Arg-5, Ser-4, Met-17, Arg-87, Asp-129, Asn-130, Leu-142 and Pro-169. Interestingly, the residues forming the hydrogen bond interaction in molecular docking appear in it. For Cdk6 and compound 50843, their key residues include Ile-19, Ala-41, Val-101, Leu-133, Leu-136, Lys-147, Asp-163, Gly-165 and Glu-189. It is worth mentioning that the binding energy contributed by residue val-101 is −10.0042 kJ/mol (Figure 11b). The results show that MM-PBSA not only verified the results of molecular docking but also further quantified the binding energy between compound 50843 and CDK4/6.
Table 4.
Binding energy of binding for the compound 50843 complexed with CDK4/6.
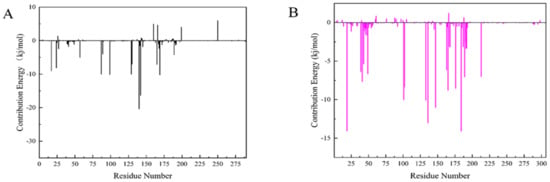
Figure 11.
Residue decomposition diagram of binding energy. (A) Compound 50843 with CDK4 (black). (B) Compound 50843 with CDK6 (magenta).
2.9. Analysis of Synthetic Accessibility Score Parameters
To explore the further synthetic and application potential of these two compounds, the SA scores of the compounds calculated using ADMETlab were used to assess the synthesizability of the two alternative compounds. As shown in Table 5, the SA scores for compound 41369 and compound 50843 were 5.226 and 5.517, respectively. Lower SA scores tend to imply better synthesizability. Although not as good as the positive control, the two compounds we selected still had good SA scores, suggesting their potential to be synthesized as new drugs.
Table 5.
Synthetic accessibility score parameters (SA score) for molecule 41369 and molecule 50843.
2.10. Prediction of Inhibitory Activity of Tumor Cell Lines
To predict the potential inhibitory activity of two candidate compounds against tumor cell lines, the way2durg online tool was applied. Both Pi and Pa of the two compounds were predicted. The results showed that both compounds exhibited inhibitory activity against MDA-MB-231 and HL-60 cell lines, respectively (Table 6).
Table 6.
Predicted inhibitory activity of two alternative compounds against tumor cell lines.
3. Discussion
In recent years, CDK4/6 inhibitors have continued to be applied to the clinical trials of various malignant tumors. However, these inhibitors have some disadvantages, such as gastrointestinal toxicity and drug resistance, which lead to the decline in their efficacy. At present, drug research and development are also taking more heed of the existing natural products in nature, and marine natural products have been of interest to the scientific community for their unique ecological advantages. Therefore, our study aims to screen CDK4/6 compounds using marine natural products.
In this study, we collected some listed CDK4/6 inhibitors by reading the literature, constructed a structure-based pharmacophore model using Discovery Studio and selected model 09 with the highest selection score; in addition, we verified the model. AUC under the ROC curve reflects the discrimination ability of the model. It is worth mentioning that some studies also use the QSAR model to screen a marine natural product, and our pharmacophore modeling was based on the selected known inhibitors, instead of structured modeling on the complex. The marine natural product compounds obtained from the pharmacophore model generated by this method can be more appropriate to the known CDK4/6 inhibitors in terms of conformation [32,33]. Then we carried out the ADMET test, and finally obtained 20 compounds that showed good ADMET characteristics.
In the molecular docking study, compound Abemaciclib was selected as the positive control, and then docking was carried out by the Libdock program. Finally, compounds 41369 and 50843 were selected according to the comprehensive scoring performance of compounds and CDK4/6, and their binding modes were further analyzed by a more precise CDOCKER program. It was found that compound 50843 could form a hydrogen bond with val-101 of CDK6, this residue has an important relationship with CDK6, and compound 41369 also formed a close interaction with CDK4/6 [34].
Molecular dynamics is of great significance to confirm the stability of binding between compounds and proteins. After the 100 ns simulation, we collected the RMSD and RMSF data of the trajectory to confirm the stability and flexibility of the binding between the compound and protein. In addition, we also analyzed the stability of the whole complex system in terms of the hydrogen bond, SASA and Rg. Distinct from some previous studies, we analyzed the stability from many aspects. For the interaction and free binding energy between compounds and proteins, we first used the total energy of the system to quantify the interaction between compounds 41369 and 50843 and CDK4/6. Interestingly, compound 50843 performed much better in the comparison of interaction strength [35]. Finally, we selected the trajectories of compound 50843 and CDK4/6 for MM-PBSA calculation. In the residue energy contribution, we found some key residues not mentioned in previous studies, such as Arg-5, Ser-4 and Pro-169 of CDK4 and Asp-163, Gly-165 and Glu-189 of CDK6. Of course, Val-101 of CDK6 contributes a very high negative binding energy, further indicating the important relationship of compound 50843 for CDK6.
Finally, we carried out some studies on the synthesis and cytotoxicity of compounds 50843 and 41369. In terms of results, SA score shows that compounds 50843 and 41369 can be synthesized, and their toxicity is also within an acceptable range, which also provides some reference data for subsequent experimental verification.
Briefly, marine natural products have made an immense contribution to the pharmacy domain owing to its ample resources. Through the method of computer-aided drug design, CDK4/6 inhibitors were quickly found from 52,765 marine natural products. In addition, compound 50843 can be optimized as a crucial lead compound to become a better CDK4/6 inhibitor.
4. Materials and Methods
4.1. Database Construction and Molecular Preparation
Seaweed Metabolite Database (http://www.swmd.co.in, accessed on 1 April 2021), Comprehensive Marine Natural Products Database (https://www.cmnpd.org, accessed on 1 April 2021) and Marine Database (http://docking.umh.es/, accessed on 1 April 2021) were integrated into one database. The database, which included 50,000 marine compounds, was saved in mol format in advance and imported into the Discovery Studio platform. The internal database of the platform was constructed with the help of the function of constructing a 3D database. Compounds with erroneous valence states were removed and 3D coordinates were generated for the rest of the molecules. The resulting database contained all the molecules of the three databases. Finally, the structure of the compound in the database was repaired by the Prepare Ligand tool in Discovery Studio. ConSurf-DB online tool [36] was used to calculate the evolutionary conserved scores of CDK4/6 structures.
4.2. Pharmacophore Construction
Using the Discovery Studio platform, five CDK4/6 inhibitors that have entered clinical studies [13,14,15,16] (Supplementary Figure S2) were superimposed and 10 pharmacophore hypotheses were generated based on their molecular common features. For each generated hypothesis, we set the features it could contain to be hydrogen bond acceptors(A), hydrogen bond donors(D) and hydrophobic features(H), and each pharmacophore hypothesis contained up to five of the same feature. The minimum distance between pharmacophore features within the model was set at 2.97 Å and the best conformation method was applied to generate potential conformations for the positive compounds.
In addition, seven newly published inhibitors from Li et al. were selected as active molecules for testing [37], and 12 inactive decoy molecules were generated using the DUD-E online tool for all inhibitors (five marketed and seven newly published structures, shown in Supplementary Figure S2 and Supplementary Table S1). The DUD-E online decoy generation tool preserved the backbone structure of the positive inhibitors better, allowing the generated inactive molecules to maintain maximum structural similarity to the positive inhibitor [38]. The discriminatory ability and sensitivity of the pharmacophore model was characterized by subject operating characteristic (ROC) curves. The X-axis of the horizontal coordinate of the curve plot is 1-specificity, i.e., the false positive rate. The closer the X-axis is to zero, the higher the accuracy; the Y-axis of the vertical coordinate is called sensitivity, also known as the true positive rate (sensitivity), and the larger the Y-axis is, the higher the accuracy, as reflected by the area under the ROC curve (AUC) being closer to 1 [39]. The pharmacophore ranking score given by the platform was also considered, and the pharmacophore with both the optimal ranking score and the area under the ROC curve (AUC) value was selected as the next step in the virtual screening [30]. The structures of all inhibitor and decoy molecules are shown in Figure S2 and Table S1 of the Supplementary Material.
4.3. Absorption, Distribution, Metabolism, Elimination, and Toxicity (ADMET)
Pharmacokinetics and toxicity (ADMET) assessment is helpful to screen and eliminate molecules with poor proprietary properties from a large number of compounds. Using Discovery Studio’s Calculate Molecule Properties tool, we calculated the ADME properties of 87 compounds. Four pharmacokinetic parameters, including intestinal absorption (HIA), hepatotoxicity (hepatoxic), cytochrome CYP2D6 inhibitory activity and water solubility at 25 °C, were predicted. CYP2D6 plays an important role in the degradation of drugs in vivo. Better intestinal absorbance and CYP2D6 inhibitory activity can prolong the action time of drugs in the human body to the greatest extent. We removed the compounds with poor water solubility, intestinal absorbance and CYP2D6 inhibition, and selected the remaining compounds for further study.
4.4. Molecular Docking
The molecular docking program consists of two parts. First of all, to quickly select the molecules with good target binding activity, 20 molecules selected by ADMET were docked with CDK4 and CDK6, respectively. Among them, the binding site of CDK4 (PDB:5L2S) was determined by the original ligand, the residue of the binding site of CDK6 (PDB:2W96) was identified as Asp-99, Asp-140, Lys-142 and Tyr-17, the central coordinate of the docking site was 24.870297, 18.922378 and 10.713189, and the radius of the two receptor structures was determined to be 15. Then, we used the CDOCKER program to fine dock two molecules with good Libdock scores with the two targets and analyze the interaction between them and the target. Pose Cluster Radius was set to 0.1, and the number of conformations randomly generated by ligands was 10, to achieve the purpose of ligand–receptor semi-flexible docking.
4.5. Molecular Dynamics
After docking, the 100 ns molecular dynamics simulation was used to simulate the complex model of CDK4 and CDK6 with compound 50843 and compound 41369 to test the stability and flexibility of the complex. In this study, the GROMACS2018.1 software package, AMBER99SB-ILDN force field, and SPC216 water model were used for molecular dynamics simulation [40,41]. To ensure the total charge neutrality of the simulation system, a corresponding number of sodium ions were added to the system to replace water molecules to form a solvent box of appropriate size. Then the periodic boundary condition (PBC) was applied to three directions of the system. Using the AMBER99SB-ILDN force field, the force field parameters of the compound were obtained from the ACPYPE website (https://www.bio2byte.be/acpype/, accessed on 3 May 2021) [42]. Initially, the energy of 50,000 steps of the whole system was minimized (EM) at 300 K. After energy minimization, in order to maintain the pressure and temperature of the system, the two minimized systems were balanced by position constrained MD simulation at 300 K for 100 ps. After balancing, the four systems all carried out the final production operation of 100 ns MD simulation at 300 K. The Berendsen coupling algorithm was used to apply periodic boundary conditions under isothermal and isobaric conditions, and the pressure was set to 1 atm. In these four systems, Lin CS algorithm was used to constrain hydrogen bonds. The electrostatic interaction was analyzed by particle grid Ewald method. The calculation of van der Waals Coulomb interaction took 1.3 nm as the cutoff point. The whole MD track was recorded every 100 picoseconds (PS) [43,44,45]. Finally, the root means square deviation (RMSD) of the system and the root mean square fluctuation of atomic position (RMSF) were analyzed. In addition, the radius of gyration (Rg), the solvent accessible surface area (SASA), the total potential energy change curve and the number of hydrogen bonds of each system were also collected [46].
4.6. MM-PBSA
MM/PBSA method is widely used in the calculation of free energy of receptor–ligand binding. This method is called Molecular Mechanics/Poisson Boltzmann (Generalized Born) Surface Area [47]. The basic principle is to calculate the difference between the bound and unbound free energies of two solvated molecules or to compare the free energies of different solvated conformations of the same molecule. We extracted a stable 10 ns from the trajectory for calculation. The following Equation (1) below describes the binding free energy, and the resulting output formula is related to the calculated energies of the ligand and receptor.
The free energy of the protein–ligand complex is expressed by GComplex, Gprotein represents the free energy of the protein in the solvent and Gligand represents the free energy of the ligand in the solvent.
4.7. Analysis of Synthetic Accessibility Score Parameters
The SA score was calculated for the two best compounds using the ADMETlab 2.0 (public by Guoli Xiong et al., Xiangya School of Pharmaceutical Sciences, Central South University, Changsha Hunan, China) online platform [48], considering that the two compounds we selected were not existing available molecules. The SA Score is based on the “complexity” of the molecule, weighting the frequencies of the ECFP4 fingerprints of 1 million compounds obtained from PubChem and summing them to obtain a fragment Score, assuming that “frequently occurring substructures are easy to synthesize”. Meanwhile, the “Complexity Penalty” takes into account the molecular weight and complexity of the compound and normalizes the value from 1 (easy) to 10 (difficult), as is shown in Equation (2). A lower SA score implying that the compound is easier to synthesize.
4.8. Prediction of Inhibitory Activity of Tumor Cell Lines
We used the way2durg online tool to predict the inhibitory activity of two alternative compounds against tumor cell lines. This analysis was performed by using the CLC-Pred web facility [48]. The activity assessment of both compounds was performed based on QSAR models built on the Prediction of Substance Activity Spectra (PASS) tool (http://www.way2drug.com/PASSonline, accessed on 14 April 2022) and a training dataset based on ChEMBLdb cytotoxicity data.
5. Conclusions
In conclusion, in this study, compound 50843 was screened from marine natural products as a CDK4/6 inhibitor by means of a structure-based pharmacophore model, molecular docking, ADMET analysis and kinetic simulation; Preliminary analysis indicated that compound 50843 is a potential small-molecule inhibitor that helps inhibit CDK4/6. Subsequent analysis can further evaluate small molecules through structural modification and experimental techniques to help determine the activity of compounds, thereby providing new drug-like leads for CDK4/6.
Supplementary Materials
The following supporting information can be downloaded at: https://www.mdpi.com/article/10.3390/md20050319/s1, Figure S1: The Crystal structure and Ramachandran plot of CDK4/6.; Figure S2: Five marketed and seven newly published inhibitor structures used to construct/test the pharmacophore; Table S1: The 12 inactive decoy molecule’s smile formula in the test set.
Author Contributions
L.L. conceived and designed the study; Q.W. and Y.L. contributed to the acquisition, analysis and interpretation of data. L.L. and Q.W. wrote the manuscript; L.L. reviewed the paper and provided comments. All authors have read and agreed to the published version of the manuscript.
Funding
This project was supported by the Basic and Applied Basic Research Program of Guangdong Province (2019A1515110201); Program of Department of Natural Resources of Guangdong Province ([2021]53); Discipline Construction Project of Guangdong Medical University (4SG21004G); The Science and technology program of Guangdong Province (2019B090905011).
Institutional Review Board Statement
Not applicable.
Informed Consent Statement
Not applicable.
Data Availability Statement
The data used to support the findings of this study are included within the article.
Acknowledgments
We thank the Public Service Platform of South China Sea for R&D Marine Biomedicine Resources for support.
Conflicts of Interest
The authors declare that they have no known competing financial interests or personal relationships that could have appeared to influence the work reported in this paper.
References
- Malumbres, M.; Barbacid, M. Cell cycle, CDKs and cancer: A changing paradigm. Nat. Rev. Cancer 2009, 9, 153–166. [Google Scholar] [CrossRef] [PubMed]
- Hiebert, S.; Chellappan, S.; Horowitz, J.; Nevins, J. The interaction of RB with E2F coincides with an inhibition of the transcriptional activity of E2F. Genes Dev. 1992, 6, 177–185. [Google Scholar] [CrossRef] [PubMed] [Green Version]
- Talluri, S.; Isaac, C.E.; Ahmad, M.; Henley, S.A.; Francis, S.M.; Martens, A.L.; Bremner, R.; Dick, F.A. A G1 checkpoint mediated by the retinoblastoma protein that is dispensable in terminal differentiation but essential for senescence. Mol. Cell Biol. 2010, 30, 948–960. [Google Scholar] [CrossRef] [Green Version]
- Weintraub, S.J.; Chow, K.N.; Luo, R.X.; Zhang, S.H.; He, S.; Dean, D.C. Mechanism of active transcriptional repression by the retinoblastoma protein. Nature 1995, 375, 812–816. [Google Scholar] [CrossRef] [PubMed]
- Harbour, J.W.; Luo, R.X.; Dei Santi, A.; Postigo, A.A.; Dean, D.C. Cdk phosphorylation triggers sequential intramolecular interactions that progressively block Rb functions as cells move through G1. Cell 1999, 98, 859–869. [Google Scholar] [CrossRef] [Green Version]
- Pandey, K.; An, H.J.; Kim, S.K.; Lee, S.A.; Kim, S.; Lim, S.M.; Kim, G.M.; Sohn, J.; Moon, Y.W. Molecular mechanisms of resistance to CDK4/6 inhibitors in breast cancer: A review. Int. J. Cancer 2019, 145, 1179–1188. [Google Scholar] [CrossRef] [Green Version]
- Chen, P.; Xu, Y.; Li, X.; Yao, H.; Lin, K. Development and strategies of CDK4/6 inhibitors. Future Med. Chem. 2020, 12, 127–145. [Google Scholar] [CrossRef]
- Goel, S.; DeCristo, M.J.; McAllister, S.S.; Zhao, J.J. CDK4/6 inhibition in cancer: Beyond cell cycle arrest. Trends Cell Biol. 2018, 28, 911–925. [Google Scholar] [CrossRef]
- Wood, D.J.; Endicott, J.A. Structural insights into the functional diversity of the CDK–cyclin family. Open Biol. 2018, 8, 180112. [Google Scholar] [CrossRef] [Green Version]
- Kaltheuner, I.H.; Anand, K.; Moecking, J.; Düster, R.; Wang, J.; Gray, N.S.; Geyer, M. Abemaciclib is a potent inhibitor of DYRK1A and HIP kinases involved in transcriptional regulation. Nat. Commun. 2021, 12, 1–15. [Google Scholar] [CrossRef]
- Day, P.J.; Cleasby, A.; Tickle, I.J.; O’Reilly, M.; Coyle, J.E.; Holding, F.P.; McMenamin, R.L.; Yon, J.; Chopra, R.; Lengauer, C.; et al. Crystal structure of human CDK4 in complex with a D-type cyclin. Proc. Natl. Acad. Sci. USA 2009, 106, 4166–4170. [Google Scholar] [CrossRef] [PubMed] [Green Version]
- Chen, P.; Lee, N.V.; Hu, W.; Xu, M.; Ferre, R.A.; Lam, H.; Bergqvist, S.; Solowiej, J.; Diehl, W.; He, Y.-A.; et al. Spectrum and Degree of CDK Drug Interactions Predicts Clinical Performance. Mol. Cancer Ther. 2016, 15, 2273–2281. [Google Scholar] [CrossRef] [PubMed] [Green Version]
- Liu, C.; Huang, Y.; Qin, T.; You, L.; Lu, F.; Hu, D.; Xiao, R.; Qin, X.; Guo, E.; Yang, B.; et al. AZD5153 reverses palbociclib resistance in ovarian cancer by inhibiting cell cycle-related proteins and the MAPK/PI3K-AKT pathway. Cancer Lett. 2022, 528, 31–44. [Google Scholar] [CrossRef]
- Braal, C.L.; Jongbloed, E.M.; Wilting, S.M.; Mathijssen, R.H.J.; Koolen, S.L.W.; Jager, A. Inhibiting CDK4/6 in Breast Cancer with Palbociclib, Ribociclib, and Abemaciclib: Similarities and Differences. Drugs 2020, 81, 317–331. [Google Scholar] [CrossRef] [PubMed]
- Weiss, J.M.; Csoszi, T.; Maglakelidze, M.; Hoyer, R.J.; Beck, J.T.; Gomez, M.D.; Lowczak, A.; Aljumaily, R.; Lima, C.M.R.; Boccia, R.V.; et al. Myelopreservation with the CDK4/6 inhibitor trilaciclib in patients with small-cell lung cancer receiving first-line chemotherapy: A phase Ib/randomized phase II trial. Ann. Oncol. 2019, 30, 1613–1621. [Google Scholar] [CrossRef] [PubMed] [Green Version]
- Limagne, E.; Nuttin, L.; Thibaudin, M.; Jacquin, E.; Aucagne, R.; Bon, M.; Revy, S.; Barnestein, R.; Ballot, E.; Truntzer, C.; et al. MEK inhibition overcomes chemoimmunotherapy resistance by inducing CXCL10 in cancer cells. Cancer Cell 2022, 40, 136–152.e12. [Google Scholar] [CrossRef]
- Meric-Bernstam, F. Combining neratinib with CDK4/6, mTOR and MEK inhibitors in models of HER2-positive cancer. Clin. Cancer Res. 2021, 27, 1681–1694. [Google Scholar]
- Yang, C.; Li, Z.; Bhatt, T.; Dickler, M.; Giri, D.; Scaltriti, M.; Baselga, J.; Rosen, N.; Chandarlapaty, S. Acquired CDK6 amplification promotes breast cancer resistance to CDK4/6 inhibitors and loss of ER signaling and dependence. Oncogene 2016, 36, 2255–2264. [Google Scholar] [CrossRef] [Green Version]
- Molinski, T.F.; Dalisay, D.S.; Lievens, S.L.; Saludes, J.P. Drug development from marine natural products. Nat. Rev. Drug Discov. 2009, 8, 69–85. [Google Scholar] [CrossRef]
- Song, C.; Yang, J.; Zhang, M.; Ding, G.; Jia, C.; Qin, J.; Guo, L. Marine Natural Products: The Important Resource of Biological Insecticide. Chem. Biodivers. 2021, 18, e2001020. [Google Scholar] [CrossRef]
- Matulja, D.; Wittine, K.; Malatesti, N.; Laclef, S.; Turks, M.; Markovic, M.K.; Ambrožić, G.; Marković, D. Marine natural products with high anticancer activities. Curr. Med. Chem. 2020, 27, 1243–1307. [Google Scholar] [CrossRef] [PubMed]
- Villa, F.A.; Gerwick, L. Marine natural product drug discovery: Leads for treatment of inflammation, cancer, infections, and neurological disorders. Immunopharmacol. Immunotoxicol. 2010, 32, 228–237. [Google Scholar] [CrossRef] [PubMed]
- Jiménez, C. Marine Natural Products in Medicinal Chemistry. ACS Med. Chem. Lett. 2018, 9, 959–961. [Google Scholar] [CrossRef] [PubMed] [Green Version]
- Bauer, R.A.; Wurst, J.M.; Tan, D.S. Expanding the range of ‘druggable’targets with natural product-based libraries: An academic perspective. Curr. Opin. Chem. Biol. 2010, 14, 308–314. [Google Scholar] [CrossRef] [PubMed] [Green Version]
- Lyu, C.; Chen, T.; Qiang, B.; Liu, N.; Wang, H.; Zhang, L.; Liu, Z. CMNPD: A comprehensive marine natural products database towards facilitating drug discovery from the ocean. Nucleic Acids Res. 2021, 49, D509–D515. [Google Scholar] [CrossRef] [PubMed]
- Blunt, J.W.; Copp, B.R.; Munro, M.H.G.; Northcote, P.T.; Prinsep, M.R. Marine natural products. Nat. Prod. Rep. 2010, 27. [Google Scholar] [CrossRef]
- Davis, G.D.J.; Vasanthi, A.H.R. Seaweed metabolite database (SWMD): A database of natural compounds from marine algae. Bioinformation 2011, 5, 361–364. [Google Scholar] [CrossRef] [Green Version]
- Alnabulsi, S.M.; Al-shar’i, N.A. Hit identification of SMYD3 enzyme inhibitors using structure-based pharmacophore modeling. Future Med. Chem. 2019, 11, 1107–1117. [Google Scholar] [CrossRef]
- Damm, K.L.; Carlson, H.A. Gaussian-weighted RMSD superposition of proteins: A structural comparison for flexible proteins and predicted protein structures. Biophys. J. 2006, 90, 4558–4573. [Google Scholar] [CrossRef] [Green Version]
- Liu, N.; Wang, X.; Wu, H.; Lv, X.; Xie, H.; Guo, Z.; Wang, J.; Dou, G.; Zhang, C.; Sun, M. Computational study of effective matrix metalloproteinase 9 (MMP9) targeting natural inhibitors. Aging 2021, 13, 22867–22882. [Google Scholar] [CrossRef]
- Rao, S.N.; Head, M.S.; Kulkarni, A.; Kulkarni, A.; LaLonde, J.M. Validation studies of the site-directed docking program LibDock. J. Chem. Inf. Model. 2007, 47, 2159–2171. [Google Scholar] [CrossRef] [PubMed] [Green Version]
- Yuan, K.; Min, W.; Wang, X.; Li, J.; Kuang, W.; Zhang, F.; Xie, S.; Yang, P. Discovery of novel and selective CDK4/6 inhibitors by pharmacophore and structure-based virtual screening. Future Med. Chem. 2020, 12, 1121–1136. [Google Scholar] [CrossRef] [PubMed]
- Luo, L.; Zhong, A.; Wang, Q.; Zheng, T. Structure-Based Pharmacophore Modeling, Virtual Screening, Molecular Docking, ADMET, and Molecular Dynamics (MD) Simulation of Potential Inhibitors of PD-L1 from the Library of Marine Natural Products. Mar. Drugs 2022, 20, 29. [Google Scholar] [CrossRef] [PubMed]
- O’leary, B.; Finn, R.S.; Turner, N.C. Treating cancer with selective CDK4/6 inhibitors. Nat. Rev. Clin. Oncol. 2016, 13, 417–430. [Google Scholar] [CrossRef]
- Cruz, J.V.; Giuliatti, S.; Alves, L.B.; Silva, R.C.; Ferreira, E.F.; Kimani, N.M.; Silva, C.H.; de Souza, J.S.; Espejo-Román, J.M.; Santos, C.B.R. Identification of novel potential cyclooxygenase-2 inhibitors using ligand-and structure-based virtual screening approaches. J. Biomol. Struct. Dyn. 2021, 1–23. [Google Scholar] [CrossRef]
- Goldenberg, O.; Erez, E.; Nimrod, G.; Ben-Tal, N. The ConSurf-DB: Pre-calculated evolutionary conservation profiles of protein structures. Nucleic Acids Res. 2009, 37, D323–D327. [Google Scholar] [CrossRef]
- Li, Q.; Chen, L.; Ma, Y.F.; Jian, X.E.; Ji, J.H.; You, W.W.; Zhao, P.L. Development of pteridin-7(8H)-one analogues as highly potent cyclin-dependent kinase 4/6 inhibitors: Synthesis, structure-activity relationship, and biological activity. Bioorganic Chem. 2021, 116, 105324. [Google Scholar] [CrossRef]
- Mysinger, M.M.; Carchia, M.; Irwin, J.J.; Shoichet, B.K. Directory of useful decoys, enhanced (DUD-E): Better ligands and decoys for better benchmarking. J. Med. Chem. 2012, 55, 6582–6594. [Google Scholar] [CrossRef]
- Abraham, M.J.; Murtola, T.; Schulz, R.; Páll, S.; Smith, J.C.; Hess, B.; Lindahl, E.J.S. GROMACS: High performance molecular simulations through multi-level parallelism from laptops to supercomputers. SoftwareX 2015, 1, 19–25. [Google Scholar] [CrossRef] [Green Version]
- Mark, P.; Nilsson, L. Structure and dynamics of the TIP3P, SPC, and SPC/E water models at 298 K. J. Phys. Chem. A 2001, 105, 9954–9960. [Google Scholar] [CrossRef]
- da Silva, A.W.S.; Vranken, W.F. ACPYPE-Antechamber python parser interface. BMC Res. Notes 2012, 5, 367. [Google Scholar] [CrossRef] [PubMed] [Green Version]
- Miller, A.; Carchman, R.; Long, R.; Denslow, S.A. La Crosse viral infection in hospitalized pediatric patients in Western North Carolina. Hosp. Pediatr. 2012, 2, 235–242. [Google Scholar] [CrossRef] [PubMed] [Green Version]
- Linse, B.; Linse, P. Tuning the smooth particle mesh Ewald sum: Application on ionic solutions and dipolar fluids. J. Chem. Phys. 2014, 141, 184114. [Google Scholar] [CrossRef] [PubMed]
- Hess, B. P-LINCS: A parallel linear constraint solver for molecular simulation. J. Chem. Theory Comput. 2008, 4, 116–122. [Google Scholar] [CrossRef] [PubMed]
- Beckstein, O.; Denning, E.J.; Perilla, J.R.; Woolf, T.B. Zipping and unzipping of adenylate kinase: Atomistic insights into the ensemble of open↔ closed transitions. J. Mol. Biol. 2009, 394, 160–176. [Google Scholar] [CrossRef] [Green Version]
- Kumari, R.; Kumar, R.; Open Source Drug Discovery Consortium; Lynn, A. g_mmpbsa A GROMACS tool for high-throughput MM-PBSA calculations. J. Chem. Inf. Modeling 2014, 54, 1951–1962. [Google Scholar] [CrossRef]
- Xiong, G.; Wu, Z.; Yi, J.; Fu, L.; Yang, Z.; Hsieh, C.; Yin, M.; Zeng, X.; Wu, C.; Lu, A.; et al. ADMETlab 2.0: An integrated online platform for accurate and comprehensive predictions of ADMET properties. Nucleic Acids Res. 2021, 49, W5–W14. [Google Scholar] [CrossRef]
- Lagunin, A.A.-O.; Dubovskaja, V.I.; Rudik, A.V.; Pogodin, P.V.; Druzhilovskiy, D.S.; Gloriozova, T.A.; Filimonov, D.A.; Sastry, N.G.; Poroikov, V.V. CLC-Pred: A freely available web-service for in silico prediction of human cell line cytotoxicity for drug-like compounds. PLoS ONE 2018, 13, e0191838. [Google Scholar] [CrossRef] [Green Version]


Publisher’s Note: MDPI stays neutral with regard to jurisdictional claims in published maps and institutional affiliations. |
© 2022 by the authors. Licensee MDPI, Basel, Switzerland. This article is an open access article distributed under the terms and conditions of the Creative Commons Attribution (CC BY) license (https://creativecommons.org/licenses/by/4.0/).