2. Results and Discussion
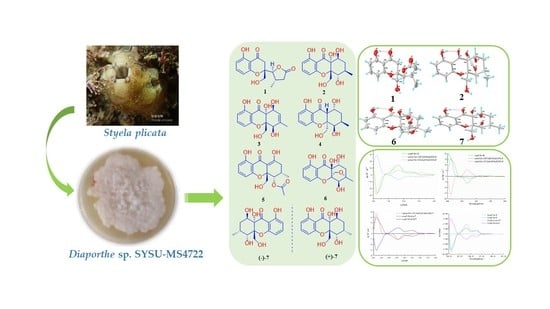
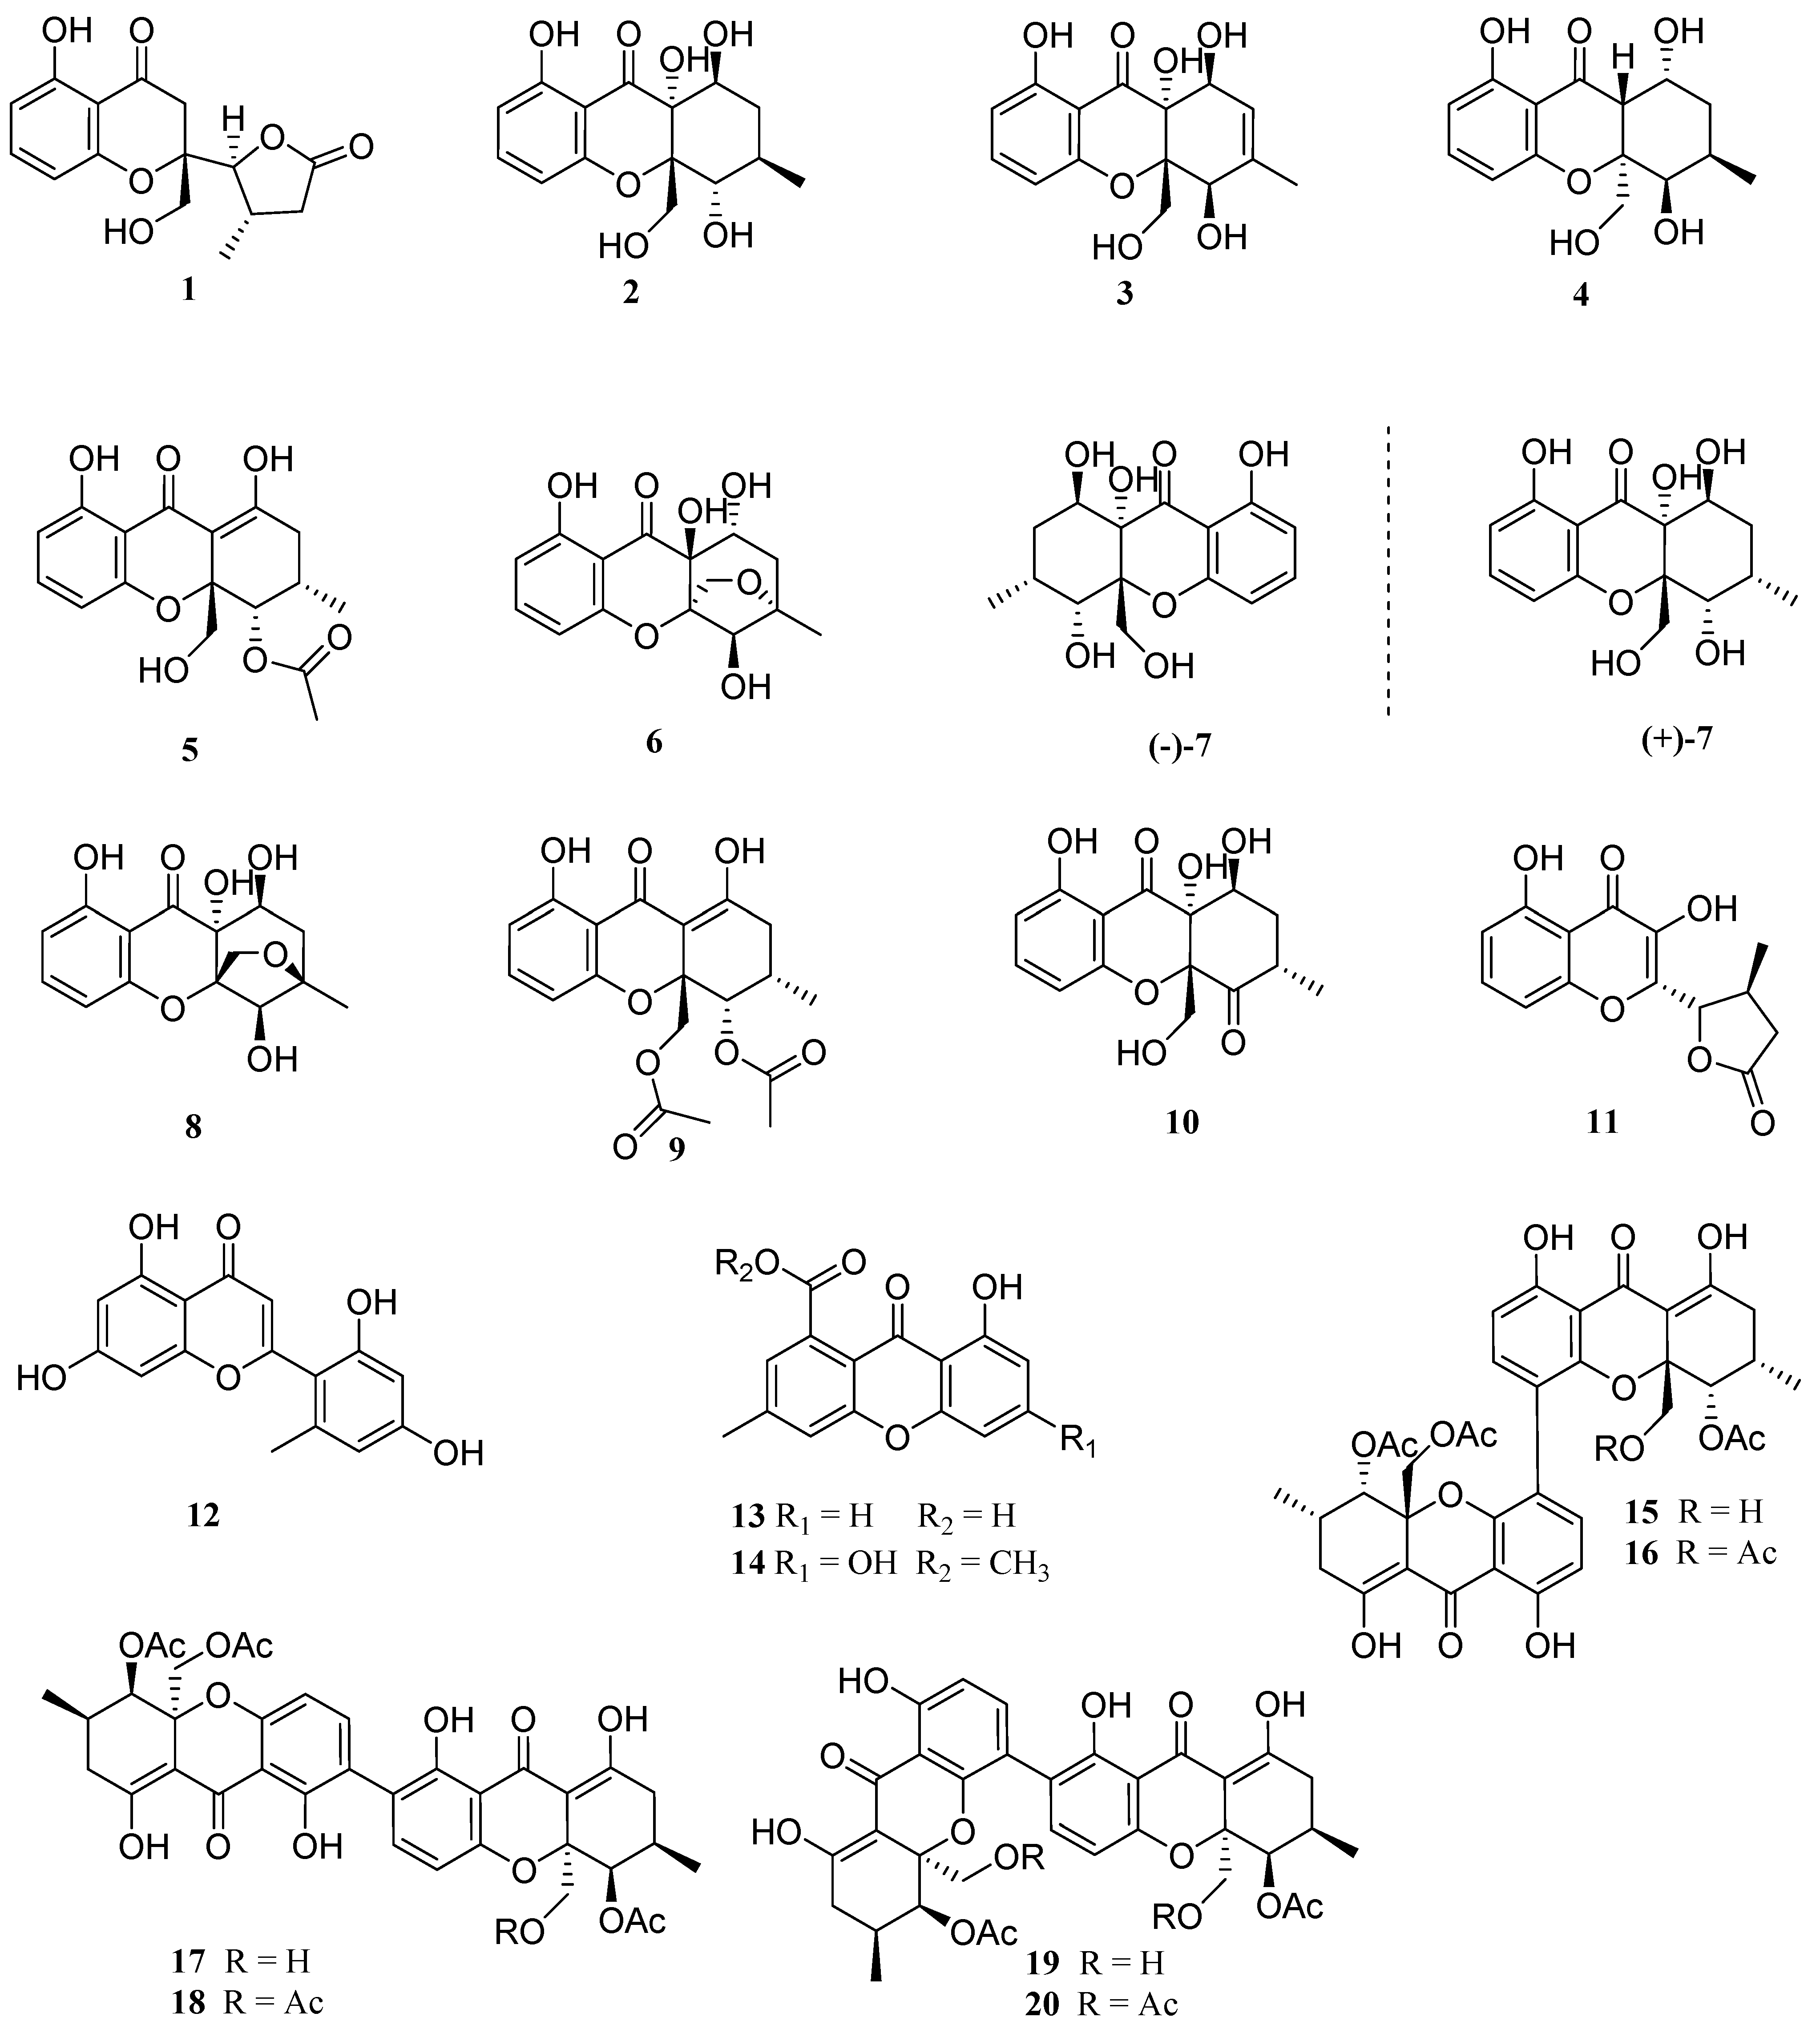
The EtOAc extract of marine-derived fungus Diaporthe sp. SYSU-MS4722 was performed on the repeated silica gel and Sephadex LH-20 column chromatography, followed by semipreparative HPLC to afford seven new xanthones, diaporthones A−H (1−7) along with 13 known analogues including seven mono- (8−14) and six dimeric xanthones (15−20).
Diaporthone A (
1) was obtained as yellow crystal, and its molecular formula was established as C
15H
16O
6 by the negative HRESIMS ions at
m/
z 291.0869 [M − H]
− (calculated for C
15H
15O
6, 291.0874) (
Figure S1), indicating eight degrees of unsaturation. The
1H NMR (
Table 1) displayed three aromatic protons (
δH 6.40 (1H, d,
J = 8.3 Hz); 6.43 (H,
J = 8.3 Hz); 7.38 (1H, t,
J = 8.3 Hz)) owing to a 1,2,3-trisubstituted benzene ring, two methines (δ
H 4.39 (1H, d,
J = 4.2 Hz); 2.85 (H, m)), two methylenes (
δH 2.22 (1H, dd,
J = 8.9, 21.6 Hz), 2.86 (1H, m); 3.76 (2H, s),
δH 2.98 (2H, br s)), and one methyl (
δH 1.20 (3H, d,
J = 6.6 Hz)). The
13C NMR showed the presence of 15 carbons, which were assigned with the help of an HMBC experiment. Except for signals (δ
C 161.4, 159.4, 138.1, 108.7, 107.2, 106.9) attributed to one aromatic ring, the other carbons were identified as one conjugated carbonyl (
δC 196.8), one ester carbonyl (
δC 177.3), and remaining six sp
3 hybridized carbons.
1H and
13C NMR data (
Table 1) suggested that
1 belonged to a chromone derivative containing a
γ-lactone moiety.
The planar structure of
1 was identified based on the extensive 2D NMR (
1H–
1H COSY, HSQC, and HMBC) (
Figures S2–S7) spectroscopic data (
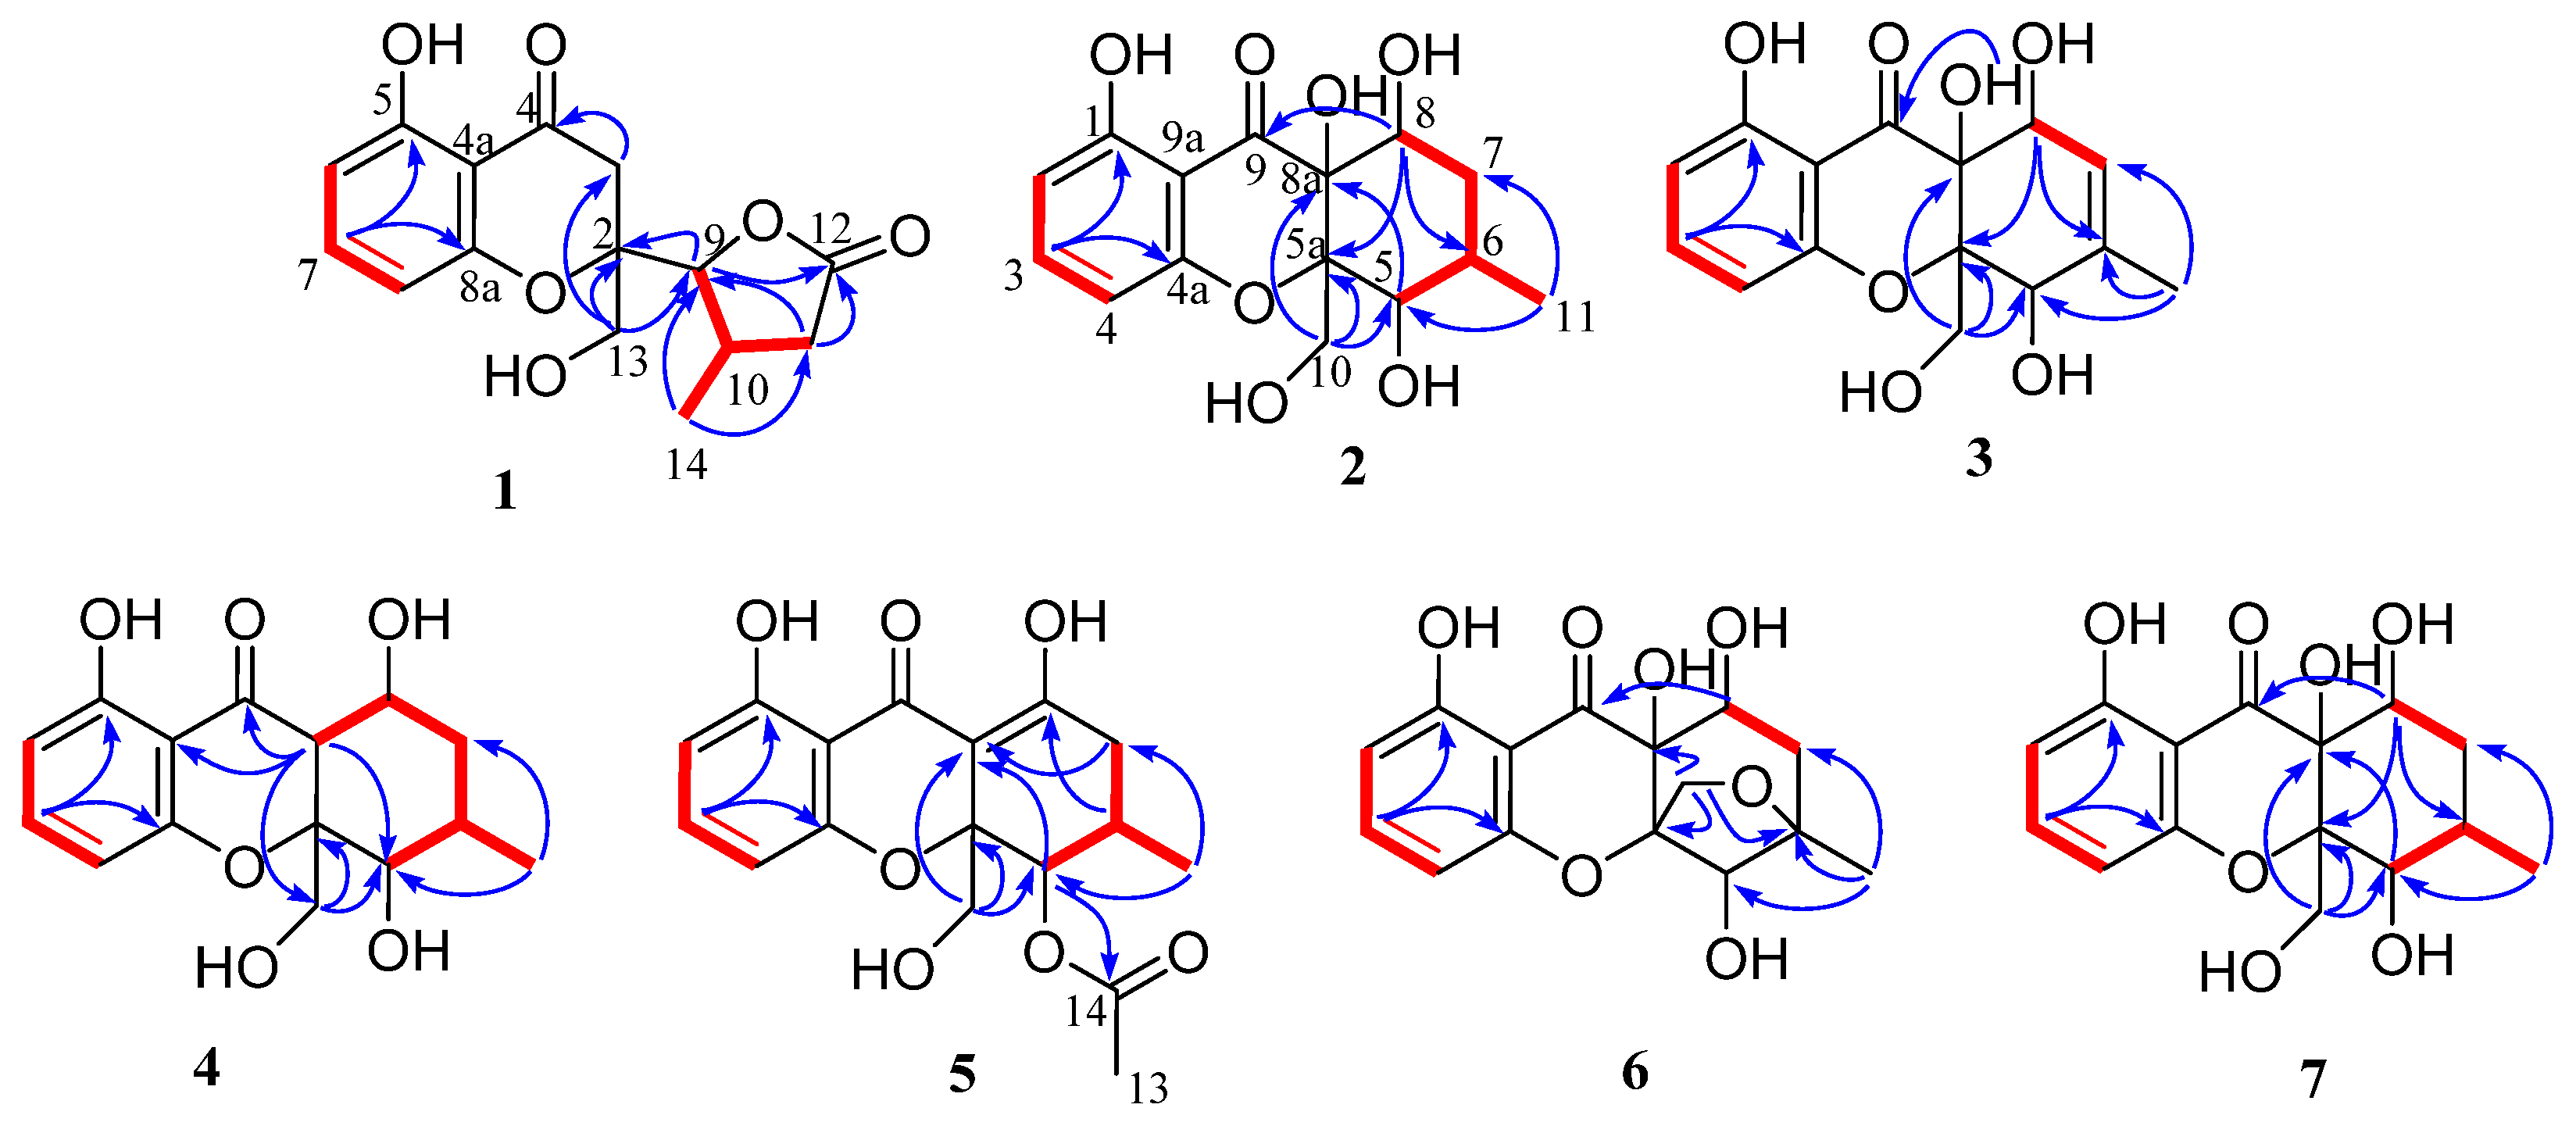
Figure 2). The HMBC correlations from H-7 to C-5 and C-8a, from H-8 to C-4a, from H-13 to C-2 and C-3, and
1H–
1H COSY of H-6/H-7/H-8, as well as the NMR chemical shifts, complete a 4-hydroxylchromone skeleton with a hydroxymethyl group at C-2. The γ-lactone moiety with a methyl group was assigned by HMBC correlations from H-9 to ester carbonyl C-12, from H-11 to C-9 and C-12, from H-14 to C-9, C-10 and C-11, and the
1H–
1H COSY correlations of H-9/H-10/H-11 and H-10/H-14. The
γ-lactone moiety was finally linked to C-2 of the chromone skeleton, supported by HMBC correlations from H-13 to C-9 and H-9 to C-2.
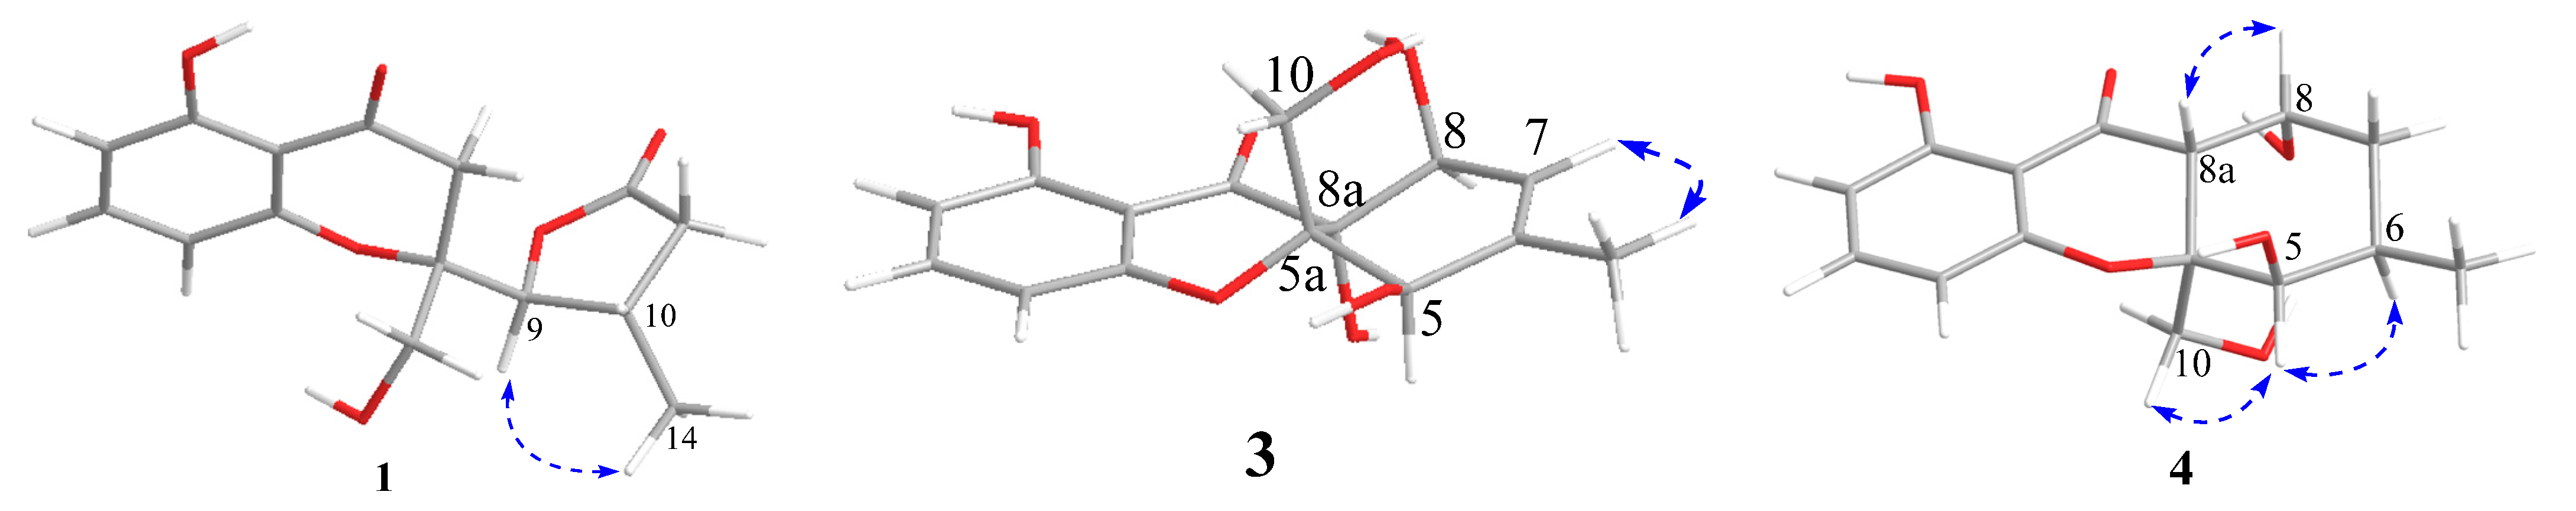
The NOESY spectrum of
1 showed a correlation from H-9 to H-14, indicating that H-9 and H-14 were on the same side of the
γ-lactone (
Figure 3). The X-ray structure (
Figure 4) showed that the protons H-13 and H-9 were located on the close position of the axis of rotation C2–C9, indicating that the relative configuration of
1 was 2
S*, 9
S*, and 10
S*. In addition, the ECD spectrum of (2
S, 9
S, 10
S)-
1 calculated by a quantum chemical method at the [B3LYP/6-311 + G(2d,p)] was in good agreement with that of the experimental one (
Figure 5). Thus, the absolute configuration of
1 was identified as 2
S, 9
S, and 10
S.
It can be seen that the proton H2-3 of 1 was the α-H atom of ketone with weak acid, whose α-hydrogen exchange (α-deuterodeprotonatioion reaction) could be found in CD3OD. The signal of H2-3 was observed as a weak and small peak, and the integrals were much less than two in the 1H NMR spectrum. The natural product with the α-H atom of ketone moiety would be better for acquiring the NMR data under the deuterated solvents without exchangeable deuterium.
Diaporthone B (
2) was obtained as yellow crystal, and its molecular formula was established as C
15H
18O
7 by the negative HRESIMS ions at
m/
z 309.0976 [M − H]
− (calculated for C
15H
17O
7, 309.0980), indicating eight degrees of unsaturation. The
1H NMR (
Figure S10) displayed three aromatic protons (
δH 6.44 (1H, dd,
J = 8.2, 0.9 Hz); 6.55 (H, d,
J = 8.2 Hz); 7.39 (1H, t,
J = 8.3 Hz)), three methines (
δH 4.44 (1H, t,
J = 4.2 Hz); 4.29 (1H, m); 2.34 (1H, m)), two methylenes (
δH 1.57 (1H, dd,
J = 14.5, 2.8 Hz), 2.43 (1H, m); 3.83 (1H, d,
J = 13.5 Hz), 4.28 (1H, s)), and one methyl (
δH 1.32 (3H, d,
J = 7.8 Hz)). The
13C NMR showed the presence of 15 carbons corresponding to seven sp
2 hybrid carbons including one ketone carbonyl (
δC 196.4) for xanthone characteristic and eight sp
3 hybrid carbons. The planar structure of
2 was identified by
1H–
1H COSY, HSQC, and HMBC spectroscopic data (
Figure 2). The HMBC correlations from H-10 to C-5a and C-8a, from H-3 to C-1 and C-4a, and
1H–
1H COSY of H-2/H-3/H-4, as well as the NMR chemical shifts, suggested the presence of a hydroxylchromone skeleton with a hydroxymethyl group at C-5a and a hydroxyl at C-8a. The remaining ring was assigned to be 4-hydroxyl-5-methyl cyclohexenol on the basis of
1H–
1H COSY of H-6/H-7/H-8/H-9 and H-6/H-11, and key HMBC correlations from H-8 to C-9 and C-5a, H-5 to C-8a. Finally, the structure and absolute configuration (5
S, 5a
S, 6
R, 8a
R, 8
S) were distinctly demonstrated by X-ray crystallographic analysis (
Figure 4) from Cu Kα data with a Flack parameter of −0.01(14) [
17] and a Hooft parameter of 0.06(7) [
18].
Diaporthone C (
3) was obtained as a colorless oil, whose molecular formula was determined as C
15H
16O
7 on the basis of negative-ion HRESIMS (
m/
z 307.0820 [M − H]
−, calculated for C
15H
15O
7, 307.0823). Detailed analysis of its NMR spectroscopic data (
Table 2) suggested that
3 was similar to
2 belonging to the xanthone class, except for the presence of an additional double bond (
δC 140.1 and 122.1;
δH 5.60) in
3. The key HMBC correlations from methyl protons H-11 to olefinic carbons C-6 and C-7 were allowed to assign the location of the double bond in
3. The gross structure of
3 was identified by the 2D NMR spectroscopy (
Figure 2). NOE correlations of H-5 with H-10 and H-10 with H-8 were not observed, and the relative configuration of compound
3 should be 5
R*, 5a
S*, 8a
R*, and 8
S* (
Figure 3). The predicted ECD curve of
3 matched well with the experimental one (
Figure 5). Hence, the absolute configuration of
3 was identified as 5
R, 5a
S, 8a
R, and
8S.
Diaporthone D (
4) was obtained as a colorless oil, and its molecular formula C
15H
19O
6 was identified by the positive HRESIMS ion at HRESIMS
m/
z 295.1169 [M + H]
+ (calculated for C
15H
19O
6, 295.1176). Comparison of the
1H and
13C NMR data (
Table 1) of
4 with those of
2 suggested that
4 possessed the same xanthone framework, except for one of the hydroxyl groups (8a-OH) in
2 being replaced by a proton in
4. The
1H–
1H COSY of H-8 and H-8a and HMBC correlations from H-8a to C-9 and C-10 assigned the position of the proton H-8, in accordance with the proton having double peaks at 2.48 ppm (
Figures S26–S31). The gross structure of
4 was identified by the 2D NMR spectroscopy (
Figure 2). The coupling constant value of
J8,8a = 4.5 Hz and NOE correlation of H-8a with H-8 indicated that the orientation of H-8 and H-8a was the same face of cyclohexane (
Figure 3). The coupling constant value of
J5,6 = 2.1 Hz and NOE correlation of H-5 with H-6 and H-10 suggested that H-5, H-6, and H-10 were on the same side. The relative configuration of compound
4 was assigned as 5
R*, 5a
R*, 6
R*, 8a
R*, and 8
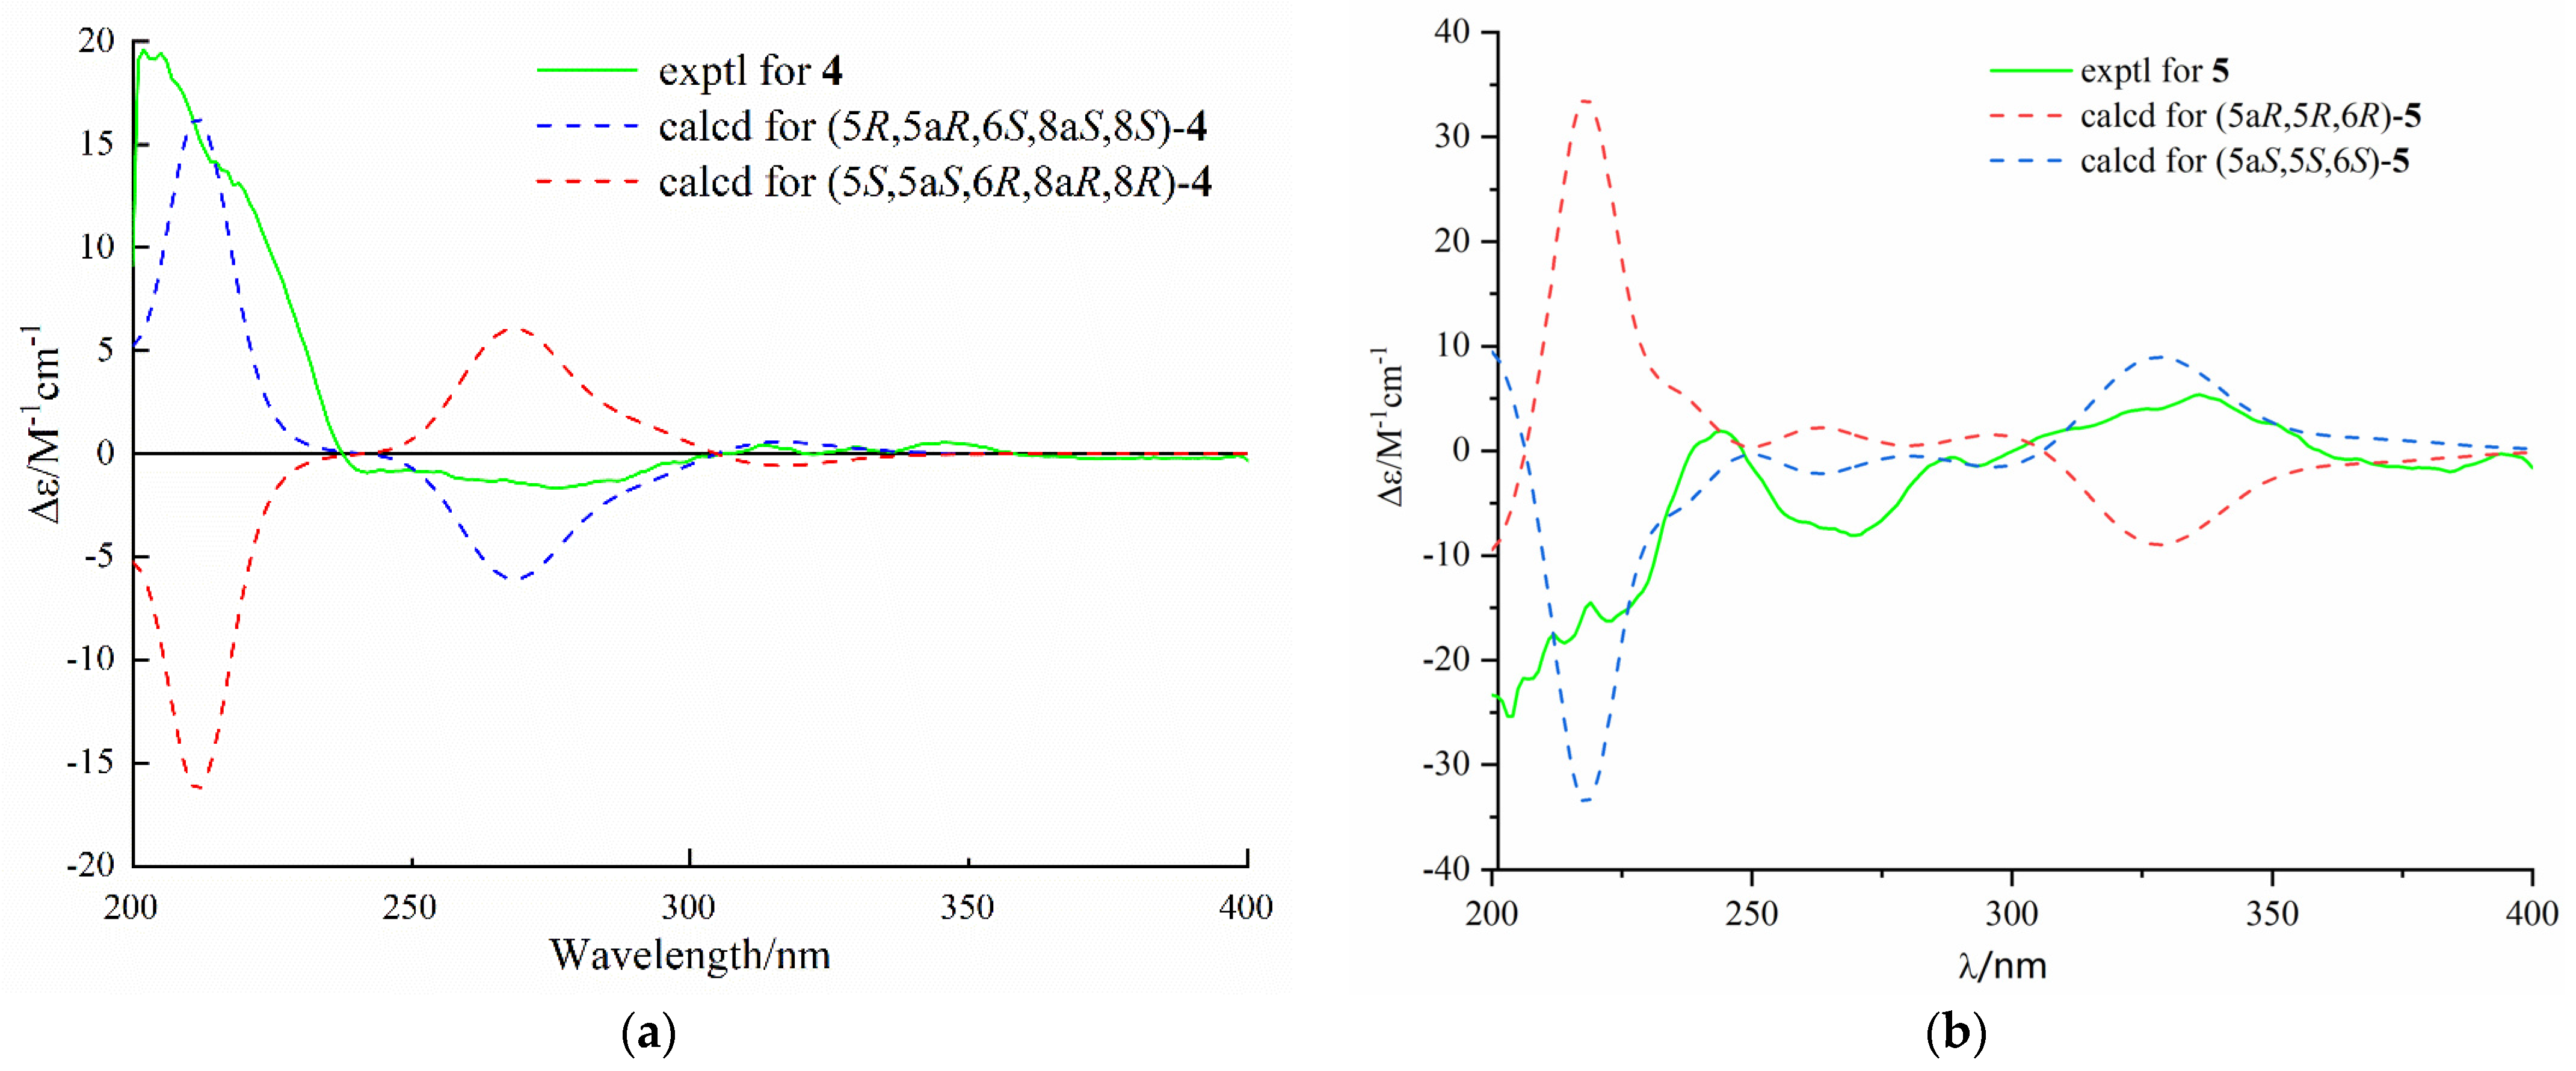
R*. The absolute configuration of
4 was assigned by comparing the experimental and calculated ECD spectra, and the calculated ECD spectrum was agreed with that of the experimental one (
Figure 6). Therefore, the absolute configuration of
4 was assigned as 5
R, 5a
R, 6
R, 8a
R, and 8
R.Diaporthone E (
5) was obtained as a colorless oil. The negative HRESIMS
m/
z 333.0975 [M − H]
− (calculated for C
17H
17O
7, 333.0980) suggested the molecular formula of
5 was C
17H
18O
7 with four degrees of unsaturation. The 1D and 2D NMR data (
Figures S34–S39) indicated that compound
5 shared the same xanthone skeleton as penexanthone B (
9). The only difference between them was that compound
5 was the absence of an additional acetyl group (10-Ac) compared to
6. Compound
5 was a precursor of biosynthesis of 12-deacetylphomoxanthone A (
15), and there is reason to believe that they share the same absolute configuration of 5
S, 5a
S, and 6
S. The predicted ECD spectrum of (5
S, 5a
S, 6
S)-
5 showed well fit with that of the experimental one (
Figure 6). Thus, compound
5 was identified as de-10-acetylpenexanthone B.
Diaporthone F (
6) was obtained as a yellow crystal and had the same molecular formula (C
15H
16O
7) as
8 established by the HR-ESIMS ions at
m/
z 307.0828 [M − H]
− (calculated for C
15H
15O
7, 307.0823). Compound
6 shared the same planar structure as phomoxanthone G (
8), which was further identified by
1H-
1H COSY, HSQC, and HMBC spectroscopies (
Figures S42–S47). Detailed analysis of their NMR (
Table 3), diaporthone F (
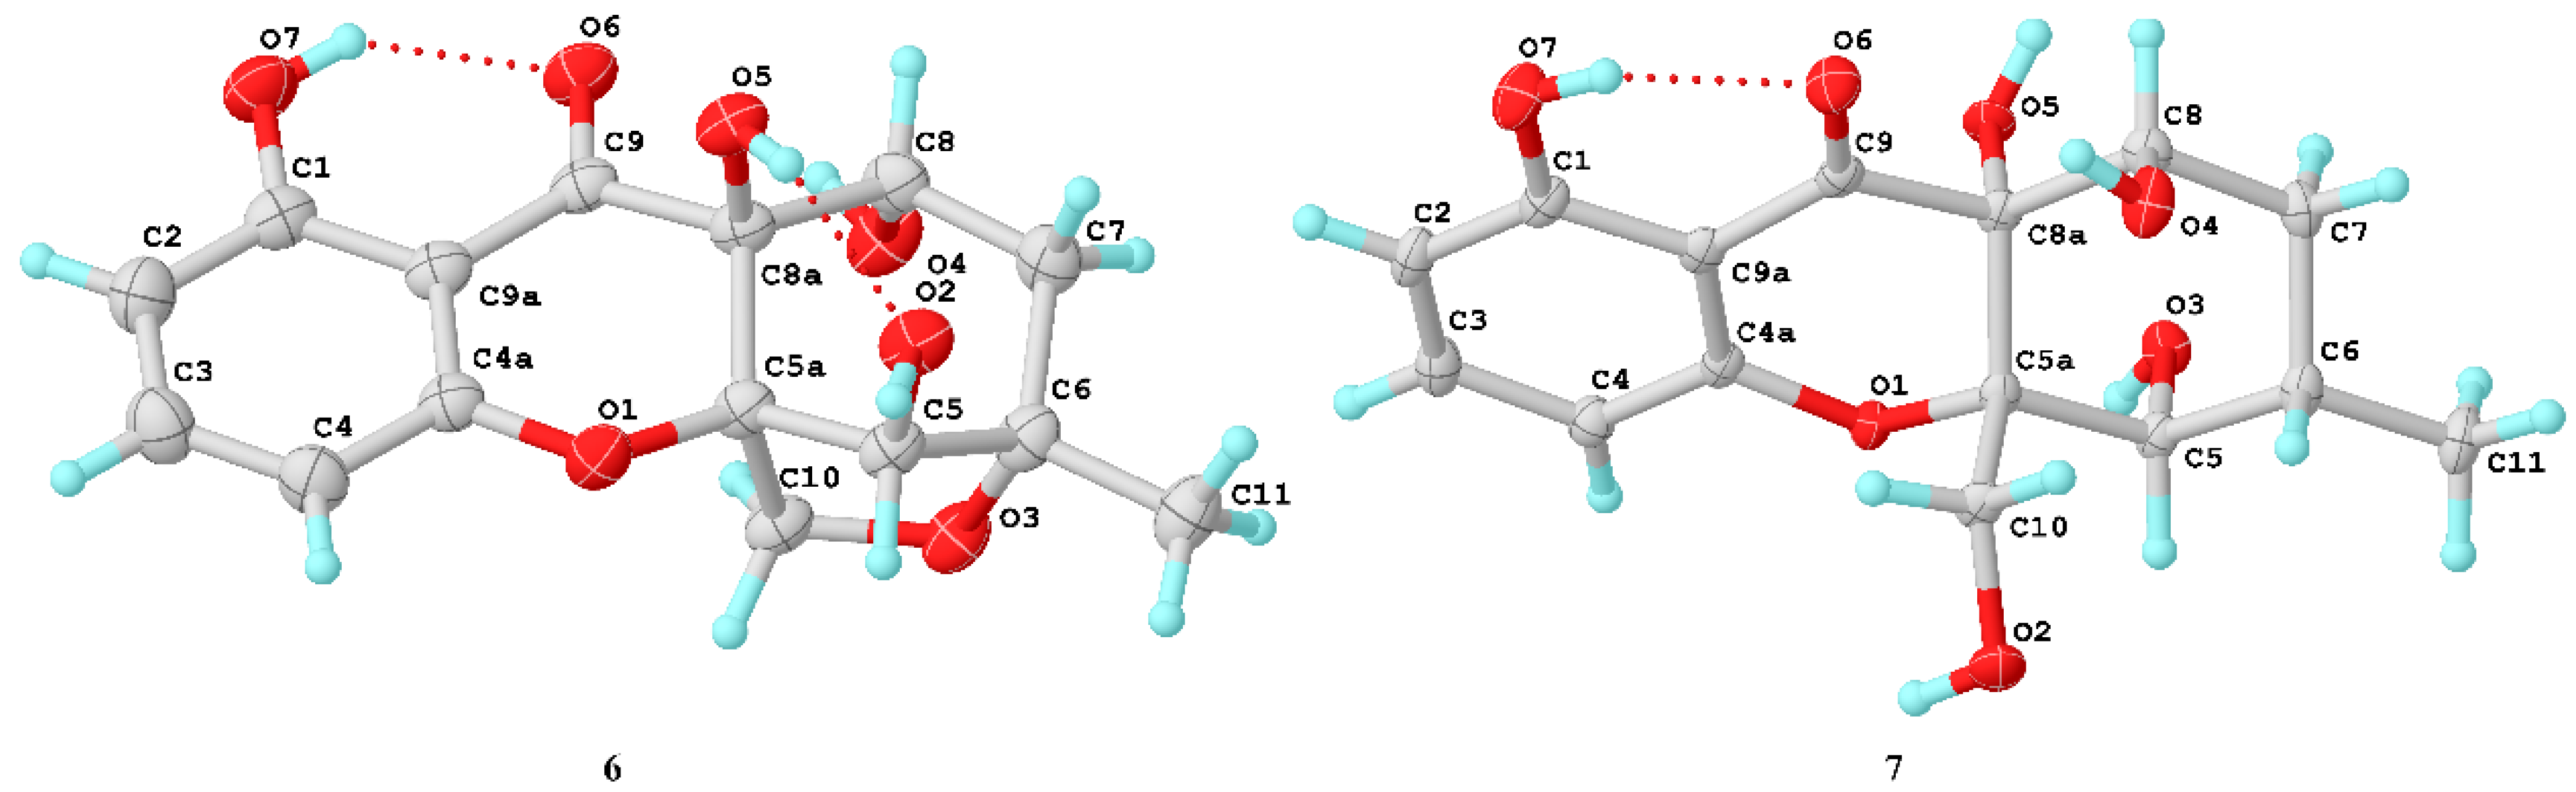
6) and phomoxanthone G should be a pair of epimers. The structure of
6 (
Figure 7) and configuration (5
R, 5a
R, 6
S, 8a
S, 8
R) were identified by X-ray crystallographic analysis from Cu Kα data with a Flack parameter of -0.13(15) [
17] and a Hooft parameter of 0.16(9).
Compounds
7 was obtained as a yellow crystal and had the molecular formula C
15H
18O
7, which was established by the HR-ESIMS ions at
m/
z 309.0978 [M − H]
− (calculated for C
15H
17O
7, 309.0979). The structure of
7 was clearly identified by X-ray crystallographic analysis (
Figure 6), whose relative and planar structure was the same as that of phaseolorin D [
19]. In detail, the X-ray structure was the monoclinic space group
P2
1/c (
Figure 7), which was different from that of phaseolorin D ((+)-
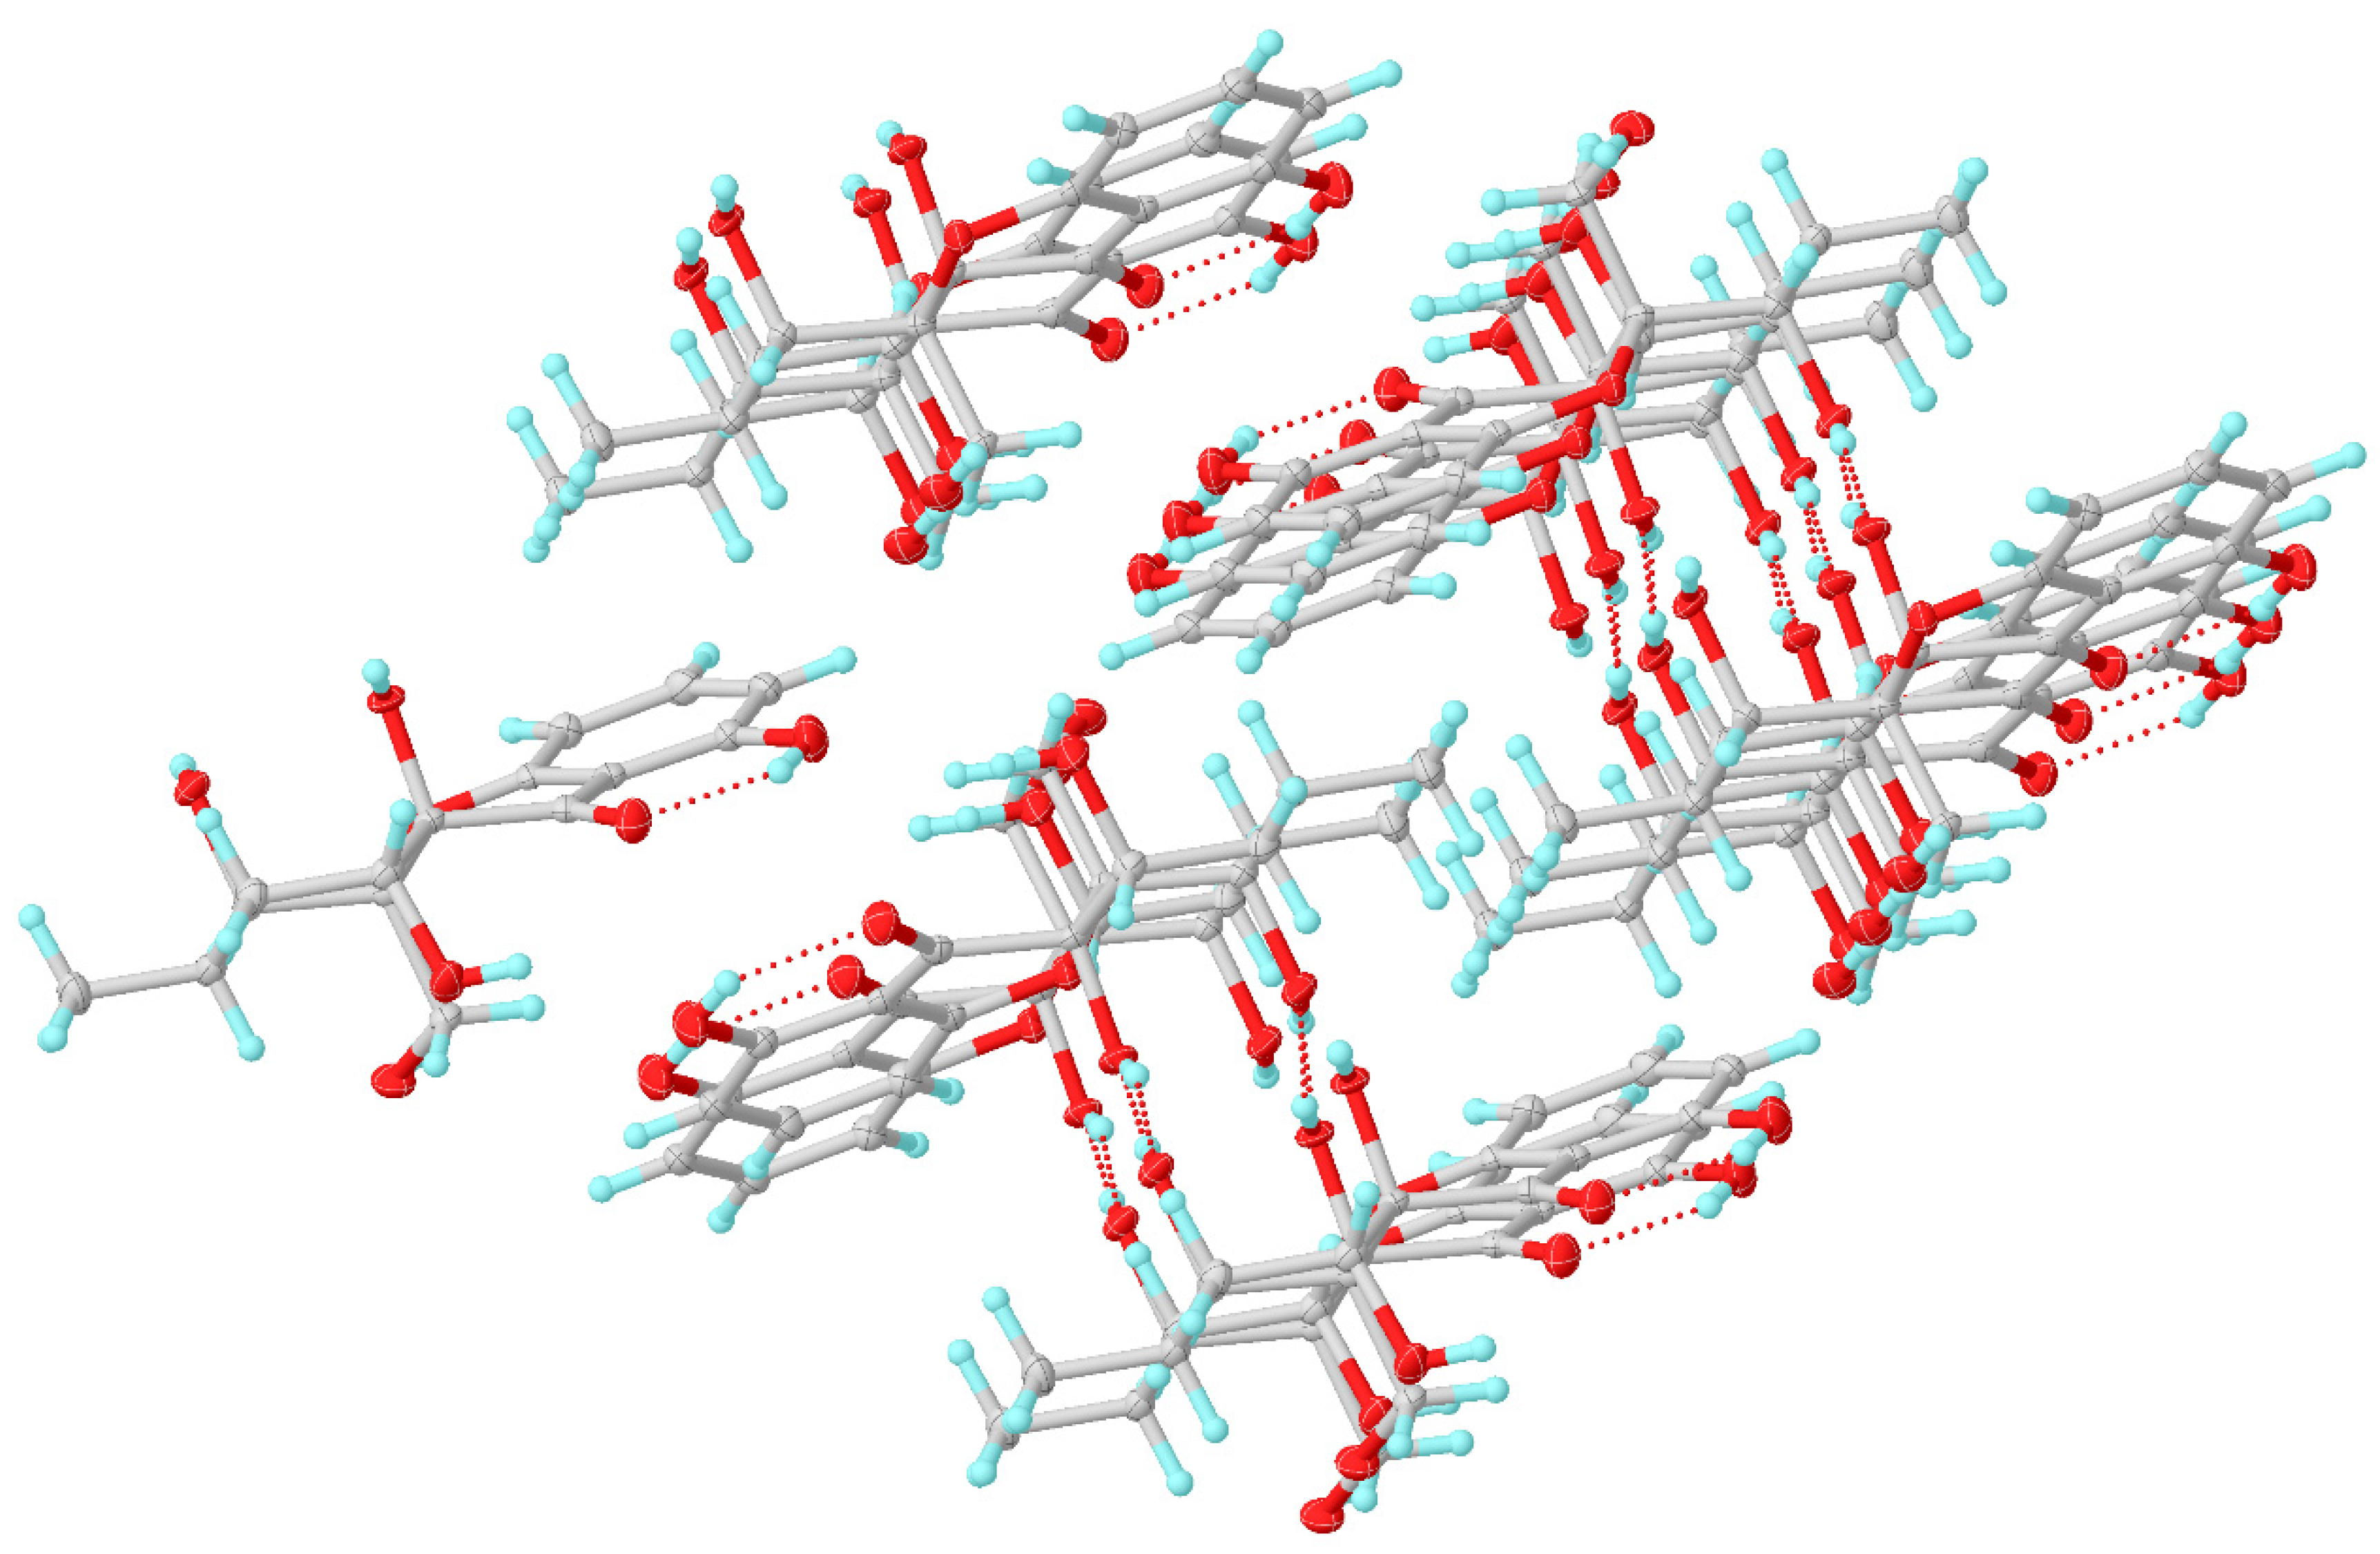
7) with the triclinic space group. It suggested that compound
7 should be an enantiomer in the solid crystals (
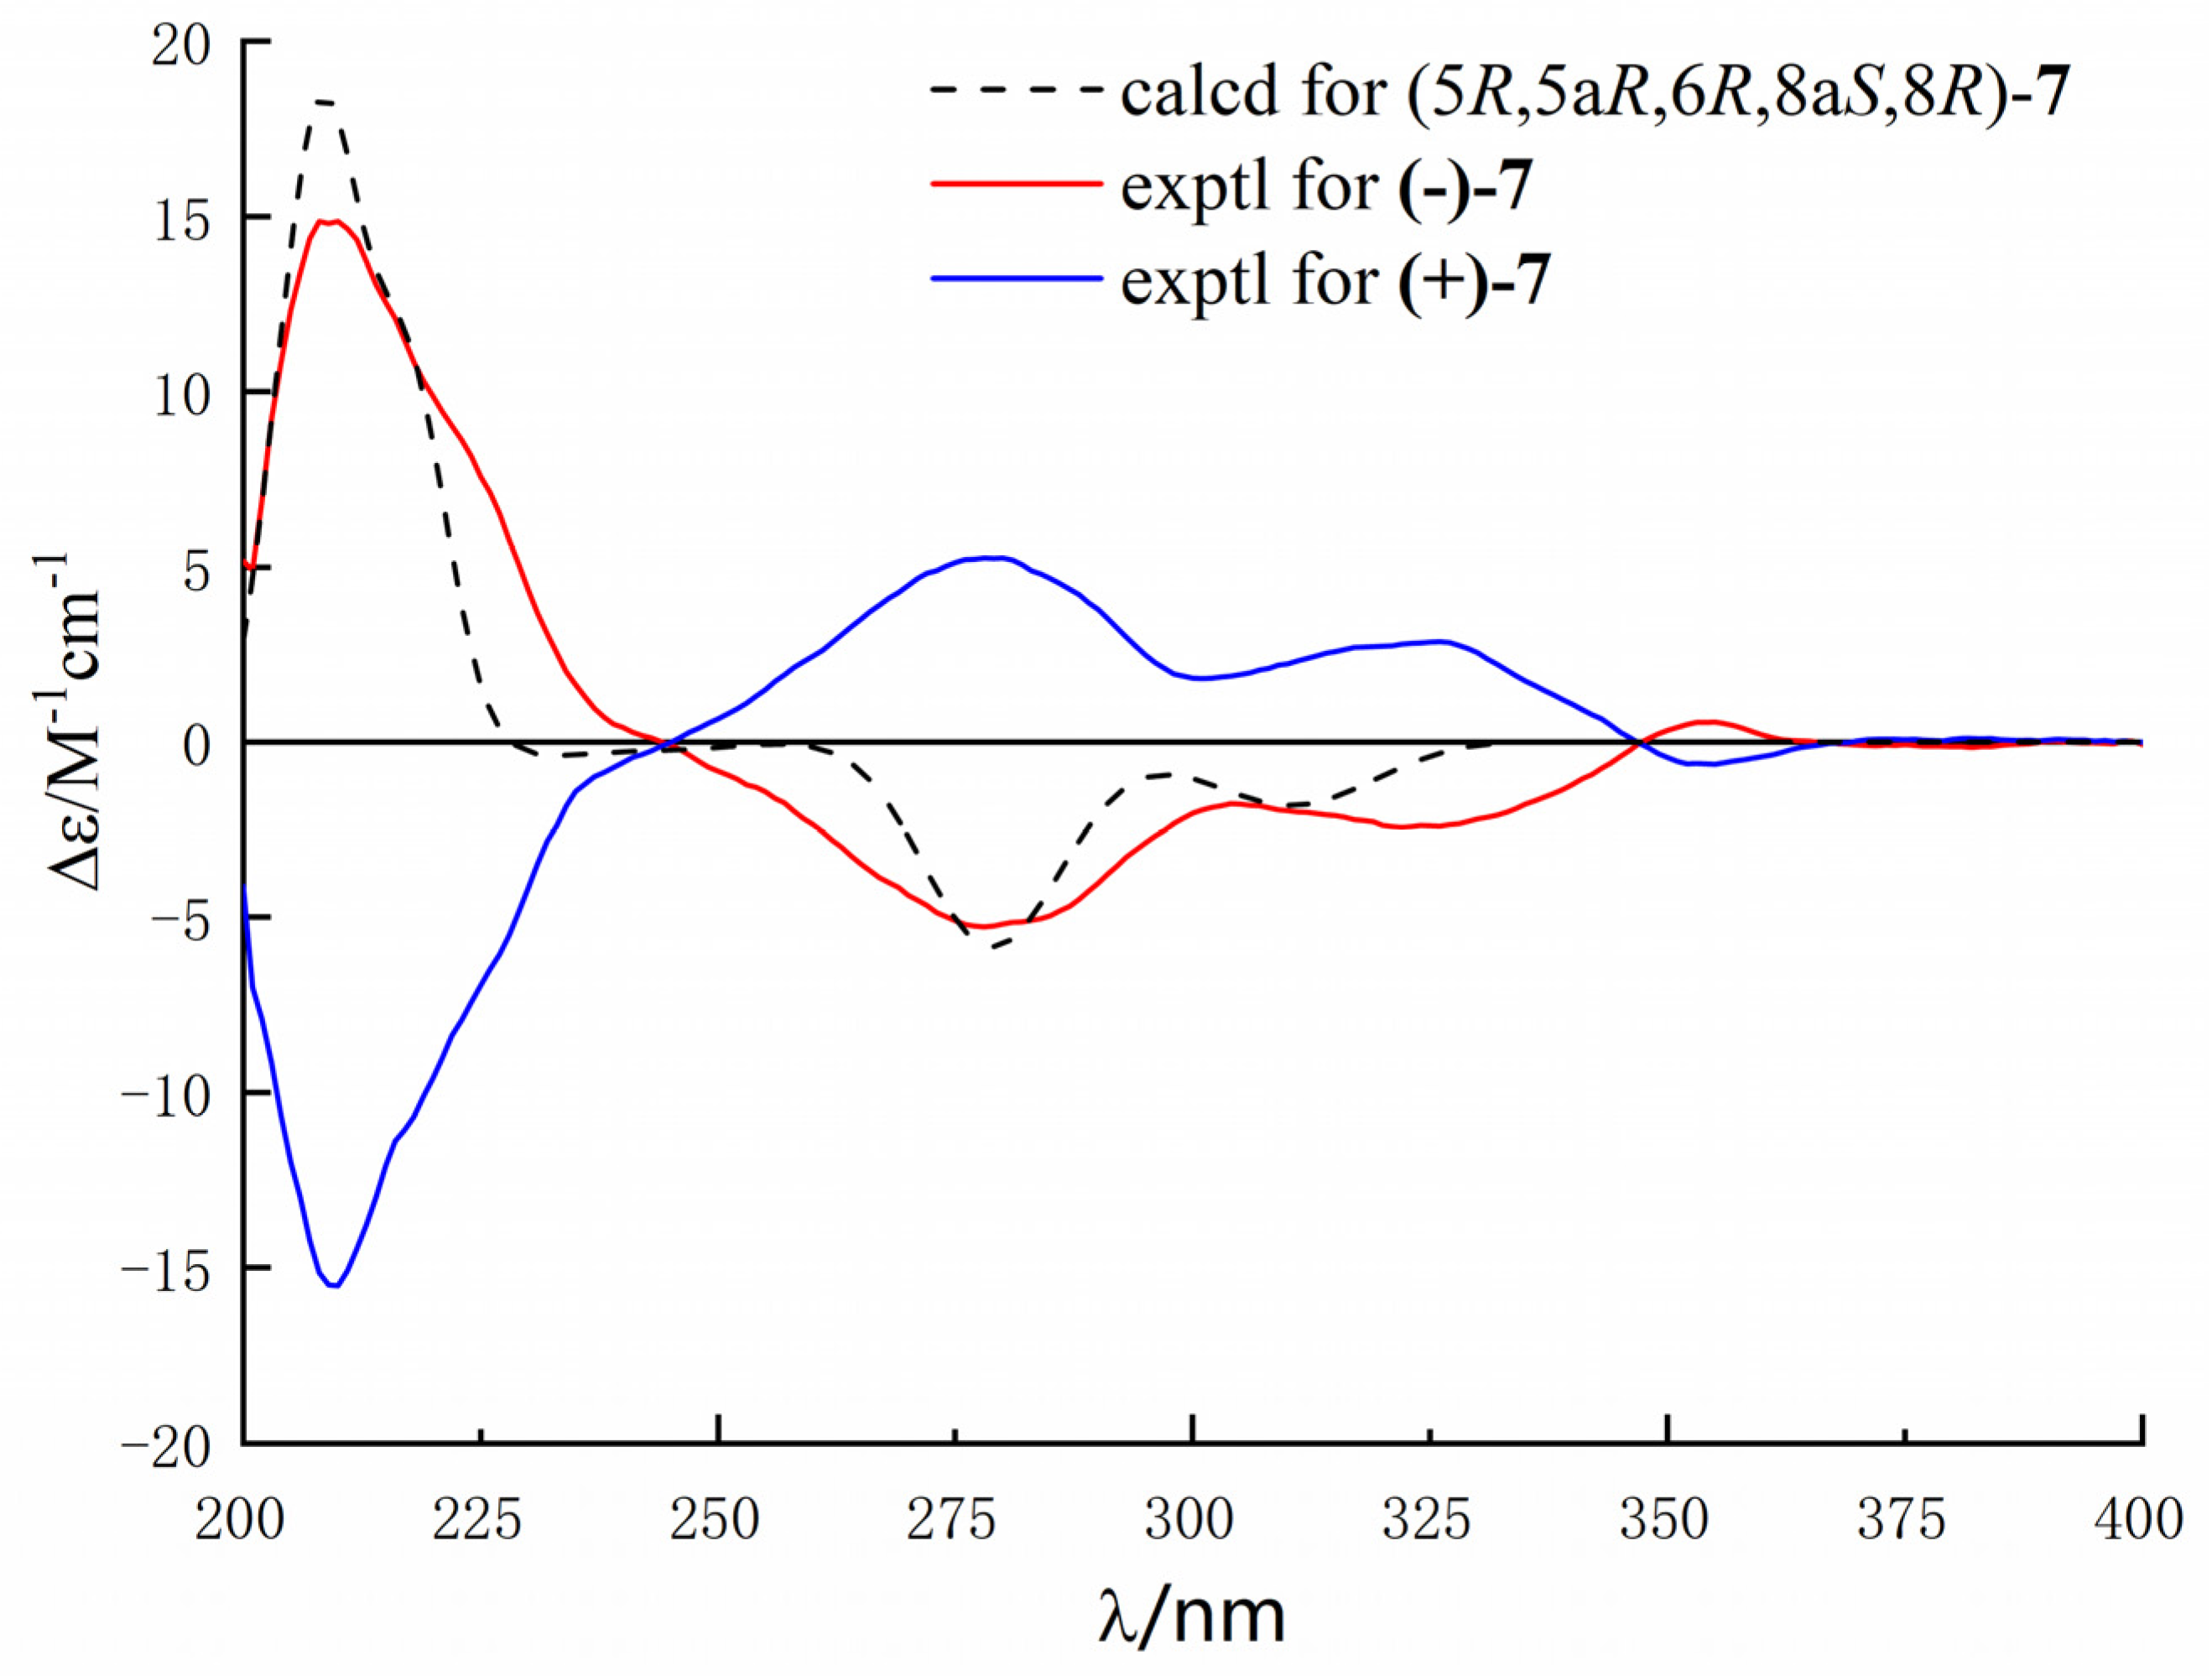
Figure 8), which showed an excellent fit with the result of no signal of CD spectrum and no optical activity sign in methanol. Subsequently, the chiral HPLC was used for purification of (±)-
7, and the two enantiomers, (+)-
7 (
tR = 28.7 min) and (−)-
7 (
tR = 31.5 min) were purified, respectively, and showed opposite Cotton effects in their CD spectra and opposite optical rotations (
Figure 9). The calculated ECD curve of (5
R, 5a
R, 6
R, 8a
S, 8
R)-
7 was comparable to the experimental one of (−)-
7, resulting in that the absolute configuration of (−)-
7 was 5
R, 5a
R, 6
R, 8a
S, 8
R. Compounds
2 and (±)-
7 were epimers derived from the same precursor, chrysophanol, and a possible biogenetic pathway for
2 and (±)-
7 was proposed, as shown in
Figure S62 (supplementary mateial). Compounds
2,
3, and (+)-
7 showed a very similar ECD spectrum with a strong and negative Cotton effect (CE) at 209 nm and two negative CEs at approximately 281 and 326 nm (
Figure S63, Supplementary Material), while (−)-
7 revealed opposite Cotton effects. The negative Cotton effect (CE) at 209 nm should be derived from the n−π* transition of the chromone chromophore with the absolute configuration of 5a
S and 8a
R.
The other known compounds were identified as phaseolorin D (+)-(
7) [
19], Phomoxanthone G (
8) [
20], penexanthone B (
9) [
21], phaseolorin E (
10) [
19], phomoxanthone F (
11) [
20], penimethavone A(
12) [
22], monodictyxanthone (
13) [
23], methyl 6,8-dihydroxy-3-methyl-9-oxo-9
H-xanthene-1-carboxylate (
14) [
24], 12-deacetylphomoxanthone A (
15) [
25], phomoxanthone A (
16) [
26], dicerandrol B (
17) [
27], dicerandrol C (
18) [
27], phomoxanthone B (
19) [
26] and deacetylphomoxanthone B (
20) [
28] by comparing their spectroscopic data with those reported in the literature.
All isolates were evaluated for anti-glioma using T98G, U87MG, and U251 human cell lines with temozolomide as the positive control. Only dimeric xanthones (
15−
20) exhibited promising growth-inhibitory effects on the T98G cell line with IC
50 values between 19.5 to 78.0 μM (
Table 4). Additionally, all monomeric xanthones (
1−
14) displayed weak or no cytotoxicity against T98G, U87MG, and U251 human cell lines. The result suggested that the dimeric skeleton of xanthones played an important role in anti-glioma activity.
All compounds (
1−
20) were also tested for the inhibition of nitric oxide (NO) production in RAW264.7 cells activated by lipopolysaccharide. Compounds
15−
20 showed strong inhibition of NO with IC
50 values between 6.3 and 8.0 μM, compared to the positive control indomethacin, whose IC
50 value was 35.8 μM (
Table 4). Compounds
11 and
14 exhibited considerable anti-inflammatory activity with IC
50 values of 41.4 and 32.2 μM, respectively. However, the other compounds do not have effects on anti-inflammatory activity (IC
50 > 50 μM).
3. Materials and Methods
3.1. General Experimental Procedures
Optical rotations were recorded on an MCP-200 polarimeter (Anton Paar, Graz, Austria) with MeOH as solvent at 25 °C. UV spectra were measured on a Blue Star A spectrophotometer. IR data were carried out on a Fourier transformation infrared spectrometer coupled with an EQUINOX 55 infrared microscope (Bruker, Rheinstetten, Germany). A Bruker Avance 400 MHz spectrometer (Bruker, Karlsruhe, Germany) was used for 1D and 2D NMR spectra test with TMS as an internal standard. ESIMS and HRESIMS data were measured on an ACQUITY QDA (Waters Corporation, Milford, MA, USA) and an LTQ-Orbitrap LC-MS spectrometer (Thermo Corporation, Waltham, MA, USA), respectively. A Shimadzu Essentia LC-16 was used for HPLC preparative separations by a Welch-Ultimate XB-C18 column (250 × 21.2 mm, 5 μM, 12 nm, Welch Materials, Inc., Shanghai, China) an ACE-5-C18-AR, ACE-5-CN-ES and ACE-C18-PFP column (250 × 10 mm, 5 μM, 12 nm, FLM Advanced Chromatography Technologies Ltd., Guangzhou, China). Column chromatography (CC) was performed on silica gel (200−300 mesh, Qingdao Marine Chemical Inc., Qingdao, China) and Sephadex LH-20 (Amersham Biosciences, Uppsala, Sweden).
3.2. Fungal Material
The experimental strain SYSU-MS4722 was isolated from the ascidian
Styela plicata that was obtained by Professor Lan Liu from the Bay of Da’ao, Shenzhen City, Guangdong, Province, China, in April 2016. The standard protocol [
29] was used for the isolation of fungus. The molecular biological protocol that included DNA amplification and sequencing of the ITS region was used for fungal identification. The sequence data of the fungal strain have been deposited at GenBank with accession no. OK623372. A BLAST search result suggested that the sequence was most similar (100%) to the sequence of
Diaporthe sp. NFIF-2-6 (compared to MW202988.1).
3.3. Extraction and Isolation
The strain Diaporthe sp. SYSU-MS4722 was fermented on a solid medium in a 1 L culture flask (containing 50 g of rice and 50 mL of H2O with 3% sea salt) with a total of 120 flasks incubating at room temperature for 30 days. The solid fermentation was extracted with MeOH four times to afford a crude extract, and then the crude was dissolved in H2O and continuously was extracted four times with EtOAc. The EtOAc extract (42 g) was subjected to a silica gel column eluting with gradient petroleum ether/EtOAc (from 8:2 to 0:1) to obtain six fractions (A–F).
Fr.A was fractionated on a Sephadex LH-20 column with MeOH/CH2Cl2 (50:50) to afford three fractions (Fr.A.1 to Fr.A.3). Fr.A.3 was further purified by RP-HPLC (MeOH/H2O, 80:20 flow rate 2 mL/min, ACE-C18-PFP column 10 × 250 mm, 5 μM) to give 5 (5.0 mg) and 9 (11.0 mg). Fr.B was fractionated on a Sephadex LH-20 column with CH2Cl2/MeOH to provide four subfractions (Fr.B.1 to Fr.B.4). Fr.B.1 was further subjected to silica gel chromatography eluting with CH2Cl2/MeOH (99:1) to afford 11 (2.0 mg). Fr.B.2 was further purified by silica gel chromatography and RP-HPLC (MeOH/H2O, 75:25 flow rate 2 mL/min, ACE-C18-PFP column 10 × 250 mm, 5 μM) to obtain 13 (6.0 mg), 16 (2.0 mg), and 19 (3.0 mg). Fr.B.3 was further fractionated on a silica gel column and RP-HPLC to give 18 (14.0 mg) and 20 (12.0 mg). Fr.B.4 was subjected to a silica gel column with CH2Cl2/MeOH (98:2) and then purified by RP-HPLC with MeOH/H2O (70:30) to give 1 (2 mg), 15 (5.0 mg), and 17 (7.0 mg). Fr.C was applied to a silica gel column eluting with CH2Cl2/MeOH (97:3) to afford five fractions (Fr.C.4.1 to Fr.C.4.5). Fr.C.4.2 was further purified by silica gel column to give 4 (8.0 mg). Fr.C.4.4 was subjected to silica gel chromatography to afford 8 (9.1 mg) and subfraction (Fr.C.4.4.2). Fr.C.4.4.2 was further purified by RP-HPLC (MeOH/H2O, 65:35 flow rate 2 mL/min, ACE-C18-PFP column 10 × 250 mm, 5 μM) to give 2 (5.0 mg, tR = 11.2 min), 7 (2.0 mg, tR = 12.1 min), and 10 (11.0 mg, tR = 14.0). Fr.C.4.5 was further fractionated on a silica gel column and RP-HPLC to afford 3 (4.0 mg), 12 (10.0 mg), and 14 (9.0 mg).
Compound 1: C15H16O6; Yellow crystal; [α]20D (c 0.01, MeOH) +41.2; UV (MeOH) λmax (log ε) 270 (3.91) nm; CD (MeOH) λmax (Δε) 212 (−2.66), 243 (+1.49) nm; IR (neat) vmax 3458, 2976, 1786, 1653, 1468, 1234, 1065 cm−1; HR-ESIMS m/z 291.0869 [M − H]− (calculated for C15H15O6, 291.0874).
Compound 2: C15H18O7; Colorless crystal; [α]20D (c 0.01, MeOH) +38.6; UV (MeOH) λmax (log ε) 208 (4.10), 277 (3.85) nm; CD (MeOH) λmax (Δε) 209 (−28.85), 281 (+10.75), 326 (+6.41) nm; IR (neat) vmax 3446, 2952, 1633, 1610, 1456, 1225, 1028 cm−1; HR-ESIMS m/z 309.0976 [M − H]− (calculated for C15H17O7, 309.0980).
Compound 3: C15H16O7; Colorless crystal; [α]20D (c 0.02, MeOH) +32.4; UV (MeOH) λmax (log ε) 205 (4.03), 278 (3.87) nm; CD (MeOH) λmax (Δε) 212 (−17.55), 282 (+9.36), 323 (+2.89) nm; IR (neat) vmax 3402, 2962, 1641, 1583, 1468, 1213, 1043 cm−1; HR-ESIMS m/z 307.0820 [M − H]− (calculated for C15H15O7, 307.0823).
Compound 4: C15H18O6; Colorless powder; [α]20D (c 0.02, MeOH) +13.4; UV (MeOH) λmax (log ε) 207 (4.20), 276 (3.52) nm; CD (MeOH) λmax (Δε) 202 (+24.71), 219 (+12.97) nm; IR (neat) vmax 3454, 2970, 1722, 1643, 1456, 1363, 1232, 1045 cm−1; HR-ESIMS m/z 295.1169 [M + H]+ (calculated for C15H19O6, 295.1176).
Compound 5: C17H18O7; Colorless powder; [α]20D (c 0.01, MeOH) +9.2; UV (MeOH) λmax (log ε) 224 (3.75), 254(3.50) nm; CD (MeOH) λmax (Δε) 243 (+0.44), 235 (+1.32) nm; IR (neat) vmax 3438, 2935, 2871, 1745, 1616, 1468, 1238, 1055 cm−1; HR-ESIMS m/z 333.0975 [M-H]− (calculated for C17H17O7, 333.0980).
Compound 6: C15H16O7; Colorless crystal; [α]20D (c 0.02, MeOH) −175; UV (MeOH) λmax (log ε) 208 (4.05), 278(3.78), 356 (3.30) nm; IR (neat) vmax 3367, 1630, 1459, 1222, 1033, 813 cm−1; HR-ESIMS m/z 307.08278 [M − H]− (calculated for C15H15O7, 307.08233).
Compound 7: C15H18O7; Colorless crystal; UV (MeOH) λmax (log ε) 209 (4.15), 279(3.78), 353 (3.30) nm; IR (neat) vmax 3499, 3289, 2936, 1648, 1629, 1461, 1224, 1022, 811, 694 cm−1; HR-ESIMS m/z 309.0978 [M − H]− (calculated for C15H19O7, 309.0979).
(+)-(7): [α]20D (c 0.0035, MeOH) +73.4; ECD (MeOH) λmax (∆ε): 209 (−16.8), 279 (+5.6), 327 (+2.8) nm.
(−)-(7): [α]20D (c 0.0011, MeOH) −79.2; ECD (MeOH) λmax (∆ε): 209 (+15.4), 279 (−5.1), 327 (+2.5) nm.
3.4. X-ray Crystallographic Analysis
The crystals of compounds
1,
2,
6, and
7 were obtained on the base of the vapor diffusion method. All single-crystal X-ray diffraction data were collected on a Rigaku Oxford diffractometer with Cu-Kα radiation (λ = 1.54178 A). The structures were solved by direct methods using SHELXS-97 and refined full-matrix least-squares difference Fourier techniques using Olex2-1.2. All hydrogen atoms bonded to carbons were added at the geometrically ideal positions by the “ride on” method. All crystallographic data of
1,
2,
6, and
7 have been deposited with the Cambridge Crystallographic Data Centre. Copies of the data can be obtained, free of charge, on application to the Director, CCDC, 12 Union Road, Cambridge CB2 1EZ, UK (fax: 44-(0)1223-336033, or e-mail:
deposit@ccdc.cam.ac.uk).
Compound 1: C15H16O6 (Mr = 291.09 g/mol), orthorhombic, space group P212121, a = 5.4585(4) Å, b = 11.5804(10) Å, c = 22.0066(14) Å, α = 90°, β = 90°, γ = 90°,V = 1391.07(18) Å3, Z = 4, T = 249.99(10) K, µ(Cu Kα) = 0.915 mm−1, Dcalc = 1.3955 g/cm3, 5334 reflections measured, 2742 unique (Rint = 0.0538, Rsigma = 0.0628), which were used in all calculations. The final R1 was 0.0557 (I > = 2u(I)) and wR2 was 0.1503. The Flack parameter was 0.0(3), and the Hooft parameter was -0.2(3). Goodness of fit on F2 was 1.048. CCDC 2116967.
Compound 2: C15H18O7 (Mr = 310.31 g/mol), monoclinic, space group P21, a = 10.1547(4) Å, b = 7.1459(2) Å, c = 10.3653(4) Å, α = 90°, β = 116.414(4)°, γ = 90°, V = 673.63(5) Å3, Z = 2, Crystal size 0.35 × 0.3 × 0.25 mm3, T = 150.00(10) K, µ(Cu Kα) = 1.036 mm−1, Dcalc = 1.530 g/cm3, 4665 reflections measured, 2621 unique (Rint = 0.0268, Rsigma = 0.0298), which were used in all calculations. The final R1 was 0.0359 (I > = 2u(I)) and wR2 was 0.0986. The Flack parameter was −0.01(14), and the Hooft parameter was 0.06(7). Goodness of fit on F2 was 1.044. CCDC 2116970.
Compound 6: C15H16O7 (Mr = 308.29 g/mol): monoclinic, space group P21, a = 8.0807(2) Å, b = 10.5548(2) Å, c = 8.3669(2) Å, α = 90°, β = 93.743(2)°, γ = 90°, V = 712.09(3) Å3, Z = 2, Crystal size 0.25 × 0.2 × 0.02 mm3, T = 149.98(10) K, µ(CuKα) = 0.055 mm−1, Dcalc = 0.068 g/cm3, 6306 reflections measured, 2765 unique (Rint = 0.0384, Rsigma = 0.0323), which were used in all calculations. The final R1 was 0.0402 (I > 2σ(I)) and wR2 was 0.1178. The Flack parameter was 0.13(15), and the Hooft parameter was 0.16(9). Goodness of fit on F2 was 1.069. CCDC 2116974.
Compound 7: C15H18O7 (Mr = 310.30 g/mol): monoclinic, space group P21/c, a = 11.3702(3) Å, b = 7.30602(17) Å, c = 16.9135(5) Å, α = 90°, β = 108.413(3)°, γ = 90°, V = 1333.09(7) Å3, Z = 4, Crystal size 0.3 × 0.25 × 0.08 mm3, T = 150.00(10) K, µ(Cu Kα) = 1.047 mm−1, Dcalc = 1.5460 g/cm3, 3935 reflections measured, 2546 unique (Rint = 0.0295, Rsigma = 0.0370), which were used in all calculations. The final R1 was 0.0520 (I > = 2u(I)) and ωR2 was 0.1591. Goodness of fit on F2 was 1.058. CCDC 2116976.
3.5. Calculation of the ECD Spectra
Merck molecular force field (MMFF) and DFT/TD-DFT calculations were carried out with the Spartan’14 software package (Wavefunction Inc., Irvine, CA, USA) and the Gaussian 09 program, respectively. MMFF conformational search generated low-energy conformers within a 10 kcal·mol−1 energy window and optimized using PM6 semi-empirical optimizations. Then, each conformer was optimized with HF/6-31G(d) method in Gaussian09. Further optimization was performed at the b3lyp/6-311g** level. The frequency was calculated at the same level to confirm each optimized conformer with the true minimum and to estimate their relative thermal free energies (ΔG) at 298.15 K. The optimized conformers were continually used for the ECD calculations in methanol, which were carried out with Gaussian09 (b3lyp/6-311g**). Solvent effects were taken into account by using the polarizable continuum model (PCM). The ECD data were generated by the program SpecDis using a Gaussian band shape with 0.30 eV exponential half-width from dipole-length dipolar and rotational strengths, and the final ECD spectrum was drawn by Origin 2018. All calculations were performed by Tianhe-2 of the National Super Computer Center in Guangzhou.
3.6. Anti-Glioma Activity
The human glioma cell lines, T98G, U87MG, and U251, were purchased from the Cell Bank of the Chinese Academy of Sciences. Cells were cultured in Dulbecco’s Modified Eagle’s Medium (DMEM, Gibco, Carlsbad, CA, USA), containing 10% fetal bovine serum (FBS), 100 IU/mL penicillin, 100 µg/mL streptomycin (all from Gibco, Carlsbad, CA, USA) in a cell incubator with 5% CO2 at 37 °C.
Cell proliferation was analyzed by MTT according to the manufacturer’s instructions. Briefly, T98G, U87MG, and U251 were digested and seeded at 1 × 10³ cells/well in 96-well plates and cultured in 100 µL medium overnight. The cells were treated by tested compounds with gradient concentrations for 48 h. At each indicated time point, MTT solution (10 µL/well) was added and then incubated at 37 °C for 2 h. The optical density (OD) at 450 nm was recorded by a microplate reader (Multiskan GO, Thermo Scientific, Waltham, MA, USA). Each experiment was performed three times.
3.7. Anti-Inflammatory Activity
RAW 264.7 cells were seeded in 96-well plates at a density of 5 × 10⁵ cells/mL. After 12 h, the cells were treated with 1 µg/mL of LPS and tested samples, followed by additional incubation for 24 h at 37 °C. MTT stock solution (2 mg/mL) was added to wells for a total reaction volume of 100 µL. After 4 h incubation, the supernatants were aspirated. The formazan crystals in each well were dissolved in DMSO (100 µL), and the absorbance was measured with the wavelength of 490 nm by a microplate reader (Multiskan GO, Thermo Scientific). The data were expressed as mean percentages of the viable cells compared to the respective control. After pre-incubation of RAW 264.7 cells (1.5 × 10⁵ cells/mL) with 1 µg/mL LPS and samples at 37 °C for 24 h, the quantity of nitrite accumulated in the culture medium was measured as an indicator of NO production. Briefly, cell culture medium (50 µL) was added with Griess reagent (100 µL) and incubated at room temperature for 10 min. The absorbance was measured by a microplate reader (Multiskan GO, Thermo Scientific, Waltham, MA, USA) at 540 nm wavelength.


 ,
, 


