Article

LC-ESI-QTOF-MS/MS Characterization of Seaweed Phenolics and Their Antioxidant Potential

1
School of Agriculture and Food, Faculty of Veterinary and Agricultural Sciences, The University of Melbourne, Parkville, VIC 3010, Australia
2
Sustainable Aquaculture Laboratory-Temperate and Tropical (SALTT), School of BioSciences, The University of Melbourne, Parkville, VIC 3010, Australia
3
Norwegian Institute of Food, Fisheries and Aquaculture Research (Nofima), NO-1431 Ås, Norway
4
Centre for Chemistry and Biotechnology, School of Life and Environmental Sciences, Deakin University, Waurn Ponds, VIC 3217, Australia
*
Author to whom correspondence should be addressed.
Mar. Drugs 2020, 18(6), 331; https://doi.org/10.3390/md18060331
Submission received: 9 May 2020 / Revised: 19 June 2020 / Accepted: 21 June 2020 / Published: 24 June 2020

Abstract

:
Seaweed is an important food widely consumed in Asian countries. Seaweed has a diverse array of bioactive compounds, including dietary fiber, carbohydrate, protein, fatty acid, minerals and polyphenols, which contribute to the health benefits and commercial value of seaweed. Nevertheless, detailed information on polyphenol content in seaweeds is still limited. Therefore, the present work aimed to investigate the phenolic compounds present in eight seaweeds [Chlorophyta (green), Ulva sp., Caulerpa sp. and Codium sp.; Rhodophyta (red), Dasya sp., Grateloupia sp. and Centroceras sp.; Ochrophyta (brown), Ecklonia sp., Sargassum sp.], using liquid chromatography electrospray ionization quadrupole time-of-flight mass spectrometry (LC-ESI-QTOF-MS/MS). The total phenolic content (TPC), total flavonoid content (TFC) and total tannin content (TTC) were determined. The antioxidant potential of seaweed was assessed using a 2,2-diphenyl-1-picrylhydrazyl (DPPH) free radical scavenging assay, a 2,2′-azino-bis-3-ethylbenzothiazoline-6-sulfonic acid (ABTS) free radical scavenging assay and a ferric reducing antioxidant power (FRAP) assay. Brown seaweed species showed the highest total polyphenol content, which correlated with the highest antioxidant potential. The LC-ESI-QTOF-MS/MS tentatively identified a total of 54 phenolic compounds present in the eight seaweeds. The largest number of phenolic compounds were present in Centroceras sp. followed by Ecklonia sp. and Caulerpa sp. Using high-performance liquid chromatography-photodiode array (HPLC-PDA) quantification, the most abundant phenolic compound was p-hydroxybenzoic acid, present in Ulva sp. at 846.083 ± 0.02 μg/g fresh weight. The results obtained indicate the importance of seaweed as a promising source of polyphenols with antioxidant properties, consistent with the health potential of seaweed in food, pharmaceutical and nutraceutical applications.

Graphical Abstract

1. Introduction

Seaweed has been utilized as a food for humans for centuries, and the current global market is valued at more than USD 6 billion per annum with an annual volume of approximately 12 million tonnes in 2018 [1,2]. Seaweeds (macroalgae) are classified into three major groups including Chlorophyta (green algae), Rhodophyta (red algae) and Ochrophyta (brown algae) based on their color. It is estimated that 1800 different green macroalgae, 6200 red macroalgae, and 1800 brown macroalgae are found in the marine environment [3]. Like plants, they have chlorophyll for photosynthesis but also contain other pigments which may be colored red, blue, brown or gold. Seaweeds are used in many countries as a source of food especially in East Asia, seaweeds are associated with different Japanese, Koreans and Chinese cuisines [4]. Seaweed is considered an excellent source of bioactive compounds with positive health effects, including carotenoids, phenolics, chitosan, gelatin, polyunsaturated fatty acids, various vitamins and minerals [5]. Recent interest in seaweed has focused on seaweed natural bioactive compounds in the functional food, pharmaceutical and cosmeceutical industries [6]. Among these bioactives, polyphenols, which are defined as the compounds containing one or more aromatic rings bearing hydroxyl groups, have attracted considerable attention [7]. Polyphenols have been shown to exhibit antioxidant, antimicrobial, antidiabetic, anti-inflammatory and anticancer properties in in vitro and in vivo studies [8], and are categorized into subclasses of phenolic acids, flavonoids, stilbenes, and lignans, depending on the chemical structure [9].
A promising bioactive property of polyphenols relates to their antioxidant activity and redox potential, allowing them to reduce the reactive oxygen species (ROS) that are involved in a range of human disorders [10]. Strong antioxidant properties of various edible seaweeds have been reported, particularly with seaweeds with high polyphenol content, which can be as high as 20–30% of the dry weight of some brown seaweeds [11,12]. Several phenolic compounds are abundant in a range of species of seaweed, including gallic acid, protocatechuic acid, caffeic acid and epicatechin, with these species showing potential as functional foods [13]. Antioxidants in food can exhibit their activity by donating hydrogen atoms, providing electrons and chelating free metals [14]. Antioxidant compounds have been successfully extracted from seaweeds and commercialized for their health benefits or for their ability to prolong the shelf-life of food through their antioxidant potential [15,16].
Total phenolic, flavonoid and tannin contents in seaweed can be indirectly measured using assays for total phenolic content (TPC), total flavonoid content (TFC) and total tannin (TTC), respectively. The antioxidant activities of seaweed can be quantified using various assays based on different mechanisms, including 2,2-diphenyl-1-picrylhydrazyl (DPPH) and 2,2′-azino-bis-3-ethylbenzothiazoline-6-sulfonic acid (ABTS) assays based on free-radical scavenged by antioxidant compounds, and ferric reducing of antioxidant power (FRAP) assay based on the reducing capacity of antioxidants [17]. However, TPC and other colorimetric methods neither separate, nor quantify, individual compounds. High-performance liquid chromatography coupled with electrospray ionization-quadrupole-time of flight-mass spectrometry (LC-ESI-QTOF-MS/MS) has been a standard method to isolate and characterize phenolic compounds based on their molecular weight [18]. High-performance liquid chromatography photodiode array (HPLC-PDA) has been used to quantify various bioactive compounds in seaweed extracts [19].
The objectives of the current study were: (1) to extract phenolic compounds from a range of seaweeds; (2) quantify the total phenolic and antioxidant capacities of seaweed extracts using different assays and (3) apply LC-ESI-QTOF-MS/MS and HPLC-PDA to characterize and quantify individual phenolic compounds.

2. Results and Discussion

2.1. Polyphenol Estimation (TPC, TFC and TTC)

The polyphenol content was measured as TPC, TFC and TTC (Table 1). Brown seaweed Ecklonia sp. showed significantly higher TPC (1044 ± 2.5 μg GAE/gf.w.) and TTC (167 ± 23.2 μg CE/gf.w.) contents than other seaweed (p < 0.05). The presence of higher total phenolics in brown seaweed Ecklonia sp. compared to green seaweed Ulva sp. and red seaweed Porphyra sp. was previously observed by García-Casal, et al. [20]. The significant higher total phenolic and tannin content in brown seaweed Ecklonia sp. is proposed to be related to the presence of phlorotannins, which are restricted to brown algae, in special vesicles (physodes) within the cells [21]. Phlorotannins are highly complex compounds formed by the polymerization of phloroglucinol, which has already been characterized by LC-MS in previous studies [22,23] and supported by our current study. The highest total flavonoid content was found in red seaweed Grateloupia sp. (54.4 ± 0.74 μg QE/gf.w.) (p < 0.05) as compared to brown and green seaweeds. However, compared to previous studies [24], the total flavonoid content of red seaweed we found was relatively low compared with that of brown and green seaweed. The inconsistency might be explained by Chan, et al. [25], who reported that the total flavonoid content of seaweeds is impacted by sunlight, climate, region and extraction solvent.
Regarding seaweed groups, brown seaweeds presented statistically higher TPC and TTC values than green and red seaweeds (p < 0.05). This is in agreement with previous research which reported that brown seaweed had a higher total phenolic content than red and green seaweeds [26]. In addition, a study conducted by Cox, Abu-Ghannam and Gupta [24] also indicated that the total tannin content of brown seaweeds was significantly higher than that of green and red seaweed, which is explained by the presence of the unique polyphenolic components of phlorotannin in brown seaweed [27].

2.2. Antioxidant Activities (ABTS, DPPH and FRAP)

The antioxidant activities were determined using ABTS, DPPH and FRAP assays (Table 2.). The brown seaweed Ecklonia sp. had a significantly higher level of antioxidant potential than other seaweeds (958 ± 0.4 μg AAE/gf.w. for ABTS, 510 ± 3.4 μg AAE/gf.w. for DPPH and 170 ± 2.0 μg AAE/gf.w. for FRAP, p < 0.05). The result was consistent with a previous study where phlorotannins were successfully isolated from Ecklonia sp. and exhibited strong DPPH radical scavenging activity [28]. In the present work, although Ulva sp., Caulerpa sp. and Codium sp. exhibited ABTS radical scavenging activities, no DPPH radical scavenging activities were detected. This might be due to limitations of the DPPH assay [29]. Firstly, unlike water-soluble ABTS+, hydrophobic DPPH must be performed in organic solvent, which interferes with the hydrogen atom transfer reaction by disturbing the release of hydrogen atoms. Secondly, DPPH reacts rapidly, mainly through single electron transfer, with ascorbic acid and simple phenols with no ring adducts, but slowly with complex phenolic compounds with side chains and ring adducts. Therefore, the application of organic solvent and the complex structure of phenolic compounds in seaweed might lead to underestimation of DPPH scavenging activities.
Within the seaweed groups, brown seaweed species presented significantly higher antioxidant properties for all assays than green and red seaweed species (p < 0.05). This result was in accordance with a previous study, which also found brown seaweed had higher ABTS radical scavenging activity than red or green seaweeds [30].
The relationship between TPC and antioxidant potential of all three type of (green, red and brown) seaweeds was confirmed by performing a regression model between the values of TPC and each antioxidant assay. Results showed a significant positive correlation between TPC and antioxidant activity (r2 = 0.926 for ABTS, r2 = 0.714 for DPPH and r2 = 0.899 for FRAP, p < 0.05). A positive correlation between total phenolic content and antioxidant assay results was also supported by previous studies, suggesting that phenolics are the major contributor to the excellent antioxidant properties of seaweeds [21,30].

2.3. LC-ESI-QTOF-MS/MS Characterization of The Phenolic Compounds

LC-MS has been widely used for the characterization of the phenolic profiles of different plant and marine samples [31]. A qualitative analysis of the phenolic compounds from different seaweed extracts were achieved by LC-ESI-QTOF-MS/MS analysis in negative and positive ionization modes (Table S1, Figures S1 and S2-Supplementary Materials). Phenolic compounds present in eight different seaweeds were tentatively identified from their m/z value and MS spectra in both negative and positive ionization modes ([M − H]/[M + H]+) using Agilent LC-MS Qualitative Software and Personal Compound Database and Library (PCDL). Compounds with mass error < ± 5 ppm and PCDL library score more than 80 were selected for further MS/MS identification and m/z characterization purposes.
In the present work, LC-MS/MS enabled the tentative identification of 54 phenolic compounds, including 22 phenolic acids, 17 flavonoids, 11 other polyphenols and 4 lignans (Table 3).

2.3.1. Phenolic Acids

Phenolic acids have been reported as the most abundant phenolic compounds in red, green and brown algae [21]. In the present work, four sub-classes of phenolic acid were detected, including hydroxybenzoic acids, hydroxycinnamic acids, hydroxyphenylpentanoic acids and hydroxyphenylacetic acids.

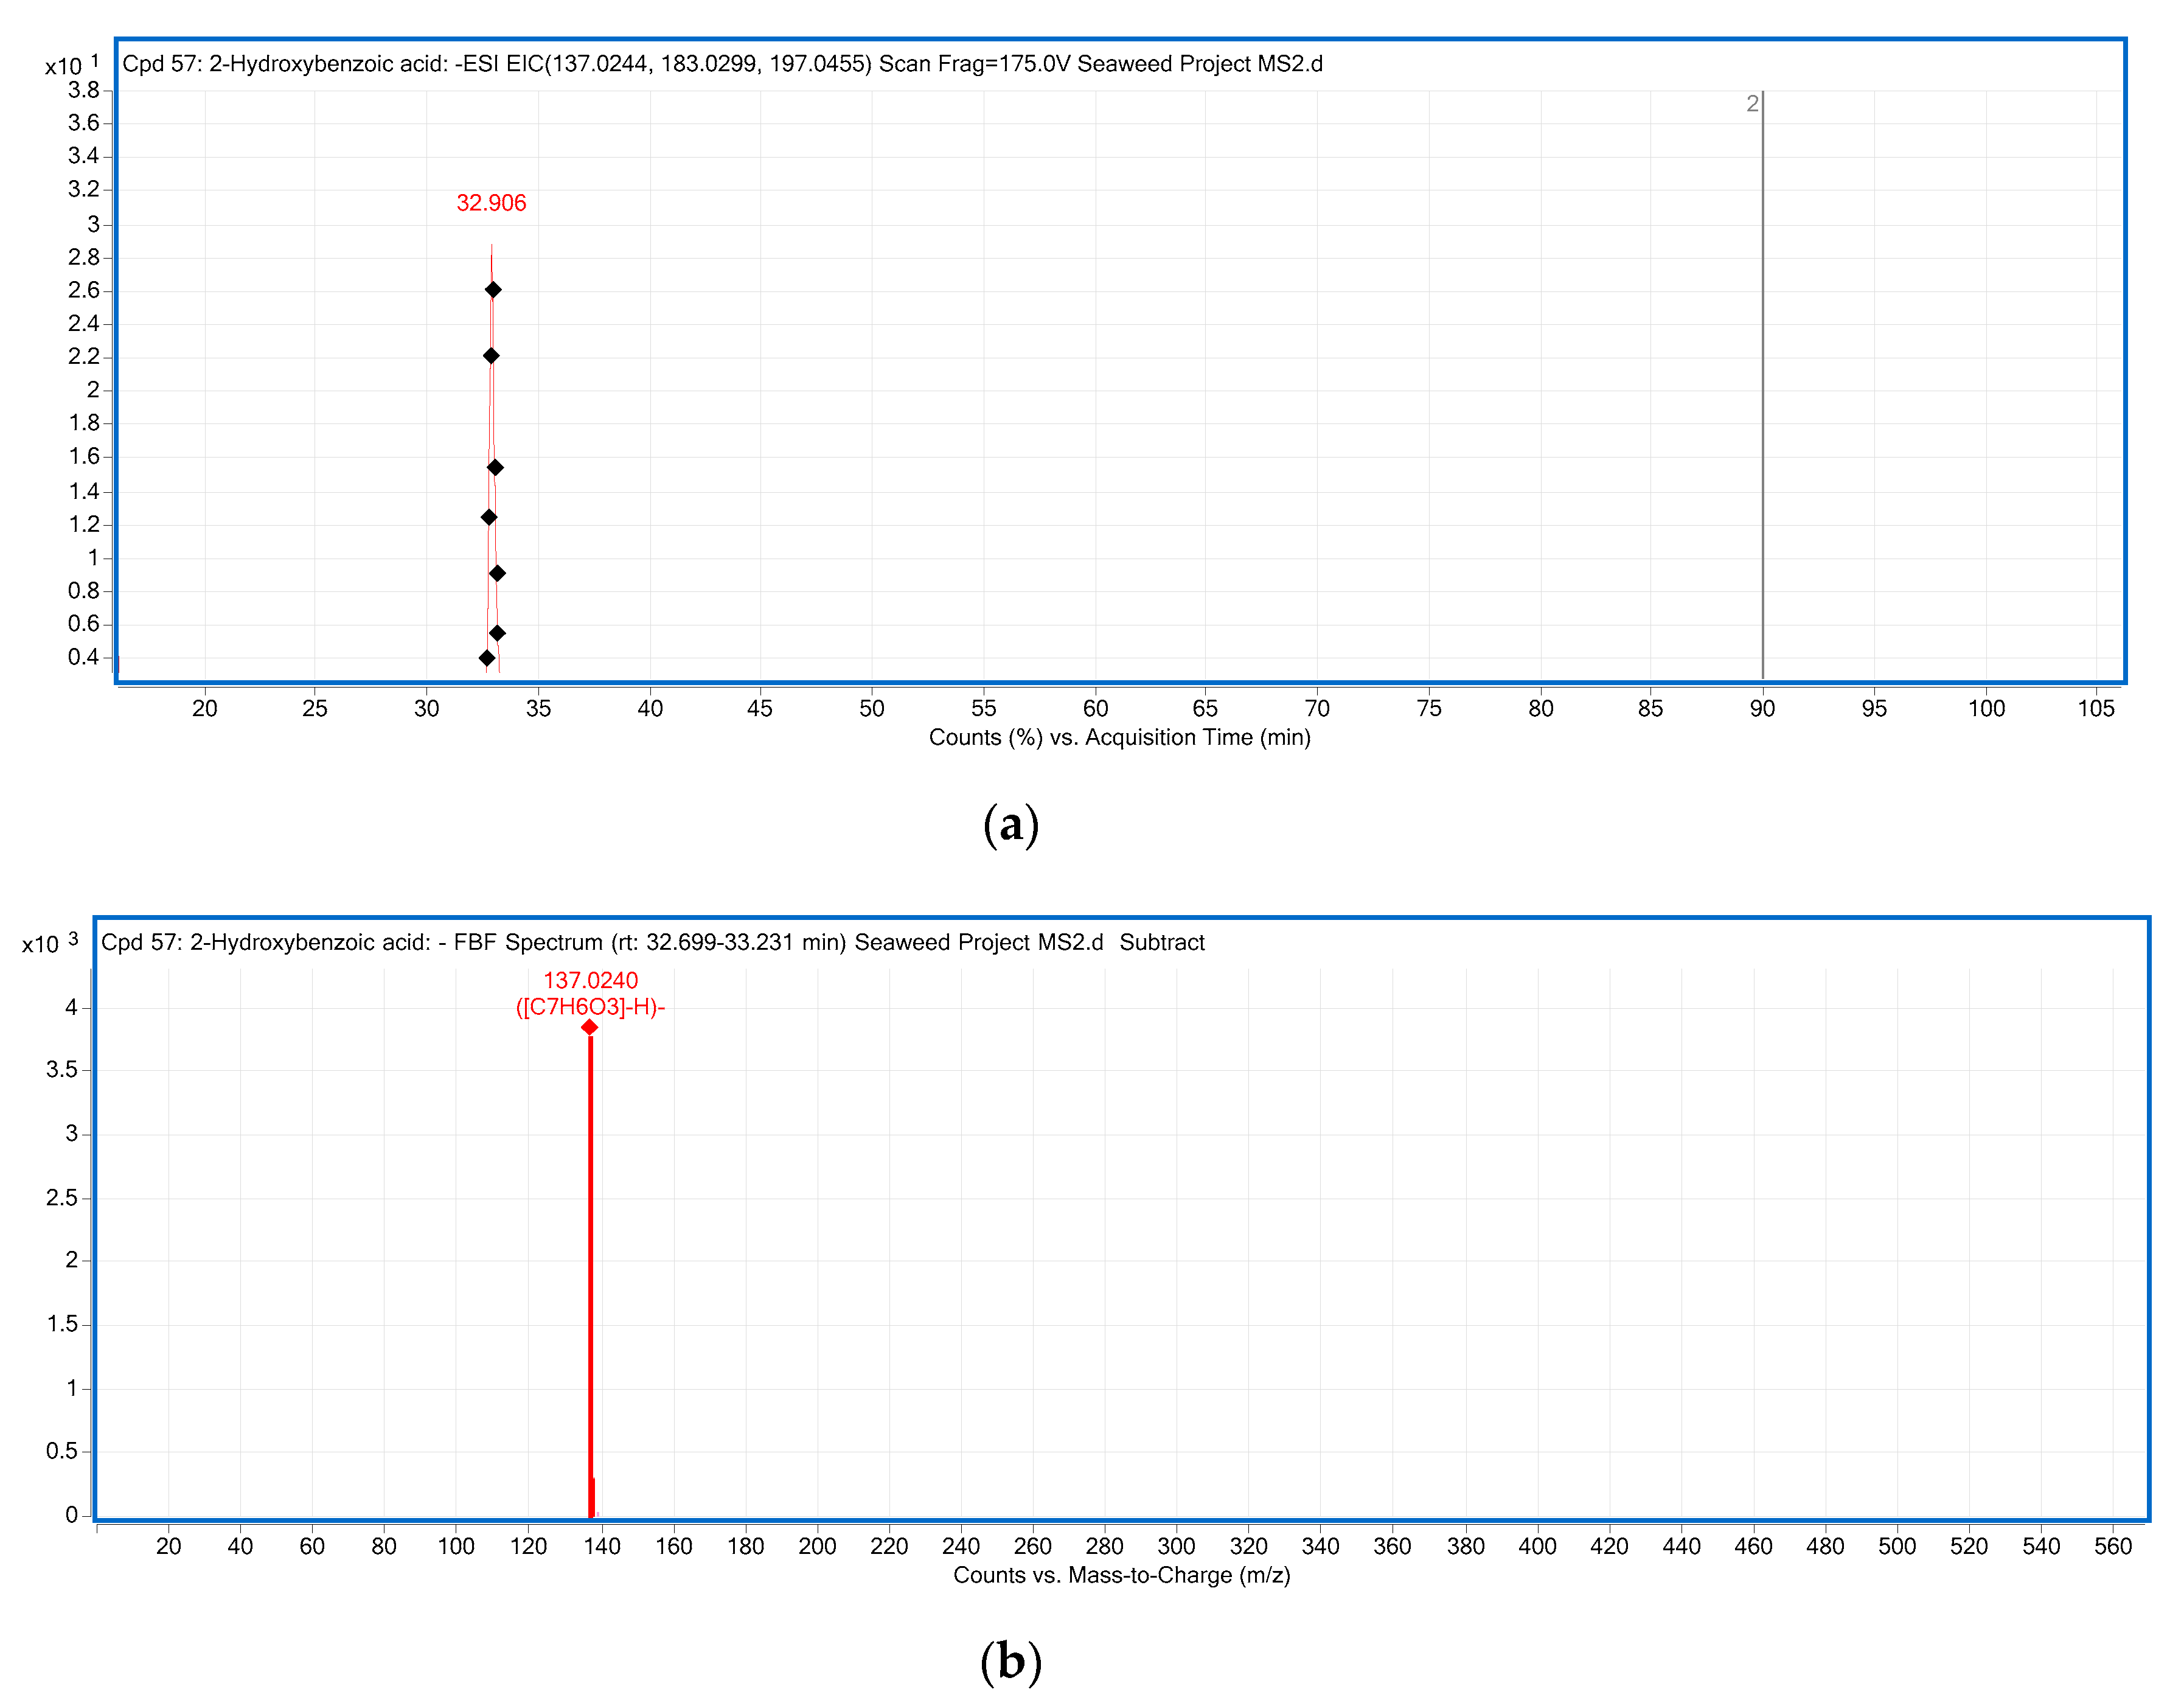
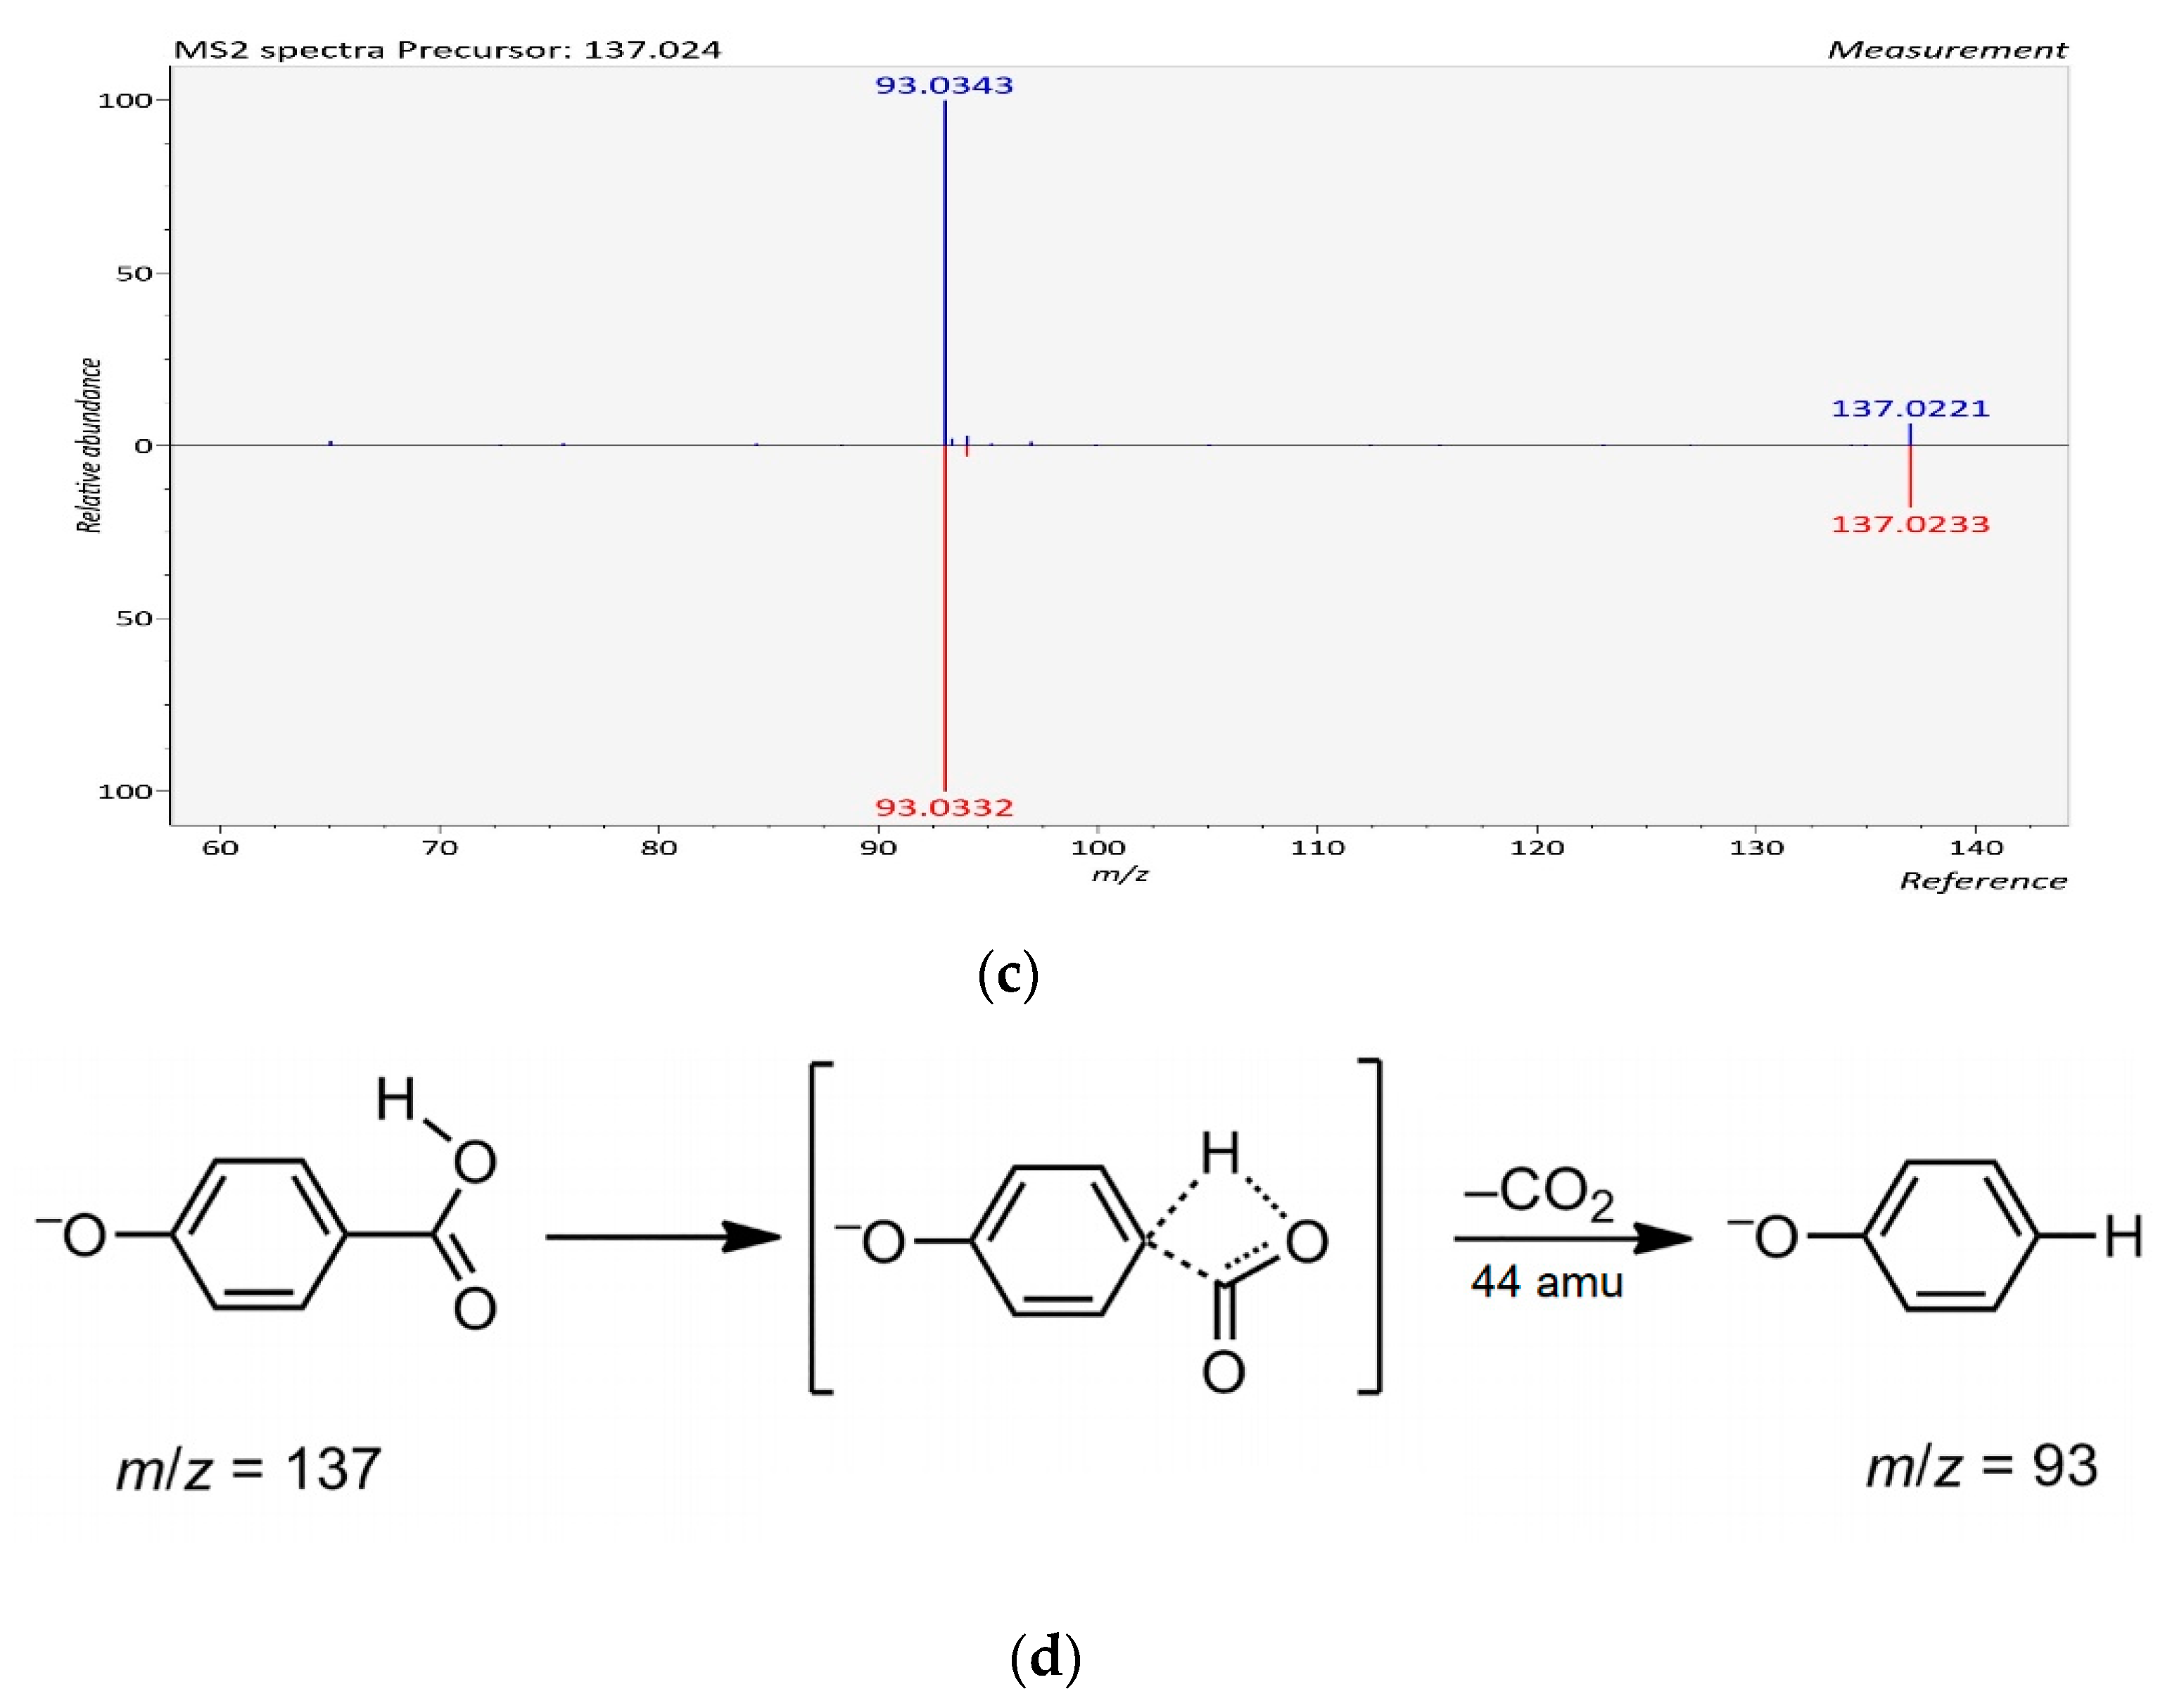
Hydroxybenzoic Acids Derivatives

Six hydroxybenzoic acid derivatives were detected in six out of eight seaweeds. The typical neutral losses of CO2 (44 Da) and hexosyl moiety (162 Da) were observed in phenolic acids [32]. Compound 2 with [M − H] m/z at 169.0138 was only detected from red seaweed Centroceras sp., and characterized as gallic acid based on the product ion at 125 m/z, corresponding to the loss of CO2 (44 Da) from precursor ion [32]. Gallic acid was also previously reported as abundant in the brown seaweed Himanthalia elongate [33]. p-Hydroxybenzoic acid (Compound 5 with [M − H] ion at m/z 137.0240) present in Ulva sp., Caulerpa sp. and Centroceras sp. was identified and confirmed by MS2 experiments (Figure 1). In the MS2 spectrum of m/z 137.0240, the product ion at m/z 93 was due to the loss of a CO2 (44 Da) from the parent ion [32]. This is consistent with p-hydroxybenzoic acid also being found in seaweeds from the Danish coastal area [34].
4-Hydroxybenzoic acid 4-O-glucoside (Compound 3, m/z 299.0778), protocatechuic acid 4-O-glucoside (Compound 4, m/z 315.0719) and ellagic acid glucoside (compound 6, m/z 463.0518) were identified in Sargassum sp., Centroceras sp., Grateloupia sp. and Ecklonia sp. in both modes. The molecular ions of 4-hydroxybenzoic acid 4-O-glucoside, protocatechuic acid 4-O-glucoside and ellagic acid glucoside produced the product ions at m/z 137, 153 and 301, respectively, indicating the loss of hexosyl moiety (162 Da) from precursor ions [32].

Hydroxycinnamic Acids and Other Phenolic Acid Derivatives

Thirteen hydroxycinnamic acids derivatives, two hydroxyphenylpentanoic acids and one hydroxyphenylacetic acid were tentatively identified in our study.
Compound (7) was identified as 3-sinapoylquinic acid based on the precursor ion [M − H] at m/z 397.1144, with product ions at m/z 223 (sinapic acid ion) and m/z 179 (sinapic acid − COO) in Centroceras sp. and Ecklonia sp., which was previously characterized in extracts of arnica flower [35]. Cinnamoyl glucose (Compound 8) was also found in Codium sp. and Ulva sp. The presence of cinnamoyl glucose was confirmed by a [M − H] m/z at 309.0992, which yielded product ions at m/z 147, m/z 131 and m/z 103, indicating the expected loss of hexosyl moiety (162 Da), C6H10O6 (178 Da) and C7H10O7 (206 Da), respectively [36].
Compound (9), having a precursor ion [M − H] m/z at 341.0882, was tentatively characterized as caffeoyl glucose and was present in Ecklonia sp. and Centroceras sp. The MS2 analysis showed the product ions at m/z 179 [M − H − 162] and m/z 161 [M − H − 180], consistent with losses of hexosyl moiety and further loss of H2O [37]. Compound 14 was tentatively characterized as caffeoyl tartaric acid found in Grateloupia sp. and Centroceras sp. based on [M − H] m/z at 311.0403. The identification was further supported by the MS2 spectrum, which exhibited typical product ion at m/z 161, formed by the neutral loss of 150 mass units as a result of tartaric acid fission [38]. To the best of our knowledge, caffeoyl tartaric acid and caffeoyl glucose were previously reported primarily in fruit samples such as grape, however, it was the first time that they were reported in seaweeds [39]. For caffeic acid 3-O-glucuronide found in Caulerpa sp. (Compound 10 with [M − H] m/z of 355.0671), MS/MS fragmentation yielded the predominant ion at m/z 179 after the loss of glucuronide moiety (176 Da), indicating the presence of caffeic acid ion [37].
Compound 11 was tentatively characterized as chlorogenic acid, and only found in Centroceras sp. and Caulerpa sp. based on [M − H] m/z at 353.0862, and identification was further supported by the MS2 spectrum. The identity of chlorogenic acid was confirmed by the product ions at m/z 253 [M − H − 100], 190 [M − H − 163] and 144 [M − H − 209], corresponding to the loss of three H2O and HCOOH; three H2O and C6H5O2; H2O and C7H11O6, respectively [40]. Chlorogenic acid was also present in the green seaweed Capsosiphon fulvescens from Korea, according to previous research [41].
Four hydroxycinnamic acid derivatives (Compound 12, 13, 15 and 17) were detected in Caulerpa sp. in both ionization modes, and were tentatively identified as caffeic acid, caffeic acid 4-sulfate, isoferulic acid 3-sulfate and ferulic acid, according to the precursor ions [M − H] at m/z 179.0350, 258.9929, 273.0086 and 193.0513, respectively. The identification of caffeic acid was confirmed by the product ions at m/z 151 [M − H − 28], m/z 143 [M − H − 36] and m/z 133 [M − H − 46], representing the loss of CO, two H2O units and HCOOH, respectively, from the precursor ion [40]. In the MS2 experiment of caffeic acid 4-sulfate, the spectra displayed the product ions at m/z 179, (presence of caffeic acid ion) and at m/z 135, corresponding to the loss of SO3 (80 Da) and further loss of CO2 (44 Da) from the precursor ion [42]. The similar cleavage was observed in the MS2 spectra of isoferulic acid 3-sulfate, which displayed the product ions at m/z 193 [M − H − SO3] and m/z 149 [M − H − SO3 − CO2], consistent with the presence of isoferulic acid ion (193 Da) and further loss of CO2 [42], while the product ions at m/z 178 (M − H − 15, loss of CH3), m/z 149 (M − H − 44, loss of CO2) and m/z 134 (M − H − 59, loss of CH3 and H2O) identified ferulic acid [43]. According to a previous study, caffeic acid and ferulic acid were also found in some seaweeds [33,34].
Sinapic acid (Compound 16) were detected in both positive (ESI+) and negative (ESI) modes in Ulva sp. Caulerpa sp. and Grateloupia sp. with an observed [M − H] m/z at 223.0621. In the MS2 spectrum of sinapic acid, the product ions at m/z 205, 179 and 163 were due to the loss of H2O (18 Da), CO2 (44 Da) and two CH2O units (60 Da) from the parent ion, respectively, which was comparable with the fragmentation rules of sinapinic acid [42].
Coumaric acid (compound 18 with [M − H] m/z at 163.0406), yielding a main product ion at m/z 119, which corresponded to loss of CO2 (44 Da), was found in Caulerpa sp. [43]. The presence of coumaric acid in marine seaweeds was also previously reported [34].
Three other phenolic acid derivatives were also detected, including two hydroxyphenylpentanoic acid derivatives and one hydroxyphenylacetic acid derivative. To our best knowledge, this is the first time these other phenolic acid derivatives have been reported in seaweeds. Phenolic acids are the predominant polyphenol compounds found in different seaweeds, which were characterized by using LC-MS in previous studies, and displayed remarkable antioxidant potential [44,45].

2.3.2. Flavonoids

Flavonoid is the main class of phenolic compounds responsible for the antioxidant and free radical scavenging properties observed in seaweed [24]. In the present study, a total of 17 flavonoids were tentatively identified, which were further divided into anthocyanins (03), flavanols (03), flavonols (03), flavone (01) and isoflavonoids (07).

Anthocyanins, Flavanols and Flavonols Derivatives

Anthocyanins are naturally occurring pigments that belong to the subclass of flavonoids, which were previously reported in brown Irish seaweeds [46]. In our study, three anthocyanin derivatives were detected only in the red seaweeds Grateloupia sp. and Centroceras sp., in positive ionization mode. This is the first time all of these anthocyanins derivatives have been reported in seaweeds.
Three flavanols (Compound 26, 27 and 28) were detected in all seaweeds except Centroceras sp. and Codium sp. Compound (26) showing precursor ion [M − H] at m/z 305.0668 in negative mode, was the most widely distributed flavanol and was identified as gallocatechin presenting in Caulerpa sp., Ulva sp., Dasya sp., Ecklonia sp. and Sargassum sp. The presence of gallocatechin derivatives in brown seaweed ascophyllum nodosum was reported by Agregán, Munekata, Franco, Dominguez, Carballo and Lorenzo [44] based on the production [M − H] ion at m/z 305. In MS/MS experiment, the product ion at 261 [M − H − 44] was due to the loss of CO2 and at m/z 219 [M − H − 86] was caused by the loss of C3O2 and H2O [43]. 3′-O-methylcatechin (Compound 27 with [M − H]- m/z of 303.0886) was identified in Grateloupia sp. in the present study, with the product ions at m/z 271 (M − H − 32, loss of CH3OH) and m/z 163 (M − H − 140, loss of CH3OH and C6H5O2) [47]. Catechin (isomer) was proposed as compound (28), from Caulerpa sp., with a precursor ion [M − H] m/z of 289.0731. The MS2 spectrum showed the product ions at m/z 245, m/z 205, and m/z 179, indicating the loss of CO2 (44 Da), flavonid A ring (84 Da) and flavonid B ring (110 Da) from the precursor ion, respectively [32].
Three flavonols were detected in negative mode in Centroceras sp., Caulerpa sp. and Ecklonia sp. 3,7-dimethylquercetin detected in Centroceras sp. was assigned for compound (31) based on the observed [M − H] m/z of 329.0674. The further identification of 3,7-dimethylquercetin was achieved by comparing the previous study, which characterized the same compound from Ipomoea batatas leaves and showed the product ions at m/z 314, m/z 299 and m/z 271, corresponding to the loss of CH3 (15 Da), two CH3 (30 Da) and two CH3 plus CO unit from the precursor ion, respectively [48].
Rhoifolin (Compound 32 with [M − H] m/z at 577.1588) was the only flavone identified in Centroceras sp. with the product ions at m/z 413 (M − H − 164) and m/z 269 (M − H − 308), representing the loss of rhamnose moiety and H2O (164 Da) and hexosyl moiety plus rhamnose moiety (308 Da) from the parent ion [49]. This is the first time that all of the flavonols and flavone derivatives identified in the current study have been reported in seaweeds.

Isoflavonoids Derivatives

Isoflavonoids derivatives (a total of seven) were the most diverse flavonoids identified in seaweeds. Sativanone (Compound 33) was only detected in Ecklonia sp. in negative mode with [M − H] m/z at 299.0918. The identity was confirmed by comparing the previous study which characterized sativanone in Dalbergia odorifera using LC-MS/MS, and the spectrum displayed the product ions at m/z 284 (M − H − 15, loss of CH3 from B-ring) and at m/z 269 (M − H − 30, loss of two CH3) and at m/z 225 (M − H − 74, loss of two CH3 and a CO2) [50]. Compound 37 with [M − H]- m/z at 267.0666 exhibited characteristic fragment ions at m/z 252 [M − H − CH3], m/z 224 [M − H − CH3 − CO] and m/z 180 [M − H − CH3 – CO − CO2] was identified as dalbergin [50]. To the best of our knowledge, this is the first time that isoflavonoids derivatives were identified and characterized in seaweeds. Flavonoids in different seaweeds with high antioxidant potential have already been reported, which are promising as functional food ingredients or dietary supplements for daily intake [51].

2.3.3. Other Polyphenols

Eleven other polyphenols found were classified as hydroxybenzaldehyde (01), hydroxycoumarins (02), phenolic terpenes (03), tyrosol (02) and other polyphenols (03).

Hydroxybenzaldehydes, hydroxycoumarins and hydroxyphenylpropenes Derivatives

p-Hydroxybenzaldehyde (Compound 40 with [M − H] at m/z 121.0295, RT = 15.921 min) was the only hydroxybenzaldehyde presenting in Dasya sp., Ecklonia sp. and Codium sp. The MS2 spectrum of p-hydroxybenzaldehyde displayed the product ions at m/z 92 and m/z 77, indicating the loss of CHO (29 Da) and CO2 (44 Da) [52]. The presence of p-hydroxybenzaldehyde in Irish brown seaweed Himanthalia elongate was also previously reported by Rajauria, Foley and Abu-Ghannam [9]. Two hydroxycoumarins derivatives (Compound 41 and 42) were discovered. Urolithin A with [M − H] m/z at 227.0341 was assigned as compound 41, from Grateloupia sp. MS/MS identification by product ions at m/z 198 (M − H − 29, loss of CHO) and 182 m/z (M − H − 45, loss of COOH) [53]. Scopoletin with [M − H] m/z at 191.0352 was proposed as compound 42 found in Codium sp., Grateloupia sp. and Sargassum sp., and was identified by the neutral loss of CH3 (15 Da) and CO2 (44 Da), resulting in product ions at m/z 176 and m/z 147, respectively [54].

Phenolic Terpenes Derivatives

Rosmanol (Compound 43), showing as precursor ion at [M + H]+ at m/z 347.1843, was detected in Dasya sp., Ulva sp., Grateloupia sp., Ecklonia sp. and Codium sp. The product ions at m/z 301 and m/z 231 came from the loss of a unit of H2O and CO (46 Da), and cleavage of molecules pentene, water, and carbon monoxide [55]. Carnosic acid (Compound 45), identified based on [M − H] m/z at 331.1912, was found in Ecklonia sp. Dasya sp., Codium sp. and Sargassum sp. The molecular ion of carnosic acid (m/z 331.1912) produced the major fragment ion at m/z 287 and m/z 269, corresponding to the loss of CO2 and further loss of H2O from the parent ion [56]. Hermund, et al. [57] also confirmed the presence of carnosic and carnosol as synergistic antioxidants with radical scavenging activity in brown seaweed Fucus vesiculosus.

Tyrosols and Other Polyphenols Derivatives

Compounds (46) were present in Centroceras sp., Dasya sp., Grateloupia sp., and Sargassum, and was tentatively identified as hydroxytyrosol 4-O-glucoside based on the observed [M − H] ions at m/z 315.1091. In the MS2 spectrum of hydroxytyrosol 4-O-glucoside, the typical loss of hexosyl moiety (162 Da) was observed from precursor, resulting in product ions at m/z 153 [52]. Compound 47 with [M − H] m/z at 319.1200 was only detected from Caulerpa sp., and characterized as 3,4-DHPEA-EDA based on the product ions at m/z 301, m/z 275 and m/z 195, corresponding to loss of H2O (18 Da), CO2 (44 Da) and C5H6(CHO)2 (124 Da) from the precursor ion [58]. This is the first report of the presence of these tyrosol derivatives in seaweed, while 3,4-DHPEA-AC was previously reported by Gomez-Alonso, et al. [59] in Cornicabra olive oil variety.
Three other polyphenols derivatives were detected, including compound (49) with [M − H] at m/z 125.0242, which was proposed as phloroglucinol appearing in brown seaweed Ecklonia sp. and Sargassum sp. The identity was confirmed by the MS2 spectrum, which produced a major fragment ion at m/z 97, resulting from the loss of CO (28 Da) from the precursor ion [9]. The presence of phloroglucinol in Irish brown seaweed Himanthalia elongate was previously reported by Rajauria, Foley and Abu-Ghannam [9] according to the precursor and product ions, and further confirmed by the UV spectrum and retention time using phloroglucinol standard.

2.3.4. Lignans

Lignans were minor components present in the seaweeds. In the present study, a total of four lignans were shown to be present in seven out of eight seaweeds.

Lignans Derivatives

Compounds 52 detected in Centroceras sp. and Sargassum sp. was tentatively characterized as arctigenin according to the precursor ions at [M − H] m/z 371.1509. Fragmentation of arctigenin yielded product ions at m/z 356, m/z 312 and m/z 295, corresponding to the loss of CH3 (15 Da), unit of CH3 and CO2 (59 Da), and unit of CH3, CO2 and OH (76 Da), respectively [60]. Compound 54 (deoxyschisandrin) displaying the [M + H]+ m/z at 417.2286 and was found in Ecklonia sp. and confirmed by the characteristic ions at m/z 402 [M − H − CH3], m/z 347 [M − H − C5H10], m/z 316 [M − H − C5H10 − OCH3] and m/z 301 [M − H − C5H10 − OCH3 − CH3] [61]. Lignans are abundant in seaweeds, however, the lignans in the present study have not previously been reported in seaweeds [62]. Previously, it was reported that lignans are abundant in seaweeds with various health-promoting properties, including antioxidant, anti-inflammatory and antitumor activities [62,63]. In addition, some epidemiological studies have proposed the therapeutic potential of lignans in chronic diseases, such as cardiovascular disease, type 2 diabetes and cancers [64,65].
The screening and characterization of polyphenolic compounds showed that some of the polyphenols presented in these seaweeds have strong antioxidant potential. Hydroxycinnamic acid derivatives, hydroxybenzoic acids and their derivatives, protocatechuic acid, anthocyanins, flavonoids and their derivatives, hydroxybenzaldehydes, hydroxytyrosol, phloroglucinol and quercetin derivatives are regarded as potential compounds showing considerable free radical scavenging capacity [66,67,68,69,70,71]. The presence of these antioxidant compounds indicates that seaweeds can be good sources of polyphenols and could be utilized in food, feed, and pharmaceutical industries.

2.4. HPLC Quantitative Analysis

The quantitative analysis of targeted phenolic compounds was performed based on peak area computation using the calibration of corresponding standards and the result are presented as μg/g fresh weight of seaweeds (Table 4.). In total, seven polyphenols were targeted to quantify by HPLC-PDA, including six phenolic acids (gallic acid, caftaric acid, chlorogenic acid, caffeic acid, p-hydroxybenzoic acid and coumaric acid) and one flavonoid (catechin).
The most abundant targeted phenolic compound was p-hydroxybenzoic acid (Compound 5), which was present in Ulva sp. with the concentration of 846.0 ± 0.02 μg/gf.w. The p-hydroxybenzoic acid content of eight green and red seaweeds in South Africa was previously reported as ranging from 0.51 ± 0.01 to 13.53 ± 0.03 μg/g dry weight (d.w.) [72], which was significantly lower than that of Ulva sp. in the present study. Gallic acid (Compound 1), chlorogenic acid (Compound 2) and caftaric acid (Compound 4) were detected in Centroceras sp. with the concentration of 138.9 ± 0.02 μg/gf.w., 122.7 ± 0.01 μg/gf.w. and 19.7 ± 0.01 μg/gf.w., respectively. Coumaric acid (Compound 6) was quantified in Ulva sp. with concentrations of 505.4 ± 0.03 μg/gf.w. Caffeic acid (Compound 3) and catechin (Compound 7) were present in Caulerpa sp. with a concentration of 612.9 ± 0.02 μg/gf.w. and 29.5 ± 0.03 μg/gf.w., respectively. Concentrations of gallic acid, chlorogenic acid and caffeic acid in brown seaweed Himanthalia elongate were also previously reported, being measured as 96.3 ± 3.12 μg/gd.w., 38.8 ± 1.94 μg/gd.w. and 44.4 ± 2.72 μg/gd.w., respectively [33]. About 10 marine-derived pharmaceutical drugs were approved by the Food and Drug Administration (FDA), and 30 candidates were in different stages of clinical trials for application in a number of disease areas [73]. The presence of these abundant polyphenols provide evidence for seaweeds as a good source of antioxidants for application in food and pharmaceutical industries, while further toxicity, pharmacological and clinical studies are needed.

3. Materials and Methods

3.1. Chemicals and Reagents

Unless otherwise stated, all chemicals used for extraction, characterization and antioxidant assays were analytical grade and purchased from Sigma-Aldrich (Castle Hill, NSW, Australia). Gallic acid, quercetin, catechin, ascorbic acid, 2,2-diphenyl-1-picrylhydrazyl (DPPH), 2,4,6-tripyridyl-s-triazine (TPTZ), aluminum chloride, iron (III) chloride, vanillin, potassium persulfate and 2,2’-azino-bis(3-ethylbenzothiazoline-6-sulphonic acid) (ABTS) were purchased from Sigma-Aldrich (Castle Hill, NSW, Australia). Sulfuric acid 98% was from RCI Labscan (Rongmuang, Thailand) and sodium carbonate anhydrous was from Chem-Supply Pty Ltd. (Adelaide, SA, Australia). Analytical-grade methanol, ethanol, hydrochloric acid, anhydrous sodium acetate and hydrated sodium acetate were from Fisher Chemical (Waltham, MA, USA). Acetic acid solution and acetonitrile, which comprised the mobile phases for HPLC and LC-MS, were from Sigma-Aldrich (St. Louis, MO, USA) and LiChrosolv (Darmstadt, Germany), respectively. The HPLC reference standards including gallic acid, caftaric acid, chlorogenic acid, caffeic acid, p-hydroxybenzoic acid, coumaric acid and catechin, were purchased from Sigma-Aldrich (St. Louis, MO, USA). Water was deionized to reach a resistivity of 18.2 MΩ/cm using a Millipore Milli-Q Gradient Water Purification System (Darmstadt, Germany) and was filtered through a 0.45 µm type Millipak® Express 20 Filter (Milli-Q, Darmstadt, Germany).

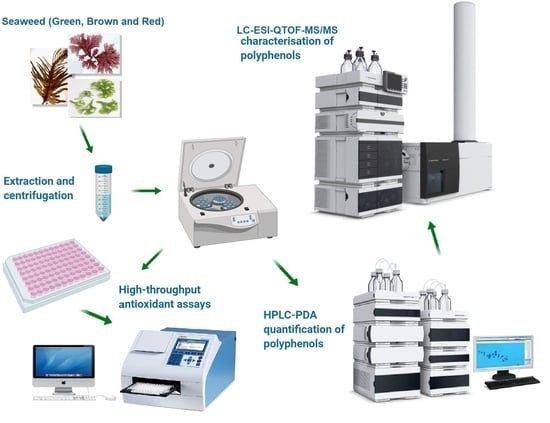
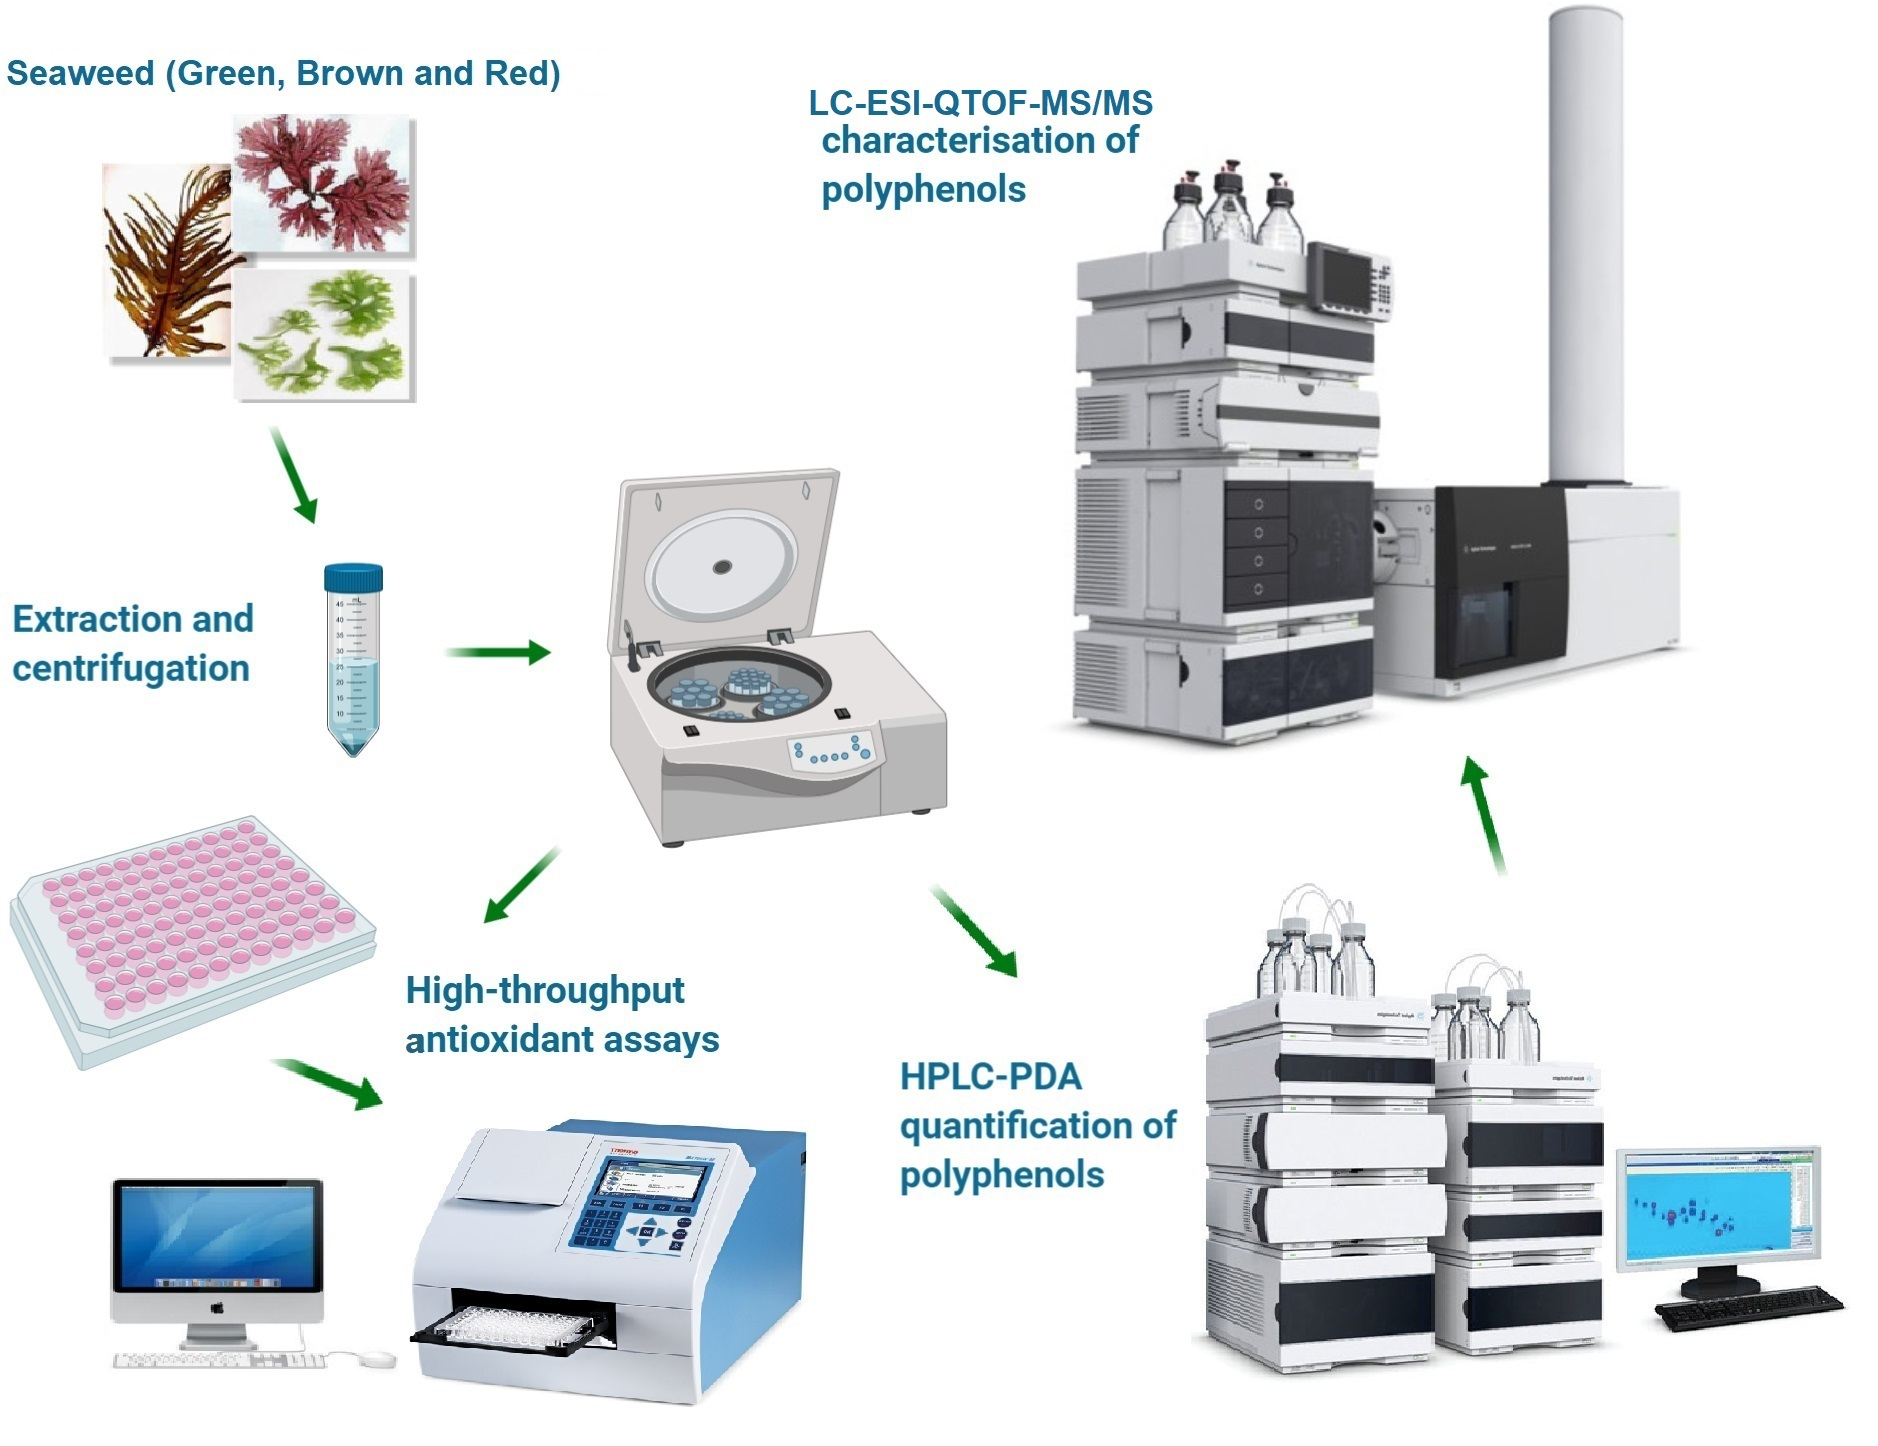
3.2. Sample Preparation and Extraction of Polyphenols

Eight seaweeds which were identified as Chlorophyta (green; Ulva sp., Caulerpa sp. and Codium sp.), Rhodophyta (Red; Dasya sp., Grateloupia sp. and Centroceras sp.) and Ochrophyta (Brown; Ecklonia sp. and Sargassum sp.) were freshly collected from Brighton Beach in March 2019, VIC, Australia. Seaweeds were morphologically identified to the genus level. Classifications for Rhodophyta and Chlorophyta were verified using cytochrome c oxidase subunit I (COI-5P) and Elongation factor Tu 1-Escherichia coli (strain K12) tufA sequence data, respectively, following the protocol of Saunders and Kucera [74].
Extracts were prepared by modifying the previous studies [75,76], 2 g of each seaweed was grounded and mixed with 10 mL of 80% ethanol followed by homogenization using an Ultra-Turrax® T25 homogenizer (Rawang, Selangor, Malaysia) at 10,000 rpm for 20 s. Then, incubation was carried out in a shaking incubator (ZWYR-240, Labwit, Ashwood, VIC, Australia) at 120 rpm at 4 °C for 16 h. Then, all the samples were centrifuged (Hettich Rotina 380R, Tuttlingen, Germany) at 10,000 rpm for 10 min. The supernatant was collected and stored at −20 °C for further analysis. For HPLC and LC-MS analysis, the extracts were filtered through a 0.45 μm syringe filter (Thermo Fisher Scientific Inc., Waltham, MA, USA).

3.3. Estimation of Polyphenols and Antioxidant Assays

For polyphenol estimation, TPC, TFC and TTC were measured, while for antioxidant potential, three different antioxidant assays, including DPPH, FRAP, and ABTS, were performed using the method of Feng, et al. [77]. The data were obtained by the Multiskan® Go microplate photometer (Thermo Fisher Scientific, Waltham, MA, USA).

3.3.1. Total Phenolic Content (TPC)

The total phenolic content of seaweed was determined using the Folin-Ciocalteu’s method [13] with some modifications. Twenty-five microliters of standards and samples (supernatant), 25 µL of 25% (v/v) folin reagent solution and 200 µL water were added to the wells in a 96-well plate (Corning Inc., Corning, NY, USA) and incubated at 25 °C for 5 min. Then, 25 µL of 10% (w/w) sodium carbonate was added and further incubated for 1 h at 25°C. The absorbance was measured at 765 nm against a blank using a Multiskan® Go microplate photometer (Thermo Fisher Scientific, Waltham, MA, USA). The calibration curve was plotted using a gallic acid standard ranging from 0 to 200 µg/mL in ethanolic solution and the results were presented as microgram equivalents of gallic acid equivalents (GAE) per gram ± standard error (SE) on the basis of fresh weight (f.w.) (y = 0.0059x + 0.0593, R2 = 0.9996).

3.3.2. Total Flavonoid Content (TFC)

The total flavonoid content was measured by aluminum chloride colorimetry according to Chan, Matanjun, Yasir and Tan [25], with some modifications. Methanolic quercetin standards and samples (80 µL) were added to the 96-well plate. Then, 80 µL of 2% (w/v) aluminum chloride (diluted with analytical grade ethanol) and 120 µL 50 g/L sodium acetate was added the wells in the plate followed by the incubation at 25 °C for 2.5 h in the dark. The calibration curve was plotted using quercetin standards ranging from 0 to 50 μg/mL and the results are presented as microgram equivalents of quercetin equivalents (QE)/gf.w. ± SE (y = 0.0195x + 0.0646, R2 = 0.999).

3.3.3. Total Tannins Content (TTC)

Total tannin content was measured by modifying the method of Rebaya, et al. [78]. Sample/standard (25 µL of supernatant or standard), 150 µL 4% (w/v) methanolic vanillin solution and 25 µL 32% (v/v) sulfuric acid (diluted with methanol) were mixed in a 96-well plate and incubated at room temperature for 15 min. The absorbance was measured at 500 nm wavelength against a blank using the microplate reader. The calibration curve was plotted by catechin methanolic solution ranging from 0 to 1000 µg/mL and the results are presented as microgram equivalents of catechin (CE)/gf.w. ± SE (y = 0.0005x + 0.0578, R2 = 0.9854).

3.3.4. 2,2-diphenyl-1-picrylhydrazyl (DPPH) Assay

DPPH radical scavenging activities of different extracts were determined based on Chan et al. [25] with some modifications. Quantities of 40 µL samples/standards and 260 µL of 0.1 mM methanolic DPPH were added to a 96-well plate. The reaction mixture was incubated for 30 min in the dark at room temperature, and the absorbance was measured under 517 nm wavelength against a blank. The standard curve was plotted by ascorbic acid aqueous solution ranging from 0 to 50 μg/mL and the results are expressed as the microgram equivalents of ascorbic acid (AAE)/gf.w. ± SE (y = −0.0089x + 0.5988, R2 = 0.9708).

3.3.5. Ferric Reducing Antioxidant Power (FRAP) Assay

The ferric reducing capabilities of the samples were measured using the FRAP method described by Matanjun, et al. [79], with slight modifications. The FRAP reagent was freshly prepared by mixing 300 mM acetate buffer, 10 mM TPTZ solution and 20 mM ferric chloride in the ratio of 10:1:1 (v/v). 20 µL samples/standards were added into the 96-well plate and mixed with 280 µL FRAP reagent. The mixture was incubated at 37 °C in the plate reader for 10 min before absorbance was measured at 593 nm. A standard curve was generated using ascorbic acid aqueous solution ranging from 0 to 50 µg/mL and the results are expressed as the microgram AAE/gf.w. ± SE (y = 0.009x + 0.403, R2 = 0.9819).

3.3.6. 2,2′-Azino-bis-3-ethylbenzothiazoline-6-sulfonic Acid (ABTS) assay

The antioxidant activities of seaweeds were also measured by an ABTS assay according to Matanjun, Mohamed, Mustapha, Muhammad and Ming [79], with some modifications. ABTS+ was prepared by mixing 5 mL of 7 mM ABTS solution and 88 µL of 140 mM potassium persulfate solution, and the mixture was placed in the dark for 16 h to allow free radical generation. The stock solution was further diluted with 45 mL analytical-grade ethanol while the absorbance of the dye was fixed at approximately 0.7 at 734 nm. Quantities of 10 µL of sample/standards and 290 µL prepared dye solution were added into a 96-well plate followed by incubation at room temperature for 6 min and the absorbance was measured at 734 nm wavelength. The standard curve was plotted using ascorbic acid aqueous solution ranging from 0 to 200µ/mL and the results are expressed as the microgram AAE/gf.w. ± SE (y = -0.0042x + 0.6923, R2 = 0.9962).

3.4. LC-ESI-QTOF-MS/MS Characterization of Phenolic Compounds

LC-ESI-QTOF-MS/MS analysis was performed with an Agilent 1200 series HPLC (Agilent Technologies, Santa Clara, CA, USA) equipped with an Agilent 6520 Accurate-Mass Q-TOF LC-MS (Agilent Technologies, Santa Clara, CA, USA) via an electrospray ionization source (ESI). The separation was achieved by a Synergi Hydro-RP 80 Å, LC Column (250 mm × 4.6 mm, 4 µm) (Phenomenex, Lane Cove, NSW, Australia) at room temperature and the sample temperature was set at 10 °C. LC-MS/MS analysis were performed by modifying the method of Chao et al [66]. The mobile phase consisted of water/acetic acid (98:2, v/v; eluent A) and acetonitrile/acetic acid/ water (50:0.5:49.5, v/v/v; eluent B). The gradient profile was described as follows: 10–25% B (0–25 min), 25–35% B (25–35 min), 35–40% B (35–45 min), 40–55% B (45–75 min), 55–80% B (75–79 min), 80–90% B (79–82 min), 90–100% B (82–84 min), 100–10% B (84–87 min), isocratic 10% B (87–90 min). A volume of 6 µL was injected for each standard or sample and the flow rate was set at 0.8 mL/min. Nitrogen gas nebulization was set at 45 psi with a flow rate of 5L/min at 300 °C and the sheath gas was set at 11 L/min at 250 °C. The capillary and nozzle voltage were set at 3.5 kV and 500 V, respectively. A complete mass scan ranging from m/z 50 to 1300 was used, MS/MS analyses were carried out in automatic mode with collision energy (10, 15 and 30 eV) for fragmentation. Peak identification was performed in both positive and negative modes while the instrument control, data acquisition and processing were performed using MassHunter workstation software (Qualitative Analysis, version B.03.01) (Agilent Technologies, Santa Clara, CA, USA).

3.5. HPLC-PDA Quantitative Analysis of Individual Phenolic Compounds

The quantitative measurement of individual phenolic compounds present in seaweed samples was performed with an Agilent 1200 HPLC equipped with a photodiode array (PDA) detector by adopting the protocol of Peng et al. [68]. The same column and conditions were used as described above in LC-ESI-QTOF-MS/MS, except for a sample injection volume of 20 µL. The compositions of extracts were detected under λ 280 nm, 320 nm, and 370 nm by PDA detector simultaneously with 1.25 scan/s (peak width = 0.2 min) spectral acquisition rate. The targeted phenolic compounds were quantified based on linear regression of external standards peak area against concentration. Data acquisition and analysis were performed by MassHunter workstation software—version B.03.01 (Agilent Technologies, Santa Clara, CA, USA).

3.6. Statistical Analysis

All analyses were performed in triplicates and the results are presented as mean ± standard error (n = 3). Data were analyzed using Tukey’s one-way analysis of variance (ANOVA) by Minitab® 19 for windows (Minitab, NSW, Australia). A significant difference was considered at the level of p ≤ 0.05 using Tukey’s HSD test.

4. Conclusions

Brown seaweed species showed significantly higher polyphenolic content and potential antioxidant capacity than green and red seaweeds. The antioxidant properties varied across different species. Application of LC-ESI-QTOF-MS/MS enabled the isolation and identification of 54 phenolic compounds present in seaweeds. Quantitative analysis of targeted compounds was achieved by calibration of standards using HPLC-PDA. Seven targeted compounds were quantified in seaweeds, with p-hydroxybenzoic acid being the most abundant. This is the first report that applied different antioxidant assays to estimate the antioxidant potential and applied LC-MS technique to isolate and characterize the polyphenols in some abundant Australian seaweed species. The presence of the various polyphenols with antioxidant potential was identified. Further toxicity, pharmacological and clinical studies should be explored before the application of these Australian seaweeds as ingredients in food, nutraceuticals and pharmaceutical products.

Supplementary Materials

The following are available online at https://www.mdpi.com/1660-3397/18/6/331/s1, Table S1: Characterization of phenolic compounds in seaweeds by using LC-ESI-QTOF-MS/MS. Figure S1: Base peak chromatogram (BPC) for characterization of phenolic compounds of seaweeds. Figure S2. Extracted ion chromatogram and mass spectrum of “Vanillic acid 4-sulfate” detected in three different seaweeds.

Author Contributions

Conceptualization, methodology, validation and investigation, B.Z. and H.A.R.S.; resources, H.A.R.S., C.J.B.; F.R.D. and R.D.W.; writing—original draft preparation, B.Z. and H.A.R.S.; writing—review and editing, B.Z., C.J.B.; N.A.R.; H.A.R.S. and R.D.W.; supervision, F.R.D., H.A.R.S. and R.D.W.; ideas sharing, H.A.R.S.; C.J.B.; F.R.D.; R.D.W. and N.A.R.; funding acquisition, H.A.R.S., F.R.D. and R.D.W. All authors have read and agreed to the published version of the manuscript.

Funding

This research was funded by the University of Melbourne under the “McKenzie Fellowship Scheme” (Grant No. UoM-18/21) and the “Faculty Research Initiative Funds” funded by the Faculty of Veterinary and Agricultural Sciences, The University of Melbourne, Australia and “the Alfred Deakin Research Fellowship” funded by the Deakin University, Australia.

Acknowledgments

We would like to thank Nicholas Williamson, Shuai Nie and Michael Leeming from the Mass Spectrometry and Proteomics Facility, Bio21 Molecular Science and Biotechnology Institute, the University of Melbourne, VIC, Australia for providing access and support for the use of HPLC-PDA and LC-ESI-QTOF-MS/MS and data analysis. We would like to appreciate for Tristan Graham and Trevor T. Bringloe from School of BioSciences, University of Melbourne, VIC, Australia for providing and identifying the samples. We would also like to thank for Rana Dildar Khan, Chao Ma, Danying Peng, Jiafei Tang, Yuying Feng, Danwei Yang, Yasir Iqbal and Akhtar Ali from the School of Agriculture and Food, Faculty of Veterinary and Agricultural Sciences, the University of Melbourne for their incredible support.

Conflicts of Interest

The authors declare no conflict of interest.

References

  1. Ferdouse, F.; Holdt, S.L.; Smith, R.; Murua, P.; Yang, Z. The Global Status of Seaweed Production, Trade and Utilization; Food and Agriculture Organization of the United Nations: Rome, Italy, 2018. [Google Scholar]
  2. Wyrepkowski, C.C.; Costa, D.L.; Sinhorin, A.P.; Vilegas, W.; De Grandis, R.A.; Resende, F.A.; Varanda, E.A.; dos Santos, L.C. Characterization and quantification of the compounds of the ethanolic extract from caesalpinia ferrea stem bark and evaluation of their mutagenic activity. Molecules 2014, 19, 16039–16057. [Google Scholar] [CrossRef] [PubMed] [Green Version]
  3. Mouritsen, O.G.; Mouritsen, J.D.; Johansen, M. Seaweeds: Edible, Available & Sustainable; The University of Chicago Press: Chicago, IL, USA; London, UK, 2013. [Google Scholar]
  4. Fleurence, J. Chapter 5–Seaweeds as food. In Seaweed in Health and Disease Prevention; Fleurence, J., Levine, I., Eds.; Academic Press: San Diego, CA, USA, 2016; pp. 149–167. [Google Scholar]
  5. Menon, V.V.; Lele, S.S. Nutraceuticals and bioactive compounds from seafood processing waste. In Springer Handbook of Marine Biotechnology; Springer: Berlin/Heidelberg, Germany, 2015; pp. 1405–1425. [Google Scholar]
  6. Suleria, H.A.; Masci, P.; Gobe, G.; Osborne, S. Current and potential uses of bioactive molecules from marine processing waste. J. Sci. Food Agric. 2016, 96, 1064–1067. [Google Scholar] [CrossRef] [PubMed]
  7. Maqsood, S.; Benjakul, S.; Shahidi, F. Emerging role of phenolic compounds as natural food additives in fish and fish products. Crit. Rev. Food Sci. Nutr. 2013, 53, 162–179. [Google Scholar] [CrossRef] [PubMed]
  8. Manach, C.; Scalbert, A.; Morand, C.; Remesy, C.; Jimenez, L. Polyphenols: Food sources and bioavailability. Am. J. Clin. Nutr. 2004, 79, 727–747. [Google Scholar] [CrossRef] [Green Version]
  9. Rajauria, G.; Foley, B.; Abu-Ghannam, N. Identification and characterization of phenolic antioxidant compounds from brown irish seaweed himanthalia elongata using lc-dad-esi-ms/ms. Innov. Food Sci. Emerg. Technol. 2016, 37, 261–268. [Google Scholar] [CrossRef]
  10. Valko, M.; Leibfritz, D.; Moncol, J.; Cronin, M.T.; Mazur, M.; Telser, J. Free radicals and antioxidants in normal physiological functions and human disease. Int. J. Biochem. Cell Biol. 2007, 39, 44–84. [Google Scholar] [CrossRef]
  11. Airanthi, M.K.; Hosokawa, M.; Miyashita, K. Comparative antioxidant activity of edible japanese brown seaweeds. J. Food. Sci. 2011, 76, C104–C111. [Google Scholar] [CrossRef]
  12. Namvar, F.; Mohamad, R.; Baharara, J.; Zafar-Balanejad, S.; Fargahi, F.; Rahman, H.S. Antioxidant, antiproliferative, and antiangiogenesis effects of polyphenol-rich seaweed (sargassum muticum). BioMed Res. Int. 2013, 2013, 604787. [Google Scholar] [CrossRef] [Green Version]
  13. Lopez, A.; Rico, M.; Rivero, A.; de Tangil, M.S. The effects of solvents on the phenolic contents and antioxidant activity of stypocaulon scoparium algae extracts. Food Chem. 2011, 125, 1104–1109. [Google Scholar] [CrossRef]
  14. Leopoldini, M.; Russo, N.; Toscano, M. The molecular basis of working mechanism of natural polyphenolic antioxidants. Food Chem. 2011, 125, 288–306. [Google Scholar] [CrossRef]
  15. Kelman, D.; Posner, E.K.; McDermid, K.J.; Tabandera, N.K.; Wright, P.R.; Wright, A.D. Antioxidant activity of hawaiian marine algae. Mar. Drugs 2012, 10, 403–416. [Google Scholar] [CrossRef] [PubMed]
  16. Kulawik, P.; Ozogul, F.; Glew, R.; Ozogul, Y. Significance of antioxidants for seafood safety and human health. J. Agric. Food Chem. 2013, 61, 475–491. [Google Scholar] [CrossRef] [PubMed]
  17. Kalita, P.; Tapan, B.K.; Pal, T.K.; Kalita, R. Estimation of total flavonoids content (tfc) and anti oxidant activities of methanolic whole plant extract of biophytum sensitivum linn. JDDT 2013, 3, 33–37. [Google Scholar] [CrossRef]
  18. Lopes, G.; Barbosa, M.; Vallejo, F.; Gil-Izquierdo, A.; Andrade, P.B.; Valentao, P.; Pereira, D.M.; Ferreres, F. Profiling phlorotannins from fucus spp. Of the northern portuguese coastline: Chemical approach by hplc-dad-esi/msn and uplc-esi-qtof/ms. Algal Res. 2018, 29, 113–120. [Google Scholar] [CrossRef]
  19. Liu, B.; Kongstad, K.T.; Wiese, S.; Jäger, A.K.; Staerk, D. Edible seaweed as future functional food: Identification of α-glucosidase inhibitors by combined use of high-resolution α-glucosidase inhibition profiling and hplc–hrms–spe–nmr. J. Food Chem. 2016, 203, 16–22. [Google Scholar] [CrossRef]
  20. García-Casal, M.N.; Ramirez, J.; Leets, I.; Pereira, A.C.; Quiroga, M.F. Antioxidant capacity, polyphenol content and iron bioavailability from algae (ulva sp., sargassum sp. And porphyra sp.) in human subjects. J. Food Chem. 2008, 101, 79–85. [Google Scholar] [CrossRef] [Green Version]
  21. Sabeena Farvin, K.H.; Jacobsen, C. Phenolic compounds and antioxidant activities of selected species of seaweeds from danish coast. Food Chem. 2013, 138, 1670–1681. [Google Scholar] [CrossRef]
  22. Mekinic, I.G.; Skroza, D.; Simat, V.; Hamed, I.; Cagalj, M.; Perkovic, Z.P. Phenolic content of brown algae (pheophyceae) species: Extraction, identification, and quantification. Biomolecules 2019, 9, 244. [Google Scholar] [CrossRef] [Green Version]
  23. Ford, L.; Theodoridou, K.; Sheldrake, G.N.; Walsh, P.J. A critical review of analytical methods used for the chemical characterisation and quantification of phlorotannin compounds in brown seaweeds. Phytochem. Anal. 2019, 30, 587–599. [Google Scholar] [CrossRef]
  24. Cox, S.; Abu-Ghannam, N.; Gupta, S. An assessment of the antioxidant and antimicrobial activity of six species of edible irish seaweeds. J. Food Chem. 2010, 17, 205–220. [Google Scholar]
  25. Chan, P.T.; Matanjun, P.; Yasir, S.M.; Tan, T.S. Antioxidant activities and polyphenolics of various solvent extracts of red seaweed, gracilaria changii. J. Food Chem. 2015, 27, 2377–2386. [Google Scholar] [CrossRef]
  26. Wang, T.; Jonsdottir, R.; Ólafsdóttir, G. Total phenolic compounds, radical scavenging and metal chelation of extracts from icelandic seaweeds. J. Food Chem. 2009, 116, 240–248. [Google Scholar] [CrossRef]
  27. Pinteus, S.; Silva, J.; Alves, C.; Horta, A.; Fino, N.; Rodrigues, A.I.; Mendes, S.; Pedrosa, R. Cytoprotective effect of seaweeds with high antioxidant activity from the peniche coast (portugal). Food Chem. 2017, 218, 591–599. [Google Scholar] [CrossRef] [PubMed]
  28. Kim, A.R.; Shin, T.S.; Lee, M.S.; Park, J.Y.; Park, K.E.; Yoon, N.Y.; Kim, J.S.; Choi, J.S.; Jang, B.C.; Byun, D.S.; et al. Isolation and identification of phlorotannins from ecklonia stolonifera with antioxidant and anti-inflammatory properties. J. Agric. Food Chem. 2009, 57, 3483–3489. [Google Scholar] [CrossRef]
  29. Schaich, K.M.; Tian, X.; Xie, J. Hurdles and pitfalls in measuring antioxidant efficacy: A critical evaluation of abts, dpph, and orac assays. J. Funct. Foods 2015, 18, 782–796. [Google Scholar] [CrossRef]
  30. Sachindra, N.M.; Airanthi, M.K.; Hosokawa, M.; Miyashita, K. Radical scavenging and singlet oxygen quenching activity of extracts from indian seaweeds. J. Food Sci. Technol. 2010, 47, 94–99. [Google Scholar] [CrossRef] [Green Version]
  31. Ramon-Goncalves, M.; Gomez-Mejia, E.; Rosales-Conrado, N.; Leon-Gonzalez, M.E.; Madrid, Y. Extraction, identification and quantification of polyphenols from spent coffee grounds by chromatographic methods and chemometric analyses. Waste Manag. 2019, 96, 15–24. [Google Scholar] [CrossRef]
  32. Escobar-Avello, D.; Lozano-Castellon, J.; Mardones, C.; Perez, A.J.; Saez, V.; Riquelme, S.; von Baer, D.; Vallverdu-Queralt, A. Phenolic profile of grape canes: Novel compounds identified by lc-esi-ltq-orbitrap-ms. Molecules 2019, 24, 3763. [Google Scholar]
  33. Rajauria, G. Optimization and validation of reverse phase hplc method for qualitative and quantitative assessment of polyphenols in seaweed. J. Pharm. Biomed. Anal. 2018, 148, 230–237. [Google Scholar] [CrossRef]
  34. Dinh, T.V.; Saravana, P.S.; Woo, H.C.; Chun, B.S. Ionic liquid-assisted subcritical water enhances the extraction of phenolics from brown seaweed and its antioxidant activity. Sep. Purif. Technol. 2018, 196, 287–299. [Google Scholar] [CrossRef]
  35. Lin, L.Z.; Harnly, J.M. Identification of hydroxycinnamoylquinic acids of arnica flowers and burdock roots using a standardized lc-dad-esi/ms profiling method. J. Agric. Food Chem. 2008, 56, 10105–10114. [Google Scholar] [CrossRef] [PubMed]
  36. Yang, D.-z.; Sun, G.; Zhang, A.; Fu, S.; Liu, J.-h. Screening and analyzing the potential bioactive components from rhubarb, using a multivariate data processing approach and ultra-high performance liquid chromatography coupled with time-of-flight mass spectrometry. Anal. Methods 2015, 7, 650–661. [Google Scholar] [CrossRef]
  37. Wang, X.; Liu, J.; Zhang, A.; Sun, H.; Zhang, Y. Chapter 23–Systematic characterization of the absorbed components of acanthopanax senticosus stem. In Serum Pharmacochemistry of Traditional Chinese Medicine; Wang, X., Ed.; Academic Press: Cambridge, MA, USA, 2017; pp. 313–336. [Google Scholar]
  38. Al-Ayed, A.S. Integrated mass spectrometry approach to screening of phenolic molecules in hyphaene thebiaca fruits with their antiradical activity by thin-layer chromatography. Indian J. Chem. Technol. 2015, 22, 155–161. [Google Scholar]
  39. De Oliveira, D.N.; de Bona Sartor, S.; Damário, N.; Gollücke, A.P.; Catharino, R.R. Antioxidant activity of grape products and characterization of components by electrospray ionization mass spectrometry. J. Food Meas. Charact. 2014, 8, 9–14. [Google Scholar] [CrossRef]
  40. Lin, H.Q.; Zhu, H.L.; Tan, J.; Wang, H.; Wang, Z.Y.; Li, P.Y.; Zhao, C.F.; Liu, J.P. Comparative analysis of chemical constituents of moringa oleifera leaves from china and india by ultra-performance liquid chromatography coupled with quadrupole-time-of-flight mass spectrometry. Molecules 2019, 24, 942. [Google Scholar] [CrossRef] [Green Version]
  41. Tong, T.; Li, J.; Ko, D.-O.; Kim, B.-S.; Zhang, C.; Ham, K.-S.; Kang, S.-G. In vitro antioxidant potential and inhibitory effect of seaweed on enzymes relevant for hyperglycemia. Food Sci. Biotechnol. 2014, 23, 2037–2044. [Google Scholar] [CrossRef]
  42. Geng, C.A.; Chen, H.; Chen, X.L.; Zhang, X.M.; Lei, L.G.; Chen, J.J. Rapid characterization of chemical constituents in saniculiphyllum guangxiense by ultra fast liquid chromatography with diode array detection and electrospray ionization tandem mass spectrometry. Int. J. Mass Spectrom. 2014, 361, 9–22. [Google Scholar] [CrossRef]
  43. Wang, J.; Jia, Z.; Zhang, Z.; Wang, Y.; Liu, X.; Wang, L.; Lin, R. Analysis of chemical constituents of melastoma dodecandrum lour. By uplc-esi-q-exactive focus-ms/ms. Molecules 2017, 22, 476. [Google Scholar] [CrossRef] [Green Version]
  44. Agregán, R.; Munekata, P.E.; Franco, D.; Dominguez, R.; Carballo, J.; Lorenzo, J.M. Phenolic compounds from three brown seaweed species using lc-dad–esi-ms/ms. Food Res. Int. 2017, 99, 979–985. [Google Scholar] [CrossRef]
  45. Olate-Gallegos, C.; Barriga, A.; Vergara, C.; Fredes, C.; Garcia, P.; Gimenez, B.; Robert, P. Identification of polyphenols from chilean brown seaweeds extracts by lc-dad-esi-ms/ms. J. Aquat. Food Prod. Technol. 2019, 28, 375–391. [Google Scholar] [CrossRef]
  46. Rajauria, G. In-vitro antioxidant properties of lipophilic antioxidant compounds from 3 brown seaweed. Antioxidants 2019, 8, 596. [Google Scholar] [CrossRef] [PubMed] [Green Version]
  47. Reed, K.A. Identification of Phenolic Compounds from Peanut Skin Using hplc-msn; Virginia Polytechnic Institute and State University: Blacksburg, VA, USA, 2009. [Google Scholar]
  48. Zhang, L.; Tu, Z.-C.; Wang, H.; Fu, Z.-F.; Wen, Q.-H.; Chang, H.-X.; Huang, X.-Q. Comparison of different methods for extracting polyphenols from ipomoea batatas leaves, and identification of antioxidant constituents by hplc-qtoe-ms2. Food Res. Int. 2015, 70, 101–109. [Google Scholar] [CrossRef]
  49. Zeng, X.; Su, W.; Zheng, Y.; Liu, H.; Li, P.; Zhang, W.; Liang, Y.; Bai, Y.; Peng, W.; Yao, H. Uflc-q-tof-ms/ms-based screening and identification of flavonoids and derived metabolites in human urine after oral administration of exocarpium citri grandis extract. Molecules 2018, 23, 895. [Google Scholar] [CrossRef] [PubMed] [Green Version]
  50. Zhao, X.; Zhang, S.; Liu, D.; Yang, M.; Wei, J. Analysis of flavonoids in dalbergia odorifera by ultra-performance liquid chromatography with tandem mass spectrometry. Molecules 2020, 25, 389. [Google Scholar] [CrossRef] [PubMed] [Green Version]
  51. Tanna, B.; Brahmbhatt, H.R.; Mishra, A. Phenolic, flavonoid, and amino acid compositions reveal that selected tropical seaweeds have the potential to be functional food ingredients. J. Food Process. Preserv. 2019, 43, e14266. [Google Scholar] [CrossRef]
  52. Wang, Y.; Vorsa, N.; Harrington, P.d.B.; Chen, P. Nontargeted metabolomic study on variation of phenolics in different cranberry cultivars using uplc-im-hrms. J. Agric. Food Chem. 2018, 66, 12206–12216. [Google Scholar] [CrossRef]
  53. Wu, S.-H.; Li, H.-B.; Li, G.-L.; Lv, N.; Qi, Y.-J. Metabolite identification of gut microflora-cassia seed interactions using uplc-qtof/ms. Exp. Ther. Med. 2020, 19, 3305–3315. [Google Scholar] [CrossRef] [Green Version]
  54. Zeng, Y.; Lu, Y.; Chen, Z.; Tan, J.; Bai, J.; Li, P.; Wang, Z.; Du, S. Rapid characterization of components in bolbostemma paniculatum by uplc/ltq-orbitrap msn analysis and multivariate statistical analysis for herb discrimination. Molecules 2018, 23, 1155. [Google Scholar] [CrossRef] [Green Version]
  55. Jesionek, W.; Majer-Dziedzic, B.; Horvath, G.; Moricz, A.M.; Choma, I.M. Screening of antibacterial compounds in salvia officinalis l. Tincture using thin-layer chromatography-direct bioautography and liquid chromatography-tandem mass spectrometry techniques. JPC J. Planar Chromatogr. Mod. TLC 2017, 30, 357–362. [Google Scholar] [CrossRef] [Green Version]
  56. Pacifico, S.; Piccolella, S.; Lettieri, A.; Nocera, P.; Bollino, F.; Catauro, M. A metabolic profiling approach to an italian-sage leaf extract (soa541) defines its antioxidant and anti-acetylcholinesterase properties. J. Funct. Foods 2017, 29, 1–9. [Google Scholar] [CrossRef]
  57. Hermund, D.; Jacobsen, C.; Chronakis, I.S.; Pelayo, A.; Yu, S.; Busolo, M.; Lagaron, J.M.; Jónsdóttir, R.; Kristinsson, H.G.; Akoh, C.C. Stabilization of fish oil-loaded electrosprayed capsules with seaweed and commercial natural antioxidants: Effect on the oxidative stability of capsule-enriched mayonnaise. Eur. J. Lipd Sci. Technol. 2019, 121, 1800396. [Google Scholar] [CrossRef] [Green Version]
  58. Di Maio, I.; Esposto, S.; Taticchi, A.; Selvaggini, R.; Veneziani, G.; Urbani, S.; Servili, M. Characterization of 3,4-dhpea-eda oxidation products in virgin olive oil by high performance liquid chromatography coupled with mass spectrometry. Food Chem. 2013, 138, 1381–1391. [Google Scholar] [CrossRef]
  59. Gomez-Alonso, S.; Salvador, M.D.; Fregapane, G. Phenolic compounds profile of cornicabra virgin olive oil. J. Agric. Food Chem. 2002, 50, 6812–6817. [Google Scholar] [CrossRef] [PubMed]
  60. Salama, M.; El-Hawary, S.; Mousa, O.; El- Askary, N.; Esmat, A. In vivo tnf-α and il-1β inhibitory activity of phenolics isolated from trachelospermum jasminoides (lindl.) lem. Med. Plants Res. 2015, 9, 35–41. [Google Scholar]
  61. Yang, S.; Shan, L.; Luo, H.; Sheng, X.; Du, J.; Li, Y. Rapid classification and identification of chemical components of schisandra chinensis by uplc-q-tof/ms combined with data post-processing. Molecules 2017, 22, 1778. [Google Scholar] [CrossRef] [PubMed] [Green Version]
  62. Dhargalkar, V. Uses of seaweeds in the indian diet for sustenance and well-being. Sci. Cult. 2015, 80, 192–202. [Google Scholar]
  63. Rodriguez-Garcia, C.; Sanchez-Quesada, C.; Toledo, E.; Delgado-Rodriguez, M.; Gaforio, J.J. Naturally lignan-rich foods: A dietary tool for health promotion? Molecules 2019, 24, 917. [Google Scholar] [CrossRef] [PubMed] [Green Version]
  64. Peterson, J.; Dwyer, J.; Adlercreutz, H.; Scalbert, A.; Jacques, P.; McCullough, M.L. Dietary lignans: Physiology and potential for cardiovascular disease risk reduction. Nutr. Rev. 2010, 68, 571–603. [Google Scholar] [CrossRef] [PubMed] [Green Version]
  65. Kershaw, J.; Kim, K.H. The therapeutic potential of piceatannol, a natural stilbene, in metabolic diseases: A review. J. Med. Food 2017, 20, 427–438. [Google Scholar] [CrossRef] [Green Version]
  66. Ma, C.; Dunshea, F.R.; Suleria, H.A.R. Lc-esi-qtof/ms characterization of phenolic compounds in palm fruits (jelly and fishtail palm) and their potential antioxidant activities. Antioxidants 2019, 8, 483. [Google Scholar] [CrossRef] [Green Version]
  67. Tang, J.; Dunshea, F.R.; Suleria, H.A.R. Lc-esi-qtof/ms characterization of phenolic compounds from medicinal plants (hops and juniper berries) and their antioxidant activity. Foods 2020, 9, 7. [Google Scholar] [CrossRef] [PubMed] [Green Version]
  68. Peng, D.; Zahid, H.F.; Ajlouni, S.; Dunshea, F.R.; Suleria, H.A.R. Lc-esi-qtof/ms profiling of australian mango peel by-product polyphenols and their potential antioxidant activities. Processes 2019, 7, 764. [Google Scholar] [CrossRef] [Green Version]
  69. Yang, P.; Xu, F.; Li, H.F.; Wang, Y.; Li, F.C.; Shang, M.Y.; Liu, G.X.; Wang, X.; Cai, S.Q. Detection of 191 taxifolin metabolites and their distribution in rats using hplc-esi-it-tof-msn. Molecules 2016, 21, 764. [Google Scholar] [CrossRef] [PubMed]
  70. Oszmiański, J.; Kolniak-Ostek, J.; Wojdyło, A. Application of ultra performance liquid chromatography-photodiode detector-quadrupole/time of flight-mass spectrometry (uplc-pda-q/tof-ms) method for the characterization of phenolic compounds of lepidium sativum l. Sprouts. Eur. Food Res. Technol. 2013, 236, 699–706. [Google Scholar] [CrossRef] [Green Version]
  71. Kim, I.; Lee, J. Variations in anthocyanin profiles and antioxidant activity of 12 genotypes of mulberry (morus spp.) fruits and their changes during processing. Antioxidants 2020, 9, 242. [Google Scholar] [CrossRef] [Green Version]
  72. Rengasamy, K.R.; Amoo, S.O.; Aremu, A.O.; Stirk, W.A.; Gruz, J.; Šubrtová, M.; Doležal, K.; Van Staden, J. Phenolic profiles, antioxidant capacity, and acetylcholinesterase inhibitory activity of eight south african seaweeds. J. Appl. Phycol. 2015, 27, 1599–1605. [Google Scholar] [CrossRef]
  73. Lever, J.; Brkljaca, R.; Kraft, G.; Urban, S. Natural products of marine macroalgae from south eastern australia, with emphasis on the port phillip bay and heads regions of victoria. Mar. Drugs. 2020, 18, 142. [Google Scholar] [CrossRef] [Green Version]
  74. Saunders, G.W.M.; Tanya, E. Refinements for the amplification and sequencing of red algal DNA barcode and redtol phylogenetic markers: A summary of current primers, profiles and strategies. Algae 2013, 28, 31–43. [Google Scholar] [CrossRef] [Green Version]
  75. Heffernan, N.; Smyth, T.J.; Soler-Villa, A.; Fitzgerald, R.J.; Brunton, N.P. Phenolic content and antioxidant activity of fractions obtained from selected irish macroalgae species (laminaria digitata, fucus serratus, gracilaria gracilis and codium fragile). J. Appl. Phycol. 2015, 27, 519–530. [Google Scholar] [CrossRef]
  76. Leyton, A.; Pezoa-Conte, R.; Barriga, A.; Buschmann, A.H.; Maki-Arvela, P.; Mikkola, J.P.; Lienqueo, M.E. Identification and efficient extraction method of phlorotannins from the brown seaweed macrocystis pyrifera using an orthogonal experimental design. Algal Res. 2016, 16, 201–208. [Google Scholar] [CrossRef]
  77. Feng, Y.; Dunshea, F.R.; Suleria, H.A.R. Lc-esi-qtof/ms characterization of bioactive compounds from black spices and their potential antioxidant activities. J. Food Sci. Technol. 2020. [Google Scholar] [CrossRef]
  78. Rebaya, A.; Belghith, S.I.; Baghdikian, B.; Leddet, V.M.; Mabrouki, F.; Olivier, E.; Cherif, J.; Ayadi, M.T. Total phenolic, total flavonoid, tannin content, and antioxidant capacity of halimium halimifolium (cistaceae). J. Appl. Pharm. Sci. 2014, 5, 52–57. [Google Scholar]
  79. Matanjun, P.; Mohamed, S.; Mustapha, N.M.; Muhammad, K.; Ming, C.H. Antioxidant activities and phenolics content of eight species of seaweeds from north borneo. J. Appl. Phycol. 2008, 20, 367. [Google Scholar] [CrossRef]
Figure 1. The LC-ESI-QTOF-MS/MS characterization of p-hydroxybenzoic acid; (a) A chromatograph of p-hydroxybenzoic acid (Compound 5, Table 3), Retention time (RT = 32.906 min) in the negative mode of ionization [M − H] tentatively identified in Ulva sp.; (b) Mass spectra of p-hydroxybenzoic acid with observed/precursor of m/z 137.0240 in Ulva sp.; (c) MS/MS spectrum of p-hydroxybenzoic acid reflecting the product ion of m/z 93, confirmation via online LC-MS library and database; (d) Fragmentation of p-hydroxybenzoic acid in negative mode [M − H], with observed/precursor of m/z 137, showing product ion of m/z 93 due to the loss of a CO2 (44 Da).
Marinedrugs 18 00331 g001aMarinedrugs 18 00331 g001b
Table 1. Phenolic content estimated in the seaweeds investigated in this study.
Samples.TPC (μg GAE/g)TFC (μg QE/g)TTC (μg CE/g)
Green seaweeds
Ulva sp.14.80 ± 0.54 d9.80 ± 1.96 de-
Caulerpa sp.4.30 ± 0.45 d0.73 ± 0.08 f3.31 ± 7.02 b
Codium sp.2.29 ± 0.26 d1.11 ± 0.63 f-
Red seaweeds *
Dasya sp.260.15 ± 2.25 c29.96 ± 0.48 c24.90 ± 3.46 b
Grateloupia sp.524.56 ± 0.46 b54.43 ± 0.74 a-
Centroceras sp.49.31 ± 2.17 d42.55 ± 0.52 b4.45 ± 4.37 b
Brown seaweeds *
Ecklonia sp.1044.36 ± 2.54 a13.87 ± 1.18 d166.87 ± 23.24 a
Sargassum sp.22.27 ± 0.15 d3.88 ± 0.27 ef5.62 ± 0.01 b
The data are shown as mean ± standard error (n = 3); the superscript letters (a–f), indicate the means within a column with significant difference (p < 0.05) using a one-way analysis of variance (ANOVA) and Tukey’s test. Data of seaweed is reported on a fresh weight basis. *: total polyphenol content of brown seaweeds was significantly higher than green and red seaweeds; total flavonoid content of red seaweeds was significantly higher than green and brown seaweeds (p < 0.05). The phenolic content, as measured by total phenolic content (TPC), total flavonoid content (TFC), total tannin contents (TTC). GAE stands for gallic acid equivalents, QE stands for quercetin equivalents and CE stands for catechin equivalents.
Table 2. Antioxidant activities detected in the seaweeds investigated in this study.
SamplesABTS (μg AAE/g)DPPH (μg AAE/g)FRAP (μg AAE/g)
Green seaweeds
Ulva sp.14.24 ± 0.93 d-4.10 ± 1.45 bc
Caulerpa sp.20.93 ± 2.62 d-0.53 ± 0.05 c
Codium sp.10.05 ± 6.65 d-1.07 ± 0.62 c
Red seaweeds
Dasya sp.179.63 ± 9.3 c12.71 ± 0.83 b27.39 ± 1.47 bc
Grateloupia sp.243.06 ± 3.78 b19.12 ± 0.64 b35.05 ± 1.54 b
Centroceras sp.27.91 ± 3.79 d6.30 ± 0.73 b1.86 ± 1.15 c
Brown seaweeds *
Ecklonia sp.957.85 ± 0.36 a510.32 ± 3.38 a170.03 ± 2.04 a
Sargassum sp.42.62 ± 3.09 d13.71 ± 5.67 b4.76 ± 0.48 bc
The data are shown as mean ± standard error (n = 3); the superscript letters (a–d), indicate the means within a column with significant difference (p < 0.05) using a one-way analysis of variance (ANOVA) and Tukey’s test. Data of seaweed is reported on a fresh weight basis. *: Antioxidant capacities of brown seaweeds are significantly higher than that of green and red seaweeds (p < 0.05). DPPH stands for 2,2-diphenyl-1-picrylhydrazyl, ABTS stands for 2,2′-azino-bis-3-ethylbenzothiazoline-6-sulfonic acid and FRAP stands for ferric reducing antioxidant power assay. AAE stands for ascorbic acid equivalents.
Table 3. Characterization of phenolic compounds in seaweeds by using LC-ESI-QTOF-MS/MS.
No.Proposed CompoundsMolecular FormulaRT (min)Ionization (ESI+/ESI-)Molecular WeightTheoretical (m/z)Observed (m/z)Mass Error (ppm)MS/MS Product IonsSeaweeds
Phenolic acid
Hydroxybenzoic acids
1Vanillic acid 4-sulfateC8H8O7S9.112[M − H]247.9991246.9918246.99252.83217, 203, 167* Sargassum sp., Centroceras sp., Ulva sp.
2Gallic acidC7H6O59.885** [M − H]170.0215169.0142169.0138−2.37125Centroceras sp.
34-Hydroxybenzoic acid 4-O-glucosideC13H16O811.515[M − H]300.0845299.0772299.07782.01255, 137Sargassum sp.
4Protocatechuic acid 4-O-glucosideC13H16O913.546** [M − H]316.0794315.0721315.0719−0.63153* Centroceras sp., Grateloupia sp.
5p-Hydroxybenzoic acidC7H6O332.906[M − H]138.0317137.0244137.0240−2.9193* Ulva sp., Caulerpa sp., Centroceras sp.
6Ellagic acid glucosideC20H16O1338.451[M − H]464.0591463.0518463.05180.01301Ecklonia sp.
Hydroxycinnamic acids
73-Sinapoylquinic acidC18H22O107.005** [M − H]398.1213397.1140397.11441.01223, 179* Centroceras sp., Ecklonia sp.
8Cinnamoyl glucoseC15H18O78.861** [M − H]310.1053309.098309.09923.88147, 131, 103* Codium sp., Ulva sp.
9Caffeoyl glucoseC15H18O910.983** [M − H]342.0951341.0878341.08821.17179, 161* Ecklonia sp., Centroceras sp.
10Caffeic acid 3-O-glucuronideC15H16O1014.259** [M − H]356.0743355.0670355.06710.28179Caulerpa sp.
11Chlorogenic acidC16H18O915.004** [M − H]354.0951353.0878353.0862−4.53253, 190, 144* Centroceras sp., Caulerpa sp.
12Caffeic acidC9H8O418.274[M − H]180.0423179.0350179.03500.01151, 143, 133Caulerpa sp.
13Caffeic acid 4-sulfateC9H8O7S18.291[M − H]259.9991258.9918258.99294.25215, 179, 135Caulerpa sp.
14Caffeoyl tartaric acidC13H12O924.061** [M − H]312.0481311.0408311.0403−1.61161* Grateloupia sp., Centroceras sp.
15Isoferulic acid 3-sulfateC10H10O7S24.520** [M − H]274.0147273.0074273.00864.4193, 149Caulerpa sp.
16Sinapic acidC11H12O525.852** [M − H]224.0685223.0612223.06214.03205, 179, 163* Ulva sp., Caulerpa sp., Grateloupia sp.
17Ferulic acidC10H10O432.604[M − H]194.0579193.0506193.05133.63178, 149, 134Caulerpa sp.
18Coumaric acidC9H8O333.797** [M − H]164.0473163.0400163.04063.68119* Ulva sp., Ecklonia sp.
19SinapineC16H24NO588.066[M + H]+310.1652310.1654310.1646−2.58251, 207, 175Codium sp.
Hydroxyphenylpentanoic acids
205-(3′,5′-dihydroxyphenyl)-γ-valerolactone 3-O-glucuronideC17H20O1014.855** [M − H]384.1056383.0983383.10014.70221, 206, 191* Ecklonia sp., Codium sp.
215-(3′,4′-dihydroxyphenyl)-valeric acidC11H14O451.563** [M − H]210.0892209.0819209.08210.96165, 150Caulerpa sp.
Hydroxyphenylacetic acids
222-Hydroxy-2-phenylacetic acidC8H8O36.18** [M + H]+152.0473153.0546153.0552.61125* Centroceras sp., Caulerpa sp., Sargassum sp.
Flavonoids
Anthocyanins
23Delphinidin 3-O-sambubiosideC26H29O169.327[M + H]+597.1464597.1456597.14732.85303, 257, 229Grateloupia sp.
24Isopeonidin 3-O-arabinosideC21H21O1041.658[M + H]+433.1134433.1135433.11360.23271, 253, 243Centroceras sp.
25Malvidin 3-O-glucosideC23H25O1254.152[M + H]+493.1343493.1346493.1343−0.61331Centroceras sp.
Flavanols
26GallocatechinC15H14O77.604** [M − H]306.0740305.0667305.06680.33261, 219* Caulerpa sp., Ulva sp., Dasya sp., Ecklonia sp., Sargassum sp.
273′-O-MethylcatechinC16H16O617.857** [M − H]304.0947303.0874303.08863.96271, 163Grateloupia sp.
28Catechin (isomer)C15H14O645.118[M − H]290.0790289.0717289.07314.84245, 205, 179Caulerpa sp.
Flavonols
29Quercetin 3-O-(6”-malonyl-glucoside)C24H22O159.902[M − H]550.0959549.0886549.08870.18463, 301, 161* Centroceras sp., Caulerpa sp.
305,3′,4′-Trihydroxy-3-methoxy-6:7-methylenedioxyflavone 4’-O-glucuronideC23H20O1433.878[M − H]520.0853519.0780519.0779−0.19343Ecklonia sp.
313,7-DimethylquercetinC17H14O780.642[M − H]330.0740329.0667329.06742.13314, 299, 271Centroceras sp.
Flavones
32RhoifolinC27H30O1444.036** [M − H]578.1636577.1563577.15884.33413, 269Centroceras sp.
Isoflavonoids
33SativanoneC17H16O54.240[M − H]300.0998299.0925299.0918−2.34284, 269, 225Ecklonia sp.
34Glycitein 7-O-glucuronideC22H20O114.454** [M − H]460.1006459.0933459.0923−2.18283, 268, 117Centroceras sp.
353′,4′,5,7-TetrahydroxyisoflavanoneC15H12O64.640** [M − H]288.0634287.0561287.0556−1.74269, 259*Caulerpa sp., Grateloupia sp., Centroceras sp.
363’-O-MethylequolC16H16O44.803** [M − H]272.1049271.0976271.0972−1.48147, 123, 121*Ecklonia sp., Grateloupia sp.
37DalberginC16H12O49.344** [M − H]268.0736267.0663267.06661.12252, 224, 180* Grateloupia sp., Centroceras sp.
38Dihydrobiochanin AC16H14O580.715** [M − H]286.0841285.0768285.07711.05270* Codium sp., Centroceras sp.
393′-HydroxydaidzeinC15H10O586.956[M − H]270.0528269.0455269.04570.74151, 117, 107* Grateloupia sp., Centroceras sp., Caulerpa sp., Ecklonia sp.
Other polyphenols
Hydroxybenzaldehydes
40p-HydroxybenzaldehydeC7H6O215.921[M − H]122.0368121.0295121.02950.0192, 77* Dasya sp., Ecklonia sp., Codium sp.
Hydroxycoumarins
41Urolithin AC13H8O44.64[M − H]228.0423227.0350227.0341−3.96198, 182Grateloupia sp.
42ScopoletinC10H8O484.705** [M − H]192.0423191.0350191.03521.05176, 147* Codium sp., Grateloupia sp., Sargassum sp.
Phenolic terpenes
43RosmanolC20H26O524.965[M + H]+346.1780347.1853347.1843−2.88301, 231* Dasya sp., Ulva sp., Grateloupia sp., Ecklonia sp., Codium sp.
44CarnosolC20H26O485.931** [M − H]330.1831329.1758329.1747−3.34287, 286, 285* Codium sp., Caulerpa sp.
45Carnosic acidC20H28O486.958** [M − H]332.1988331.1915331.1912−0.91287, 269* Ecklonia sp., Dasya sp., Codium sp., Sargassum sp.
Tyrosols
46Hydroxytyrosol 4-O-glucosideC14H20O836.653** [M − H]316.1158315.1085315.10911.90153, 123* Centroceras sp., Dasya sp., Grateloupia sp., Sargassum sp.
473,4-DHPEA-EDAC17H20O687.423[M − H]320.1260319.1187319.12004.07301, 275, 195Caulerpa sp.
Other polyphenols
483,4-DihydroxyphenylglycolC8H10O47.005[M − H]170.0579169.0506169.0503−1.77141, 139, 123Centroceras sp.
49PhloroglucinolC6H6O314.793[M − H]126.0317125.0244125.0242−1.5997* Ecklonia sp., Sargassum sp.
50Isopropyl 3-(3,4-dihydroxyphenyl)-2-hydroxypropanoateC12H16O524.882** [M − H]240.0998239.0925239.0919−2.51195, 155, 99Dasya sp.
Lignans
Lignan derivatives
512′-HydroxyenterolactoneC18H18O57.781[M − H]314.1154313.1081313.10820.32295, 283Grateloupia sp.
52ArctigeninC21H24O68.131** [M − H]372.1573371.1500371.15092.42356, 312, 295* Centroceras sp., Sargassum sp.
53DimethylmatairesinolC22H26O683.663[M + H]+386.1729387.1802387.18050.77372, 369, 357, 329* Caulerpa sp., Dasya sp.
54DeoxyschisandrinC24H32O685.152** [M + H]+416.2199417.2272417.22863.36402, 347, 316, 301* Ecklonia sp., Codium sp., Sargassum sp.
* Compound was detected in more than one seaweed samples, data presented in this table are from asterisk sample. ** Compounds were detected in both negative [M − H] and positive [M + H]+ mode of ionization while only single mode data was presented. RT = stands for “retention time”.
Table 4. Quantification of targeted phenolic compounds by high-performance liquid chromatography (HPLC) in seaweeds.
No.Compound NameStructure
Formula
RT (min)Concentration
(μg/gf.w.)
Seaweed Samples
1Gallic acidC7H6O59.685138.887 ± 0.02Centroceras sp.
2Chlorogenic acidC16H18O915.004122.706 ± 0.01Centroceras sp.
3Caffeic acidC9H8O418.274612.824 ± 0.02Caulerpa sp.
4Caftaric acidC13H12O924.53219.667 ± 0.01Centroceras sp.
5p-hydroxybenzoic acidC7H6O332.906846.083 ± 0.02Ulva sp.
6Coumaric acidC9H8O333.797505.387 ± 0.03Ulva sp.
7CatechinC15H14O664.08129.469 ± 0.03Caulerpa sp.
RT = stands for “retention time”.

