The Advanced Floating Chirality Distance Geometry Approach―How Anisotropic NMR Parameters Can Support the Determination of the Relative Configuration of Natural Products


Abstract
1. Introduction
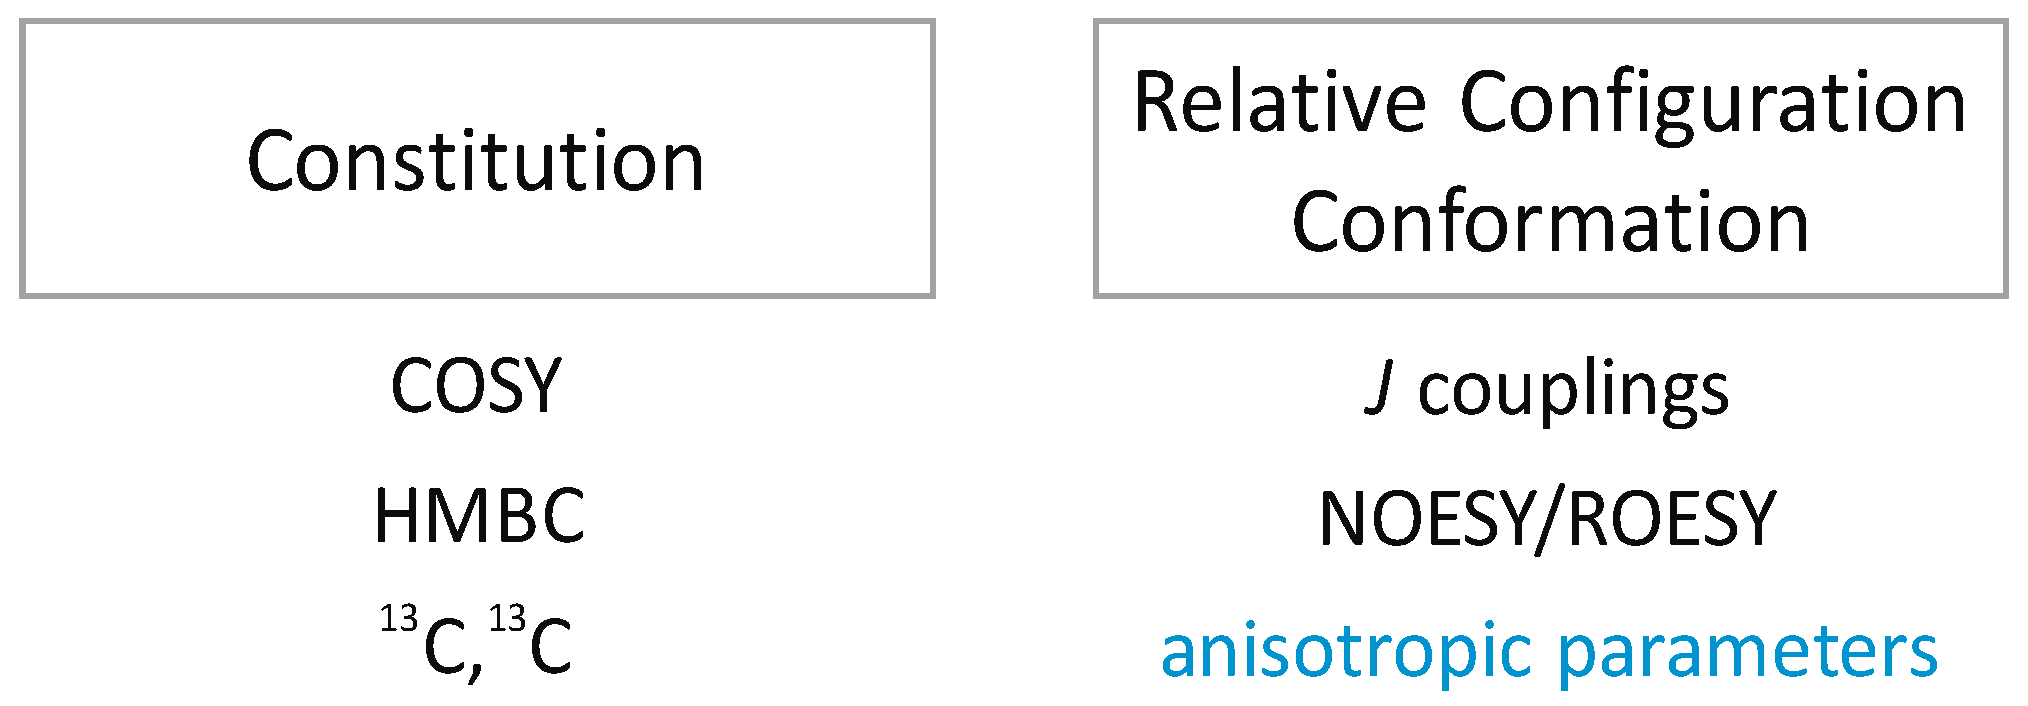
1.1. NOEs/ROEs in Structure Elucidation
1.2. RDCs in Structure Elucidation
2. Results and Discussion
2.1. Configurational Assignment with ROEs Only
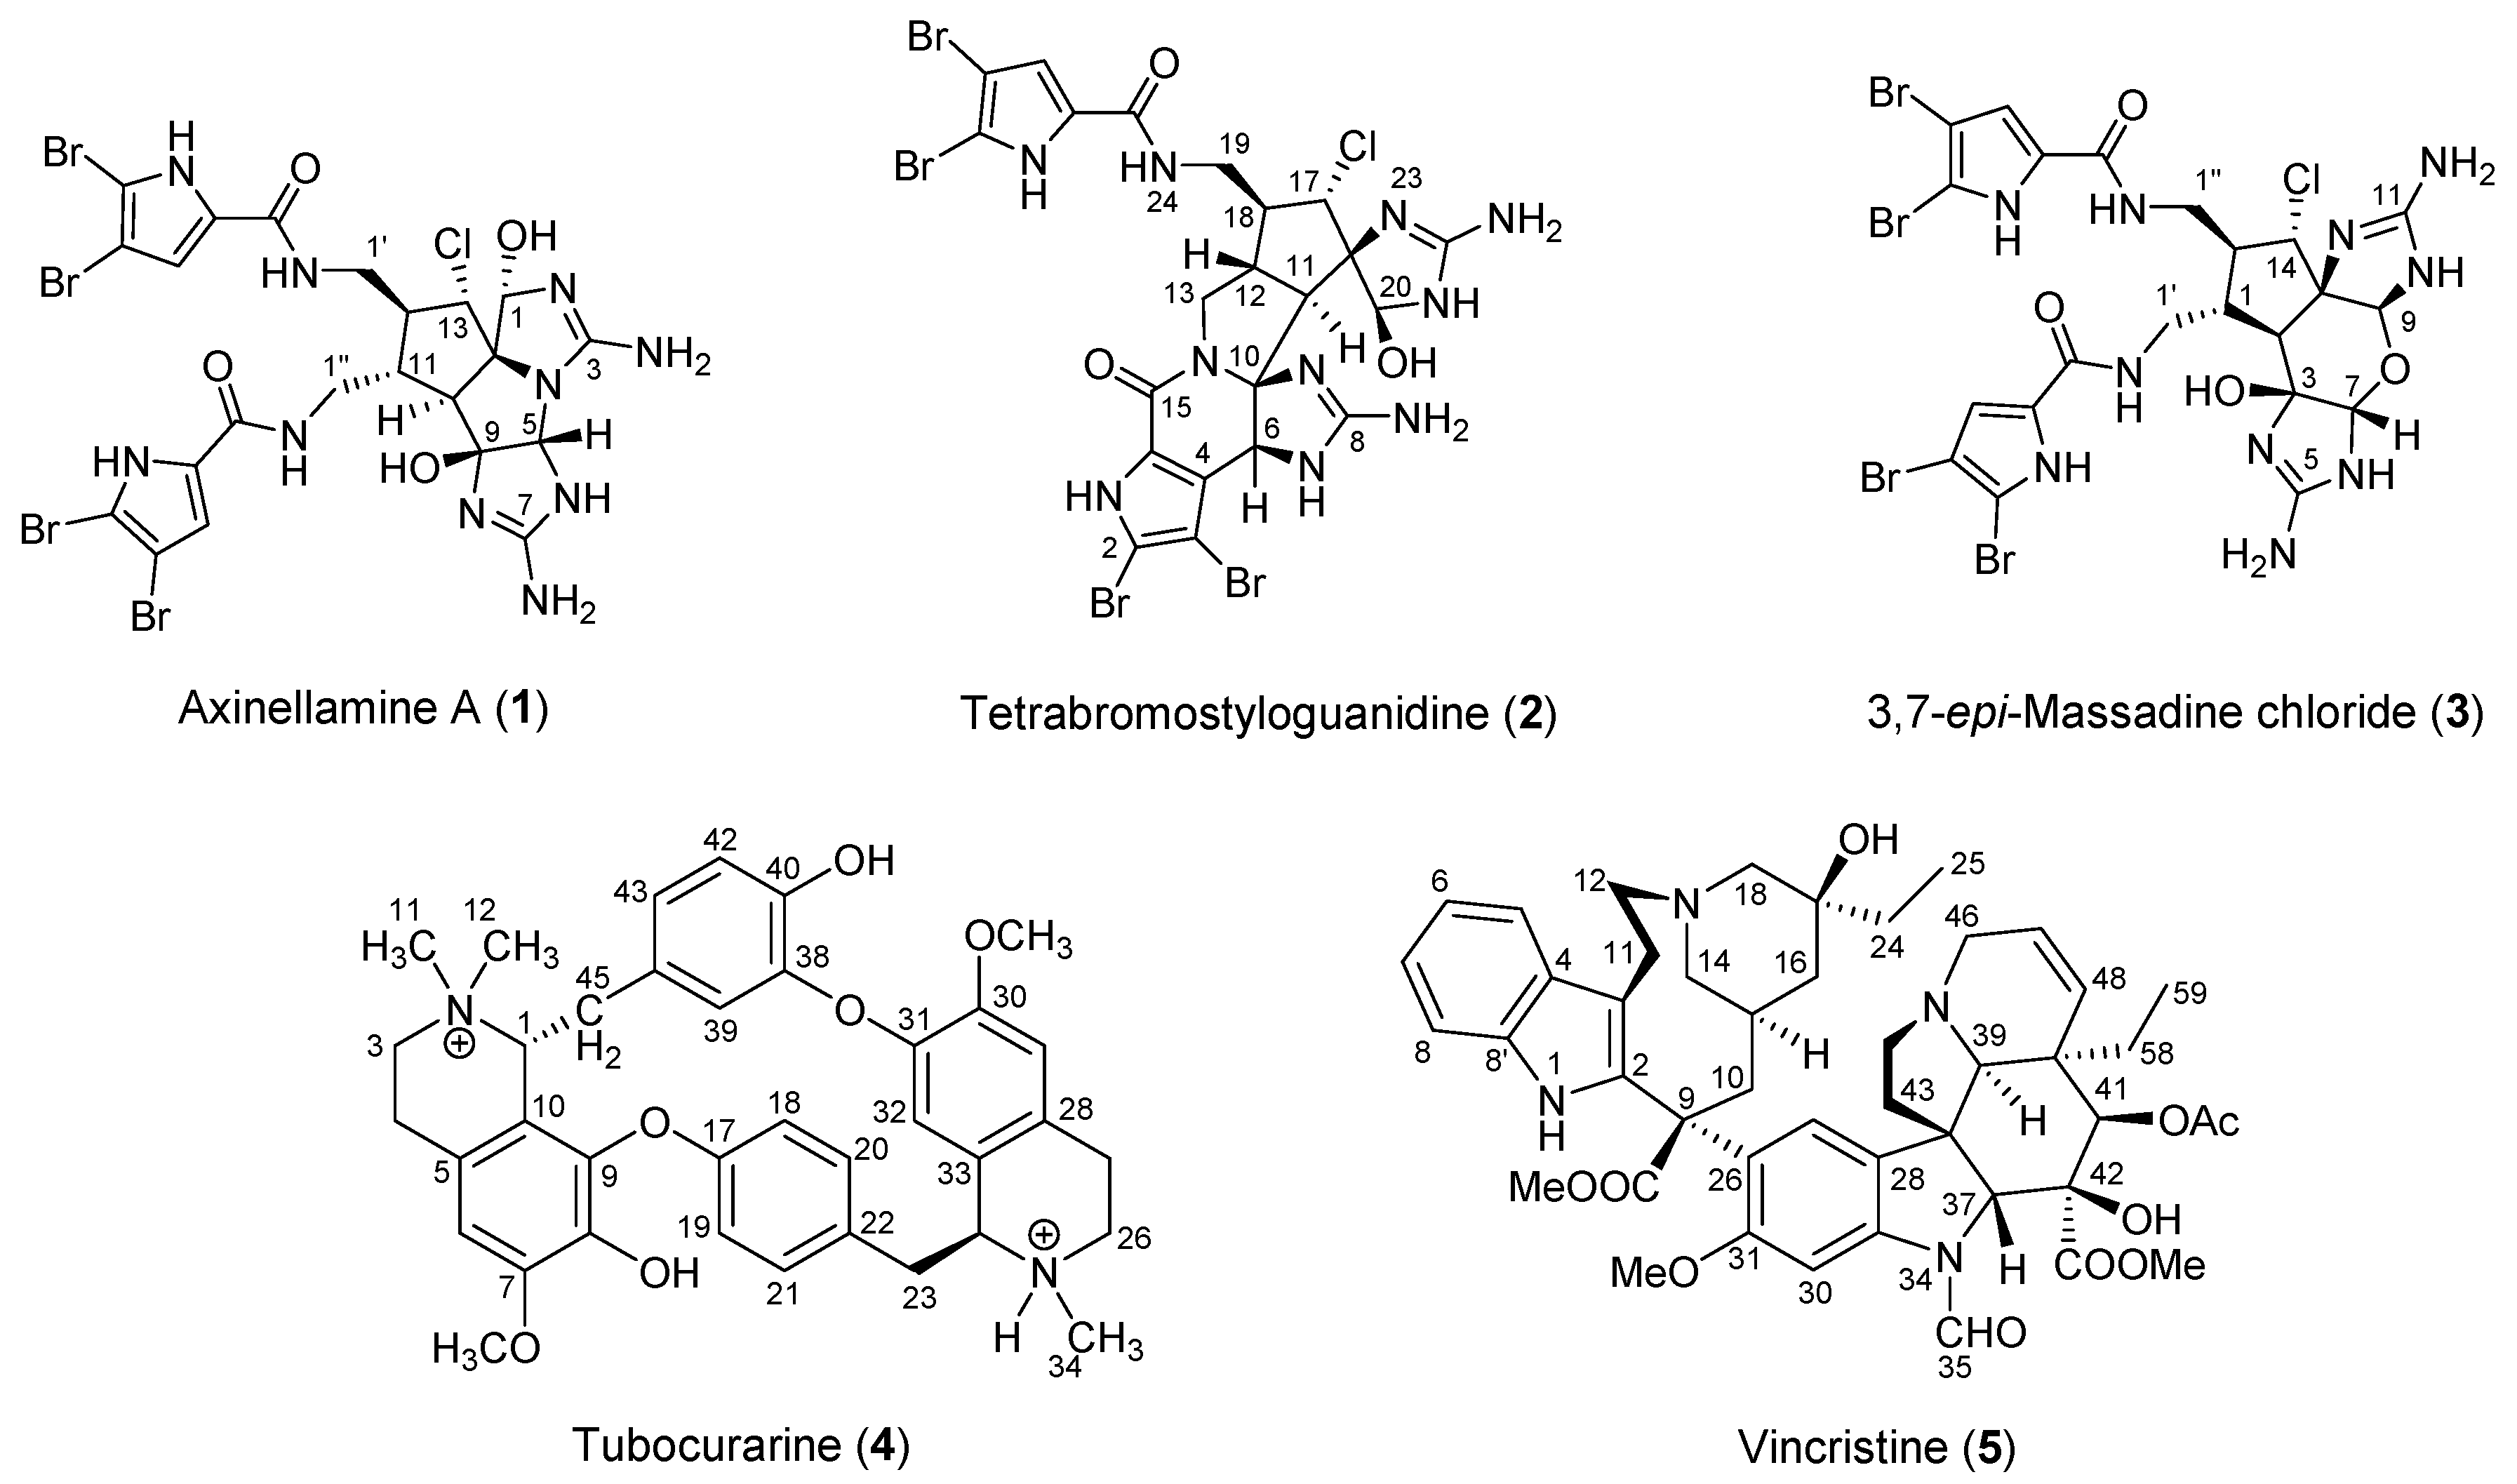
2.1.1. Axinellamine A (1)
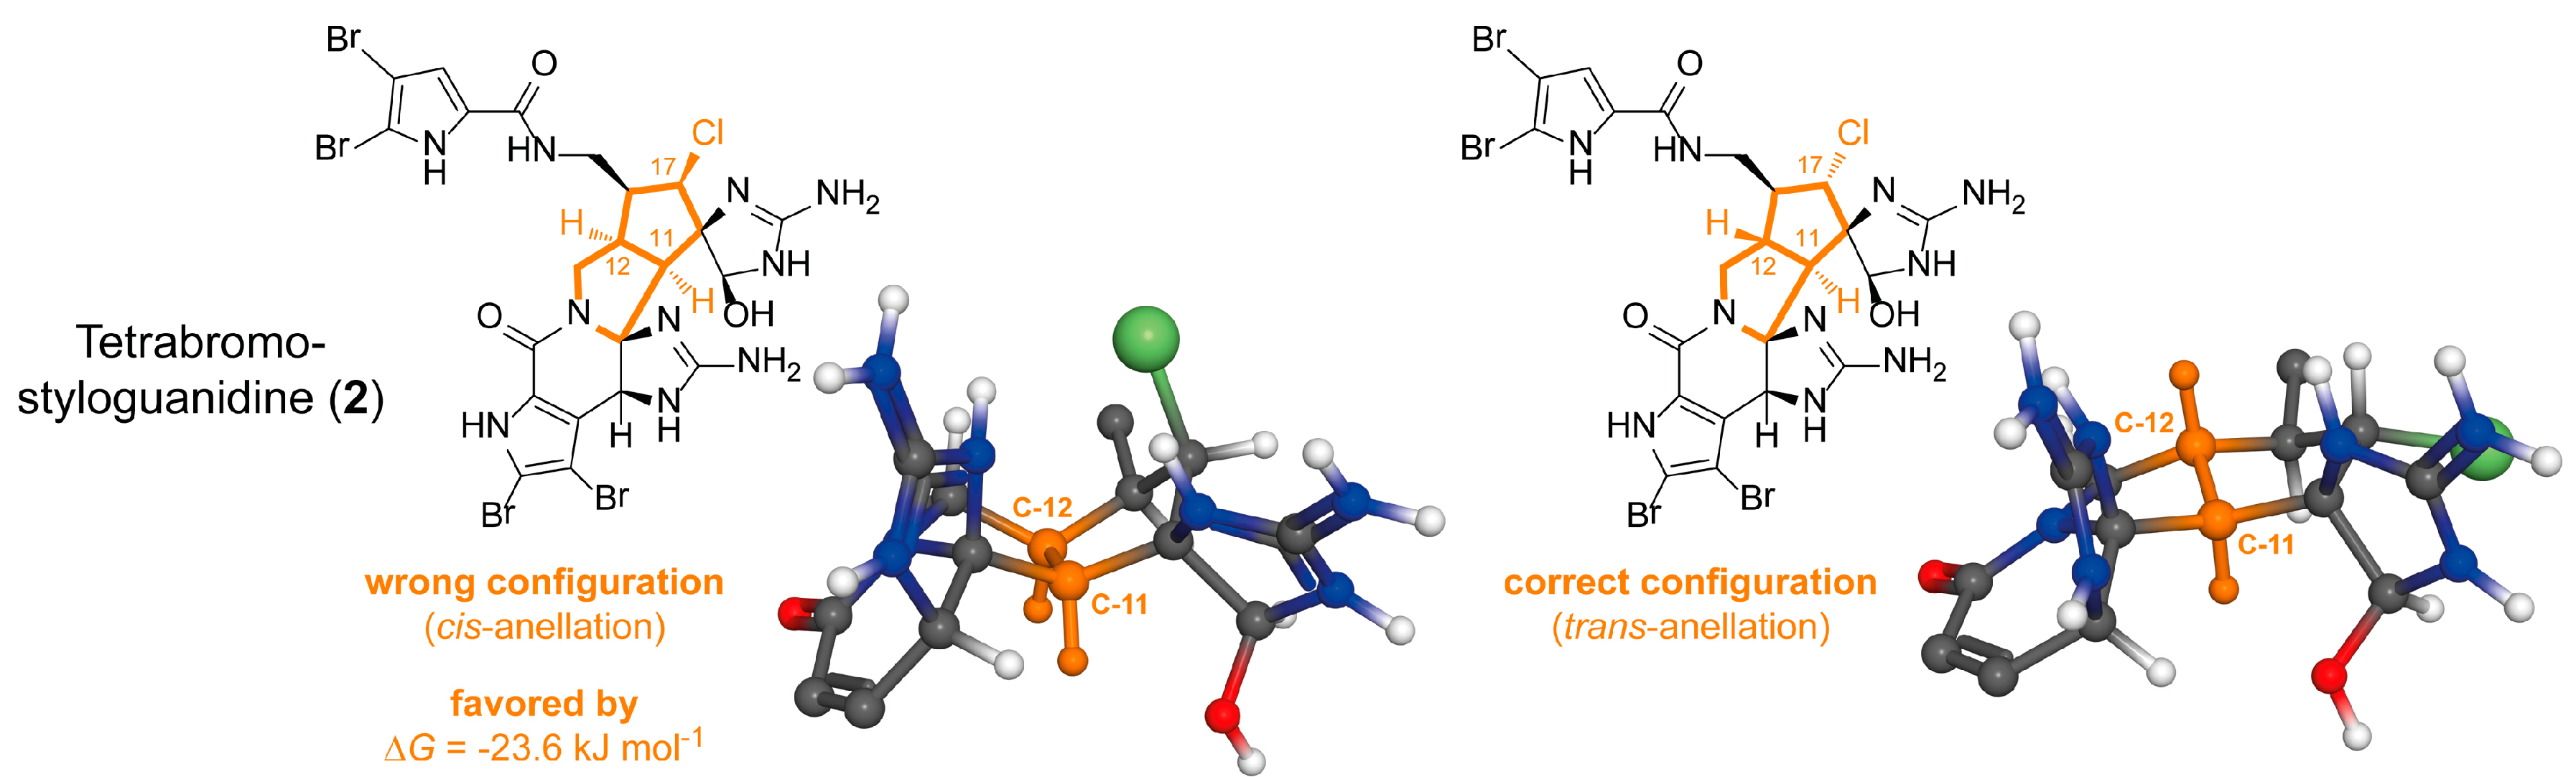
2.1.2. Tetrabromostyloguanidine (2)
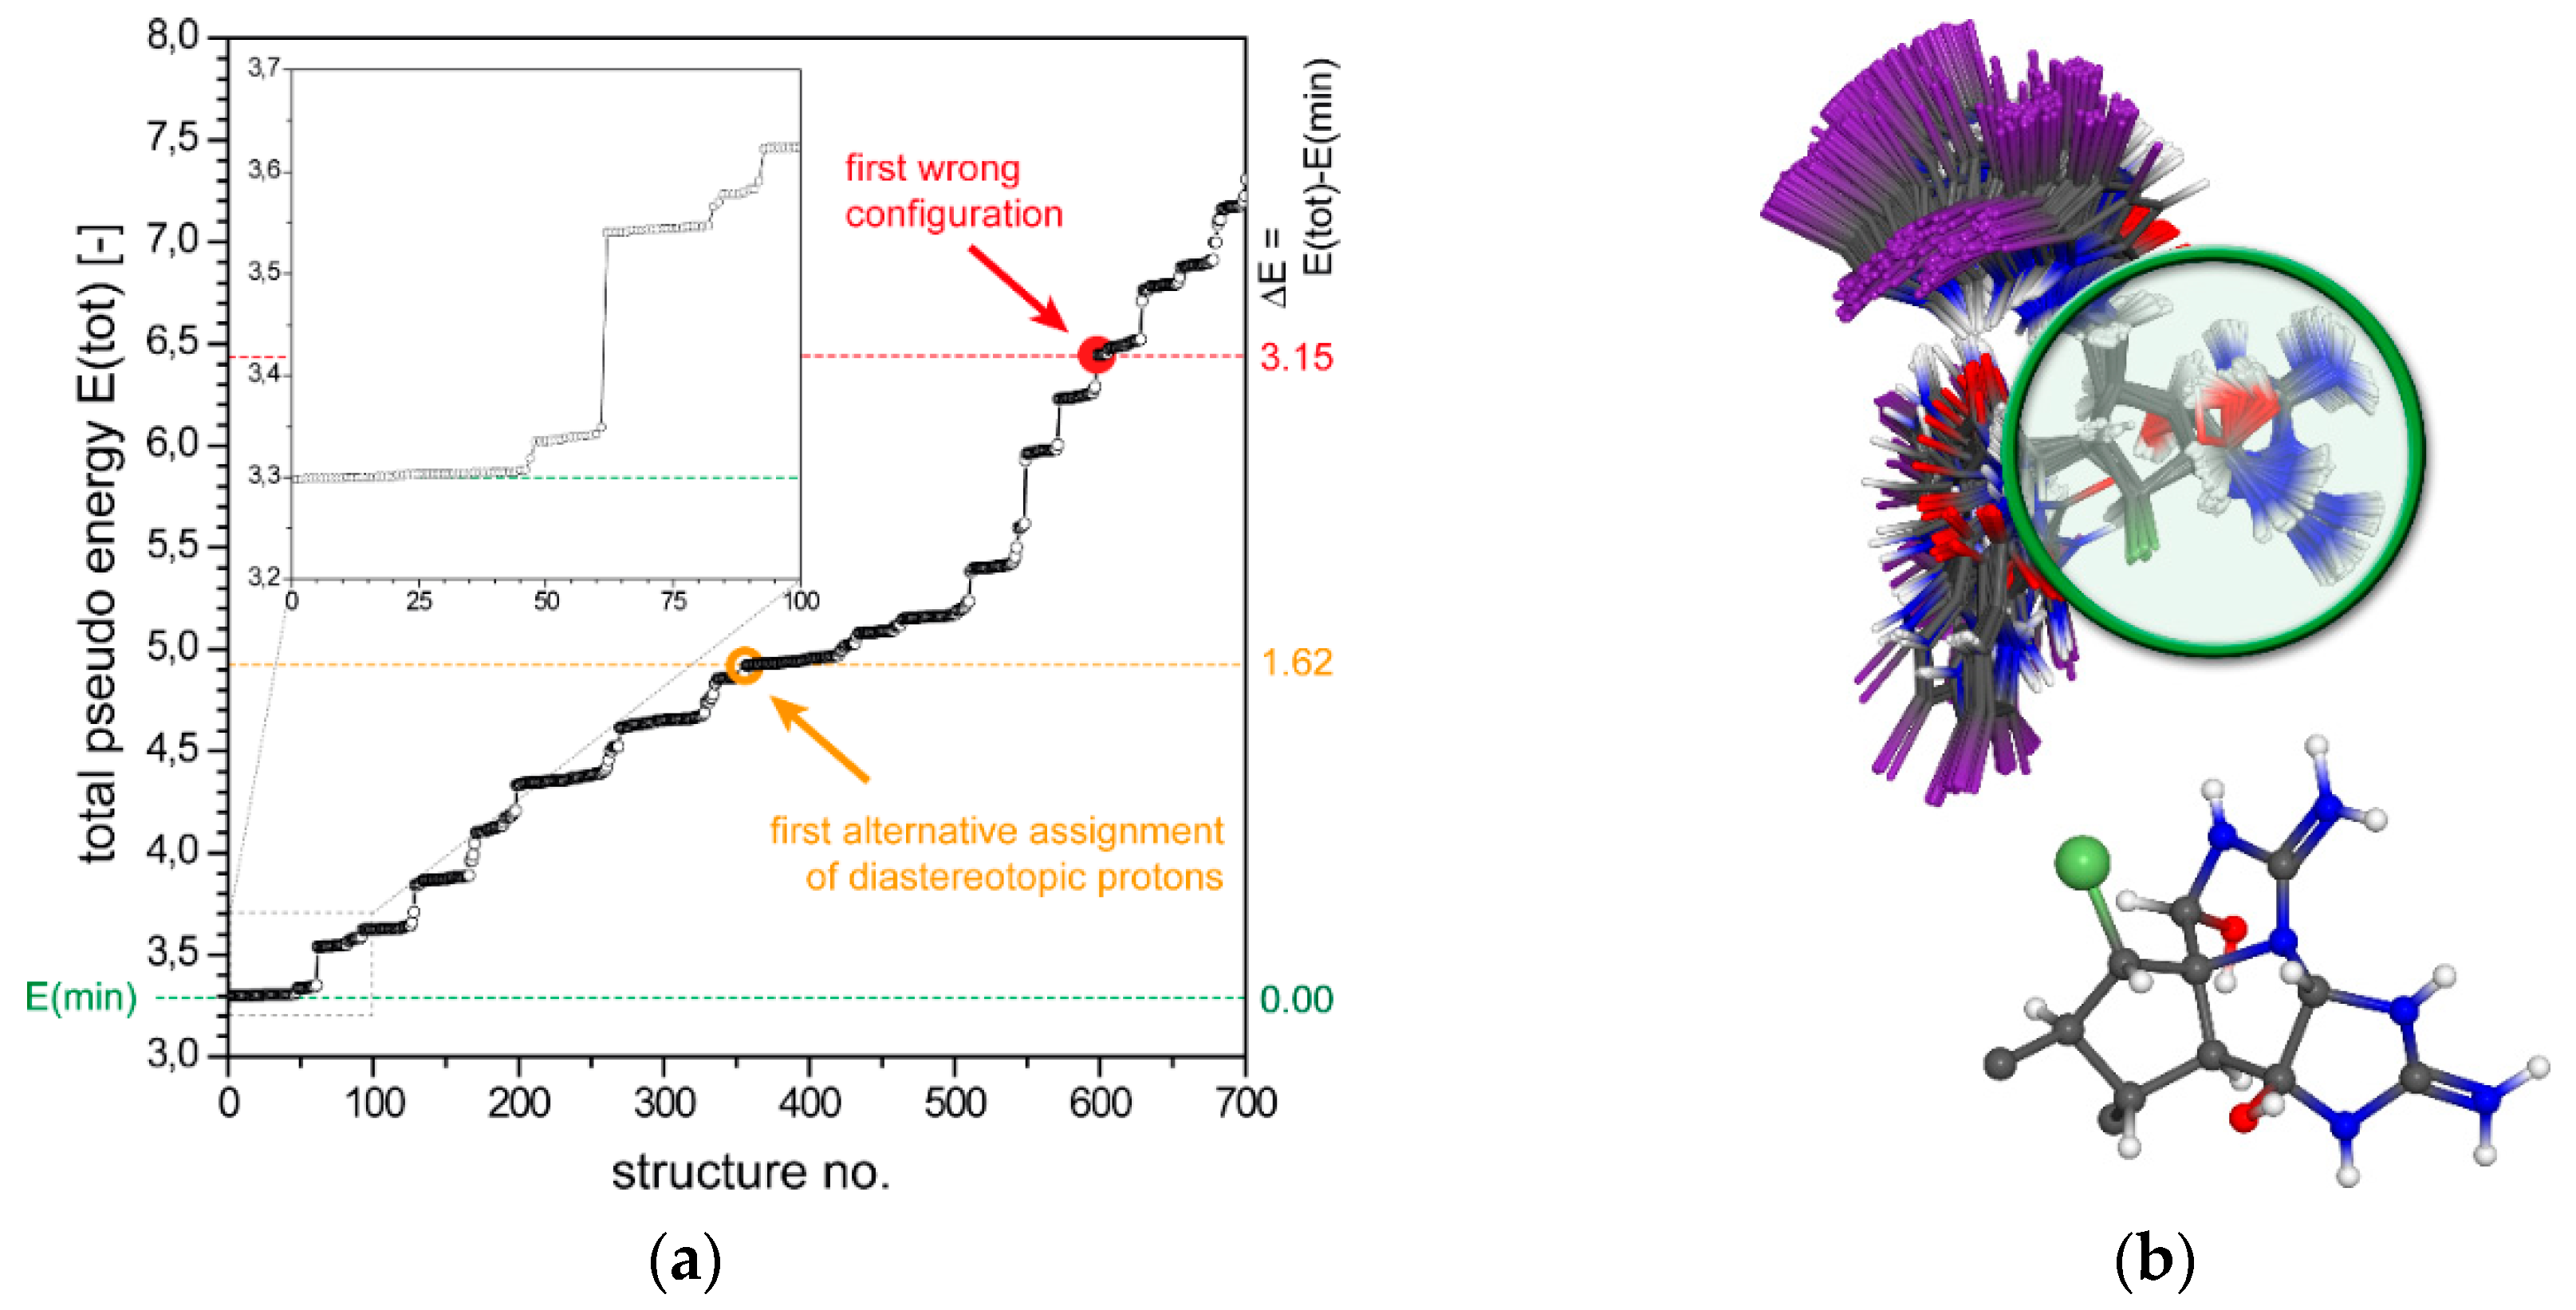
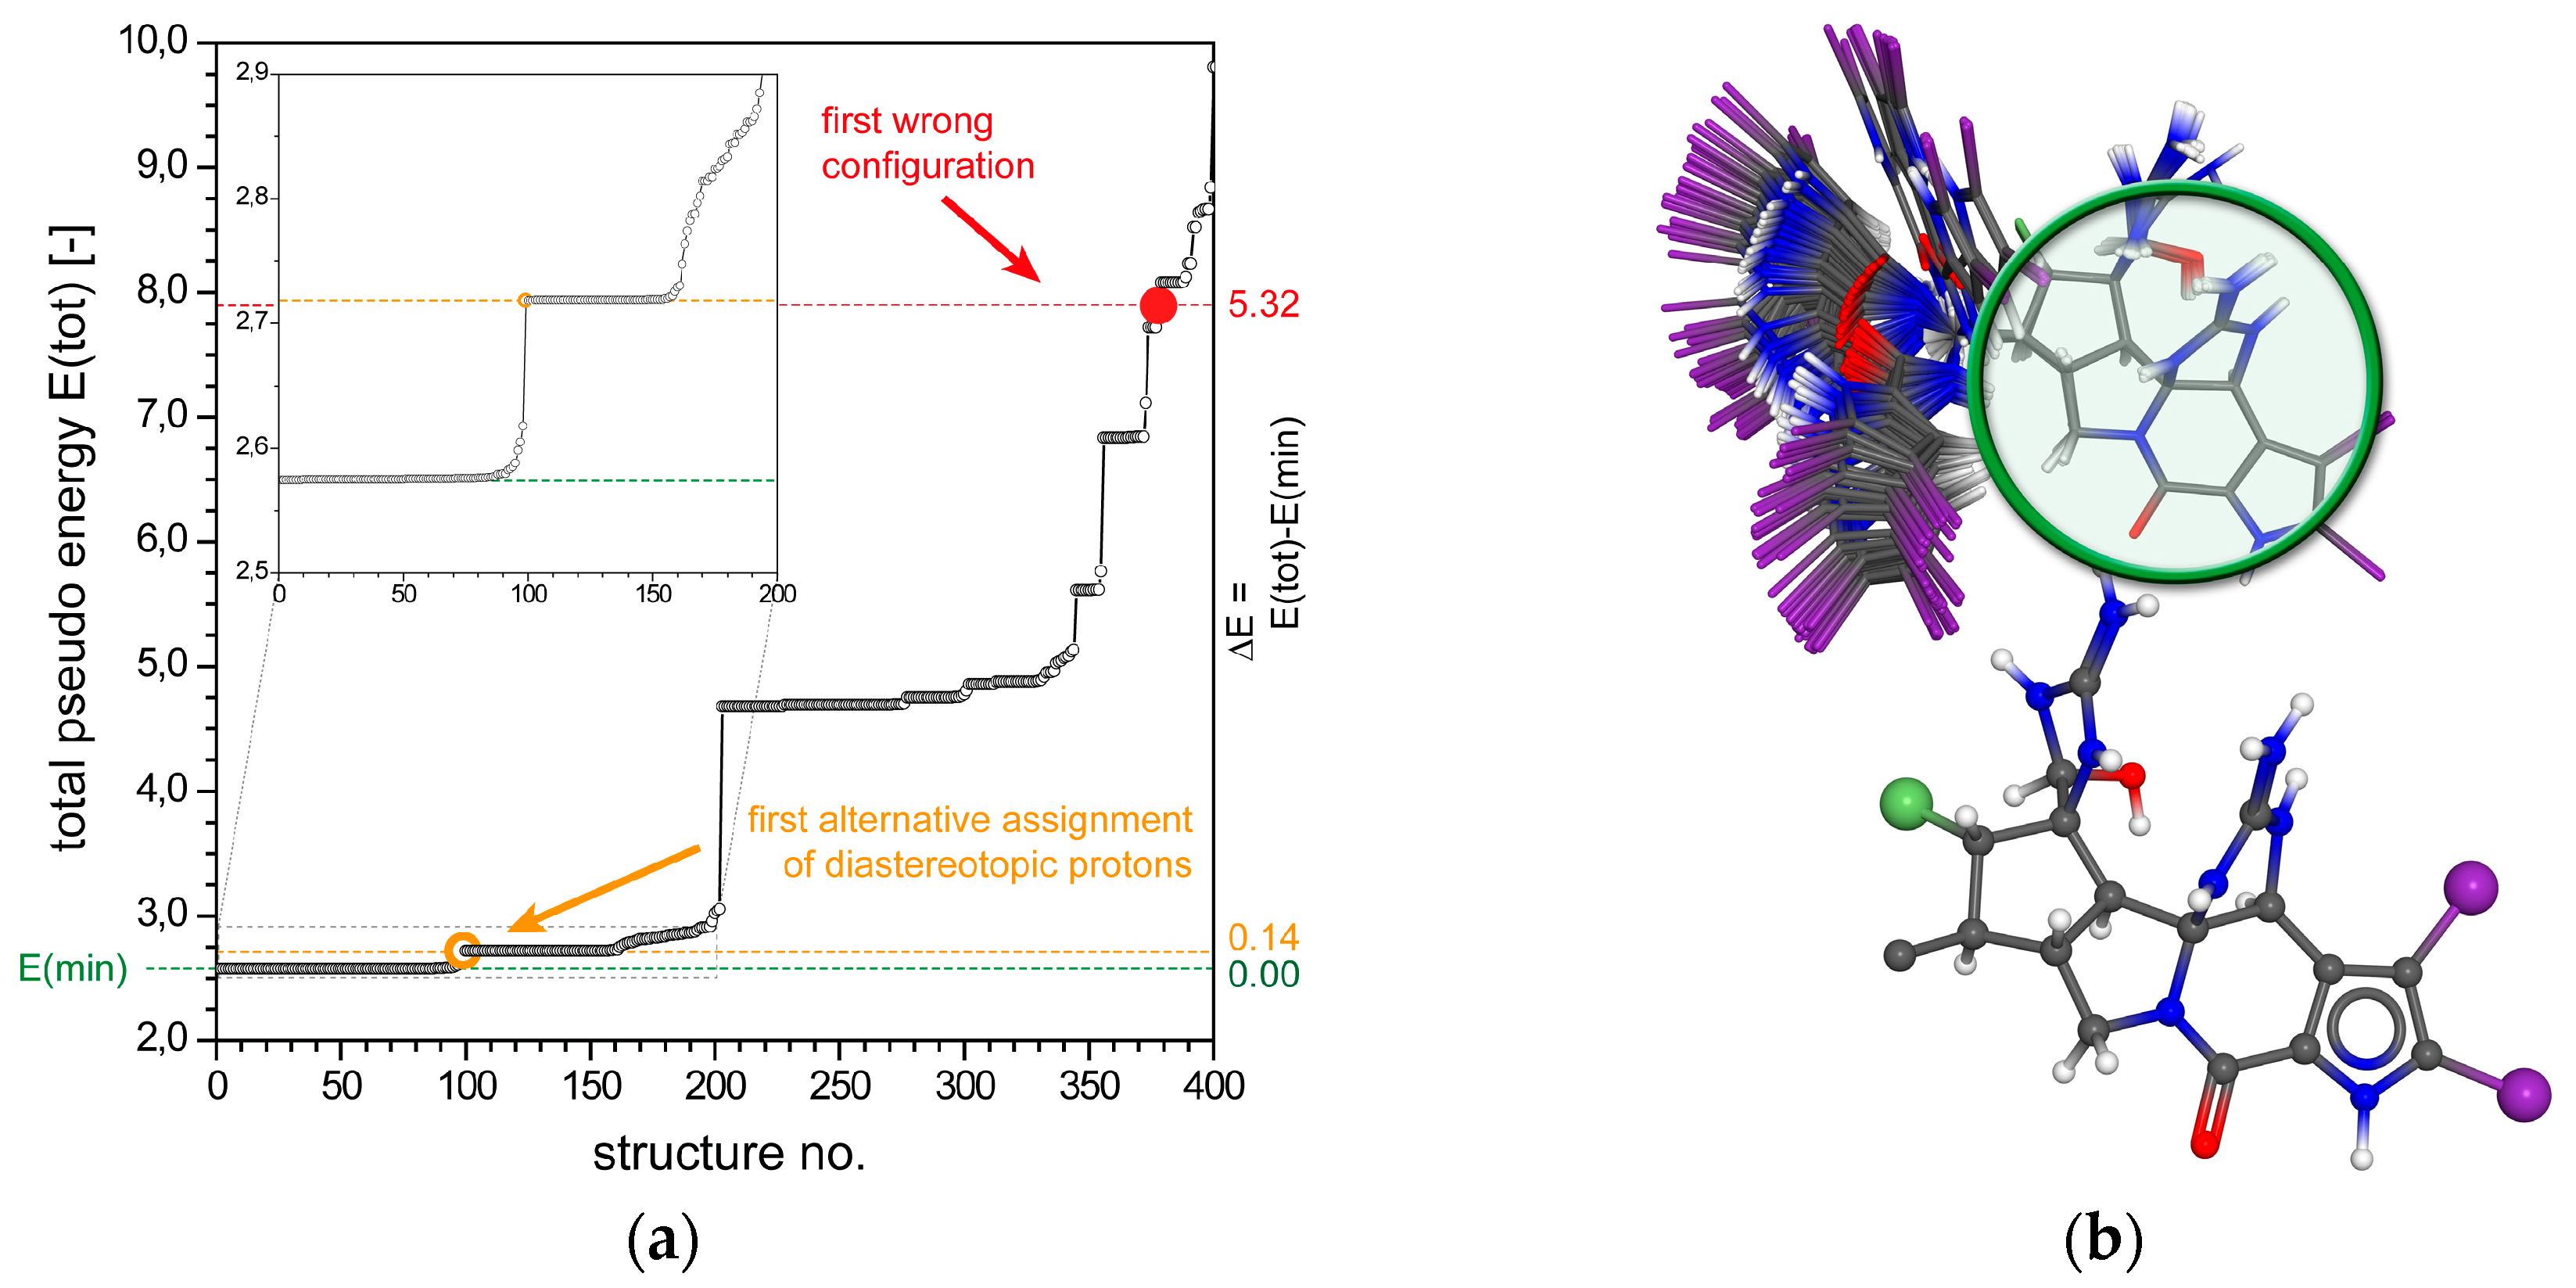
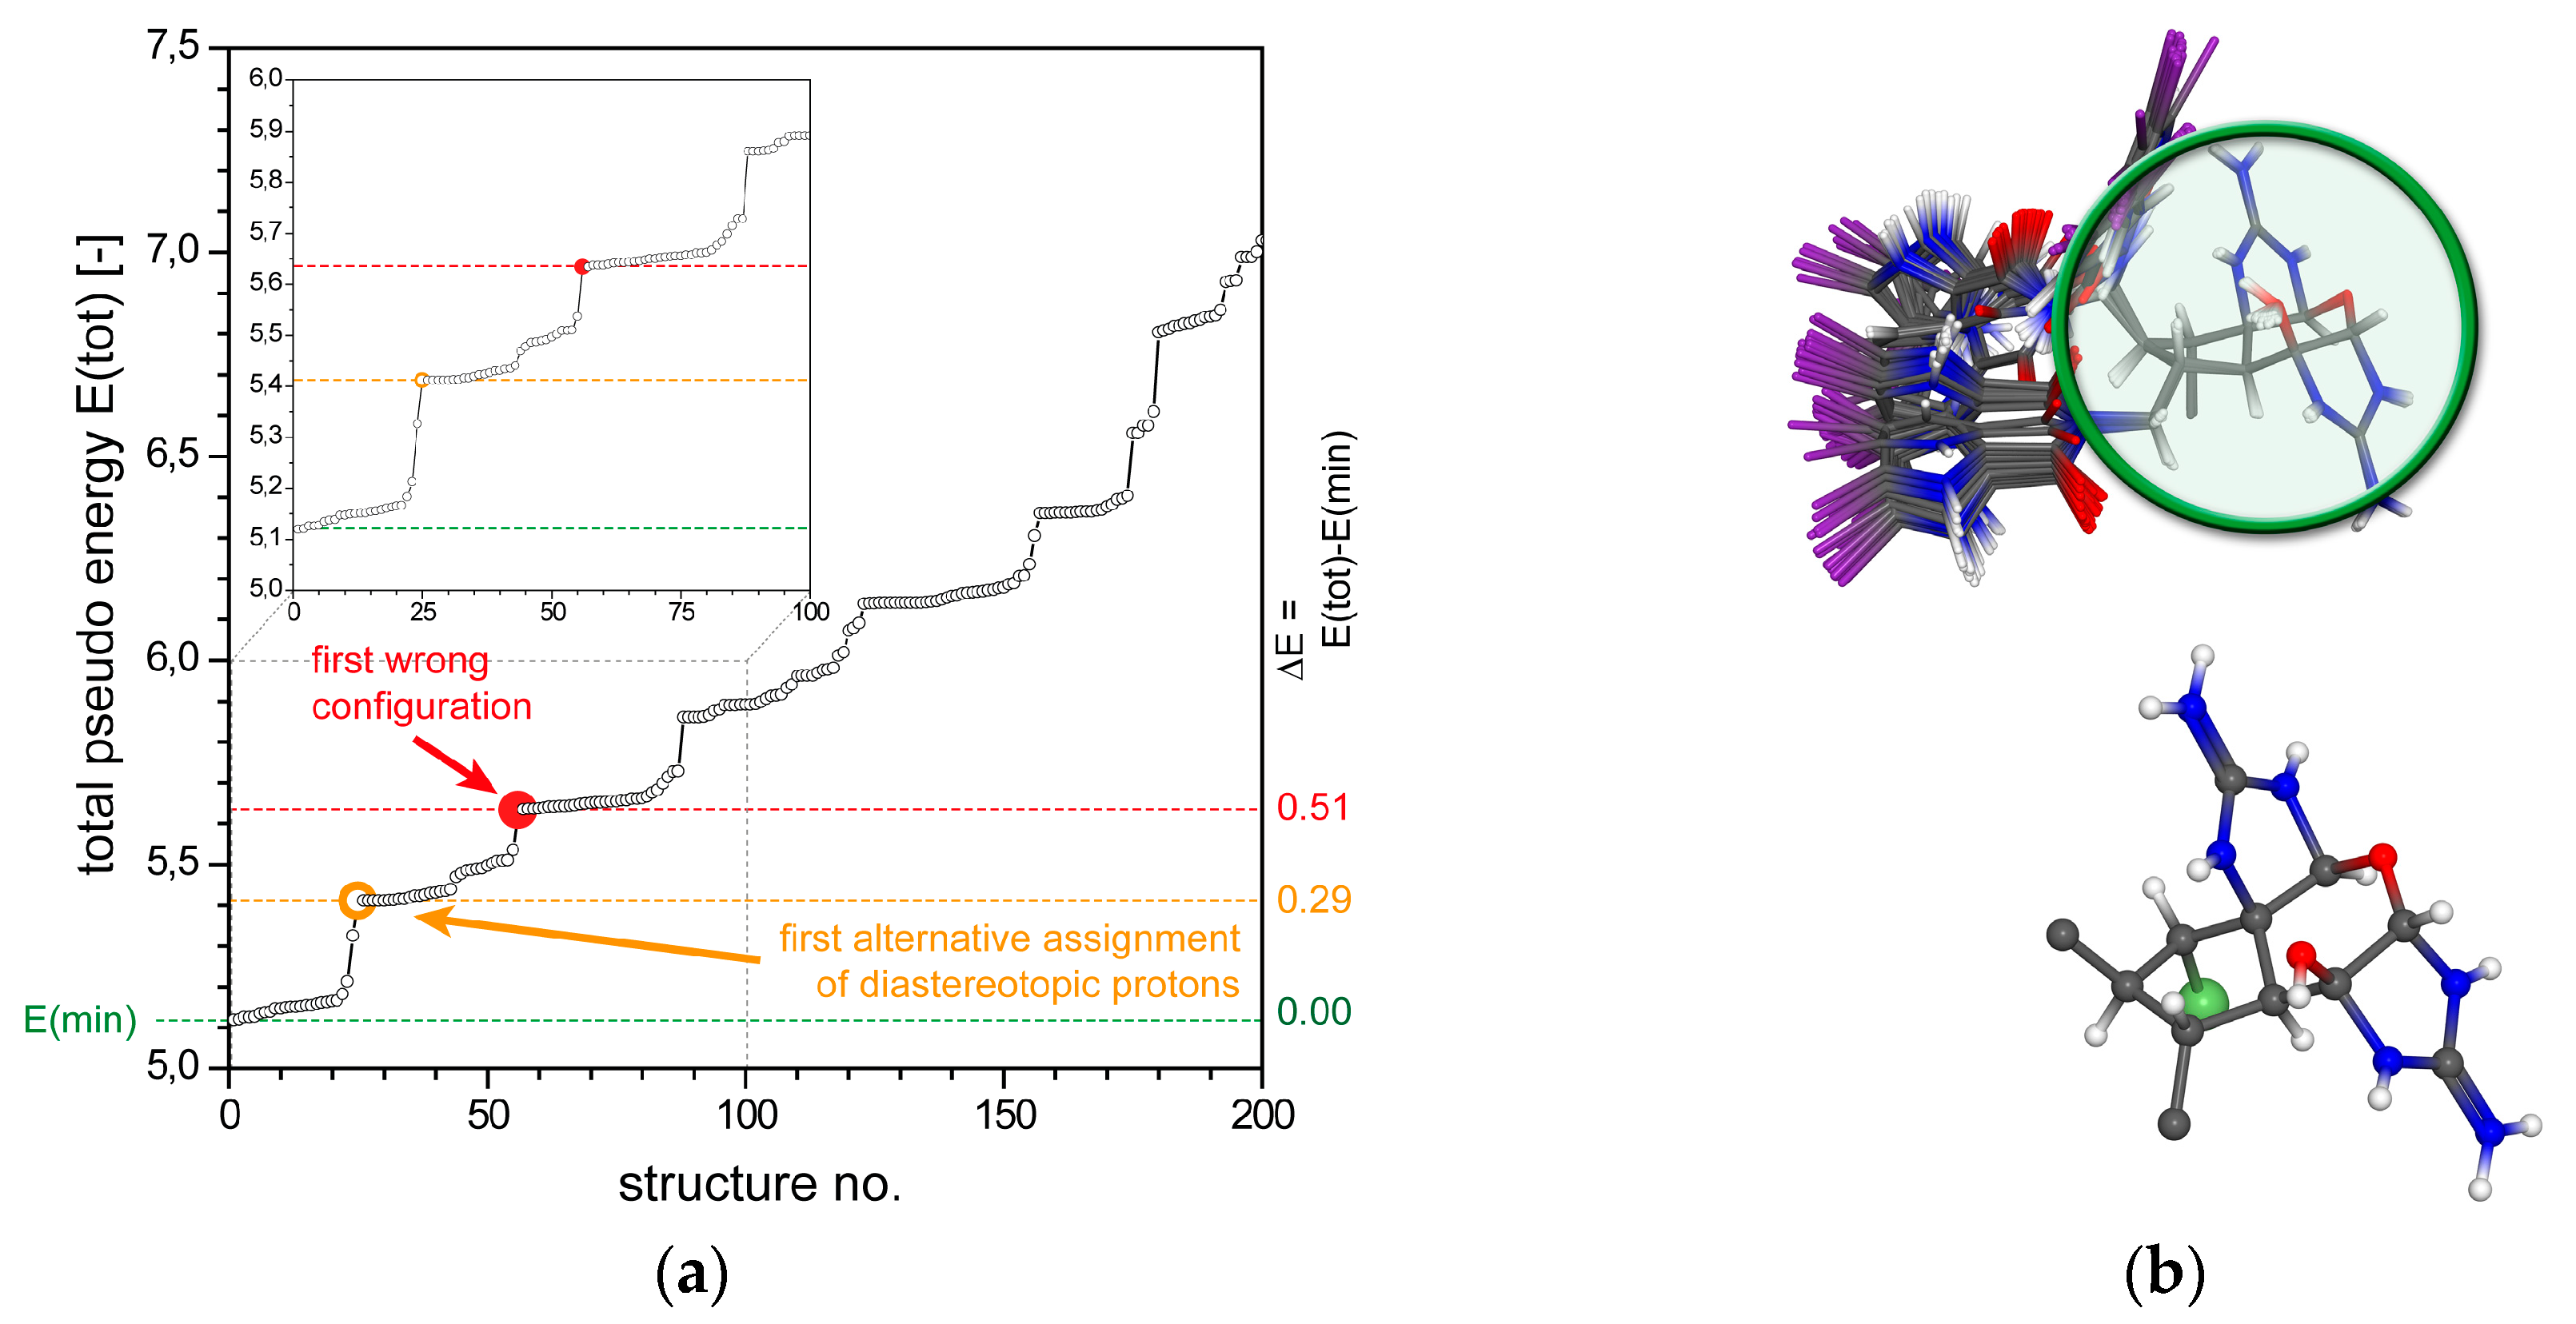
2.1.3. 3,7-epi-Massadine chloride (3)
2.2. Configurational Assignment with NOEs and RDCs
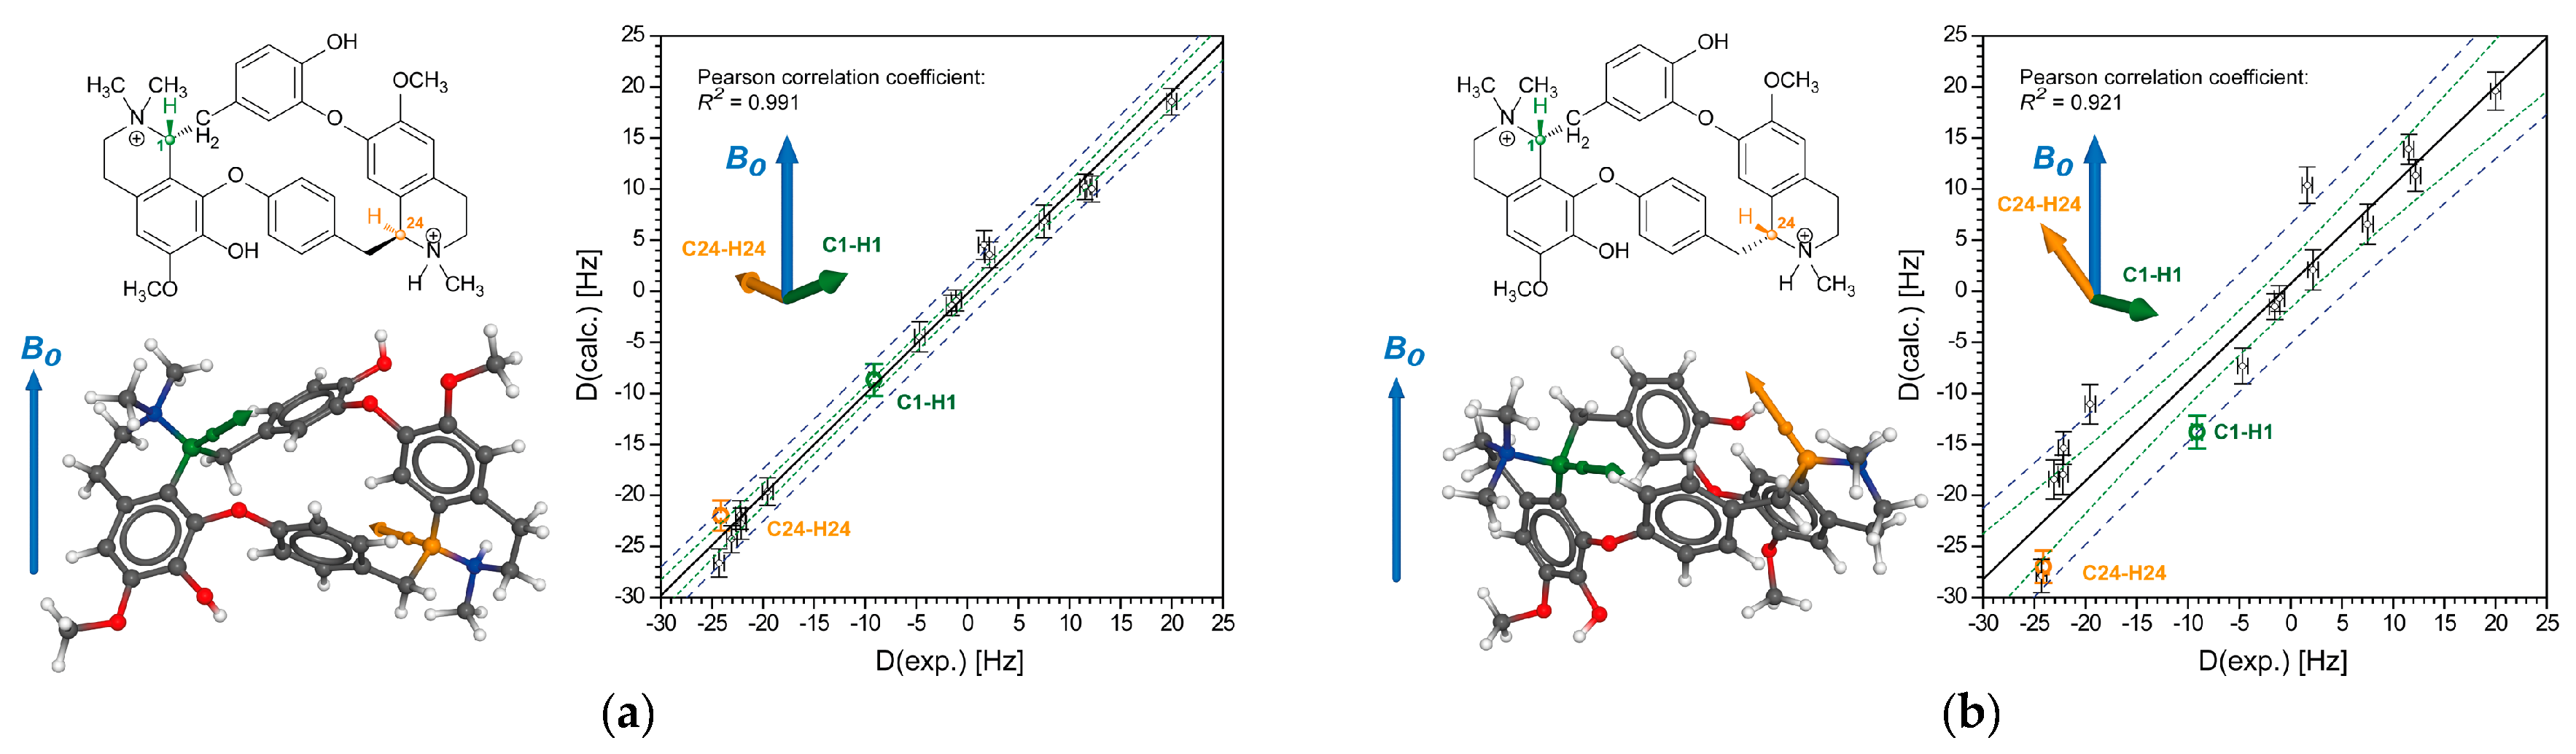
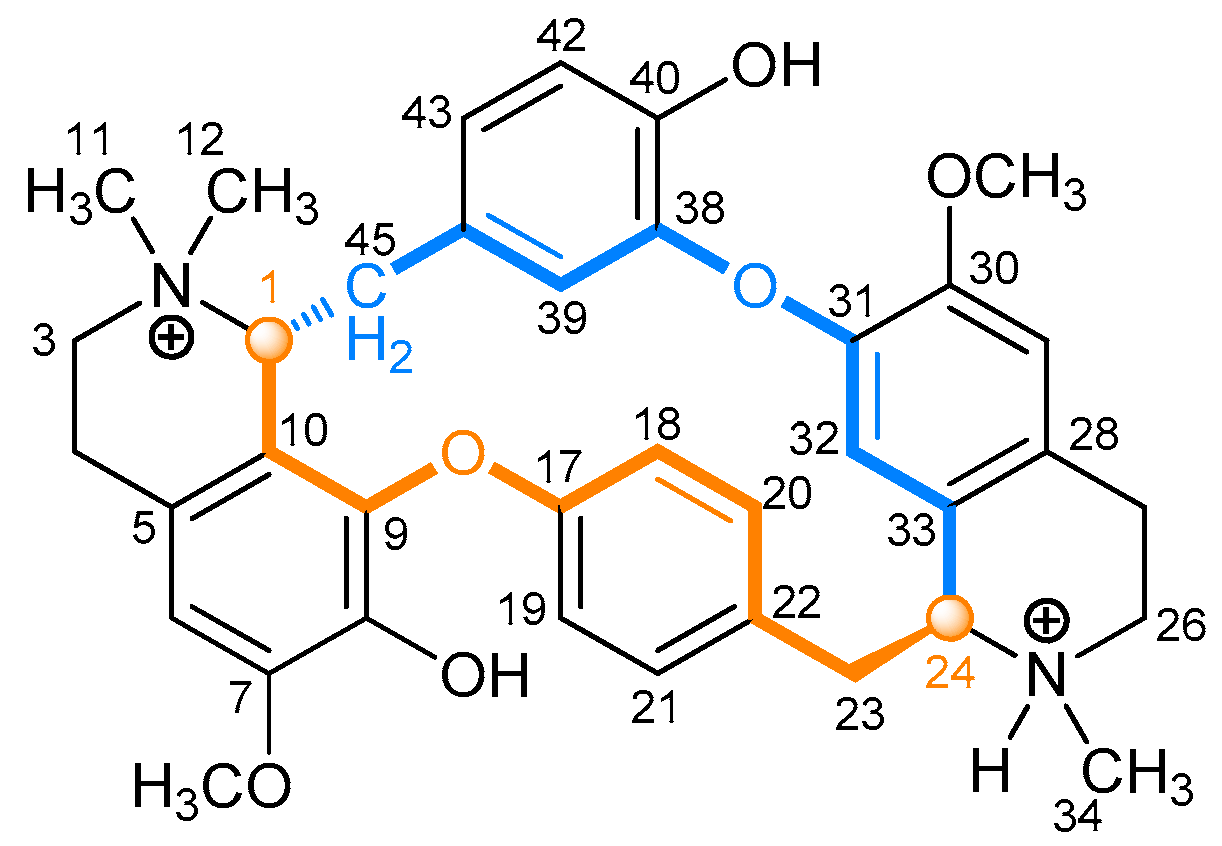
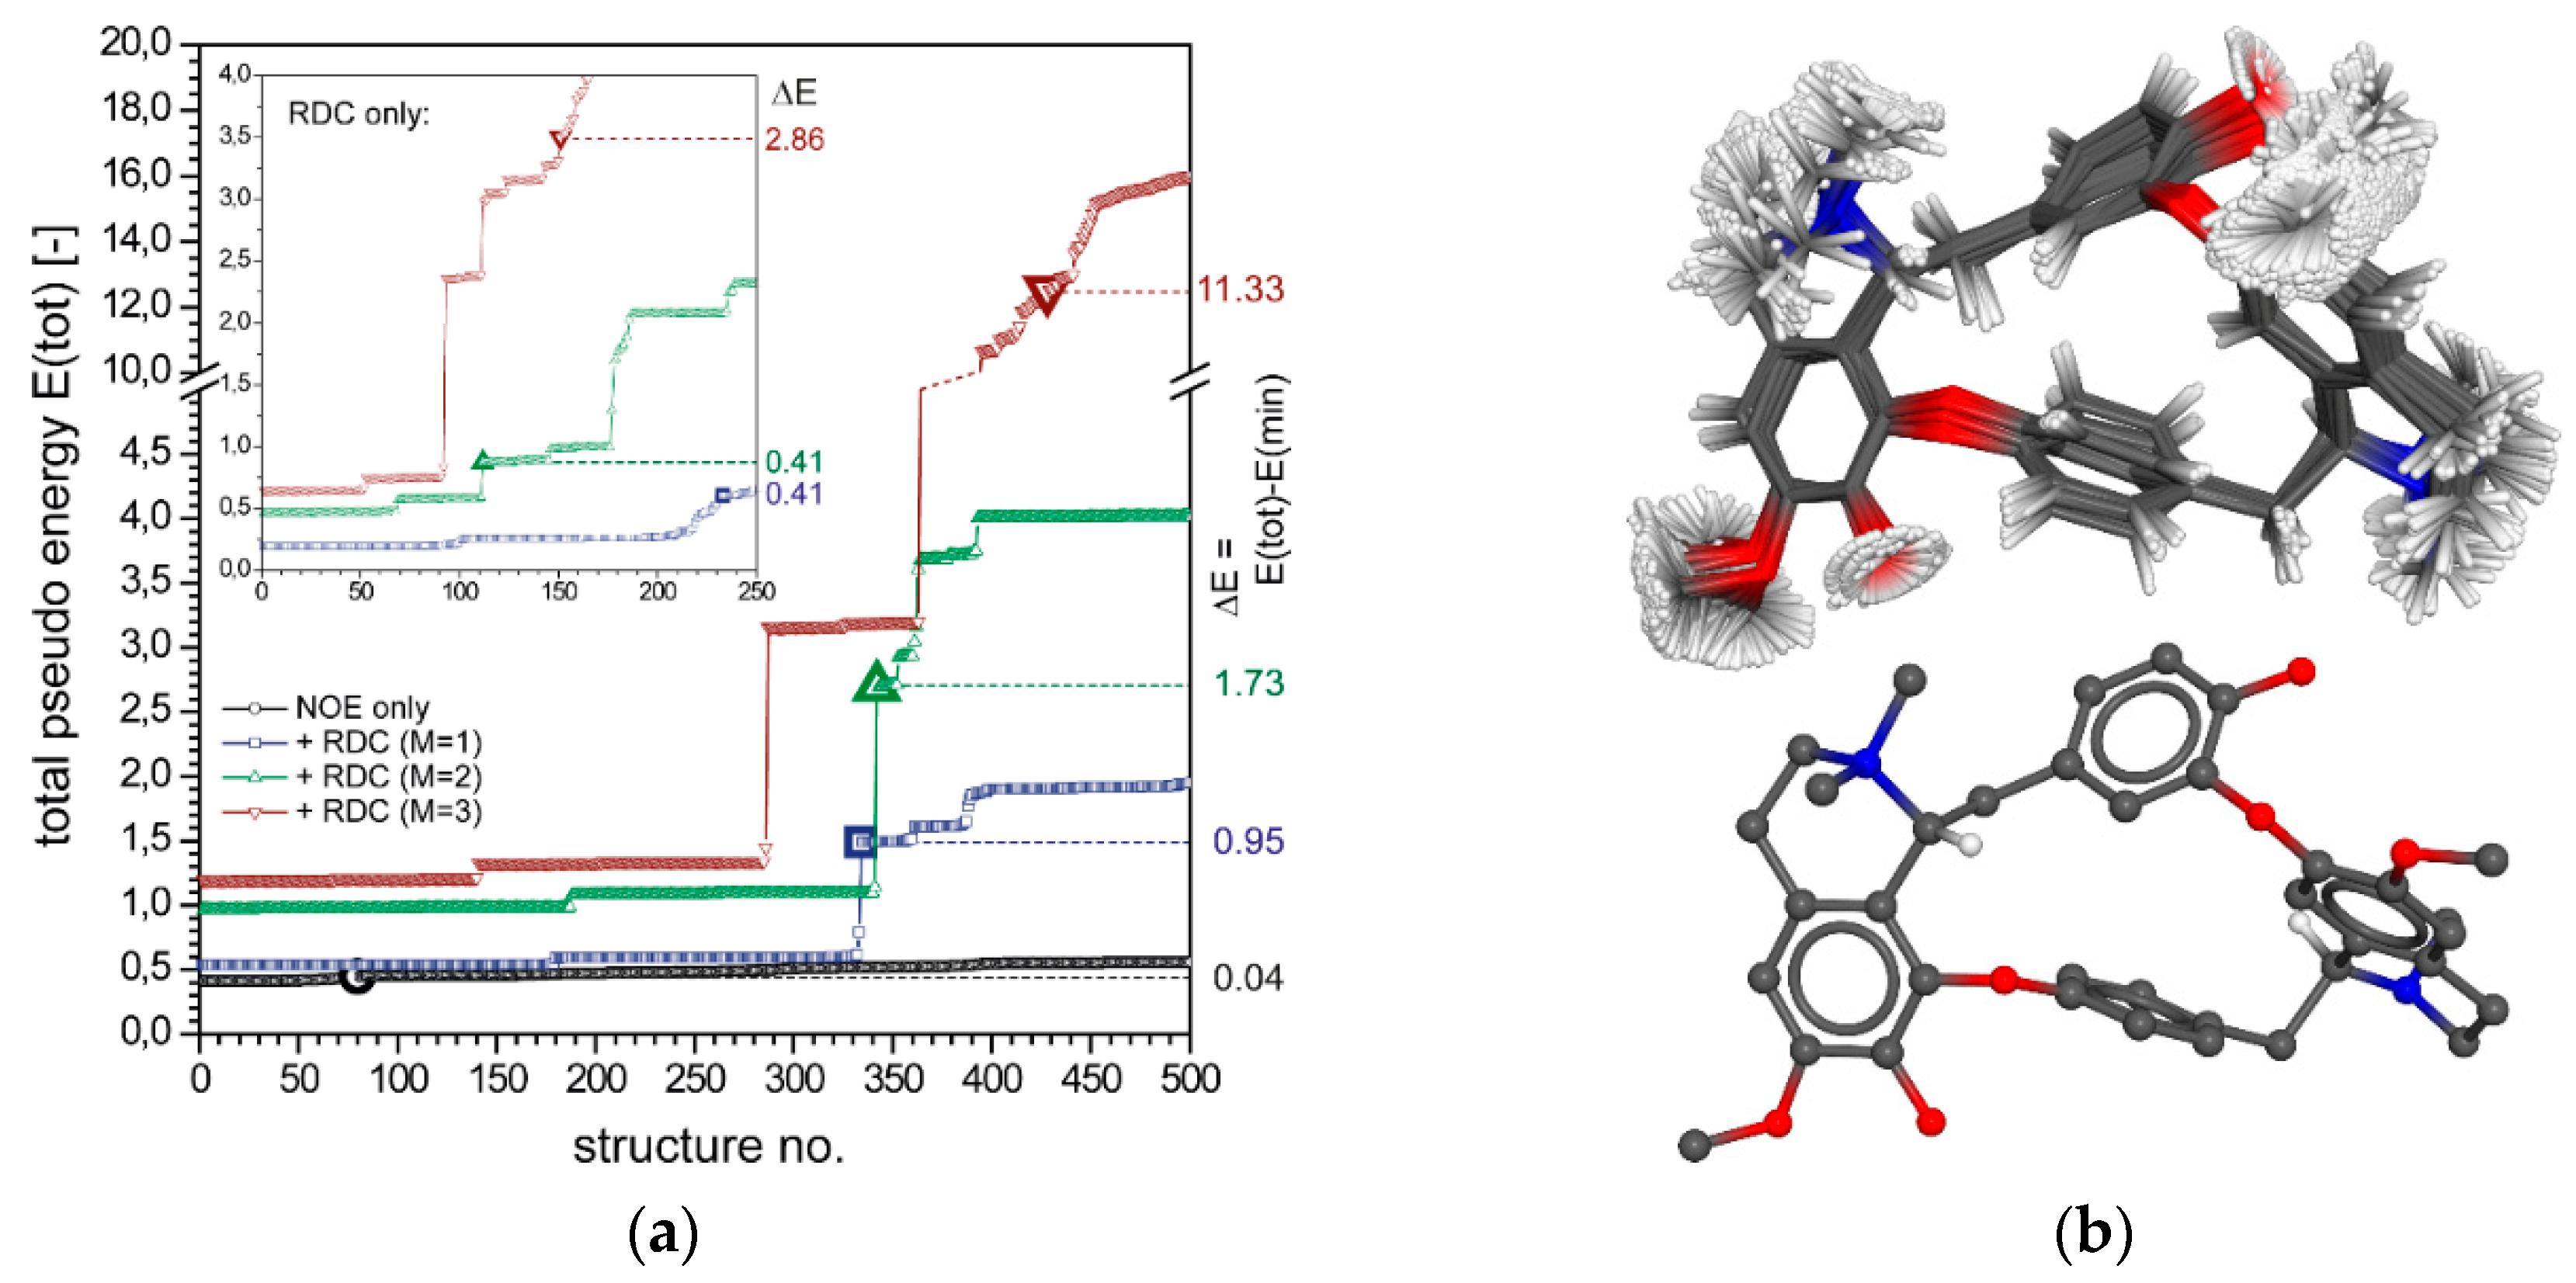
2.2.1. Tubocurarine (4)
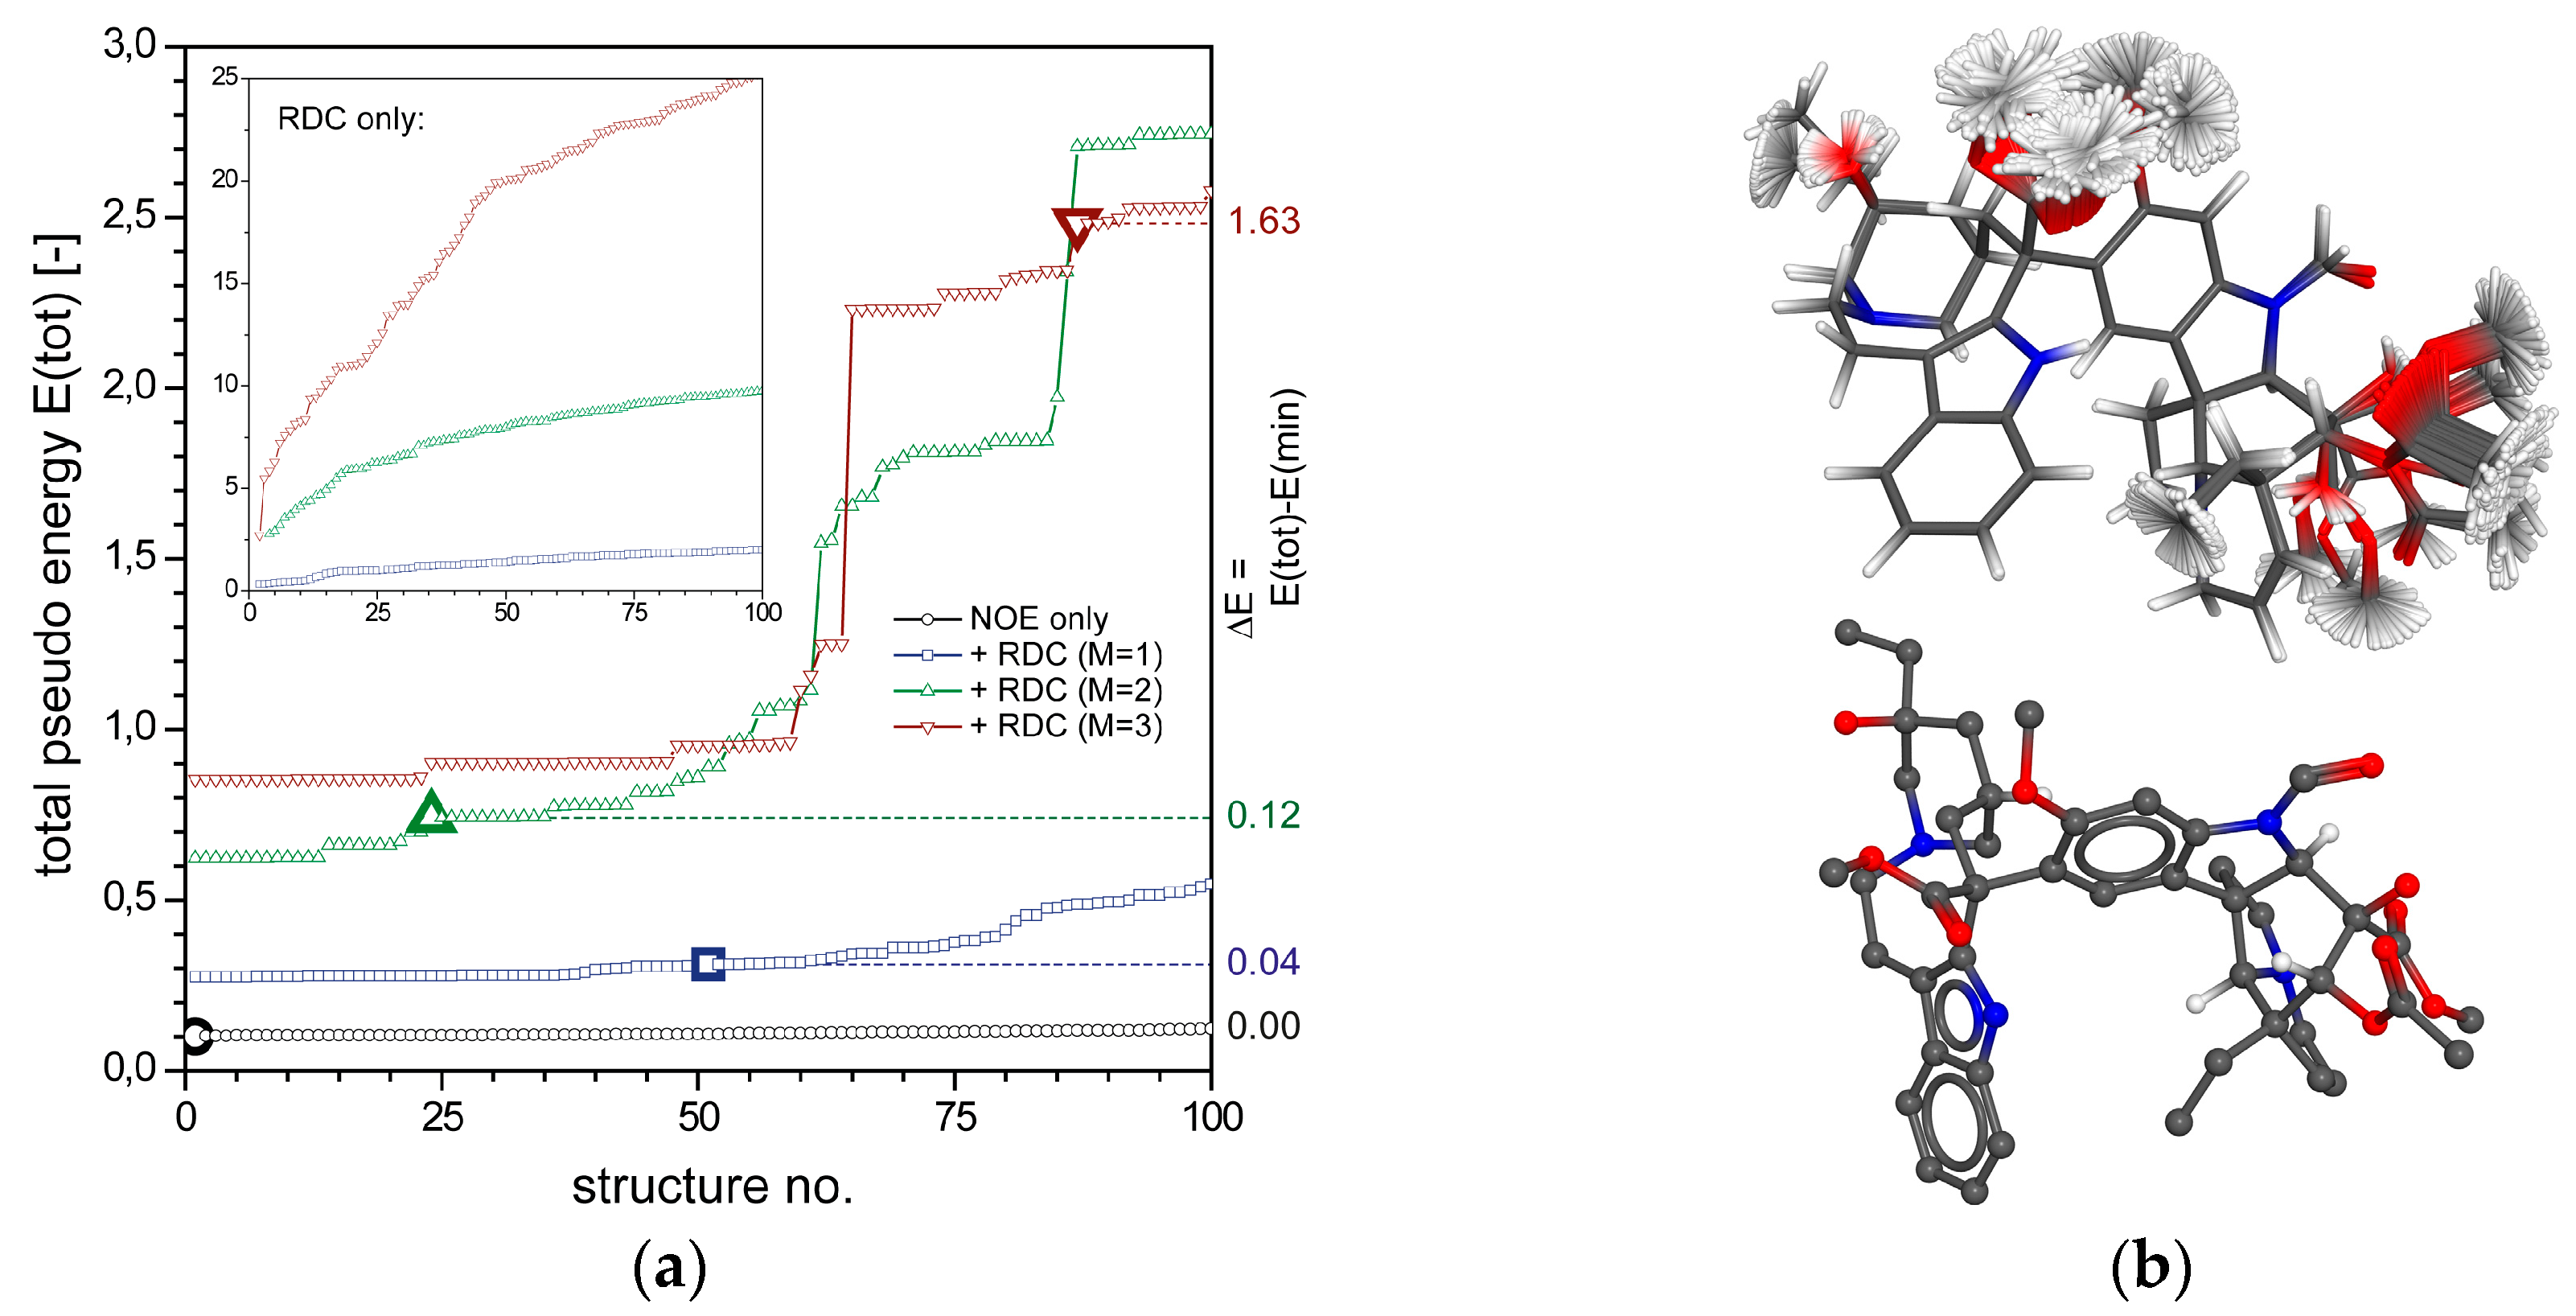
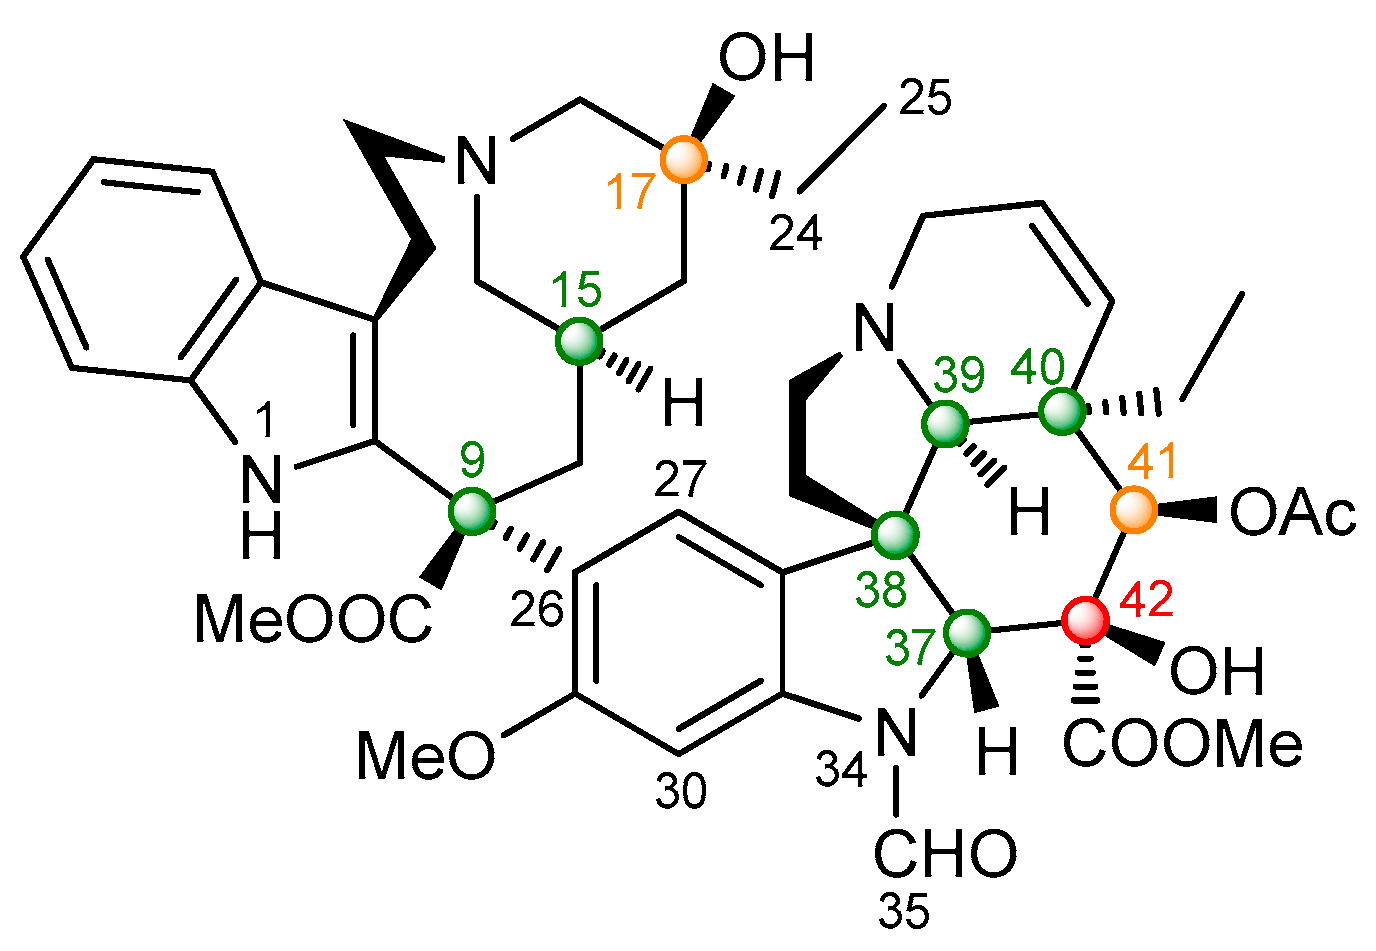
2.2.2. Vincristine (5)
3. Conclusions
4. Methods
4.1. NMR Data
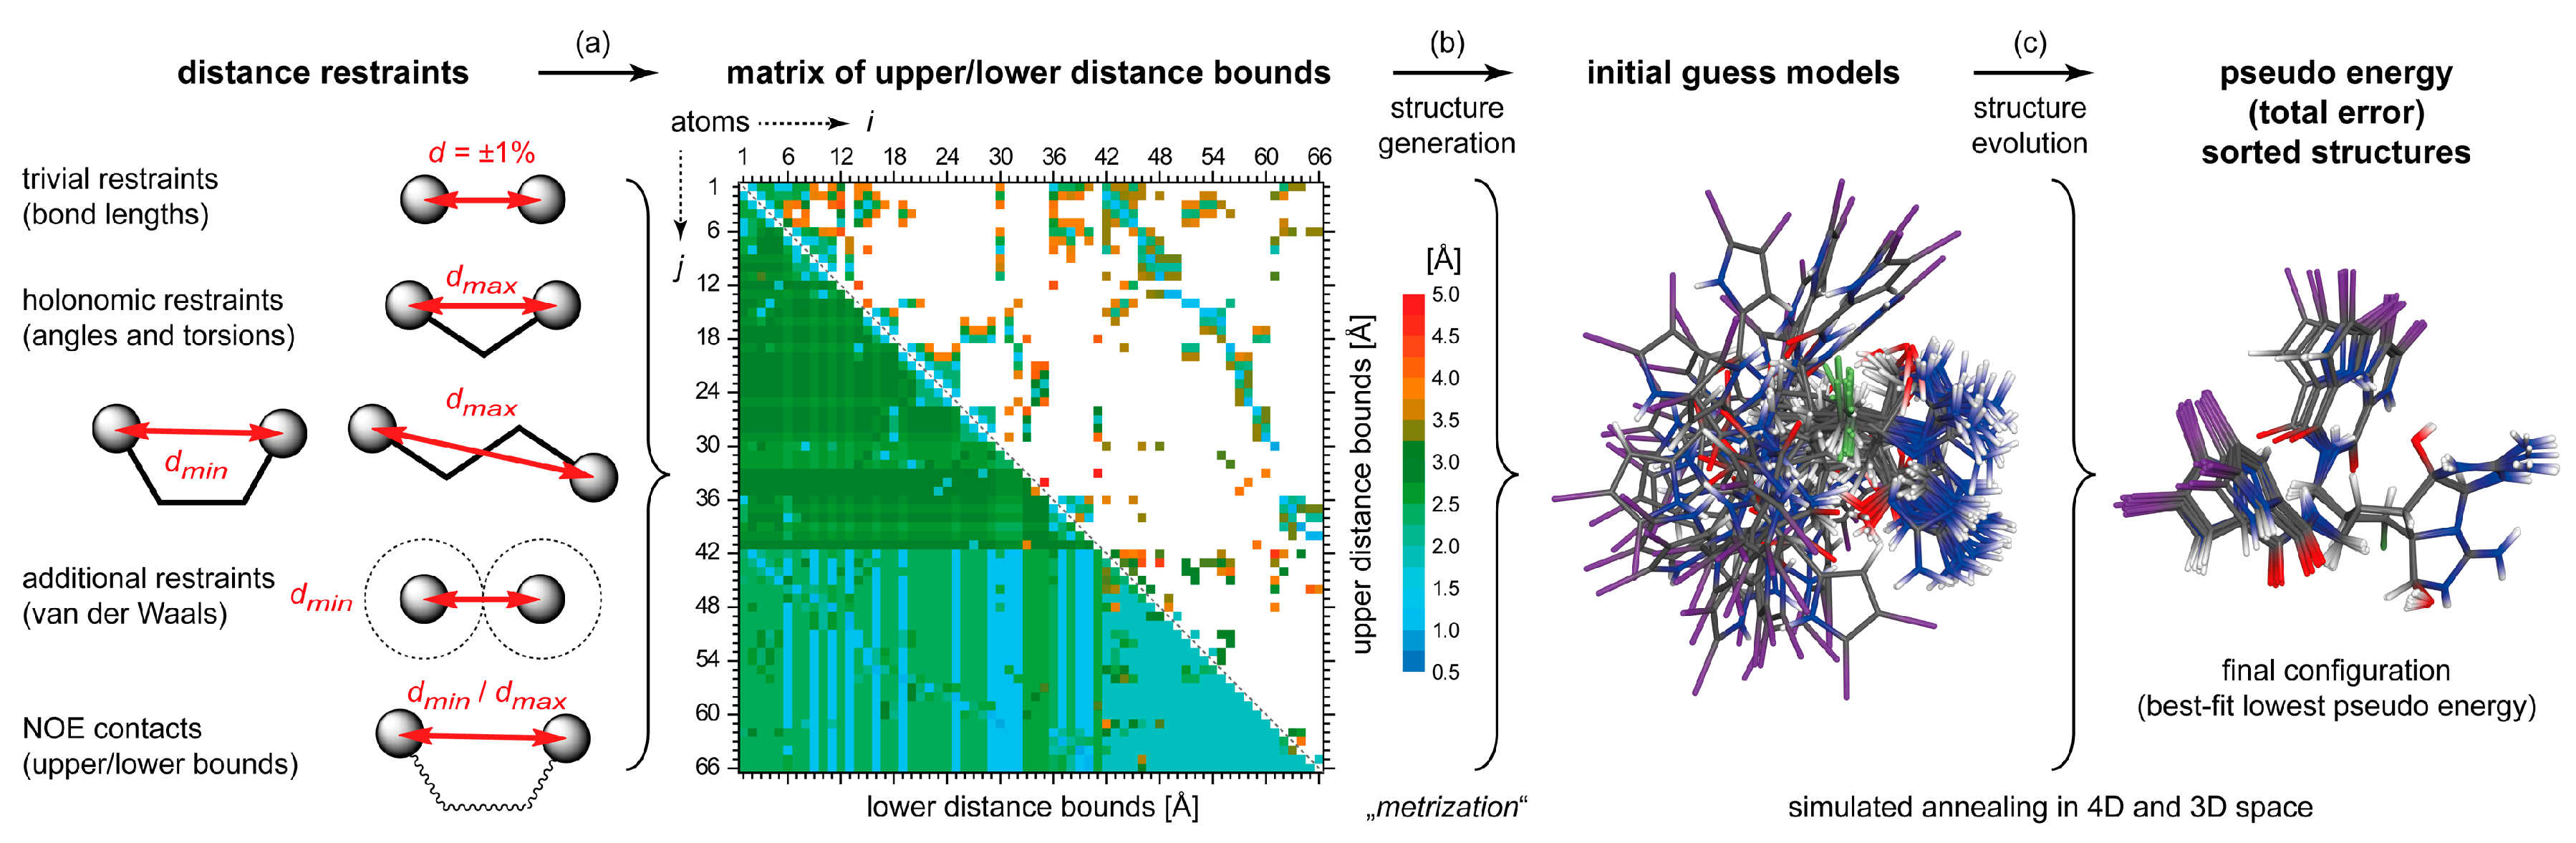
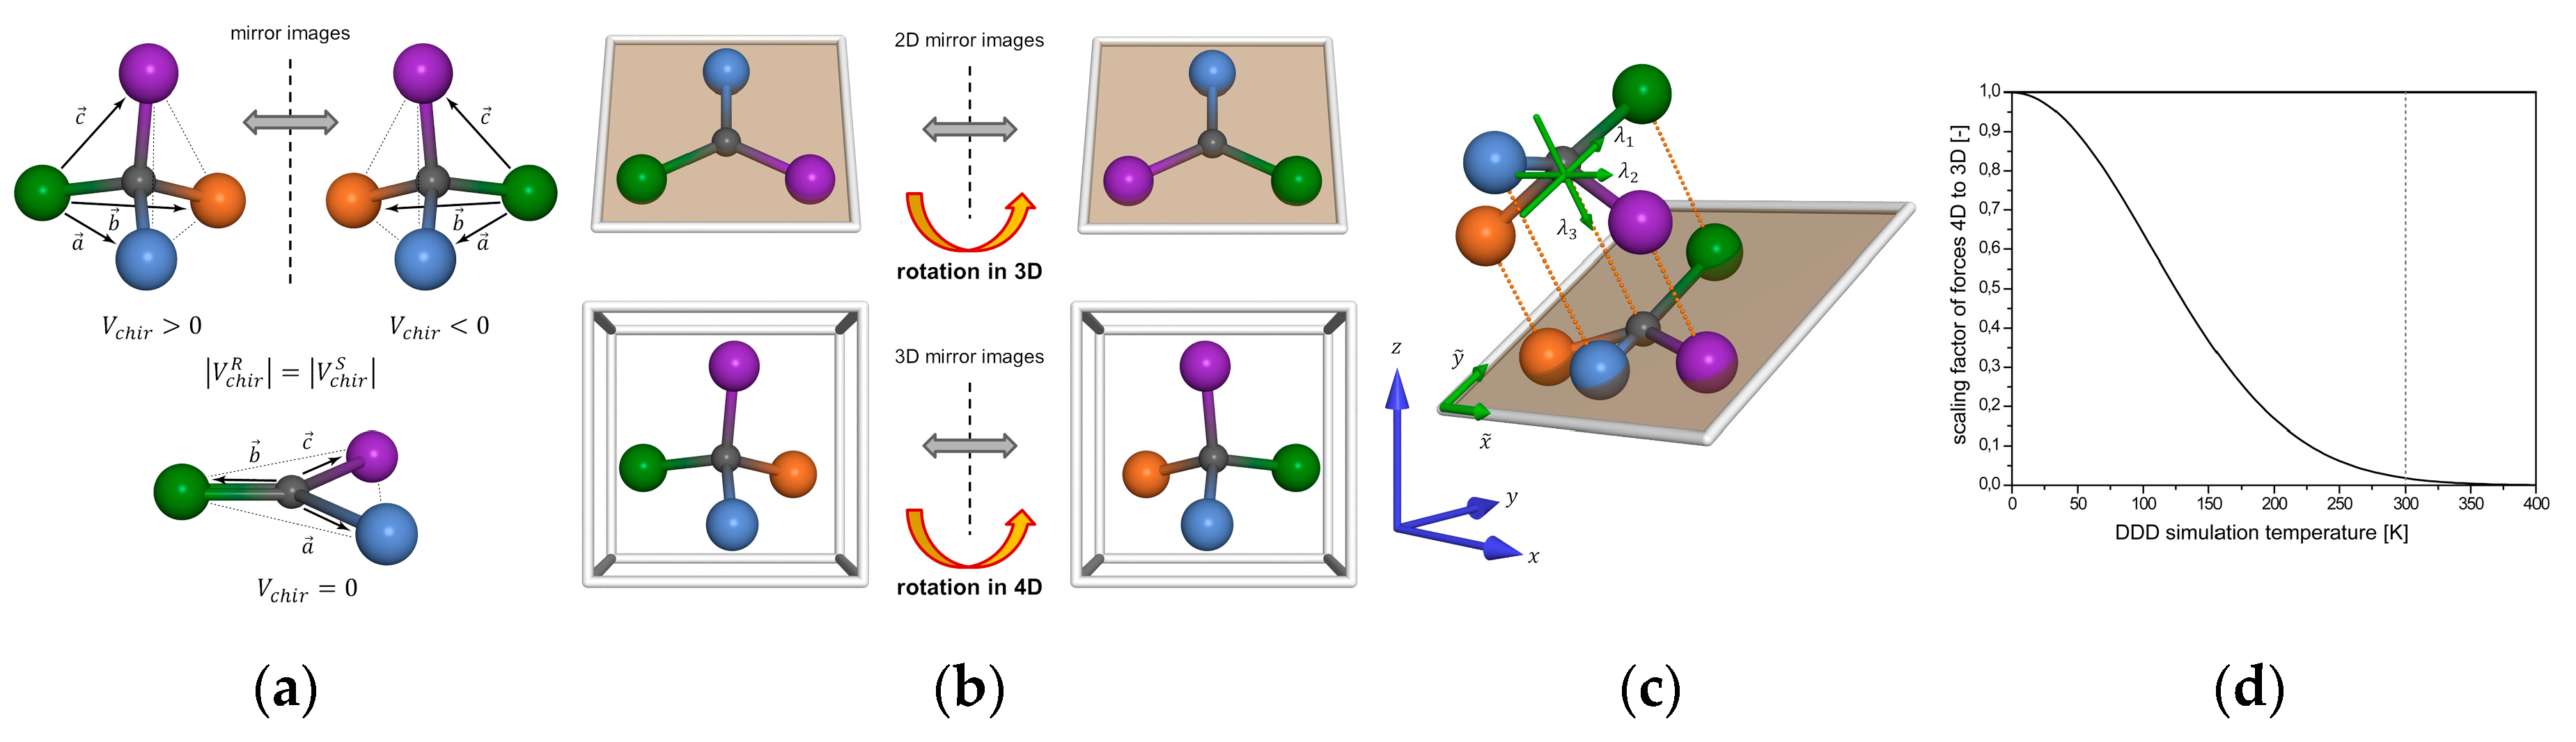
4.2. DG/DDD
Supplementary Materials
Author Contributions
Funding
Acknowledgments
Conflicts of Interest
References
- Köck, M.; Junker, J. Marine natural products—New ways in the constitutional assignment. In New Aspects in Bioorganic Chemistry; Diederichsen, U., Lindhorst, T.K., Wessjohann, L., Westermann, B., Eds.; Wiley-VCH: Weinheim, Germany, 1999; pp. 365–378. [Google Scholar]
- Lindel, T.; Junker, J.; Köck, M. COCON: From NMR correlation data to molecular constitutions. J. Mol. Model. 1997, 3, 364–368. [Google Scholar] [CrossRef]
- Köck, M.; Junker, J. Determination of the relative configuration of organic compounds using NMR and DG: A systematic approach for a model system. J. Mol. Model. 1997, 3, 403–407. [Google Scholar] [CrossRef]
- Reggelin, M.; Hoffmann, H.; Köck, M.; Mierke, D.F. Determination of conformation and relative configuration of a small, rapidly tumbling molecule in solution by combined application of NOESY and restrained MD calculations. J. Am. Chem. Soc. 1992, 114, 3272–3277. [Google Scholar] [CrossRef]
- Reggelin, M.; Köck, M.; Conde-Frieboes, K.; Mierke, D.F. Determination of the relative configuration by distance geometry calculations with proton-proton distances from NOESY spectra. Angew. Chem. Int. Ed. 1994, 33, 753–755. [Google Scholar] [CrossRef]
- Menna, M.; Imperatore, C.; Mangoni, A.; Della Sala, G.; Taglialatela-Scafati, O. Challenges in the configuration assignment of natural products. A case-selective perspective. Nat. Prod. Rep. 2019, 36, 476–489. [Google Scholar] [CrossRef]
- Schleucher, J.; Schwörer, B.; Zirngibl, C.; Koch, U.; Weber, W.; Egert, E.; Thauer, R.K.; Griesinger, C. Determination of the relative configuration of 5,6,7,8-tetrahydromethanopterin by two-dimensional NMR spectroscopy. FEBS Lett. 1992, 314, 440–444. [Google Scholar] [CrossRef]
- Kaptein, R.; Zuiderweg, E.R.P.; Scheek, R.M.; Boelens, R.; van Gunsteren, W.F. A Protein-Structure From Nuclear Magnetic-Resonance Data - Lac Repressor Headpiece. J. Mol. Biol. 1985, 182, 179–182. [Google Scholar] [CrossRef]
- Clore, G.M.; Gronenborn, A.M.; Brünger, A.T.; Karplus, M. Solution conformation of a heptadecapeptide comprising the DNA binding helix F of the cyclic AMP receptor protein of Escherichia coli: Combined use of 1H nuclear magnetic resonance and restrained molecular dynamics. J. Mol. Biol. 1985, 186, 435–455. [Google Scholar] [CrossRef]
- Navarro-Vázquez, A. When not to rely on Boltzmann populations. Automated CASE-3D structure elucidation of hyacinthacines through chemical shift differences. Magn. Reson. Chem. 2020, 58, 139–144. [Google Scholar] [CrossRef]
- Navarro-Vázquez, A.; Gil, R.R.; Blinov, K. Computer-Assisted 3D Structure Elucidation (CASE-3D) of Natural Products Combining Isotropic and Anisotropic NMR Parameters. J. Nat. Prod. 2018, 81, 203–210. [Google Scholar] [CrossRef]
- Grimme, S. Dispersion Interaction and Chemical Bonding. In The Chemical Bond; Frenking, G., Shaik, S., Eds.; Wiley-VCH: Weinheim, Germany, 2014; pp. 477–500. [Google Scholar]
- Crippen, G.M.; Havel, T.F. Distance Geometry and Molecular Conformation; Research Studies Press LTD: Taunton, UK, 1988. [Google Scholar]
- de Vlieg, J.; Scheek, R.M.; van Gunsteren, W.F.; Berendsen, H.J.C.; Kaptein, R.; Thomason, J. Combined procedure of distance geometry and restrained molecular dynamics techniques for protein structure determination from nuclear magnetic resonance data: Application to the DNA binding domain of lac repressor from Escherichia coli. Proteins Struct. Funct. Genet. 1988, 3, 209–218. [Google Scholar] [CrossRef]
- Havel, T.F.; Kuntz, I.D.; Crippen, G.M. The theory and practice of distance geometry. Bull. Math. Biol. 1983, 45, 665–720. [Google Scholar] [CrossRef]
- Kaptein, R.; Boelens, R.; Scheek, R.M.; van Gunsteren, W.F. Protein structures from NMR. Biochemistry 1988, 27, 5389–5395. [Google Scholar] [CrossRef]
- Scheek, R.M.; van Gunsteren, W.F.; Kaptein, R. Molecular dynamics simulation techniques for determination of molecular structures from nuclear magnetic resonance data. Methods Enzymol. 1989, 177, 204–218. [Google Scholar]
- Mierke, D.F.; Reggelin, M. Simultaneous determination of conformation and configuration using distance geometry. J. Org. Chem. 1992, 57, 6365–6367. [Google Scholar] [CrossRef]
- Köck, M.; Junker, J. How many NOE derived restraints are necessary for a reliable determination of the relative configuration of an organic compound? Application to a model system. J. Org. Chem. 1998, 62, 8614–8615, Erratum in 1998, 63, 2409. [Google Scholar] [CrossRef]
- Weber, P.L.; Morrison, R.; Hare, D. Determining stereo specific H-1 nuclear magnetic-resonance assignments from distance geometry calculations. J. Mol. Biol. 1988, 204, 483–487. [Google Scholar] [CrossRef]
- Holak, T.A.; Gondol, D.; Otlewski, J.; Wilusz, T. Determination of the complete 3-dimensional structure of the trypsin-inhibitor from squash seeds in aqueous-solution by nuclear magnetic-resonance and a combination of distance geometry and dynamical simulated annealing. J. Mol. Biol. 1989, 210, 635–648. [Google Scholar] [CrossRef]
- Immel, S.; Köck, M.; Reggelin, M. Configurational Analysis by Residual Dipolar Coupling Driven Floating Chirality Distance Geometry Calculations. Chem. Eur. J. 2018, 24, 13918–13930. [Google Scholar] [CrossRef]
- Immel, S.; Köck, M.; Reggelin, M. Configurational analysis by residual dipolar couplings: A critical assessment of diastereomeric differentiabilities. Chirality 2019, 31, 384–400. [Google Scholar] [CrossRef]
- Tolman, J.R.; Flanagan, J.M.; Kennedy, M.A.; Prestegard, J.H. Nuclear magnetic dipole interactions in field-oriented proteins: Information for structure determination in solution. Proc. Natl. Acad. Sci. USA 1995, 92, 9279–9283. [Google Scholar] [CrossRef] [PubMed]
- Tjandra, N.; Grzesiek, S.; Bax, A. Magnetic Field Dependence of Nitrogen-Proton J Splittings in 15N-Enriched Human Ubiquitin Resulting from Relaxation Interference and Residual Dipolar Coupling. J. Am. Chem. Soc. 1996, 118, 6264–6272. [Google Scholar] [CrossRef]
- Li, G.W.; Liu, H.; Qiu, F.; Wang, X.J.; Lei, X.X. Residual Dipolar Couplings in Structure Determination of Natural Products. Nat. Product. Bioprospect. 2018, 8, 279–295. [Google Scholar] [CrossRef]
- Gil, R.R. Residual Dipolar Couplings in Small-Molecule NMR. In Encyclopedia of Spectroscopy and Spectrometry; Lindon, J.C., Tranter, G.E., Koppenaal, D.W., Eds.; Academic Press Ltd-Elsevier Science Ltd.: London, UK, 2017; pp. 946–955. [Google Scholar]
- Gil, R.R.; Griesinger, C.; Navarro-Vázquez, A.; Sun, H. Structural Elucidation of Small Organic Molecules Assisted by NMR in Aligned Media. In Structure Elucidation in Organic Chemistry: The Search for the Right Tools; Cid, M.M., Bravo, J., Eds.; Wiley-VCH: Weinheim, Germany, 2015; pp. 279–323. [Google Scholar]
- Luy, B. Distinction of enantiomers by NMR spectroscopy using chiral orienting media. J. Indian Inst. Sci. 2010, 90, 119–132. [Google Scholar]
- Kummerlöwe, G.; Luy, B. Residual Dipolar Couplings for the Configurational and Conformational Analysis of Organic Molecules. In Annual Reports on NMR Spectroscopy; Webb, G.A., Ed.; Academic Press: Cambridge, MA, USA, 2009; Volume 68, pp. 193–230. [Google Scholar]
- Kummerlöwe, G.; Luy, B. Residual dipolar couplings as a tool in determining the structure of organic molecules. TrAC Trends Anal. Chem. 2009, 28, 483–493. [Google Scholar] [CrossRef]
- Carvalho, D.S.; da Silva, D.G.B.; Hallwass, F.; Navarro-Vázquez, A. Chemically cross-linked polyacrylonitrile. A DMSO compatible NMR alignment medium for measurement of residual dipolar couplings and residual chemical shift anisotropies. J. Magn. Reson. 2019, 302, 21–27. [Google Scholar] [CrossRef]
- Gayathri, C.; Tsarevsky, N.V.; Gil, R.R. Residual Dipolar Couplings (RDCs) Analysis of Small Molecules Made Easy: Fast and Tuneable Alignment by Reversible Compression/Relaxation of Reusable PMMA Gels. Chem. Eur. J. 2010, 16, 3622–3626. [Google Scholar] [CrossRef]
- Gil-Silva, L.F.; Santamaria-Fernandez, R.; Navarro-Vázquez, A.; Gil, R.R. Collection of NMR Scalar and Residual Dipolar Couplings Using a Single Experiment. Chem. Eur. J. 2016, 22, 472–476. [Google Scholar] [CrossRef]
- Garcia, M.E.; Woodruff, S.R.; Hellemann, E.; Tsarevsky, N.V.; Gil, R.R. Di(ethylene glycol) methyl ether methacrylate (DEGMEMA)-derived gels align small organic molecules in methanol. Magn. Reson. Chem. 2017, 55, 206–209. [Google Scholar] [CrossRef]
- Hallwass, F.; Teles, R.R.; Hellemann, E.; Griesinger, C.; Gil, R.R.; Navarro-Vázquez, A. Measurement of residual chemical shift anisotropies in compressed polymethylmethacrylate gels. Automatic compensation of gel isotropic shift contribution. Magn. Reson. Chem. 2018, 56, 321–328. [Google Scholar] [CrossRef]
- Kobzar, K.; Kessler, H.; Luy, B. Stretched gelatin gels as chiral alignment media for the discrimination of enantiomers by NMR spectroscopy. Angew. Chem. Int. Ed. 2005, 44, 3145–3147. [Google Scholar] [CrossRef] [PubMed]
- Kummerlöwe, G.; Knör, S.; Frank, A.O.; Paululat, T.; Kessler, H.; Luy, B. Deuterated polymer gels for measuring anisotropic NMR parameters with strongly reduced artefacts. Chem. Commun. 2008, 44, 5722–5724. [Google Scholar] [CrossRef] [PubMed]
- Kummerlöwe, G.; Behl, M.; Lendlein, A.; Luy, B. Artifact-free measurement of residual dipolar couplings in DMSO by the use of cross-linked perdeuterated poly(acrylonitrile) as alignment medium. Chem. Commun. 2010, 46, 8273–8275. [Google Scholar] [CrossRef]
- Merle, C.; Kummerlöwe, G.; Freudenberger, J.C.; Halbach, F.; Stower, W.; von Gostomski, C.L.; Hopfner, J.; Beskers, T.; Wilhelm, M.; Luy, B. Crosslinked Poly(ethylene oxide) as a Versatile Alignment Medium for the Measurement of Residual Anisotropic NMR Parameters. Angew. Chem. Int. Ed. 2013, 52, 10309–10312. [Google Scholar] [CrossRef]
- Lesot, P.; Aroulanda, C.; Berdague, P.; Meddour, A.; Merlet, D.; Farjon, J.; Giraud, N.; Lafon, O. Multinuclear NMR in polypeptide liquid crystals: Three fertile decades of methodological developments and analytical challenges. Prog. Nucl. Magn. Reson. Spectrosc. 2020, 116, 85–154. [Google Scholar] [CrossRef]
- Ndukwe, I.E.; Wang, X.; Pelczer, I.; Reibarkh, M.; Williamson, R.T.; Liu, Y.; Martin, G.E. PBLG as a versatile liquid crystalline medium for anisotropic NMR data acquisition. Chem. Commun. 2019, 55, 4327–4330. [Google Scholar] [CrossRef]
- Schwab, M.; Schmidts, V.; Thiele, C.M. Thermoresponsive Alignment Media in NMR Spectroscopy: Helix Reversal of a Copolyaspartate at Ambient Temperatures. Chem. Eur. J. 2018, 24, 14373–14377. [Google Scholar] [CrossRef]
- Meyer, N.-C.; Krupp, A.; Schmidts, V.; Thiele, C.M.; Reggelin, M. Polyacetylenes as Enantiodifferentiating Alignment Media. Angew. Chem. Int. Ed. 2012, 51, 8334–8338. [Google Scholar] [CrossRef] [PubMed]
- Lesot, P.; Berdagué, P.; Meddour, A.; Kreiter, A.; Noll, M.; Reggelin, M. 2H and 13C NMR-Based Enantiodetection Using Polyacetylene versus Polypeptide Aligning Media: Versatile and Complementary Tools for Chemists. ChemPlusChem 2019, 84, 144–153. [Google Scholar] [CrossRef]
- Reller, M.; Wesp, S.; Koos, M.R.M.; Reggelin, M.; Luy, B. Biphasic Liquid Crystal and the Simultaneous Measurement of Isotropic and Anisotropic Parameters by Spatially Resolved NMR Spectroscopy. Chem. Eur. J. 2017, 23, 13351–13359. [Google Scholar] [CrossRef]
- Lei, X.X.; Xu, Z.; Sun, H.; Wang, S.; Griesinger, C.; Peng, L.; Gao, C.; Tan, R.X. Graphene Oxide Liquid Crystals as a Versatile and Tunable Alignment Medium for the Measurement of Residual Dipolar Couplings in Organic Solvents. J. Am. Chem. Soc. 2014, 136, 11280–11283. [Google Scholar] [CrossRef] [PubMed]
- Zong, W.; Li, G.W.; Cao, J.M.; Lei, X.X.; Hu, M.L.; Sun, H.; Griesinger, C.; Tan, R.X. An Alignment Medium for Measuring Residual Dipolar Couplings in Pure DMSO: Liquid Crystals from Graphene Oxide Grafted with Polymer Brushes. Angew. Chem. Int. Ed. 2016, 55, 3690–3693. [Google Scholar] [CrossRef] [PubMed]
- Krupp, A.; Reggelin, M. Phenylalanine-based polyarylacetylenes as enantiomer-differentiating alignment media. Magn. Reson. Chem. 2012, 50, S45–S52. [Google Scholar] [CrossRef] [PubMed]
- Parella, T. Current developments in homonuclear and heteronuclear J-resolved NMR experiments. Magn. Reson. Chem. 2018, 56, 230–250. [Google Scholar] [CrossRef]
- Marcó, N.; Souza, A.A.; Nolis, P.; Gil, R.R.; Parella, T. Perfect (1)J(CH)-resolved HSQC: Efficient measurement of one-bond proton-carbon coupling constants along the indirect dimension. J. Magn. Reson. 2017, 276, 37–42. [Google Scholar] [CrossRef]
- Enthart, A.; Freudenberger, J.C.; Furrer, J.; Kessler, H.; Luy, B. The CLIP/CLAP-HSQC: Pure absorptive spectra for the measurement of one-bond couplings. J. Magn. Reson. 2008, 192, 314–322. [Google Scholar] [CrossRef]
- Kramer, F.; Deshmukh, M.V.; Kessler, H.; Glaser, S.J. Residual dipolar coupling constants: An elementary derivation of key equations. Concepts Magn. Reson. Part A 2004, 21A, 10–21. [Google Scholar] [CrossRef]
- Ruan, K.; Briggman, K.B.; Tolman, J.R. De novo determination of internuclear vector orientations from residual dipolar couplings measured in three independent alignment media. J. Biomol. NMR 2008, 41, 61–76. [Google Scholar] [CrossRef]
- Hus, J.C.; Brüschweiler, R. Reconstruction of interatomic vectors by principle component analysis of nuclear magnetic resonance data in multiple alignments. J. Chem. Phys. 2002, 117, 1166–1172. [Google Scholar] [CrossRef]
- Yan, J.L.; Delaglio, F.; Kaerner, A.; Kline, A.D.; Mo, H.P.; Shapiro, M.J.; Smitka, T.A.; Stephenson, G.A.; Zartler, E.R. Complete relative stereochemistry of multiple stereocenters using only residual dipolar couplings. J. Am. Chem. Soc. 2004, 126, 5008–5017. [Google Scholar] [CrossRef]
- Ruan, K.; Tolman, J.R. Composite Alignment Media for the Measurement of Independent Sets of NMR Residual Dipolar Couplings. J. Am. Chem. Soc. 2005, 127, 15032–15033. [Google Scholar] [CrossRef] [PubMed]
- Schwab, M.; Herold, D.; Thiele, C.M. Polyaspartates as Thermoresponsive Enantiodifferentiating Helically Chiral Alignment Media for Anisotropic NMR Spectroscopy. Chem. Eur. J. 2017, 23, 14576–14584. [Google Scholar] [CrossRef] [PubMed]
- Urban, S.; de Almeida Leone, P.; Carroll, A.R.; Fechner, G.A.; Smith, J.; Hooper, J.N.A.; Quinn, R.J. Axinellamines A-D, Novel Imidazo-Azolo-Imidazole Alkaloids from the Australian Marine Sponge Axinella sp. J. Org. Chem. 1999, 64, 731–735. [Google Scholar] [CrossRef] [PubMed]
- Grube, A.; Köck, M. Structural assignment of tetrabromostyloguanidine: Does the relative configuration of the palau’amines need revision? Angew. Chem. Int. Ed. 2007, 46, 2320–2324. [Google Scholar] [CrossRef] [PubMed]
- Su, S.; Seiple, I.B.; Young, I.S.; Baran, P.S. Total Syntheses of (±)-Massadine and Massadine Chloride. J. Am. Chem. Soc. 2008, 130, 16490–16491. [Google Scholar] [CrossRef] [PubMed]
- Reynolds, C.D.; Palmer, R.A. Crystal-Structure, Absolute-Configuration and Stereochemistry of (+)-Tubocurarine Dibromide Methanol Solvate—Potent Neuromuscular Blocking-Agent. Acta Crystallogr. Sect. B 1976, 32, 1431–1439. [Google Scholar] [CrossRef]
- Moncrief, J.W.; Lipscomb, W.N. Structure of Leurocristine Methiodide Dihydrate by Anomalous Scattering Methods - Relation to Leurocristine (Vincristine) and Vincaleukoblastine (Vinblastine). Acta Crystallogr. Sect. A 1966, 21, 322–331. [Google Scholar] [CrossRef]
- Kinnel, R.B.; Gehrken, H.P.; Scheuer, P.J. Palau’amine: A cytotoxic and immunosuppressive hexacyclic bisguanidine antibiotic from the sponge Stylotella agminata. J. Am. Chem. Soc. 1993, 115, 3376–3377. [Google Scholar] [CrossRef]
- Kato, T.; Shizuri, Y.; Izumida, H.; Yokoyama, A.; Endo, M. Styloguanidines, new chitinase inhibitors from the marine sponge Stylotella aurantium. Tetrahedron Lett. 1995, 36, 2133–2136. [Google Scholar] [CrossRef]
- Kobayashi, J.; Suzuki, M.; Tsuda, M. Konbu’acidin A, a new bromopyrrole alkaloid with cdk4 inhibitory activity from Hymeniacidon sponge. Tetrahedron 1997, 53, 15681–15684. [Google Scholar] [CrossRef]
- Kinnel, R.B.; Gehrken, H.-P.; Swali, R.; Skoropowski, G.; Scheuer, P.J. Palau’amine and its congeners: A family of bioactive bisguanidines from the marine sponge Stylotella aurantium. J. Org. Chem. 1998, 63, 3281–3286. [Google Scholar] [CrossRef]
- Köck, M.; Grube, A.; Seiple, I.B.; Baran, P.S. The pursuit of Palau’amine. Angew. Chem. Int. Ed. 2007, 46, 6586–6594. [Google Scholar] [CrossRef] [PubMed]
- Köck, M.; Schmidt, G.; Seiple, I.B.; Baran, P.S. Configurational analysis of tetracyclic dimeric pyrrole-imidazole alkaloids using a floating chirality approach. J. Nat. Prod. 2012, 75, 127–130. [Google Scholar] [CrossRef] [PubMed]
- Havel, T.F. An evaluation of computational strategies for use in the determination of protein-structure from distance contraints obtained by nuclear magnetic resonance. Prog. Biophys. Mol. Biol. 1991, 56, 43–78. [Google Scholar] [CrossRef]
- Spellmeyer, D.C.; Wong, A.K.; Bower, M.J.; Blaney, J.M. Conformational analysis using distance geometry methods. J. Mol. Graphics Modell. 1997, 15, 18–36. [Google Scholar] [CrossRef]
- van Schaik, R.C.; Berendsen, H.J.C.; Torda, A.E.; van Gunsteren, W.F. A Structure Refinement Method Based on Molecular Dynamics in Four Spatial Dimensions. J. Mol. Biol. 1993, 234, 751–762. [Google Scholar] [CrossRef]


© 2020 by the authors. Licensee MDPI, Basel, Switzerland. This article is an open access article distributed under the terms and conditions of the Creative Commons Attribution (CC BY) license (http://creativecommons.org/licenses/by/4.0/).
Share and Cite
Köck, M.; Reggelin, M.; Immel, S. The Advanced Floating Chirality Distance Geometry Approach―How Anisotropic NMR Parameters Can Support the Determination of the Relative Configuration of Natural Products. Mar. Drugs 2020, 18, 330. https://doi.org/10.3390/md18060330
Köck M, Reggelin M, Immel S. The Advanced Floating Chirality Distance Geometry Approach―How Anisotropic NMR Parameters Can Support the Determination of the Relative Configuration of Natural Products. Marine Drugs. 2020; 18(6):330. https://doi.org/10.3390/md18060330
Chicago/Turabian StyleKöck, Matthias, Michael Reggelin, and Stefan Immel. 2020. "The Advanced Floating Chirality Distance Geometry Approach―How Anisotropic NMR Parameters Can Support the Determination of the Relative Configuration of Natural Products" Marine Drugs 18, no. 6: 330. https://doi.org/10.3390/md18060330
APA StyleKöck, M., Reggelin, M., & Immel, S. (2020). The Advanced Floating Chirality Distance Geometry Approach―How Anisotropic NMR Parameters Can Support the Determination of the Relative Configuration of Natural Products. Marine Drugs, 18(6), 330. https://doi.org/10.3390/md18060330