Article

Anti-Hyperuricemic Effects of Astaxanthin by Regulating Xanthine Oxidase, Adenosine Deaminase and Urate Transporters in Rats

Zhejiang Provincial Engineering Technology Research Center of Marine Biomedical Products, School of Food and Pharmacy, Zhejiang Ocean University, Zhoushan 316022, China
*
Author to whom correspondence should be addressed.
Mar. Drugs 2020, 18(12), 610; https://doi.org/10.3390/md18120610
Submission received: 6 November 2020 / Revised: 25 November 2020 / Accepted: 28 November 2020 / Published: 1 December 2020

Abstract

:
This study was designed to investigate the effects and underlying mechanisms of Astaxanthin (AST) on high-fructose-induced hyperuricemia (HUA) from the perspectives of the uric acid (UA) synthesis and excretion in rat models. Following six weeks of a 10% fructose diet, the level of serum UA effectively decreased in the AST groups as compared to the model group. The enzymatic activities of xanthine oxidase (XOD) and adenosine deaminase (ADA) were significantly inhibited, and the mRNA expression levels of XOD and ADA significantly decreased after the AST administration. These results suggested that the AST reduced UA synthesis by inhibiting the mRNA expressions and enzyme activities of XOD and ADA, thereby contributing to HUA improvement. On the hand, the relative expressions of the mRNA and protein of kidney reabsorption transport proteins (GLUT9 and URAT1) were significantly down-regulated by AST, while that of the kidney secretion proteins (OAT1, OAT3 and ABCG2) were significantly up-regulated by AST. These results indicated that the AST promoted UA excretion by regulating the urate transport proteins, and thus alleviated HUA. This study suggested that the AST could serve as an effective alternative to traditional medicinal drugs for the prevention of fructose-induced HUA.

1. Introduction

Fructose, a naturally occurring monosaccharide present in fruit, honey, and some vegetables, has plenty of use in processed foods [1]. In recent decades, the daily intake of fructose in the human diet has been increased dramatically, whereas the metabolic process of fructose in the human body produces excessive uric acid (UA), which usually leads to hyperuricemia (HUA), obesity, metabolic syndrome and diabetes [2]. Nowadays, HUA has become a prevalent disease with increasing incidence. The prevalence of gout in American adults has reached to 3.9%, whereas the proportion of young people among the HUA patients is still increasing [3]. HUA is caused by the imbalance of the synthesis and excretion of UA, characterized by high UA levels (serum UA level > 420 µmol/L) [4]. The synthesis of UA primarily occurs in liver. Xanthine oxidase (XOD) and adenosine deaminase (ADA) are the key enzymes responsible for the synthesis of UA in purine metabolism [5]. In hepatocytes, the rapid phosphorylation of fructose requires numerous ATP, which causes reduction in the intracellular phosphate (Pi) level, and consequently the stimulation of AMP deaminase (AMPD) [6]. AMPD catalyzes the hydrolysis of AMP to inosine monophosphate (IMP), which is then metabolized to inosine in the presence of ADA. Inosine is further degraded into hypoxanthine through purine nucleoside phosphorylase (PNP). Eventually, XOD, a rate-limiting enzyme in the purine metabolism, oxidizes hypoxanthine to xanthine and then xanthine to uric acid [6,7]. Hence, the enzymatic activities of XOD and ADA can have significant influence on the synthesis and concentration of serum UA [8].
The accumulated UA is partially excreted out of body by blood circulation, while approximately 70% of the UA excretion occurs through the kidney [9]. The excretion of UA involves the processes of renal secretion and reabsorption, which are controlled by urate transporters. The secretion-related transport proteins include organic anion transporter 1 (OAT1) and organic anion transporter 3 (OAT3), which are highly expressed in the renal proximal tubule and contribute to the transportation of urate [10]. Urate is absorbed by OAT1 and OAT3 from the blood through the basement membrane, which then enters to the renal proximal tubule epithelial cells, and releases through the lumen membrane [11]. Afterwards, the urate is excreted into the lumen of the proximal tubule of nephron with the help of the urate excretion transporter ATP binding cassette superfamily G 2 (ABCG2) [12]. The reabsorption of urate is mainly mediated by glucose transporter 9 (GLUT9) and urate transporter 1 (URAT1). GLUT9 is an important urate transporter, whose major function is to reabsorb urate from the proximal tubule and release it into blood through the basement membrane [13]. URAT1 is another important urate-anion exchanger, which is present in the apical membrane of renal proximal tubule epithelial cells and responsible for the transportation of urate in exchange for Cl¯ or organic anions [14]. Therefore, regulating the expression levels of urate transport proteins could affect the UA excretion and consequently the level of serum UA [15].
Currently, the cornerstone in the prevention of HUA involves the exploitation of drugs, which can promote the excretion of UA or block its synthesis [16]. Allopurinol and febuxostat are the well-known XOD inhibitors, being widely used in the clinics [17]. Diuretics, such as benzbromarone and probenecid, decrease the reabsorption of UA or promote its secretion and serve as anti-HUA drugs [18]. Among all the clinically prescribed drugs, the allopurinol accounts for 98% of the anti-HUA drugs. Nevertheless, these clinical drugs generally have some adverse effects as well, such as allergies, kidney toxicity, liver disease, etc. [19,20]. Therefore, researchers have made tremendous efforts to develop safer anti-HUA drugs from natural products. Park et al. found that ethanol extract of Aster glehni inhibited XOD activity and its administration decreased the serum UA level in potassium oxonate-induced HUA rats [21]. Wang et al. reported that cichorium administration promoted the secretion of UA by down-regulating the mRNA and thus expression of ABCCG2, causing the facilitated excretion of UA in HUA rat models [22]. Besides, Young-Sil et al. found that Alpinia oxyphylla seed extract improved the reabsorption and secretion of UA in kidney by regulating the UA transport proteins (OAT1, OAT3, GLUT9 and URAT1), which led the attenuation of HUA in rat models [23].
Astaxanthin (Ast), a xanthophyll carotenoid, is mainly derived from the marine organisms [24], and has been confirmed to have anti-inflammatory [25], anti-oxidant [26] and anti-tumor properties [27]. However, the potential effect of AST on HUA has not been investigated yet. Therefore, this study aimed to investigate the preventive effects of AST on HUA caused by a high-fructose diet and its underlying mechanism in rat models. In one aspect, the effects of AST on the UA synthesis were studied. The levels of XOD and ADA in the serum and liver of rat models and the expressions of their corresponding mRNA in rats’ liver were measured. In another aspect, the effects of AST on the regulation of urate transport proteins were investigated by measuring the relative expressions of mRNAs and proteins of reabsorption transport proteins (GLUT9, URAT1) and secretion transport proteins (OAT1, OAT3 and ABCG2) in the rats’ kidneys.

2. Results and Discussion

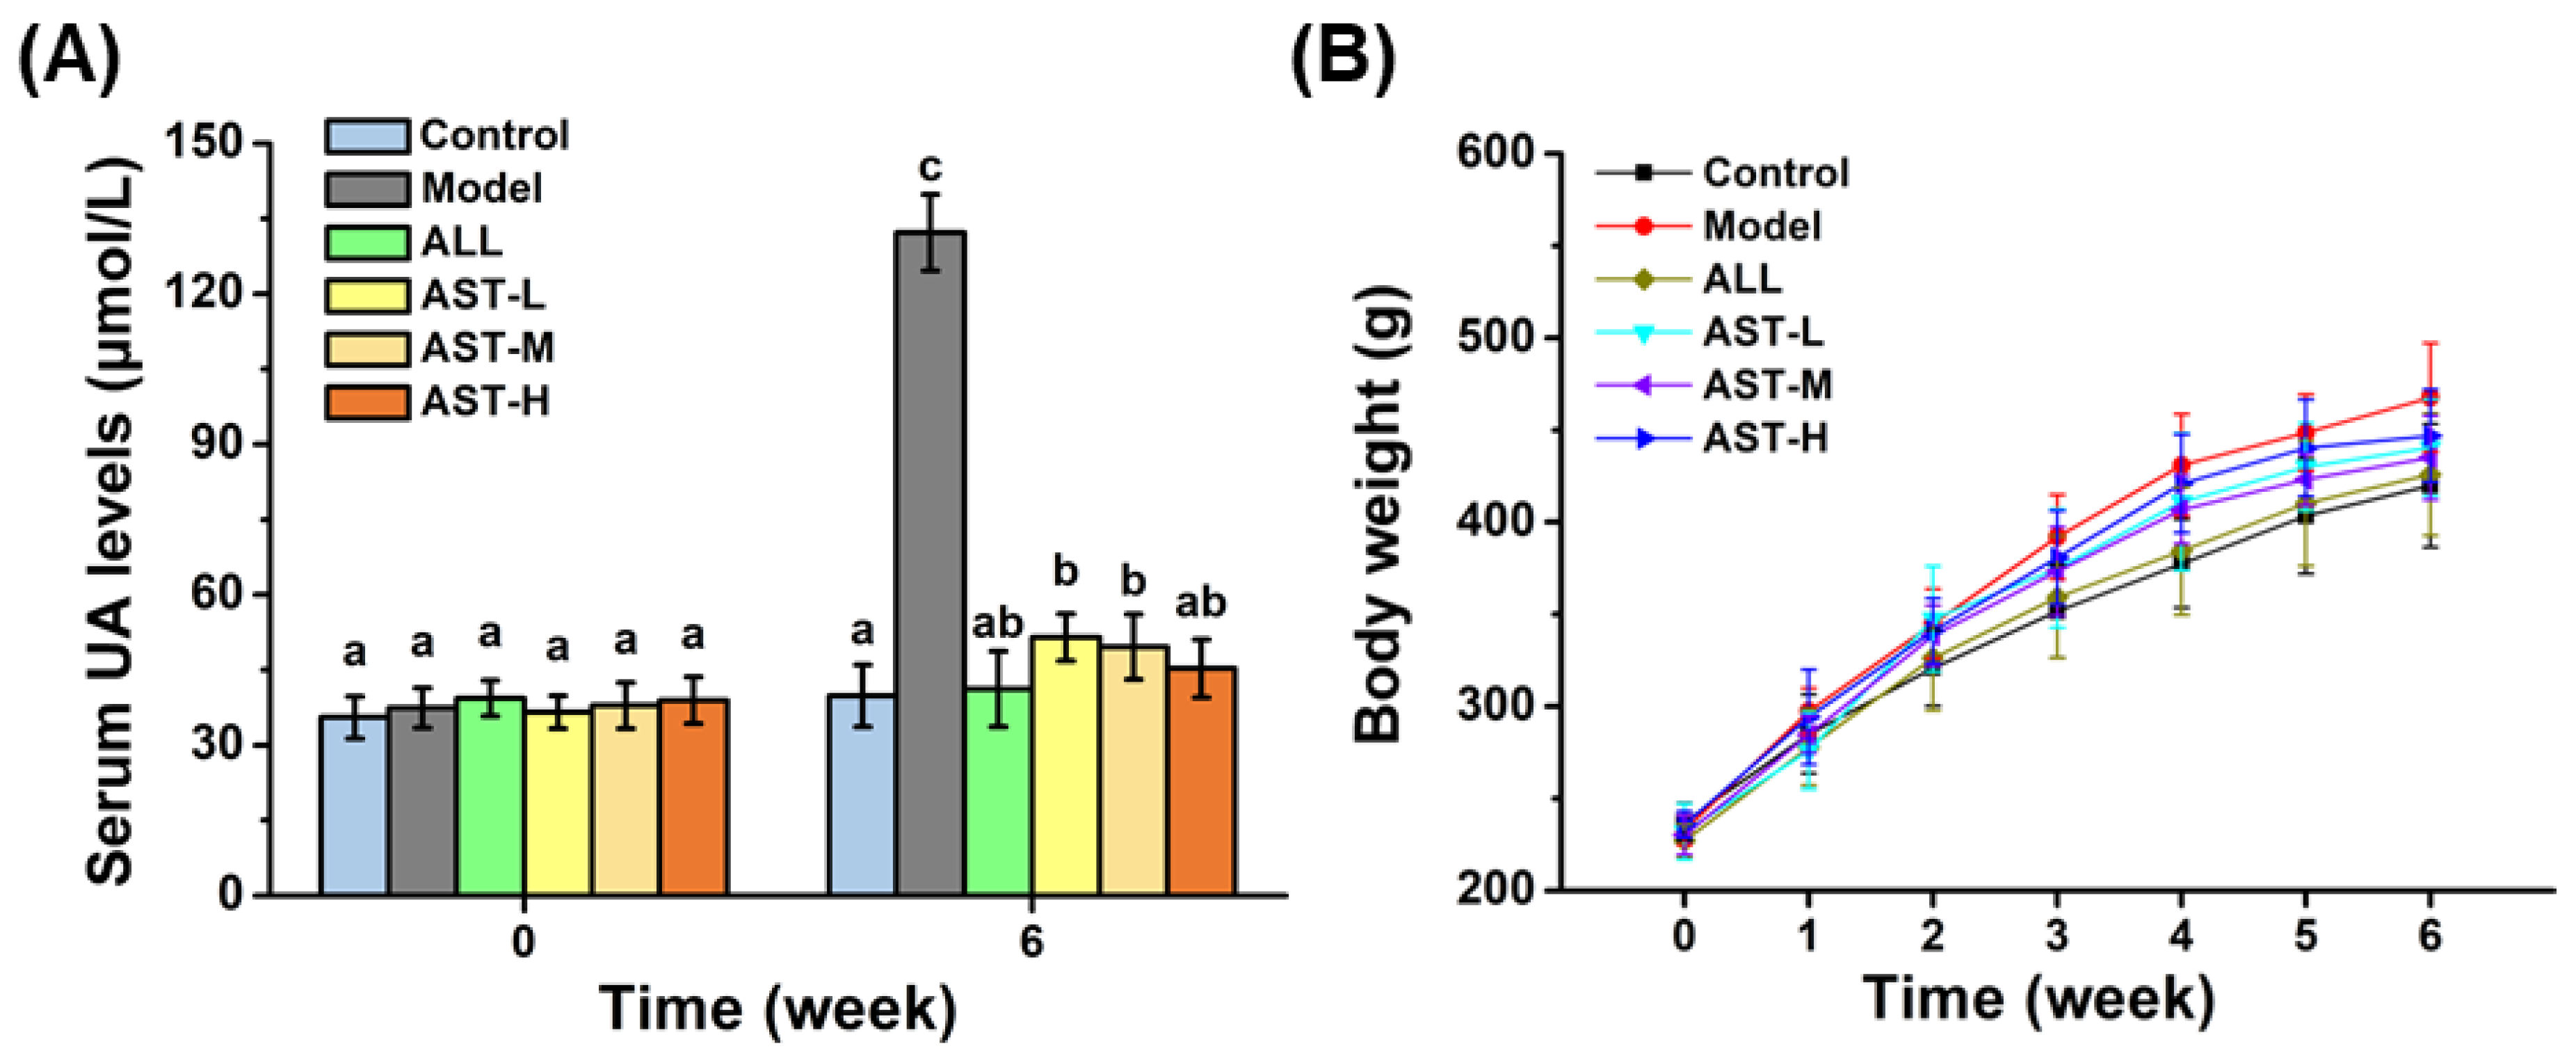
2.1. Effect of AST on Serum UA Level

The high-fructose diet is a major incentive in the case of HUA [28]. 10% fructose in drinking water is commonly used to induce HUA in rat models [29,30]. In this study, the control group (Control) received normal drinking water, while the other groups were given 10% fructose in drinking water. The other groups were divided into five groups, which included; model group (Model), allopurinol group (ALL), astaxanthin low-dose group (AST-L), astaxanthin middle-dose group (AST-M) and astaxanthin high-dose group (AST-H). The dose range of AST used in this study was 10–40 mg/kg BW/day, which were higher than the proposed amounts in humans. Nevertheless, it should be noted that AST cannot be completely absorbed by the human body because of its poor bioavailability and overdose astaxanthin would be excreted out of body [31]. The levels of serum UA at the start of experimentation and in the sixth week were measured, which are shown in Figure 1. At the start of experimentation, there were no significant differences in the serum UA levels among all the six groups. After six weeks, the level of serum UA in the model group was significantly increased than that of the control group as expected (Figure 1A), indicating the successful establishment of HUA rat models. In comparison with the model group, the levels of serum UA significantly decreased in the ALL and AST groups (Figure 1A). Specifically, the administration of allopurinol lowered the serum UA to the normal level, which was consistent with the previous study [32]. Among all the three AST groups, the AST-H group exhibited the best effect on lowering the serum UA level. The serum UA level of AST-H group showed no significant difference from that of the control group (Figure 1A). The results indicated that the AST group could efficiently decrease the level of serum UA in fructose-induced HUA rat models. The changes in the body weight of rats are shown in Figure 1B. As compared to the control group, the body weights of rats in the model group were significantly increased due to fructose feeding. There were no significant differences in the body weights of rats between the AST groups and the model group, which indicated that the AST had no effect on the body weight (Figure 1B).

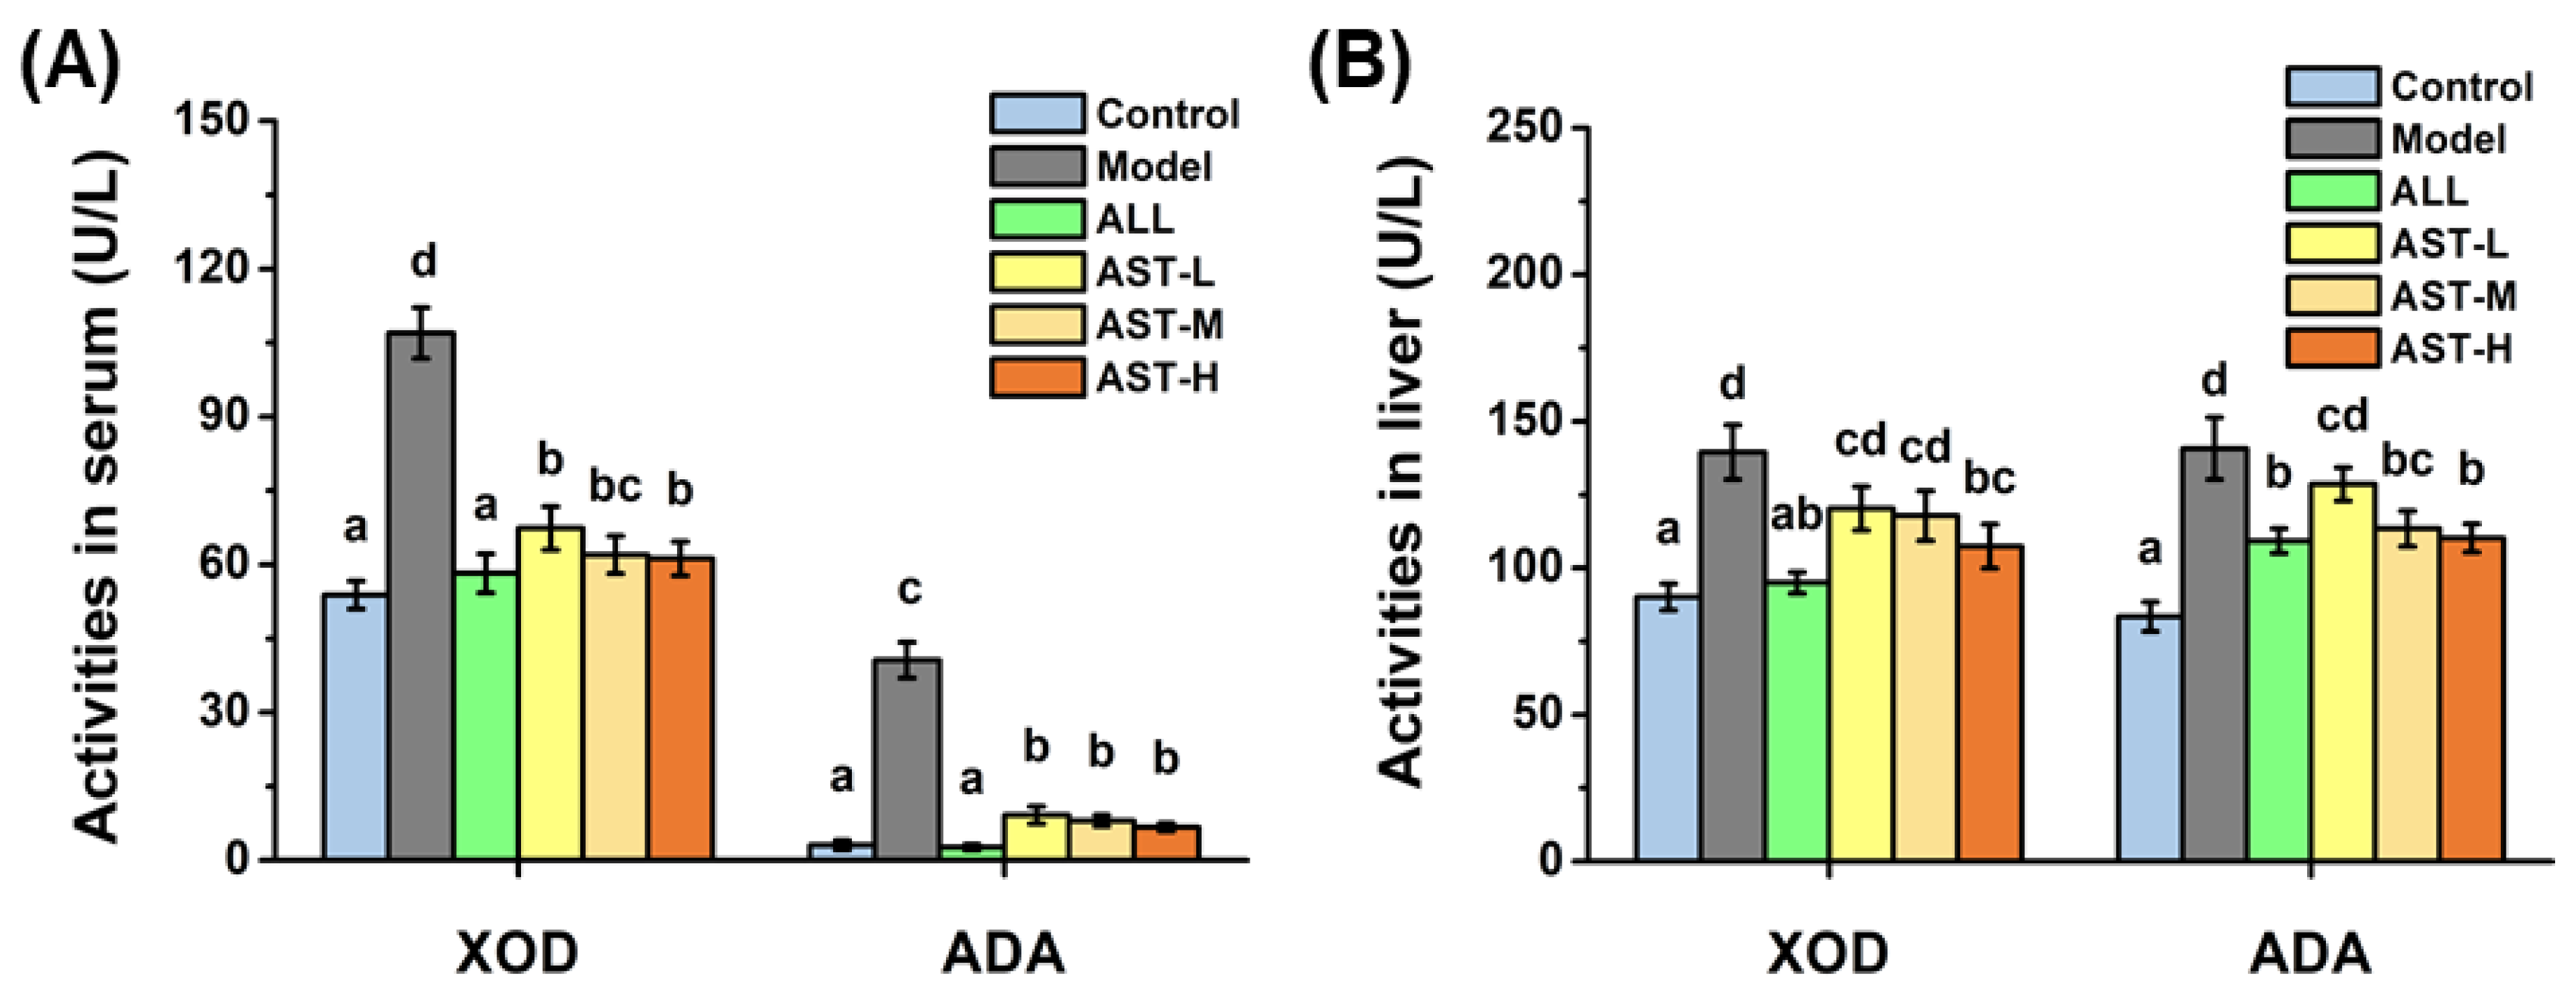
2.2. Effects of AST on Enzymatic Activities and mRNA Expressions of XOD and ADA in Liver

Blocking the UA synthesis is a key strategy for the treatment of HUA, since the reduction in UA synthesis directly leads to the decrement of serum UA level [33]. XOD and ADA are the key enzymes responsible for the synthesis of UA, which are primarily produced in the liver [34]. In order to demonstrate the inhibitory effects of AST on UA synthesis, the enzymatic activities of XOD and ADA in serum and liver were measured. As shown in Figure 2, the enzymatic activities of both the XOD and ADA in the liver significantly increased in the model group as compared to those in the control group. The high levels of fructose metabolism in liver increased the enzymatic activities of XOD and ADA, which are the pathogenic factors for HUA [35,36]. Whereas, in the ALL group, the allopurinol inhibited the enzymatic activities of XOD and ADA in liver (Figure 2), which was consistent with the previous studies [37,38]. As compared to the model group, the enzymatic activities of XOD and ADA in the AST groups decreased significantly (Figure 2). The trends of the enzymatic activities of XOD and ADA in the serum were remarkably similar to that of the liver (Figure 2). Many studies have reported that the suppression of the enzymatic activities of XOD and ADA can decrease the synthesis of UA to a greater extent [21,39]. He et al. found that the inhibition of the activity of XOD significantly decreased the serum UA level, thereby improving the hyperuricemic condition [40]. Therefore, it is suggested that AST decreases the synthesis of UA by retarding the fructose-induced elevation of XOD and ADA enzymatic activities in both the serum and liver.
As illustrated in Figure 3, the relative expressions of the mRNA of XOD and ADA in the model group increased significantly as compared to the control group. On contrary, the mRNA expressions of XOD and ADA decreased significantly in the AST groups and ALL groups as compared to the model group (Figure 3). The comparison of Figure 2 and Figure 3 suggested that the changes in the enzymatic activities of XOD and ADA were correlated with changes in the relative expressions of the mRNAs of XOD and ADA in liver. The decrease in the enzymatic activities of XOD and ADA was probably associated with the down-regulation of the corresponding mRNA expressions [41]. Therefore, it could be inferred that AST decreased the serum UA level by inhibiting the enzymatic activities and mRNA expressions of XOD and ADA, and thus improving the hyperuricemic condition (Figure 4).

2.3. Effects of AST on 24 h Urine Volume and Total UA Excretion

The under-excretion of UA in kidney is another main cause of HUA [42]. In order to determine whether the AST contributed to the excretion of urinary UA, 24 h urine samples were collected and their volume and UA contents were measured. As listed in Table 1, in comparison with the control group, all the other five groups excreted more urine and UA. The increased UA excretion detected in the model group was probably due to the excessive synthesis of UA [43]. Allopurinol inhibits the synthesis of UA by acting on the XOD [44], therefore the 24 h UA excretion of the ALL group had no significant difference from the model group, as listed in Table 1. To be noted, the 24 h UA excretion was significantly elevated in the AST-H group as compared to the model group (Table 1). However, the 24 h UA excretion in the AST-L and the AST-M groups showed no significant differences from that in the model group (Table 1). It has been reported that the increase in the UA excretion could decrease the serum UA level [45]. Therefore, these results suggested that the AST increased UA excretion, which further contributed to lowering the serum UA level and subsequently alleviating the HUA.

2.4. Effects of AST on the Levels of Serum Blood Urea Nitrogen (BUN) and Creatinine (Cr)

The level of serum UA is known to be strongly associated with the excretory function of kidney [9]. The excretory function of kidney consists of three main processes: glomerular filtration, tubular secretion and reabsorption [46]. Normally, the UA is filtered through glomerulus in the kidney. The decrease in the ability of glomerular filtration can decrease the UA excretion and further elevate the serum UA level [47]. In clinical diagnostics, both the BUN and Cr are commonly used indicators for the evaluation of glomerular function [46]. The results of serum BUN and Cr are shown in Figure 5. In the sixth week, the BUN and Cr increased significantly in the model group as compared to the control group. Cr is a small molecular weight protein that is freely filtered by the glomerulus and is not reabsorbed but undergoes only tubular secretion [48]. It is often used to noninvasively estimate the glomerular filtration. Furthermore, previous studies have reported that the BUN level correlates with the reduction of glomerular filtration [49,50,51]. Therefore, the increase in the levels of serum BUN and Cr indicated the impaired capacity of glomerular filtration. After the AST treatment, the levels of BUN and Cr in serum effectively decreased (Figure 5). These results inferred that the AST may maintain the normal function of glomerular filtration in the kidney.

2.5. Effects of AST on mRNA and Protein Expressions of Urate Transporters in Kidney

After the glomerular filtration, UA undergoes the processes of reabsorption and secretion in renal tubules, where almost 90% of the UA is reabsorbed into the blood, while the rest is excreted in urine [52]. The excretion of UA is achieved by the interaction between the reabsorption and secretion of UA in the kidney, and is associated with the various transporter proteins in kidney [15,53]. The major transporter proteins associated with the renal reabsorption of UA are URAT1 and GLUT9. The relative expression levels of the mRNA and protein of URAT1 and GLUT9 were measured and are shown in Figure 6. In the model group, the relative expression levels of the mRNA and protein of URAT1 and GLUT9 in kidney were significantly elevated as compared to that of the control group (Figure 6). This result suggested that the high-fructose diet could enhance the reabsorption of UA in kidney, which is supported by previous findings [30,54]. In contrast to the model group, the AST administration significantly down-regulated the mRNA and protein expression levels of URAT1 and GLUT9 (Figure 6). The down-regulation of the protein expressions of URAT1 and GLUT9 was probably ascribed to the decreased expressions of the mRNA of the corresponding genes. As reported previously, the GLUT9 and URAT1 are responsible for the reabsorption of over 90% of UA into the cells in the proximal tubules of kidney [14,55]. The inhibition of GLUT9 and URAT1 has been reported to accelerate the excretion of UA by reducing the reabsorption of UA in HUA rats [53]. Therefore, the AST may decrease the reabsorption of UA by down-regulating the expression of mRNA and protein levels of GLUT9 and URAT1 and thus decreasing the UA level in serum.
OAT1 and OAT3 are mainly involved in the secretion of UA into the renal proximal tubules, while their specific function is to secrete UA into the epithelial cells through the basolateral membrane [10]. In the model group, the relative expression of the mRNA and protein of OAT1 and OAT3 decreased significantly (Figure 7). Habu et al. reported that the activity of organic anion at the basolateral membrane decreased whereas the proteins of OAT1 and OAT3 were down-regulated in 5% oxonic acid-induced HUA rats [56]. As compared to the model group, both AST and ALL significantly up-regulated the mRNA and protein relative expressions of OAT1 and OAT3 (Figure 7). Among these groups, the AST-H group had the greatest capacity to up-regulate the secretion proteins than the other groups. Wang et al. found that the improvement of UA excretion by the up-regulation of OAT1 and OAT3 expression effectively lowered the concentration of serum UA [57]. ABCG2 is known as a high-capacity urate secretion transporter protein, and its activity is closely associated with the serum UA level due to the genetic polymorphisms [57]. In the model group, the relative expressions of the mRNA and protein of ABCG2 decreased significantly (Figure 7). The allopurinol administration significantly increased relative expression of the mRNA and protein of ABCG2 (Figure 7). Similarly, the relative expressions of the mRNA and protein of ABCG2 were significantly up-regulated in the AST groups. Matsuo et al. studied various ABCG2 transporter mutants in comparison with the wild-type ABCG2 and found that the decrease in the activity of urate transporter protein was proportional to the decrease in the expression of ABCG2 protein [58]. The dysfunction of ABCG2 remarkably increases the risk of HUA and even gout, particularly in young people [59]. The up-regulation of ABCG2 expression in kidney and ileum benefited to the elimination of UA from the body in the HUA rats [12]. In this study, the AST administration significantly increased the mRNA and protein expressions of secretion proteins (OAT1, OAT3 and ABCG2), indicating the facilitated secretion of UA in the high fructose-induced rat models. In conclusion, the AST administration promotes the UA excretion by inhibiting the UA reabsorption and enhancing the UA secretion, which results in lowering the serum UA level and, consequently, improving hyperuricemic condition (Figure 4).

3. Materials and Methods

3.1. Materials

Astaxanthin was offered by Jingzhou Natural Astaxanthin Inc. (Hubei, China). Allopurinol was purchased from Aladdin (Shanghai, China). Fructose (99%) was offered by Shanghai Macklin Biochemical Technology Co., Ltd. (Shanghai, China). The rabbit anti-rat polyclonal primary antibodies for URAT1, GLUT9, OAT1, OAT3, ABCG2, β-actin and horseradish peroxidase-conjugated goat anti-rabbit IgG secondary antibody were provided by Beijing Bioss Biological Technology Co., Ltd. (Beijing, China). The kits for UA, XOD, ADA, Cr and BUN were purchased from Jiancheng Bioengineering Institute (Nanjing, China). HiScript III RT SuperMix for qPCR (+gDNA wiper) was purchased from Nanjing vazyme Biological Technology Co., Ltd. (Nanjing, China). TRIzol reagent was purchased from Shanghai Thermo Fisher (Shanghai, China). All reagents used in this study were of analytical grade.

3.2. Animals, Hyperuricemia Induction and Experimental Design

The experiments on rats were conducted according to the Animal Research Committee of Zhejiang Ocean University, (Laboratory Animal Certificate No. SCXK ZHE 2019-0031). The experiments were conducted on male Sprague-Dawley (SD) rats with body weight around 230 ± 10 g, purchased from Experiment Animal Center of Zhejiang Province (Hangzhou, China). All the animals were housed in a controlled atmosphere (22 ± 2 °C at 55 ± 5% humidity) with normal light:dark (12:12 h) cycle and free access to food and water. The rats were supplied with water and regular diet and libitum for 7 days of acclimation before starting the study.
Rats were divided into 6 groups (n = 8/group), which included: (1) control group (Control); (2) model group (Model); (3) allopurinol group (ALL), in which rats were orally administered with allopurinol (40 mg/kg BW/day); (4) astaxanthin low dose group (ASL-L), in which rats were orally administered with astaxanthin (10 mg/kg BW/day); (5) astaxanthin middle dose group (ASL-M), in which rats were orally administered with astaxanthin (20 mg/kg BW/day) and (6) astaxanthin high dose group (ASL-H), in which rats were orally administered with astaxanthin (40 mg/kg BW/day). The control group received normal drinking water, while the other groups were given drinking water with 10% fructose for six weeks to induce HUA. On day 40, all the rats were singly housed into metabolic cages to collect 24 h urine. At the end of sixth week, the rats were sacrificed and the blood samples were collected for serum preparation. The kidney and liver were isolated and stored at −80 °C for the subsequent experimentations.

3.3. Biochemical Analysis

The urine samples were centrifuged at 3000 rpm for 10 min and the supernatants were collected. The whole blood samples were centrifuged at 8000 rpm for 5 min to obtain serum for further analysis. Referring to the method by Zheng et al. [60], the kidney tissues were mixed with normal saline with a ratio of 1:9 on ice, and then centrifuged at 4000 rpm for 10 min to obtain liver homogenate. The bicinchoninic acid (BCA) total protein assay kit was used to quantify the protein concentration in the supernatant of liver homogenate. The levels of BUN, Cr and UA in serum and the enzymatic activities of XOD and ADA were measured using commercial kits (Nanjing Jiancheng Biotechnology Institute, Nanjing, China) according to the manufacturer’s instructions.

3.4. RT-PCR Analysis

For the RT-PCR analysis of ADA, XOD, ABCG2, OAT1, OAT3, URAT1 and GLUT9, 0.5 g of liver and kidney tissues were collected. TRIzol reagent was used for the extraction of total RNA according to the manufacturer’s protocol. The cDNA was prepared using HiScript III RT SuperMix from the total RNA. The PCR conditions were set as follows: 50 °C for 2 min, 95 °C for 5 min, then 40 cycles of 95 °C for 15 s and 60 °C for 60 s, 95 °C for 15 s, 60 °C for 15 s. The primer sequences are listed in Table 2. The internal reference and target genes for each sample were subjected to PCR reaction, and each sample was measured in three replicate wells. The experimental data was normalized to β-actin as a housekeeping gene and analyzed by the 2−ΔΔCt method.

3.5. Western Blotting

As described by Zheng et al. [60], the protein extraction was carried from kidney sample homogenate at low temperature. The concentration of proteins was detected using BCA protein assay kit. The extracted protein samples were separated using sodium-dodecyl sulfate polyacrylamide gel electrophoresis (SDS-PAGE). After blocking of nonspecific sites, the membrane was probed with primary antibodies (1:1000, anti-URAT1, anti-ABCG2, anti-OAT1, anti-OAT3 and anti-GLUT9, Bioss, Beijing, China) at 4 °C for overnight, which was then followed by incubation with horseradish peroxidase-conjugated secondary antibody (1:2000, Bioss, Beijing, China) at room temperature for 2 h. The images were acquired using Alpha FluorChem FC3 imaging system (ProteinSimple, San Jose, CA, USA) and the expressions of the proteins were analyzed using Image Lab software. β-actin was used as control.

3.6. Statistical Analysis

In this study, the data was presented as mean ± SD (standard deviation). The statistical significance between groups was determined by one-way ANOVA, followed by the Tukey–Kramer test (p < 0.05) using SPSS version 23 software (Chicago, Illinois, USA).

4. Conclusions

The present study investigated the preventive effects of AST on high-fructose-induced hyperuricemia (HUA) in rats. After AST administration, the level of serum UA significantly decreased as compared to the model group. In particular, the high dose of AST restored the serum UA level to normal. From the aspect of UA synthesis, the AST decreased the enzymatic activities of XOD and ADA in serum and the liver by down-regulating the mRNA expression of XOD and ADA in the liver. Meanwhile, the AST also down-regulated the expressions of the mRNA and protein of reabsorption proteins (URAT1 and GLUT9), as well as up-regulated the expressions of the mRNA and protein of secretion proteins (OAT1, OAT3 and ABCG2). Based on these results, it is indicated that the AST decreased the serum UA level by reducing the UA synthesis and promoting the UA excretion. Therefore, the AST could serve as a potential agent for the prevention of HUA.

Author Contributions

Y.C. and G.D. conceived and designed the experiments. Y.L., X.Z. and J.Z. carried out the experiment. F.Y., Y.T. and Z.Y. performed the statistical analysis of the data. Y.L. and Y.C. wrote the manuscript. All authors have read and agreed to the published version of the manuscript.

Funding

This work was financially supported by Zhejiang Provincial Natural Science Foundation of China (grant No. LQ18B060004), the National Natural Science Foundation of China (grant No. 21808208), the Scientific Research Start-up Funds of Zhejiang Ocean University (grant No. 11135090118) and the Fundamental Research Funds for Zhejiang Provincial Universities and Research Institutes (grant No. 2020J00001).

Conflicts of Interest

The authors declare no conflict of interest.

Abbreviations

ASTastaxanthin
UAuric acid
XODxanthine oxidase
ADAadenosine deaminase
URAT1urate transporter 1
GLUT9glucose transporter 9
OAT1organic anion transporter 1
OAT3organic anion transporter 3
ABCG2ATP binding cassette superfamily G 2
Piintracellular phosphate
AMPDAMP deaminase
IMPinosine monophosphate
PNPpurine nucleoside phosphorylase
BUNblood urea nitrogen
Crcreatinine

References

  1. Malik, V.S.; Hu, F.B. Fructose and Cardiometabolic Health: What the Evidence From Sugar-Sweetened Beverages Tells Us. J. Am. Coll. Cardiol. 2015, 66, 1615–1624. [Google Scholar] [CrossRef] [PubMed] [Green Version]
  2. Johnson, R.J.; Nakagawa, T.; Sanchez-Lozada, L.G.; Shafiu, M.; Sundaram, S.; Le, M.; Ishimoto, T.; Sautin, Y.Y.; Lanaspa, M.A. Sugar, uric acid, and the etiology of diabetes and obesity. Diabetes 2013, 62, 3307–3315. [Google Scholar] [CrossRef] [PubMed] [Green Version]
  3. Chen-Xu, M.; Yokose, C.; Rai, S.K.; Pillinger, M.H.; Choi, H.K. Contemporary Prevalence of Gout and Hyperuricemia in the United States and Decadal Trends: The National Health and Nutrition Examination Survey, 2007–2016. Arthritis Rheumatol. 2019, 71, 991–999. [Google Scholar] [CrossRef] [PubMed]
  4. Maiuolo, J.; Oppedisano, F.; Gratteri, S.; Muscoli, C.; Mollace, V. Regulation of uric acid metabolism and excretion. Int. J. Cardiol. 2016, 213, 8–14. [Google Scholar] [CrossRef] [Green Version]
  5. Hille, R.; Hall, J.; Basu, P. The mononuclear molybdenum enzymes. Chem. Rev. 2014, 114, 3963–4038. [Google Scholar] [CrossRef] [Green Version]
  6. Caliceti, C.; Calabria, D.; Roda, A.; Cicero, A.F.G. Fructose Intake, Serum Uric Acid, and Cardiometabolic Disorders: A Critical Review. Nutrients 2017, 9, 395. [Google Scholar] [CrossRef]
  7. Zhang, Y.; Deng, L.; Wu, C.; Zheng, L.; Zhong, G. Konjac glucomannan improves hyperuricemia through regulating xanthine oxidase, adenosine deaminase and urate transporters in rats. J. Funct. Foods 2018, 48, 566–575. [Google Scholar] [CrossRef]
  8. Kang, L.L.; Zhang, D.M.; Ma, C.H.; Zhang, J.H.; Jia, K.K.; Liu, J.H.; Wang, R.; Kong, L.D. Cinnamaldehyde and allopurinol reduce fructose-induced cardiac inflammation and fibrosis by attenuating CD36-mediated TLR4/6-IRAK4/1 signaling to suppress NLRP3 inflammasome activation. Sci. Rep. 2016, 6, 27460–27478. [Google Scholar] [CrossRef]
  9. Dong, Z.; Zhou, J.; Jiang, S.; Li, Y.; Zhao, D.; Yang, C.; Ma, Y.; Wang, Y.; He, H.; Ji, H.; et al. Effects of multiple genetic loci on the pathogenesis from serum urate to gout. Sci. Rep. 2017, 7, 43614–43626. [Google Scholar] [CrossRef] [Green Version]
  10. So, A.; Thorens, B. Uric acid transport and disease. J. Clin. Investig. 2010, 120, 1791–1799. [Google Scholar] [CrossRef] [Green Version]
  11. Mizuno, N.; Takahashi, T.; Iwase, Y.; Kusuhara, H.; Niwa, T.; Sugiyama, Y. Human organic anion transporters 1 (hOAT1/SLC22A6) and 3 (hOAT3/SLC22A8) transport edaravone (MCI-186; 3-methyl-1-phenyl-2-pyrazolin-5-one) and its sulfate conjugate. Drug Metab. Dispos. 2007, 35, 1429–1434. [Google Scholar] [CrossRef] [PubMed] [Green Version]
  12. Morimoto, C.; Tamura, Y.; Asakawa, S.; Kuribayashi-Okuma, E.; Nemoto, Y.; Li, J.; Murase, T.; Nakamura, T.; Hosoyamada, M.; Uchida, S.; et al. ABCG2 expression and uric acid metabolism of the intestine in hyperuricemia model rat. Nucleosides Nucleotides Nucleic Acids 2020, 39, 744–759. [Google Scholar] [CrossRef] [PubMed]
  13. Burckhardt, G. Drug transport by Organic Anion Transporters (OATs). Pharmacol. Ther. 2012, 136, 106–130. [Google Scholar] [CrossRef] [PubMed]
  14. Hosoyamada, M.; Ichida, K.; Enomoto, A.; Hosoya, T.; Endou, H. Function and localization of urate transporter 1 in mouse kidney. J. Am. Soc. Nephrol. 2004, 15, 261–268. [Google Scholar] [CrossRef] [PubMed] [Green Version]
  15. Takiue, Y.; Hosoyamada, M.; Kimura, M.; Saito, H. The Effect of Female Hormones upon Urate Transport Systems in the Mouse Kidney. Nucleosides Nucleotides Nucleic Acids 2011, 30, 113–119. [Google Scholar] [CrossRef] [PubMed]
  16. Kim, I.Y.; Han, K.D.; Kim, D.H.; Eun, Y.; Cha, H.S.; Koh, E.M.; Lee, J.; Kim, H. Women with Metabolic Syndrome and General Obesity Are at a Higher Risk for Significant Hyperuricemia Compared to Men. J. Clin. Med. 2019, 8, 837. [Google Scholar] [CrossRef] [Green Version]
  17. Azevedo, V.F.; Buiar, P.G.; Giovanella, L.H.; Severo, C.R.; Carvalho, M. Allopurinol, benzbromarone, or a combination in treating patients with gout: Analysis of a series of outpatients. Int. J. Rheumatol. 2014, 2014, 263720–263726. [Google Scholar] [CrossRef] [Green Version]
  18. Jalal, D.I.; Chonchol, M.; Chen, W.; Targher, G. Uric acid as a target of therapy in CKD. Am. J. Kidney Dis. 2013, 61, 134–146. [Google Scholar] [CrossRef] [Green Version]
  19. Sabina, E.P.; Nagar, S.; Rasool, M. A role of piperine on monosodium urate crystal-induced inflammation—An experimental model of gouty arthritis. Inflammation 2011, 34, 184–192. [Google Scholar] [CrossRef]
  20. Kaufmann, P.; Torok, M.; Hanni, A.; Roberts, P.; Gasser, R.; Krahenbuhl, S. Mechanisms of benzarone and benzbromarone-induced hepatic toxicity. Hepatology 2005, 41, 925–935. [Google Scholar] [CrossRef]
  21. Park, J.-E.; Yeom, Z.; Park, K.-T.; Han, E.H.; Yu, H.J.; Kang, H.; Lim, Y.-H. Hypouricemic Effect of Ethanol Extract of Aster glehni Leaves in Potassium Oxonate-Induced Hyperuricemic Rats. Clin. Nutr. Res. 2018, 7, 126–135. [Google Scholar] [CrossRef] [PubMed] [Green Version]
  22. Wang, Y.; Lin, Z.; Zhang, B.; Nie, A.; Bian, M. Cichorium intybus L. promotes intestinal uric acid excretion by modulating ABCG2 in experimental hyperuricemia. Nutr. Metab. 2017, 14, 1–11. [Google Scholar] [CrossRef] [PubMed] [Green Version]
  23. Lee, Y.-S.; Sung, Y.-Y.; Yuk, H.J.; Son, E.; Lee, S.; Kim, J.S.; Kim, D.-S. Anti-hyperuricemic effect of Alpinia oxyphylla seed extract by enhancing uric acid excretion in the kidney. Phytomedicine 2019, 62, 152975–152982. [Google Scholar] [CrossRef] [PubMed]
  24. Chen, J.; Wei, D.; Pohnert, G. Rapid Estimation of Astaxanthin and the Carotenoid-to-Chlorophyll Ratio in the Green Microalga Chromochloris zofingiensis Using Flow Cytometry. Mar. Drugs 2017, 15, 231. [Google Scholar] [CrossRef] [Green Version]
  25. Ying, C.-J.; Zhang, F.; Zhou, X.-Y.; Hu, X.-T.; Chen, J.; Wen, X.-R.; Sun, Y.; Zheng, K.-Y.; Tang, R.; Song, Y. Anti-inflammatory Effect of Astaxanthin on the Sickness Behavior Induced by Diabetes Mellitus. Cell. Mol. Neurobiol. 2015, 35, 1027–1037. [Google Scholar] [CrossRef]
  26. Mori, J.; Yokoyama, H.; Sawada, T.; Miyashita, Y.; Nagata, K. Anti-Oxidative Properties of Astaxanthin and Related Compounds. Mol. Cryst. Liq. Cryst. 2013, 580, 52–57. [Google Scholar] [CrossRef]
  27. Zhang, L.; Wang, H. Multiple Mechanisms of Anti-Cancer Effects Exerted by Astaxanthin. Mar. Drugs 2015, 13, 4310–4330. [Google Scholar] [CrossRef] [Green Version]
  28. Choi, H.K.; Willett, W.; Curhan, G. Fructose-Rich Beverages and Risk of Gout in Women. Orig. Contrib. 2010, 304, 2270–2278. [Google Scholar] [CrossRef] [Green Version]
  29. Chen, L.; Lan, Z.; Zhou, Y.; Li, F.; Zhang, X.; Zhang, C.; Yang, Z.; Li, P. Astilbin attenuates hyperuricemia and ameliorates nephropathy in fructose-induced hyperuricemic rats. Planta Med. 2011, 77, 1769–1773. [Google Scholar] [CrossRef]
  30. Tan, J.; Wan, L.; Chen, X.; Li, X.; Hao, X.; Li, J.; Ding, H. Conjugated Linoleic Acid Ameliorates High Fructose-Induced Hyperuricemia and Renal Inflammation in Rats via NLRP3 Inflammasome and TLR4 Signaling Pathway. Mol. Nutr. Food Res. 2019, 63, 1801402–1801411. [Google Scholar] [CrossRef]
  31. Anarjan, N.; Mirhosseini, H.; Baharin, B.S.; Tan, C.P. Effect of processing conditions on physicochemical properties of astaxanthin nanodispersions. Food Chem. 2010, 123, 477–483. [Google Scholar] [CrossRef]
  32. Stevenson, W.S.; Hyland, C.D.; Zhang, J.-G.; Morgan, P.O.; Willson, T.A.; Gill, A.; Hilton, A.A.; Viney, E.M.; Bahlo, M.; Masters, S.L.; et al. Deficiency of 5-hydroxyisourate hydrolase causes hepatomegaly and hepatocellular carcinoma in mice. Proc. Natl. Acad. Sci. USA 2010, 107, 16625–16630. [Google Scholar] [CrossRef] [PubMed] [Green Version]
  33. Aksenov, S.; Peck, C.C.; Eriksson, U.G.; Stanski, D.R. Individualized treatment strategies for hyperuricemia informed by a semi-mechanistic exposure-response model of uric acid dynamics. Physiol. Rep. 2018, 6, 13614–13636. [Google Scholar] [CrossRef]
  34. Kapoor, N.; Saxena, S. Potential Xanthine Oxidase Inhibitory Activity of Endophytic Lasiodiplodia pseudotheobromae. Appl. Biochem. Biotechnol. 2014, 173, 1360–1374. [Google Scholar] [CrossRef] [PubMed]
  35. Melmer, G.; Buchwald, M. Use of Short Oligonucleotides to Screen Cosmid Libraries for Clones Containing G/C-Rich Sequences. DNA Cell Biol. 1990, 9, 377–385. [Google Scholar] [CrossRef]
  36. Fields, M.; Lewis, C.G.; Lure, M.D. Allopurinol an inhibitor of xanthine oxidase reduces uric acid levels and modifies the signs associated with copper deficiency in rats fed fructose. Free. Radic. Biol. Med. 1996, 20, 595–600. [Google Scholar] [CrossRef]
  37. Pang, M.; Fang, Y.; Chen, S.-H.; Zhu, X.; Shan, C.; Su, J.; Yu, J.; Li, B.; Yang, Y.; Chen, B.; et al. Gypenosides Inhibits Xanthine Oxidoreductase and Ameliorates Urate Excretion in Hyperuricemic Rats Induced by High Cholesterol and High Fat Food (Lipid Emulsion). Med. Sci. Monit. 2017, 23, 1129–1140. [Google Scholar] [CrossRef] [Green Version]
  38. Han, S.; Wei, R.; Han, D.; Zhu, J.; Luo, W.; Ao, W.; Zhong, G.-Y. Hypouricemic Effects of Extracts from Urtica hyperborea Jacq. ex Wedd. in Hyperuricemia Mice through XOD, URAT1, and OAT1. BioMed Res. Int. 2020, 2020, 2968135–2968143. [Google Scholar] [CrossRef] [Green Version]
  39. Zhao, J.; He, X.; Yang, N.; Sun, L.; Li, G. Study of drug metabolism by xanthine oxidase. Int. J. Mol. Sci. 2012, 13, 4873–4879. [Google Scholar] [CrossRef]
  40. He, W.; Su, G.; Sun-Waterhouse, D.; Waterhouse, G.I.N.; Zhao, M.; Liu, Y. In vivo anti-hyperuricemic and xanthine oxidase inhibitory properties of tuna protein hydrolysates and its isolated fractions. Food Chem. 2019, 272, 453–461. [Google Scholar] [CrossRef]
  41. Wang, X.; Wang, C.P.; Hu, Q.H.; Lv, Y.Z.; Zhang, X.; Ouyang, Z.; Kong, L.D. The dual actions of Sanmiao wan as a hypouricemic agent: Down-regulation of hepatic XOD and renal mURAT1 in hyperuricemic mice. J. Ethnopharmacol. 2010, 128, 107–115. [Google Scholar] [CrossRef] [PubMed]
  42. Veronika, H.; Jana, B.; Markéta, P.; Kateˇrina, P.; Karel, P.; Ladislav, Š.; Blanka, S. Interaction of the p.Q141K Variant of the ABCG2 Gene with Clinical Data and Cytokine Levels in Primary Hyperuricemia and Gout. J. Clin. Med. 2019, 8, 1965. [Google Scholar]
  43. Olofsson, C.; Anderstam, B.; Bragfors-Helin, A.C.; Eriksson, M.; Qureshi, A.R.; Lindholm, B.; Hilding, A.; Wiczkowski, W.; Orsini, N.; Stenvinkel, P.; et al. Effects of acute fructose loading on levels of serum uric acid-a pilot study. Eur. J. Clin. Investig. 2019, 49, 13040–13049. [Google Scholar] [CrossRef] [PubMed] [Green Version]
  44. Mohamed Isa, S.S.P.; Ablat, A.; Mohamad, J. The Antioxidant and Xanthine Oxidase Inhibitory Activity of Plumeria rubra Flowers. Molecules 2018, 23, 400. [Google Scholar] [CrossRef] [Green Version]
  45. Xin, Y.; Guo, Y.; Li, Y.; Ma, Y.; Li, L.; Jiang, H. Effects of sodium glucose cotransporter-2 inhibitors on serum uric acid in type 2 diabetes mellitus: A systematic review with an indirect comparison meta-analysis. Saudi J. Biol. Sci. 2019, 26, 421–426. [Google Scholar] [CrossRef]
  46. Zhang, Z.H.; Wei, F.; Vaziri, N.D.; Cheng, X.L.; Bai, X.; Lin, R.C.; Zhao, Y.Y. Metabolomics insights into chronic kidney disease and modulatory effect of rhubarb against tubulointerstitial fibrosis. Sci. Rep. 2015, 5, 14472–14489. [Google Scholar] [CrossRef] [Green Version]
  47. Den Hartogh, D.J.; Tsiani, E. Health Benefits of Resveratrol in Kidney Disease: Evidence from In Vitro and In Vivo Studies. Nutrients 2019, 11, 1624. [Google Scholar] [CrossRef] [Green Version]
  48. Levey, A.S.; Perrone, R.D.; Madias, N.E. Serum Creatinine and renal function. Annu. Rev. 1988, 39, 465–490. [Google Scholar] [CrossRef]
  49. Jujo, K.; Minami, Y.; Haruki, S.; Matsue, Y.; Shimazaki, K.; Kadowaki, H.; Ishida, I.; Kambayashi, K.; Arashi, H.; Sekiguchi, H.; et al. Persistent high blood urea nitrogen level is associated with increased risk of cardiovascular events in patients with acute heart failure. ESC Heart Fail. 2017, 4, 545–553. [Google Scholar] [CrossRef]
  50. Testani, J.M.; Cappola, T.P.; Brensinger, C.M.; Shannon, R.P.; Kimmel, S.E. Interaction between loop diuretic-associated mortality and blood urea nitrogen concentration in chronic heart failure. J. Am. Coll. Cardiol. 2011, 58, 375–382. [Google Scholar] [CrossRef] [Green Version]
  51. Lindenfeld, J.; Schrier, R.W. Blood urea nitrogen a marker for adverse effects of loop diuretics? J. Am. Coll. Cardiol. 2011, 58, 383–385. [Google Scholar] [CrossRef] [PubMed] [Green Version]
  52. Liu, C.J.; Wu, J.S.; Huang, H.S. Decreased Associated Risk of Gout in Diabetes Patients with Uric Acid Urolithiasis. J. Clin. Med. 2019, 8, 1536. [Google Scholar] [CrossRef] [PubMed] [Green Version]
  53. Matsuo, H.; Ichida, K.; Takada, T.; Nakayama, A.; Nakashima, H.; Nakamura, T.; Kawamura, Y.; Takada, Y.; Yamamoto, K.; Inoue, H.; et al. Common dysfunctional variants in ABCG2 are a major cause of early-onset gout. Sci. Rep. 2013, 3, 2014–2018. [Google Scholar] [CrossRef] [PubMed] [Green Version]
  54. Ng, H.Y.; Lee, Y.T.; Kuo, W.H.; Huang, P.C.; Lee, W.C.; Lee, C.T. Alterations of Renal Epithelial Glucose and Uric Acid Transporters in Fructose Induced Metabolic Syndrome. Kidney Blood Press. Res. 2018, 43, 1822–1831. [Google Scholar] [CrossRef]
  55. Anzai, N.; Ichida, K.; Jutabha, P.; Kimura, T.; Babu, E.; Jin, C.J.; Srivastava, S.; Kitamura, K.; Hisatome, I.; Endou, H.; et al. Plasma urate level is directly regulated by a voltage-driven urate efflux transporter URATv1 (SLC2A9) in humans. J. Biol. Chem. 2008, 283, 26834–26838. [Google Scholar] [CrossRef] [Green Version]
  56. Habu, Y.; Yano, I.; Takeuchi, A.; Saito, H.; Okuda, M.; Fukatsu, A.; Inui, K.-I. Decreased activity of basolateral organic ion transports in hyperuricemic rat kidney: Roles of organic ion transporters, rOAT1, rOAT3 and rOCT2. Biochem. Pharmacol. 2003, 66, 1107–1114. [Google Scholar] [CrossRef]
  57. Wang, X.; Deng, J.; Xiong, C.; Chen, H.; Zhou, Q.; Xia, Y.; Shao, X.; Zou, H. Treatment with a PPAR-gamma Agonist Protects Against Hyperuricemic Nephropathy in a Rat Model. Drug Des. Devel. Ther. 2020, 14, 2221–2233. [Google Scholar] [CrossRef]
  58. Yano, H.; Tamura, Y.; Kobayashi, K.; Tanemoto, M.; Uchida, S. Uric acid transporter ABCG2 is increased in the intestine of the 5/6 nephrectomy rat model of chronic kidney disease. Clin. Exp. Nephrol. 2014, 18, 50–55. [Google Scholar] [CrossRef]
  59. Matsuo, H.; Takada, T.; Ichida, K.; Nakamura, T.; Nakayama, A.; Ikebuchi, Y.; Ito, K.; Kusanagi, Y.; Chiba, T.; Tadokoro, S.; et al. Common defects of ABCG2, a high-capacity urate exporter, cause gout: A function-based genetic analysis in a Japanese population. Sci. Transl. Med. 2009, 1, 11–19. [Google Scholar] [CrossRef]
  60. Jiawen, Z.; Wen, Z.; Pingan, Z.; Fangfang, H.; Guofang, D.; Zuisu, Y. Protective Effects of Fucoxanthin against Alcoholic Liver Injury by Activation of Nrf2-Mediated Antioxidant Defense and Inhibition of TLR4-Mediated Inflammation. Mar. Drugs 2019, 17, 552. [Google Scholar]
Figure 1. Effects of astaxanthin (AST) on serum uric acid (UA) level (A) and body weight (B). Values were expressed as mean ± SD (n = 8). The different letters indicate significant difference (p < 0.05).
Marinedrugs 18 00610 g001
Figure 2. Effects of astaxanthin (AST) on the activities of xanthine oxidase (XOD) and adenosine deaminase (ADA) in serum (A) and liver (B). Values were expressed as mean ± SD (n = 8). The different letters within the “XOD” or “ADA” indicate significant differences in the category (p < 0.05).
Marinedrugs 18 00610 g002
Figure 3. Effects of astaxanthin (AST) on the mRNA relative expressions of xanthine oxidase (XOD) and adenosine deaminase (ADA) in liver. Values were expressed as mean ± SD (n = 8). The different letters within the “XOD” or “ADA” indicate significant differences in the category (p < 0.05).
Marinedrugs 18 00610 g003
Figure 4. Multitarget role of astaxanthin (AST) in lowering serum uric acid (UA). AST decreased serum UA level by inhibiting xanthine oxidase (XOD) and adenosine deaminase (ADA)-mediated UA synthesis and promoting urate transporters-regulated UA excretion.
Marinedrugs 18 00610 g004
Figure 5. Effects of astaxanthin (AST) on the levels of blood urea nitrogen (BUN) (A) and creatinine (Cr) (B) in serum. Values were expressed as mean ± SD (n = 8). The different letters within the “BUN” or “Cr” indicate significant differences in the category (p < 0.05).
Marinedrugs 18 00610 g005
Figure 6. Effects of astaxanthin (AST) on protein relative expressions (AC) and mRNA relative expressions (D,E) of URAT1 and GLUT9 in the kidney. Values were expressed as mean ± SD (n = 8). The different letters indicate significant difference (p < 0.05).
Marinedrugs 18 00610 g006
Figure 7. Effects of astaxanthin (AST) on protein relative expressions (AD) and mRNA relative expressions (EG) of OAT1, OAT3 and ABCG2 in the kidney. Values were expressed as mean ± SD (n = 8). The different letters indicate significant difference (p < 0.05).
Marinedrugs 18 00610 g007
Table 1. Effects of astaxanthin (AST) on 24 h urine volume and total uric acid (UA) excretion.
Group24 h Urine Volume (mL)Urine UA (µmol/L)24 h Total UA Excretion (mg)
Control22.75 ± 3.40 a210.36 ± 4.24 c0.81 ± 0.12 a
Model90.68 ± 8.28 c108.90 ± 16.06 a1.66 ± 0.30 b
Allopurinol85.00 ± 8.26 bc123.98 ± 14.33 a1.78 ± 0.37 b
AST-L79.16 ± 9.89 bc116.34 ± 7.34 a1.54 ± 0.25 b
AST-M88.25 ± 9.43 bc132.09 ± 17.06 a1.86 ± 0.22 b
AST-H96.50 ± 9.15 c158.76 ± 13.29 b2.57 ± 0.29 c
Values were expressed as mean ± SD. Different letters in the same column represent significant differences (p < 0.05).
Table 2. Primers used in this study.
ProductsForward Primer (5′–>3′)Reverse Primer (5′–>3′)bp
ADACCTACGAGGGTGCAGTGAAGTATTGTGTGGTAGCCGTGCC131
XODTGATGGTTCGGTGCTGTTGAGGGACGGTGTTAGTGCTTGT128
URAT1GACCTGCAAGCCCTAGGAAGCGAAGGATCCCCATCTCACG194
ABCG2TAGGTCGGTGTGCGAGTCAGTAGGATCTATGCCTTTCTAGCTGT100
OAT1TTTATGGTGACCCCCACACTAGCTCTAAATACTTCCAACTGTGA184
OAT3CCTGGTGCCATGACCTTCTCTGGTGGGCTATTCCGAGGAC120
GLUT9ATGGACAGCCCATAGATCCGGTTGTTGACCAGCAGTGTGT112
β-actinACGTCAGGTCATCACTATGGGGCATAGAGGTCTTTACGGATG154
Publisher’s Note: MDPI stays neutral with regard to jurisdictional claims in published maps and institutional affiliations.

