Cyanobacteria as Nanogold Factories II: Chemical Reactivity and anti-Myocardial Infraction Properties of Customized Gold Nanoparticles Biosynthesized by Cyanothece sp.


Abstract
1. Introduction
2. Results
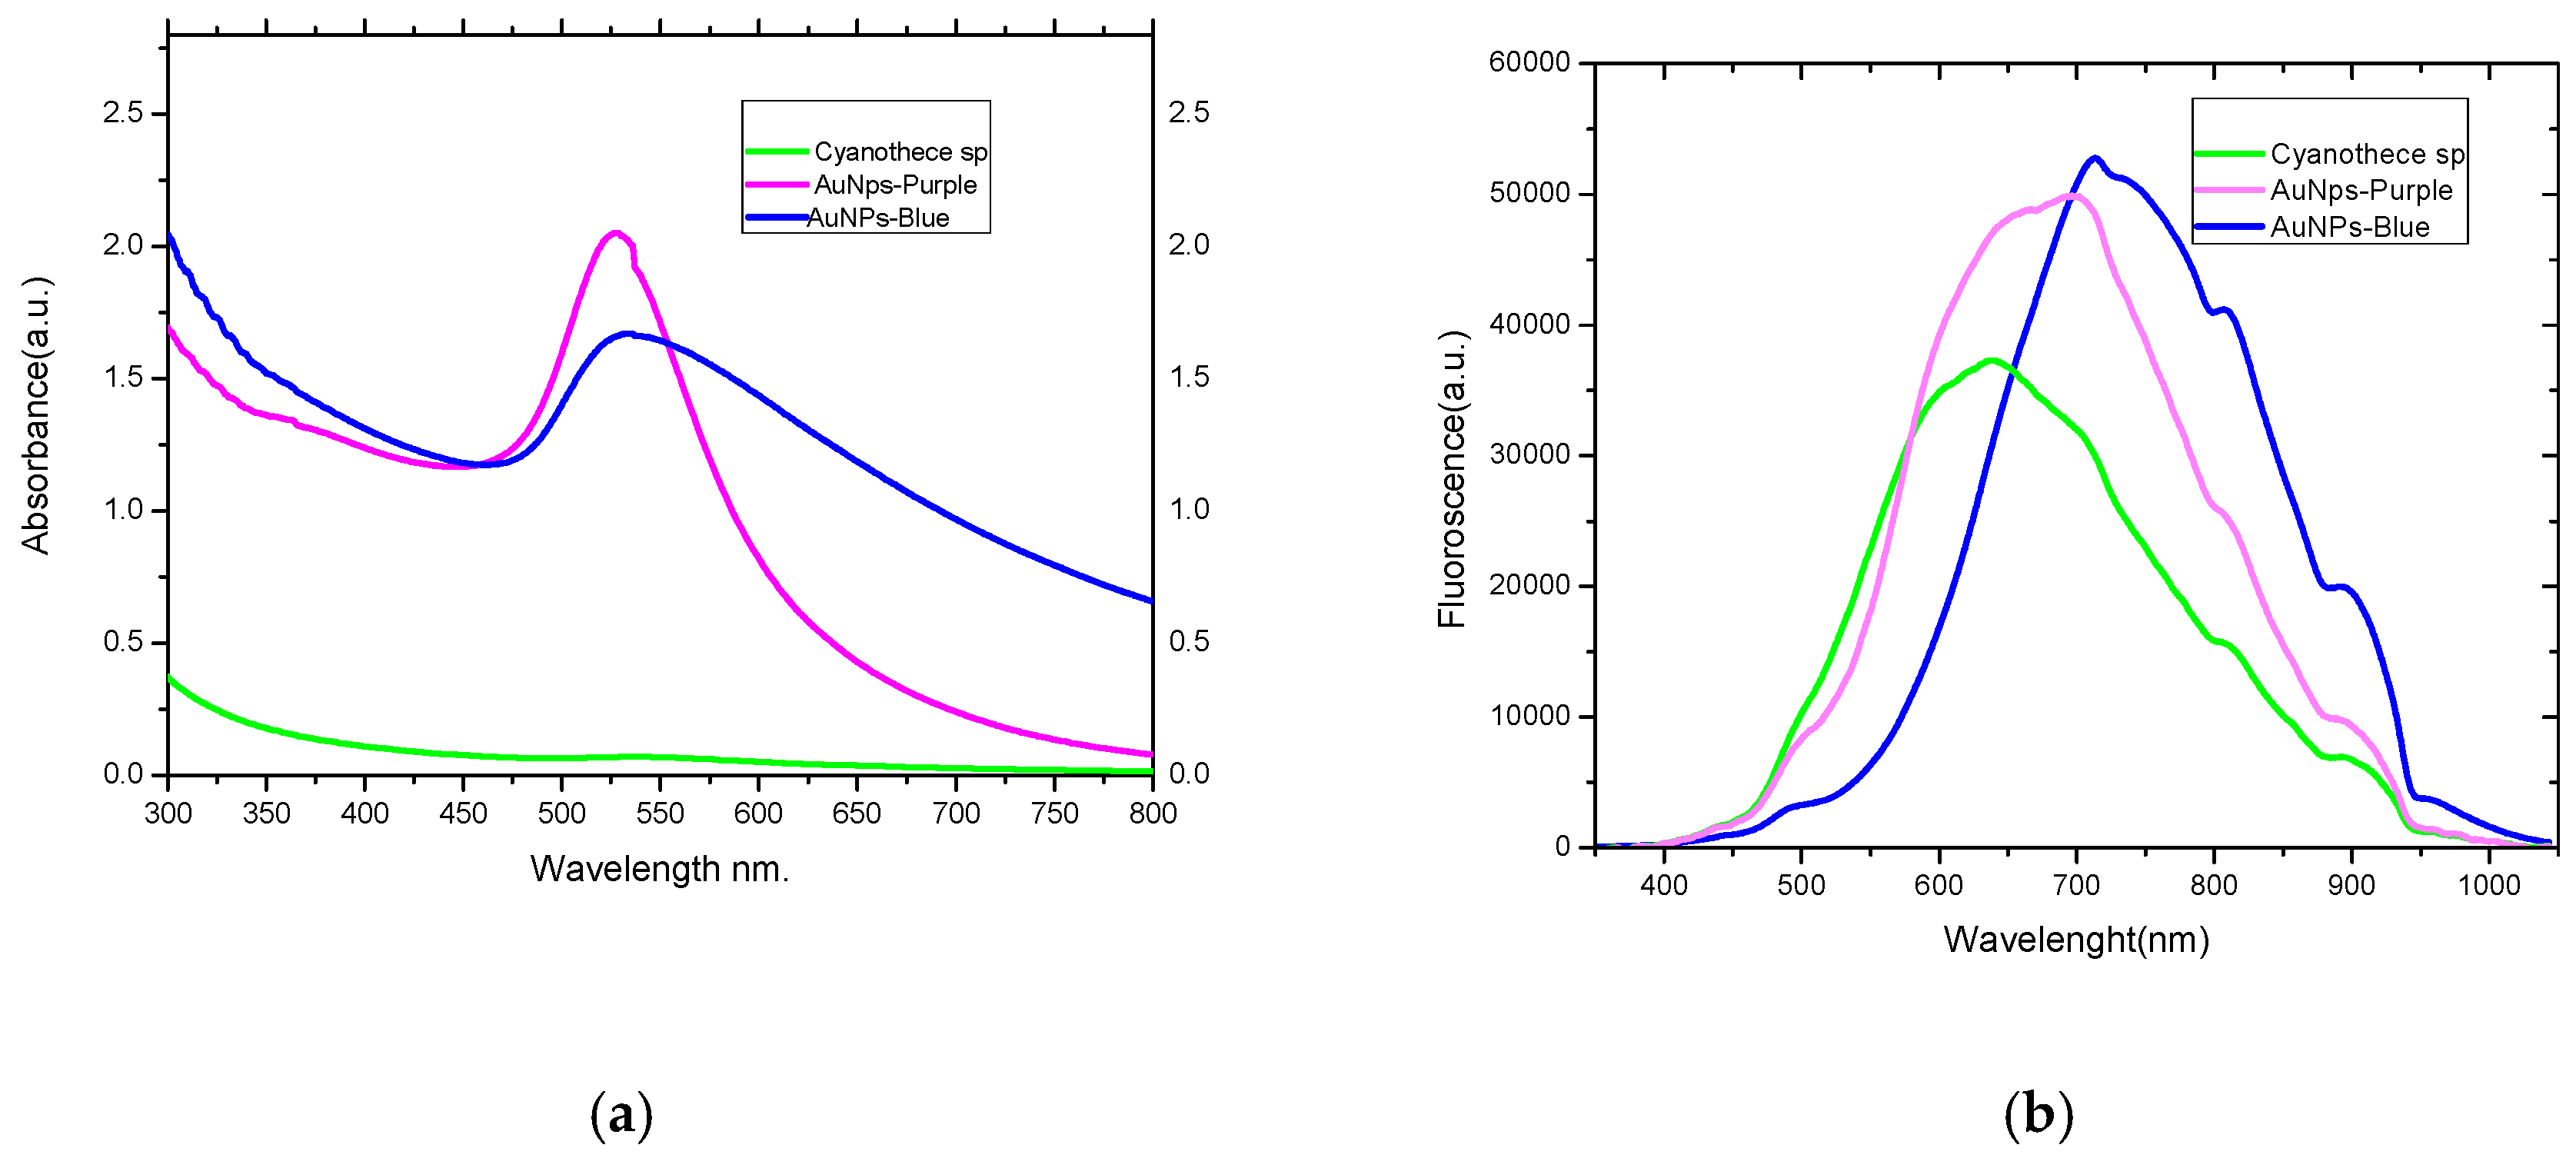
2.1. Absorption and Luminescence Spectra and Percentage Yield of the Produced AuNPs
2.2. Dynamic Light Scattering
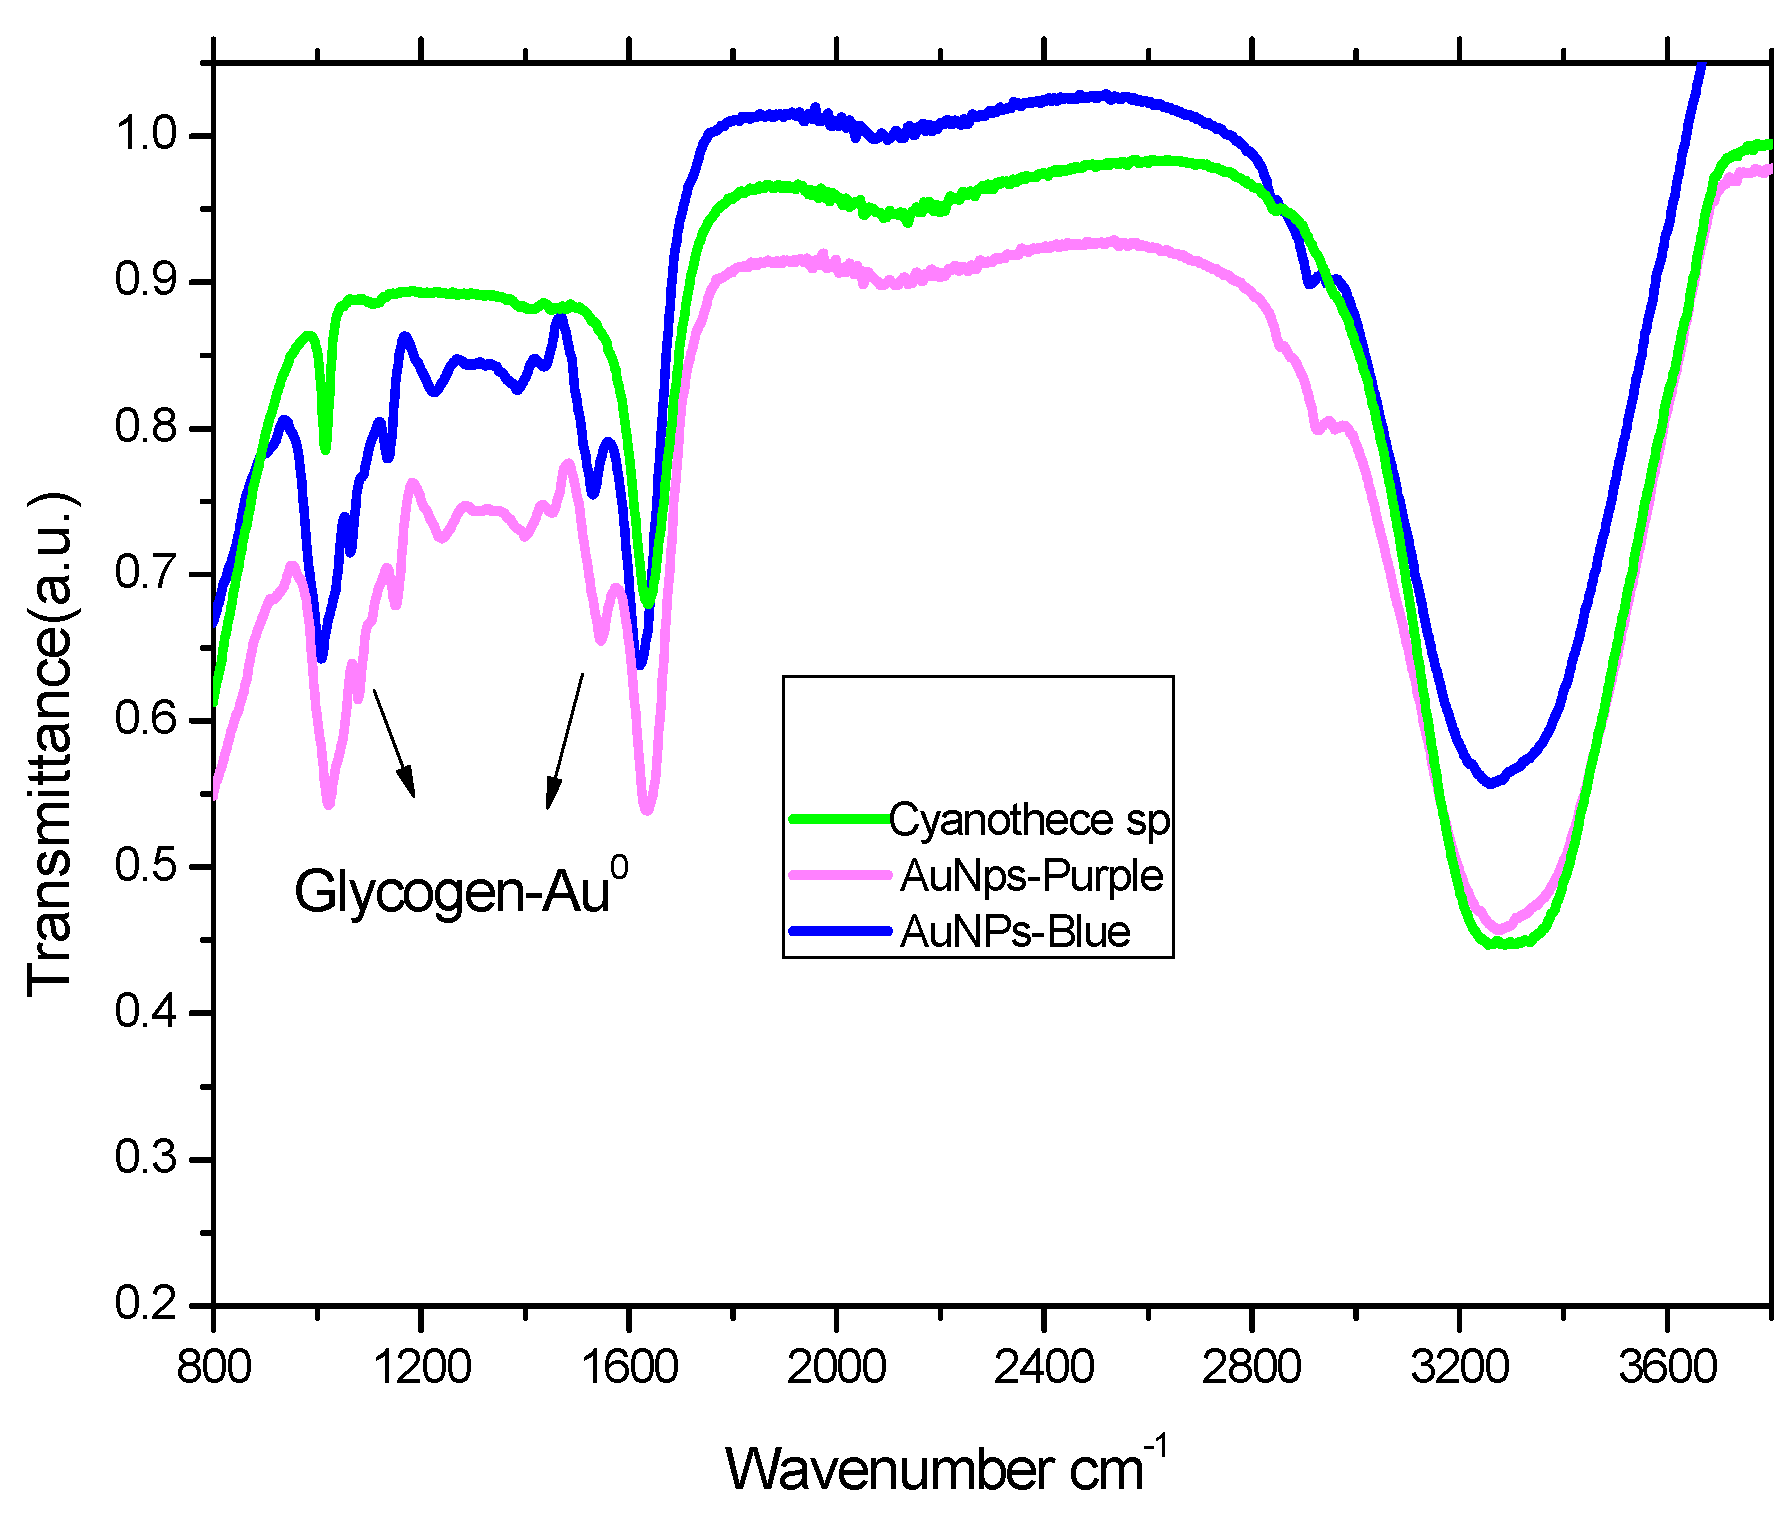
2.3. FTIR Analysis of Cyanothece sp and Its Complex with Gold Nanoparticles
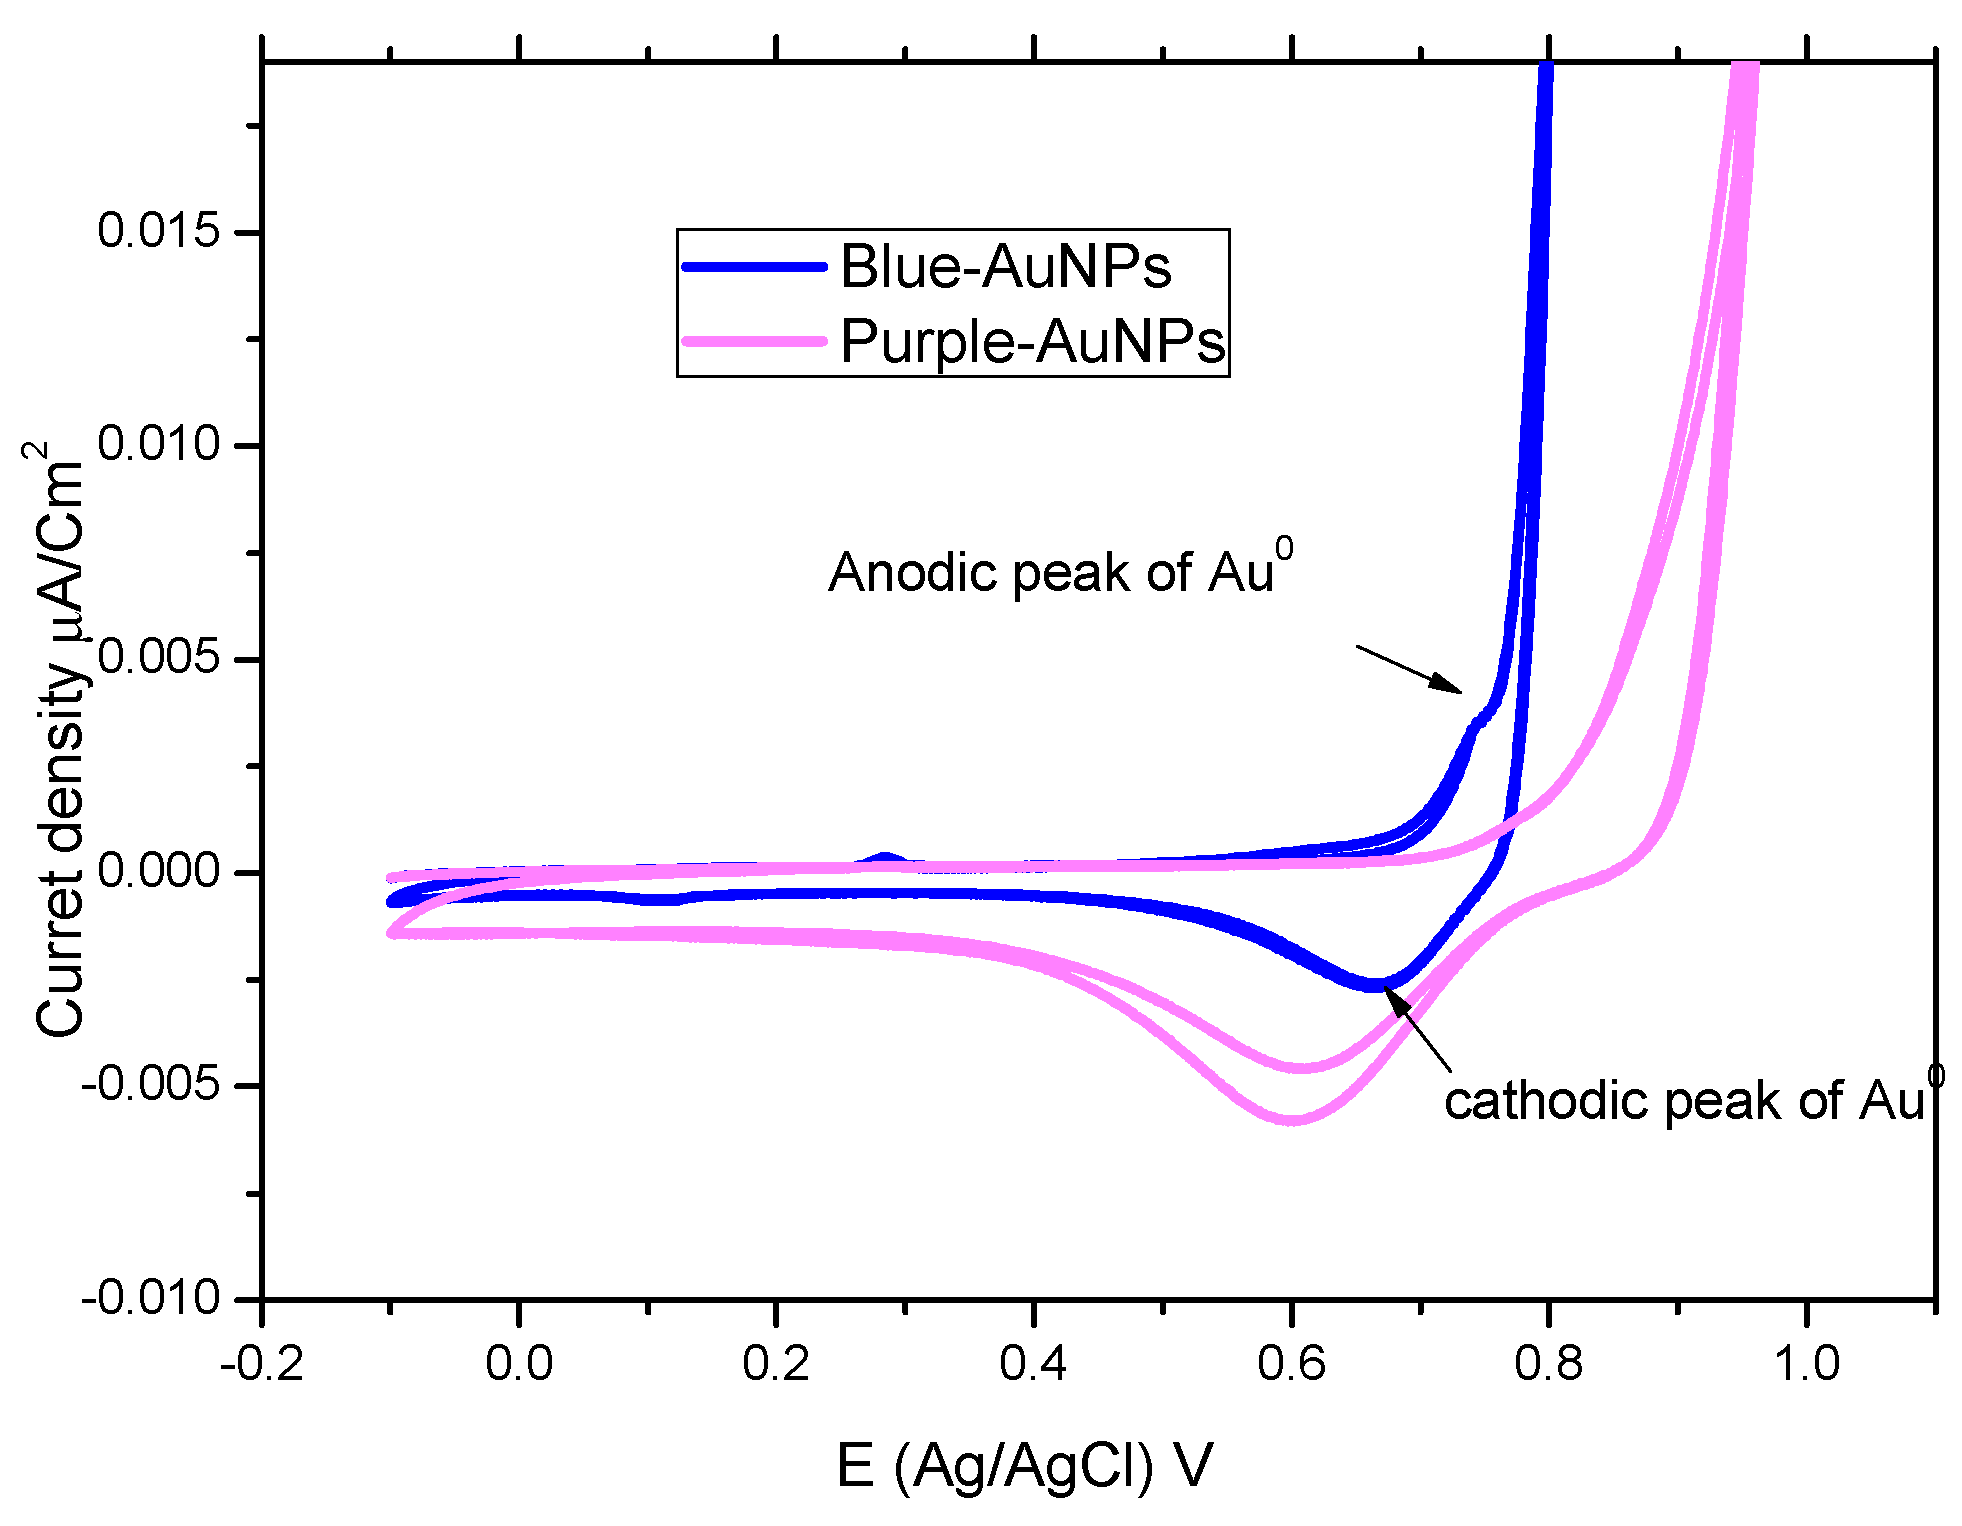
2.4. Cyclic-Voltammetry
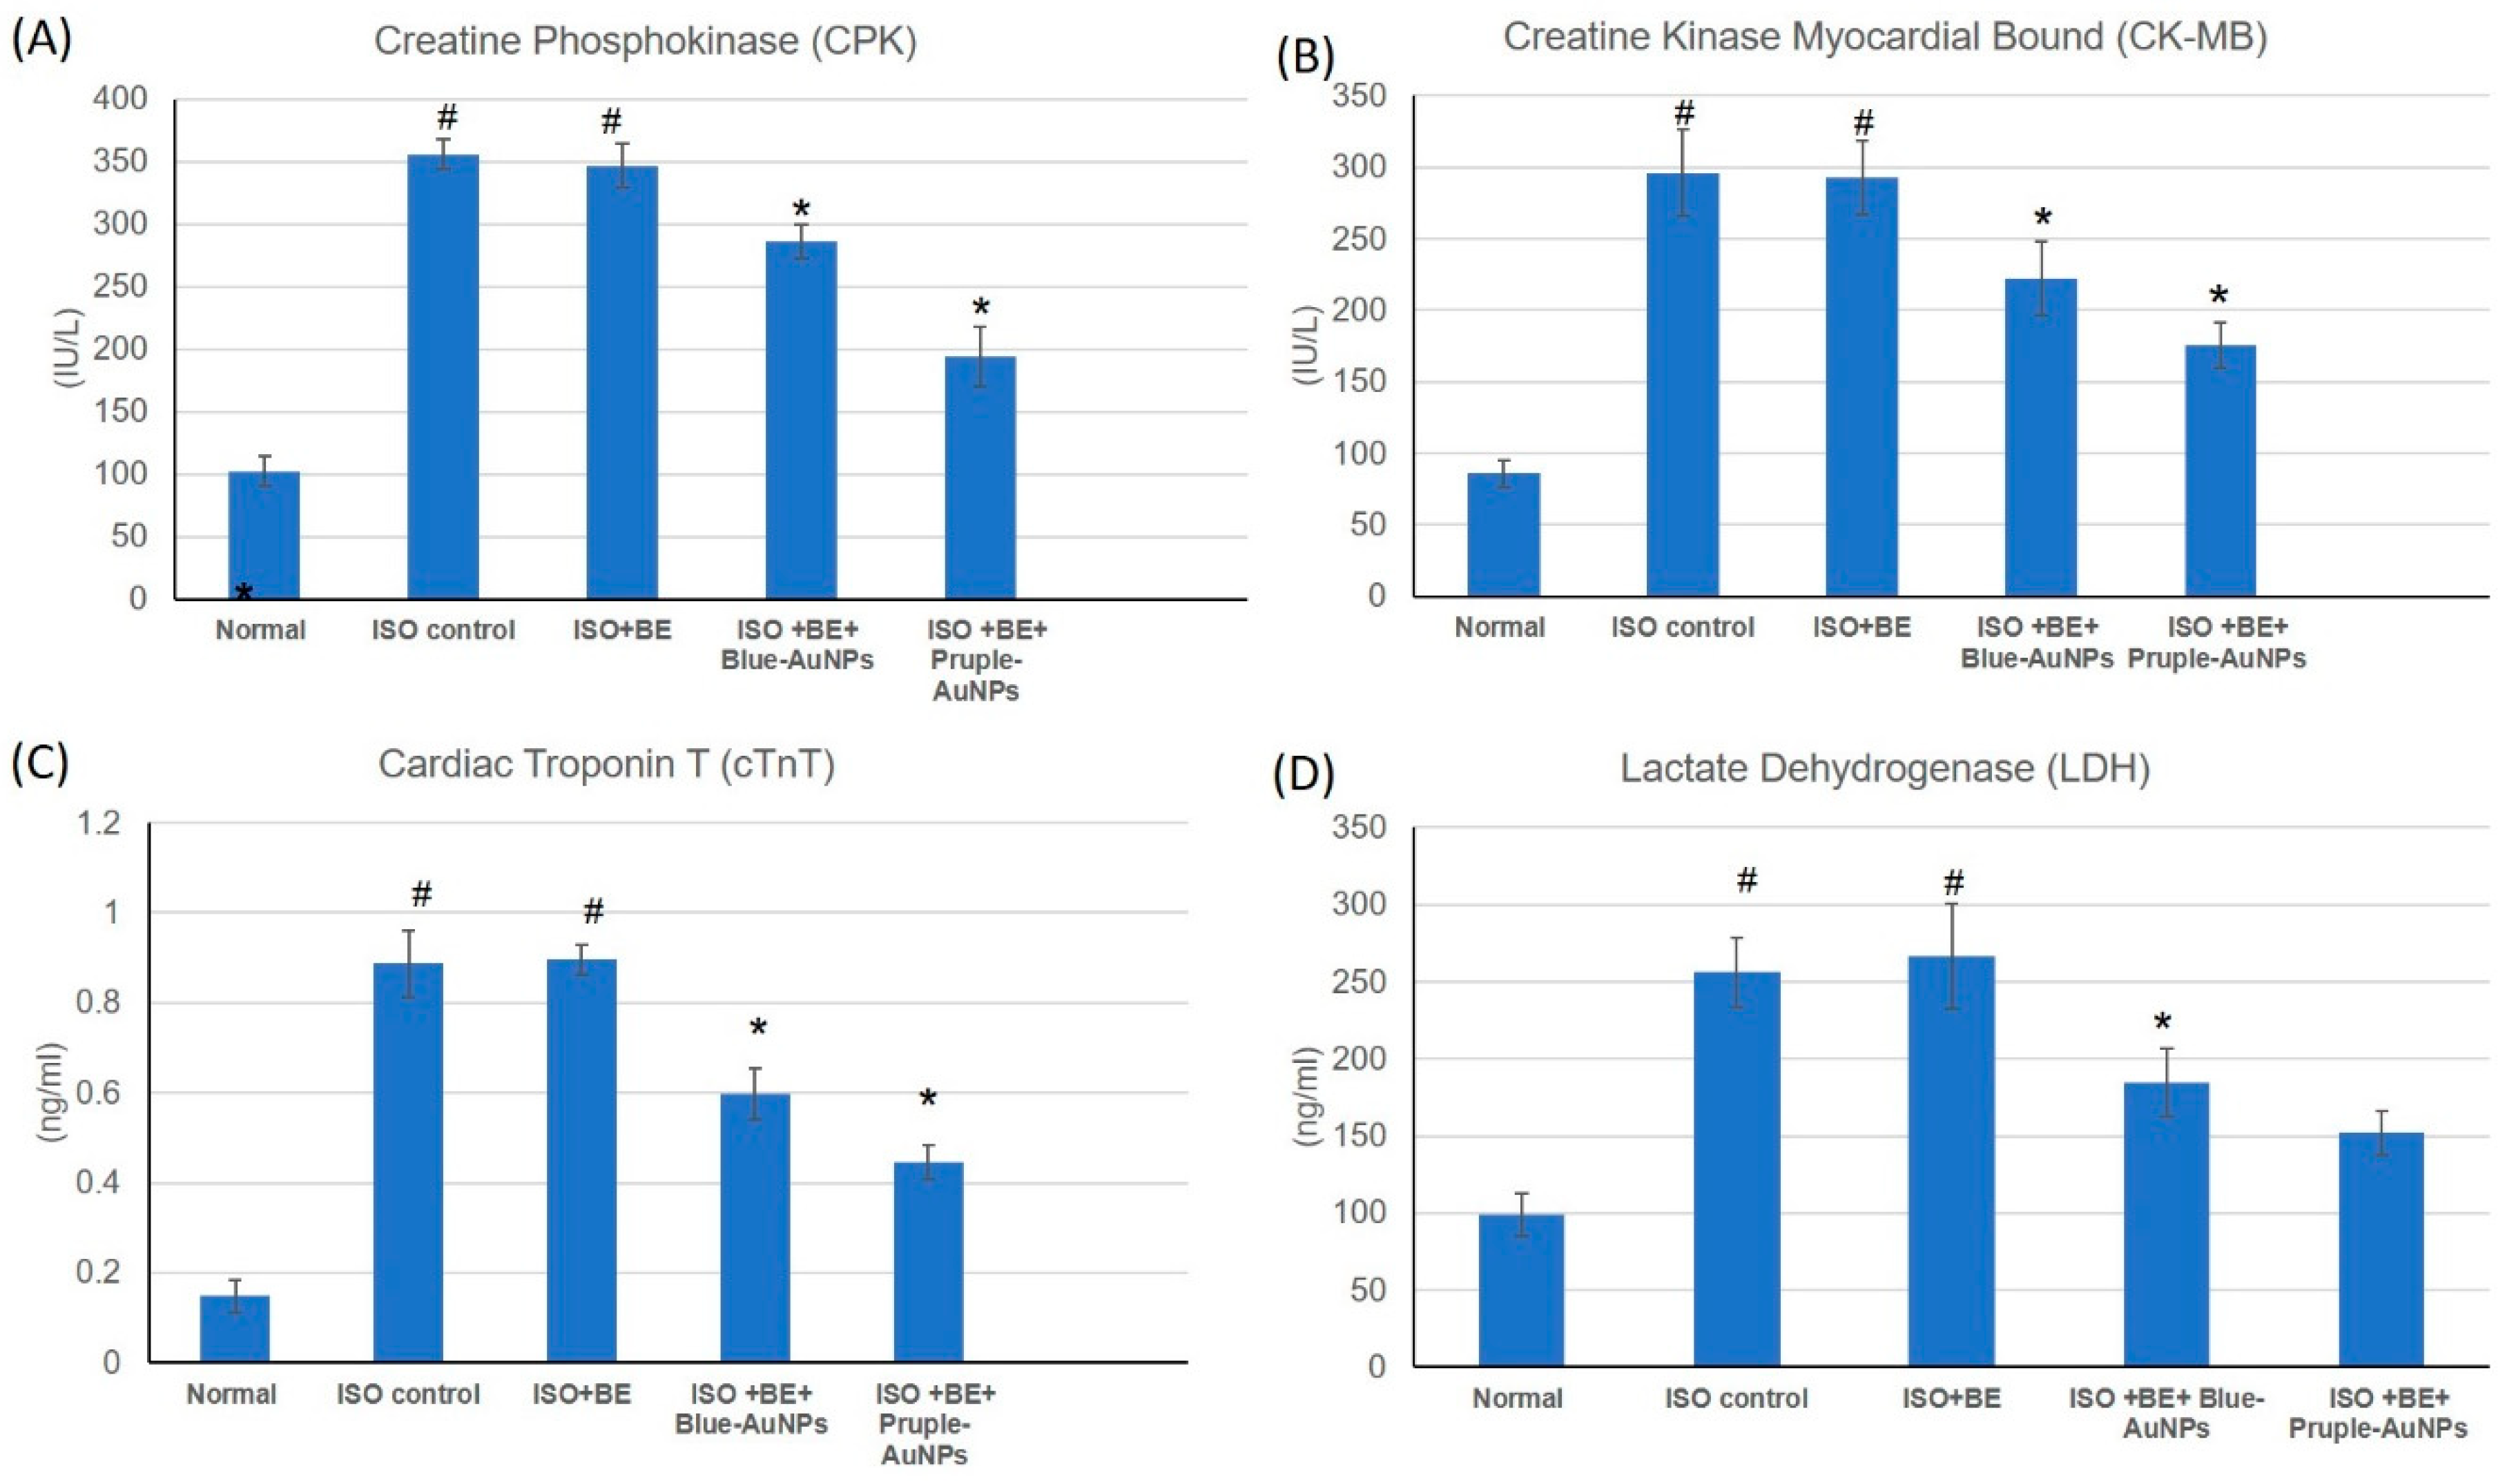
2.5. Effect of Cyanobacterial Extract, AuNPs and their Combination on Cardiac Marker Enzymes
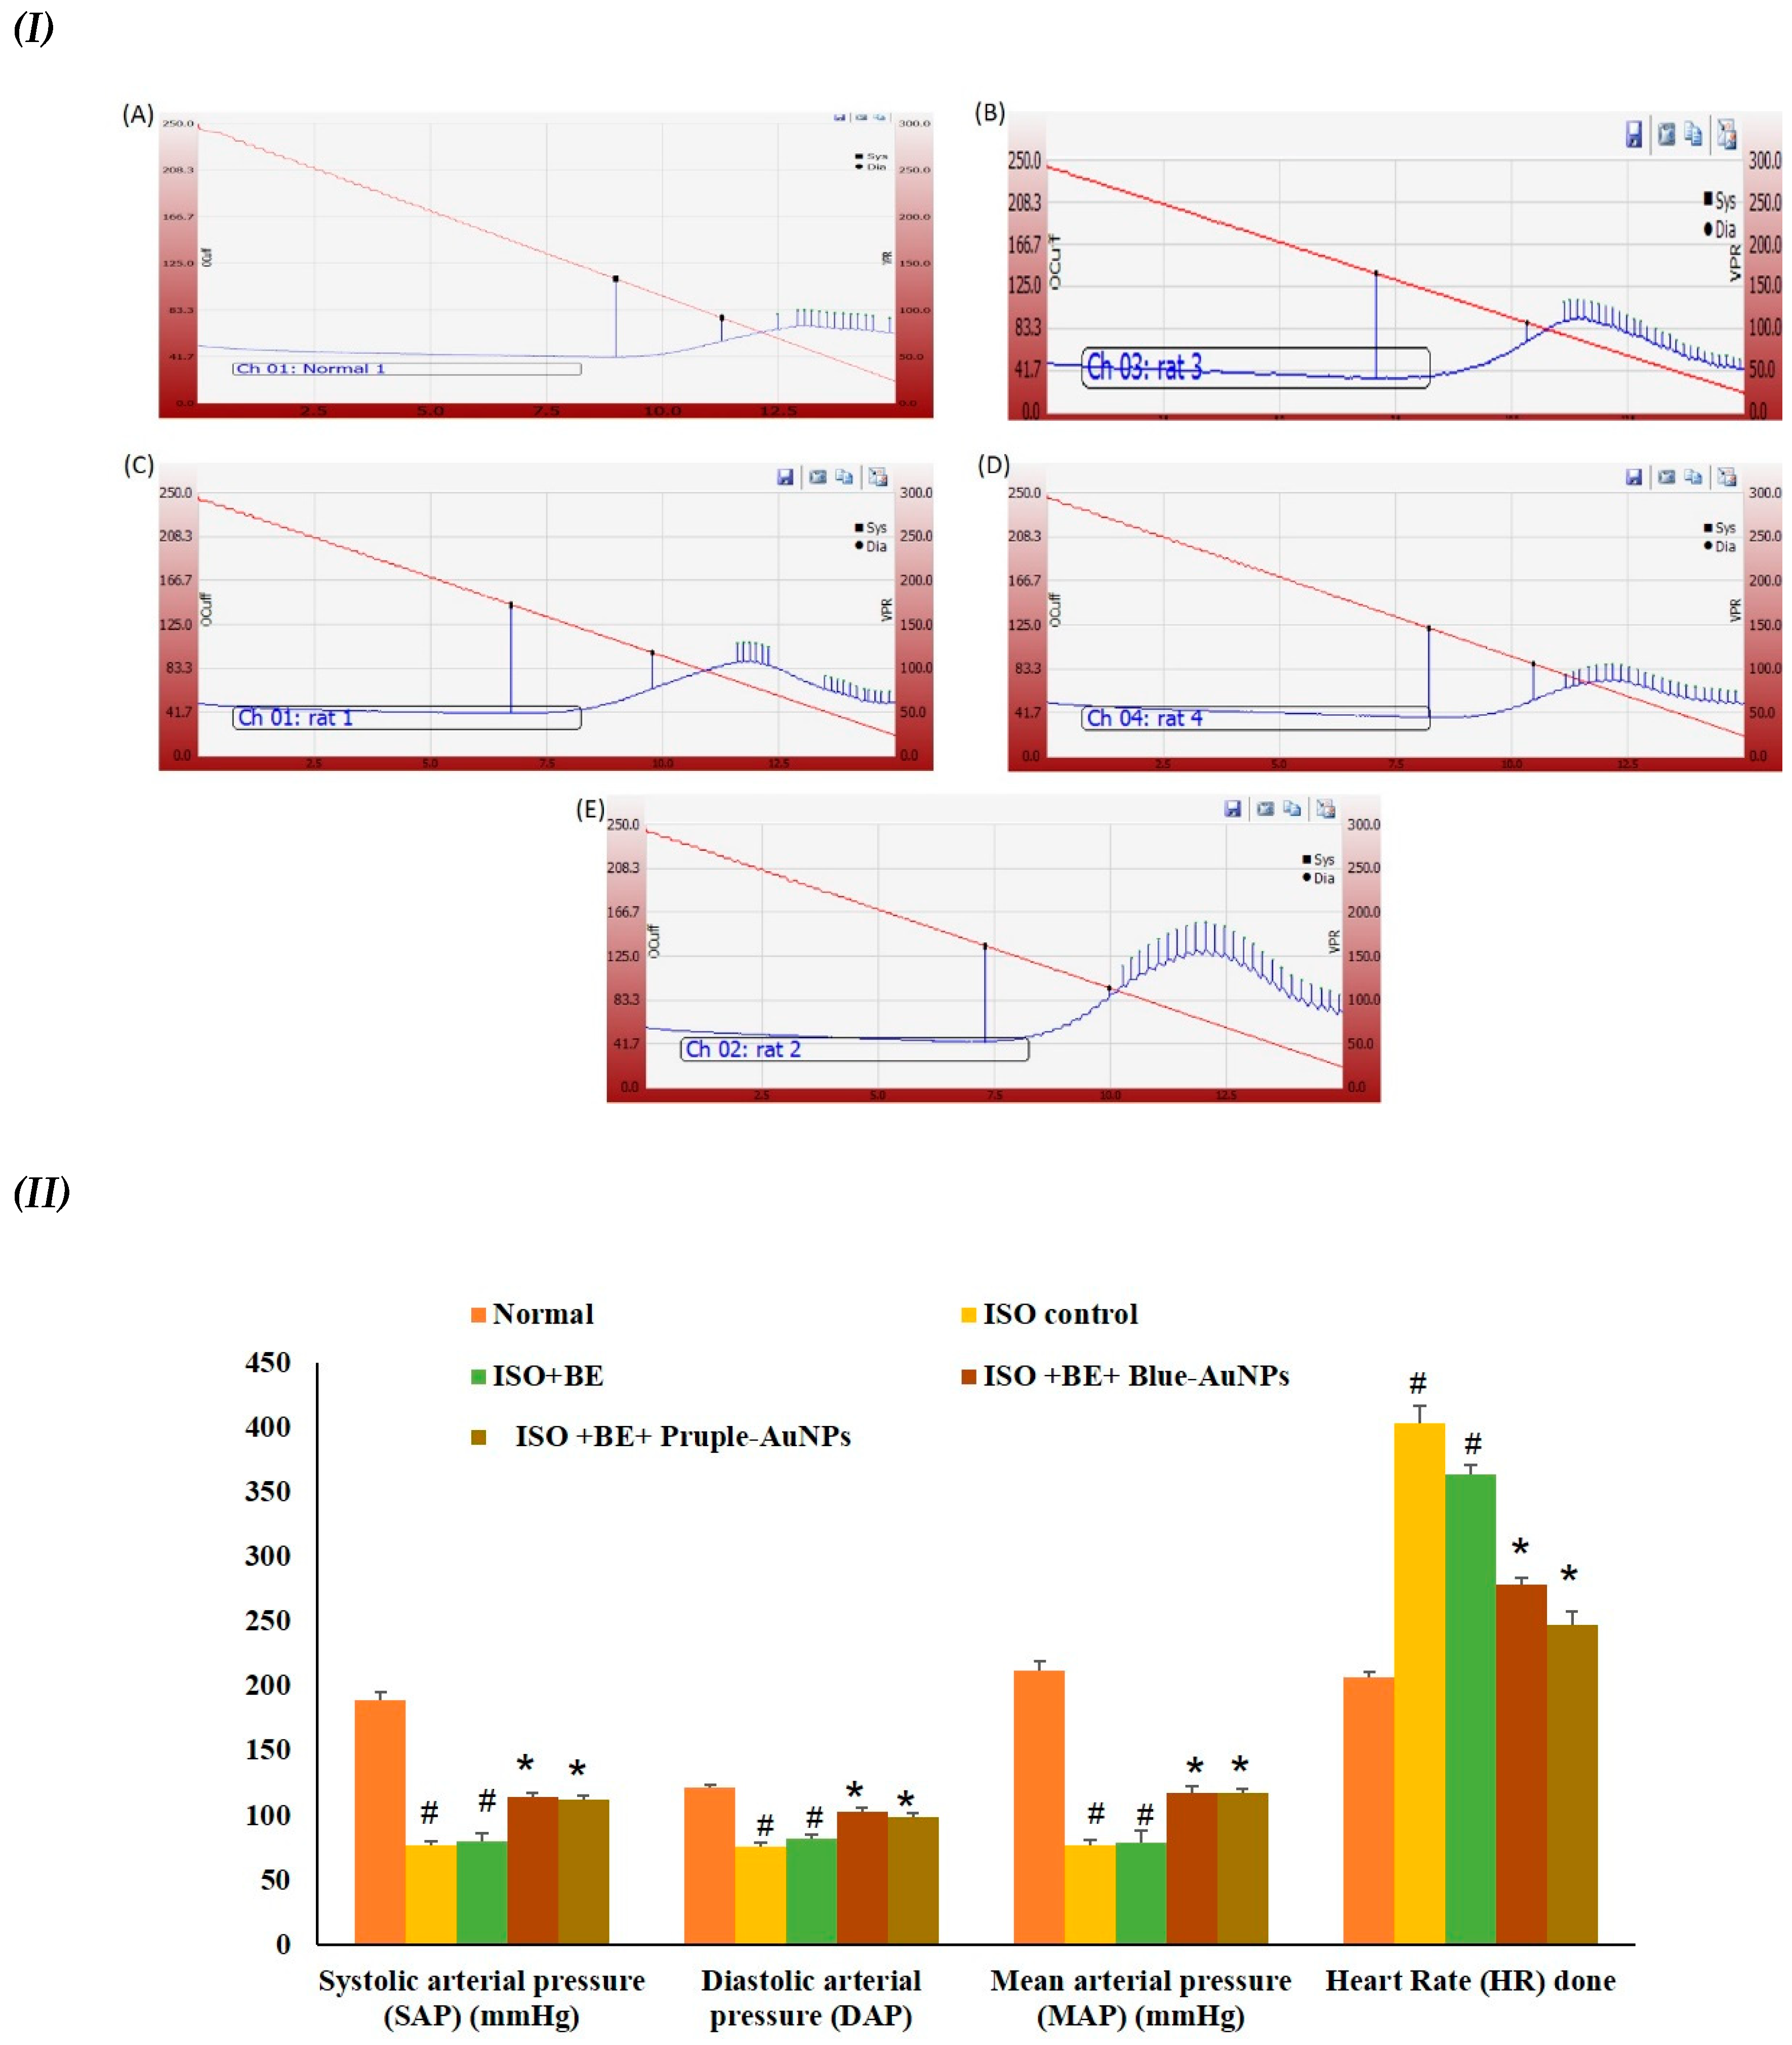
2.6. Effect of Cyanobacterial Extract, AuNPs and Their Combination on Heart Rate and Blood Pressure Indices Recording and Measurement
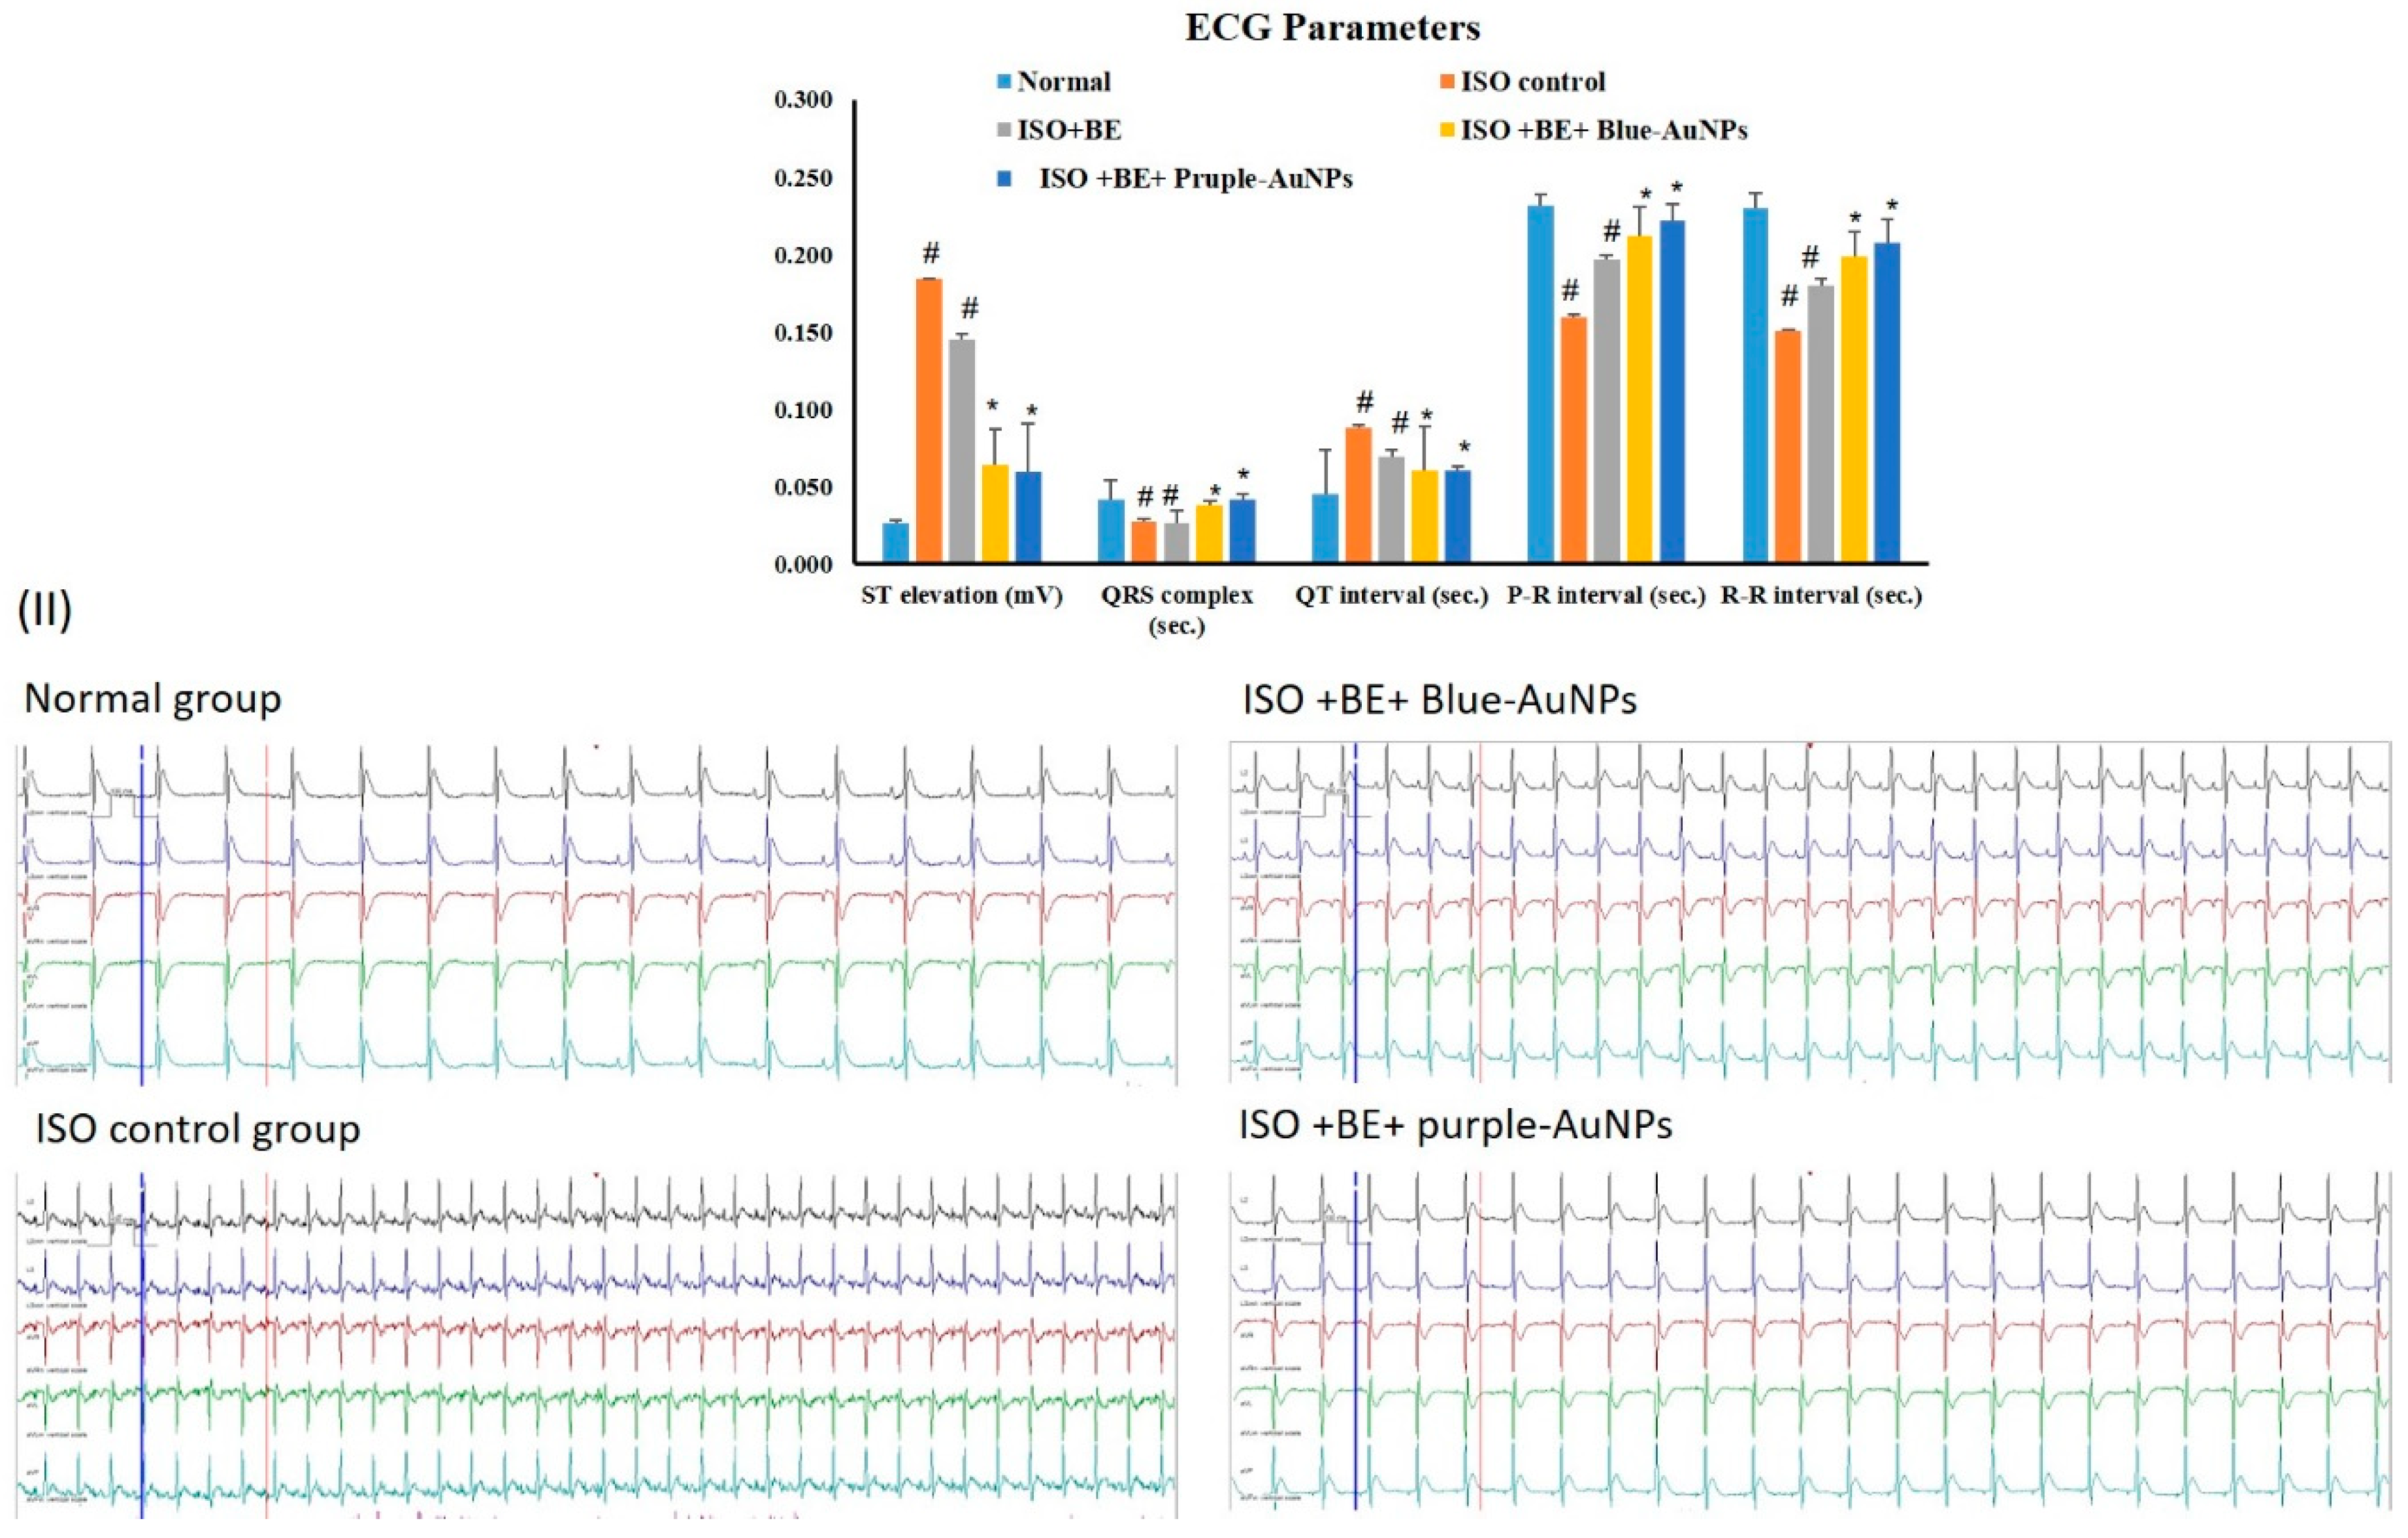
2.7. Effect of Cyanobacterial Extract, AuNPs and Their Combination on Electrocardiographic Trace Recording and Measurement
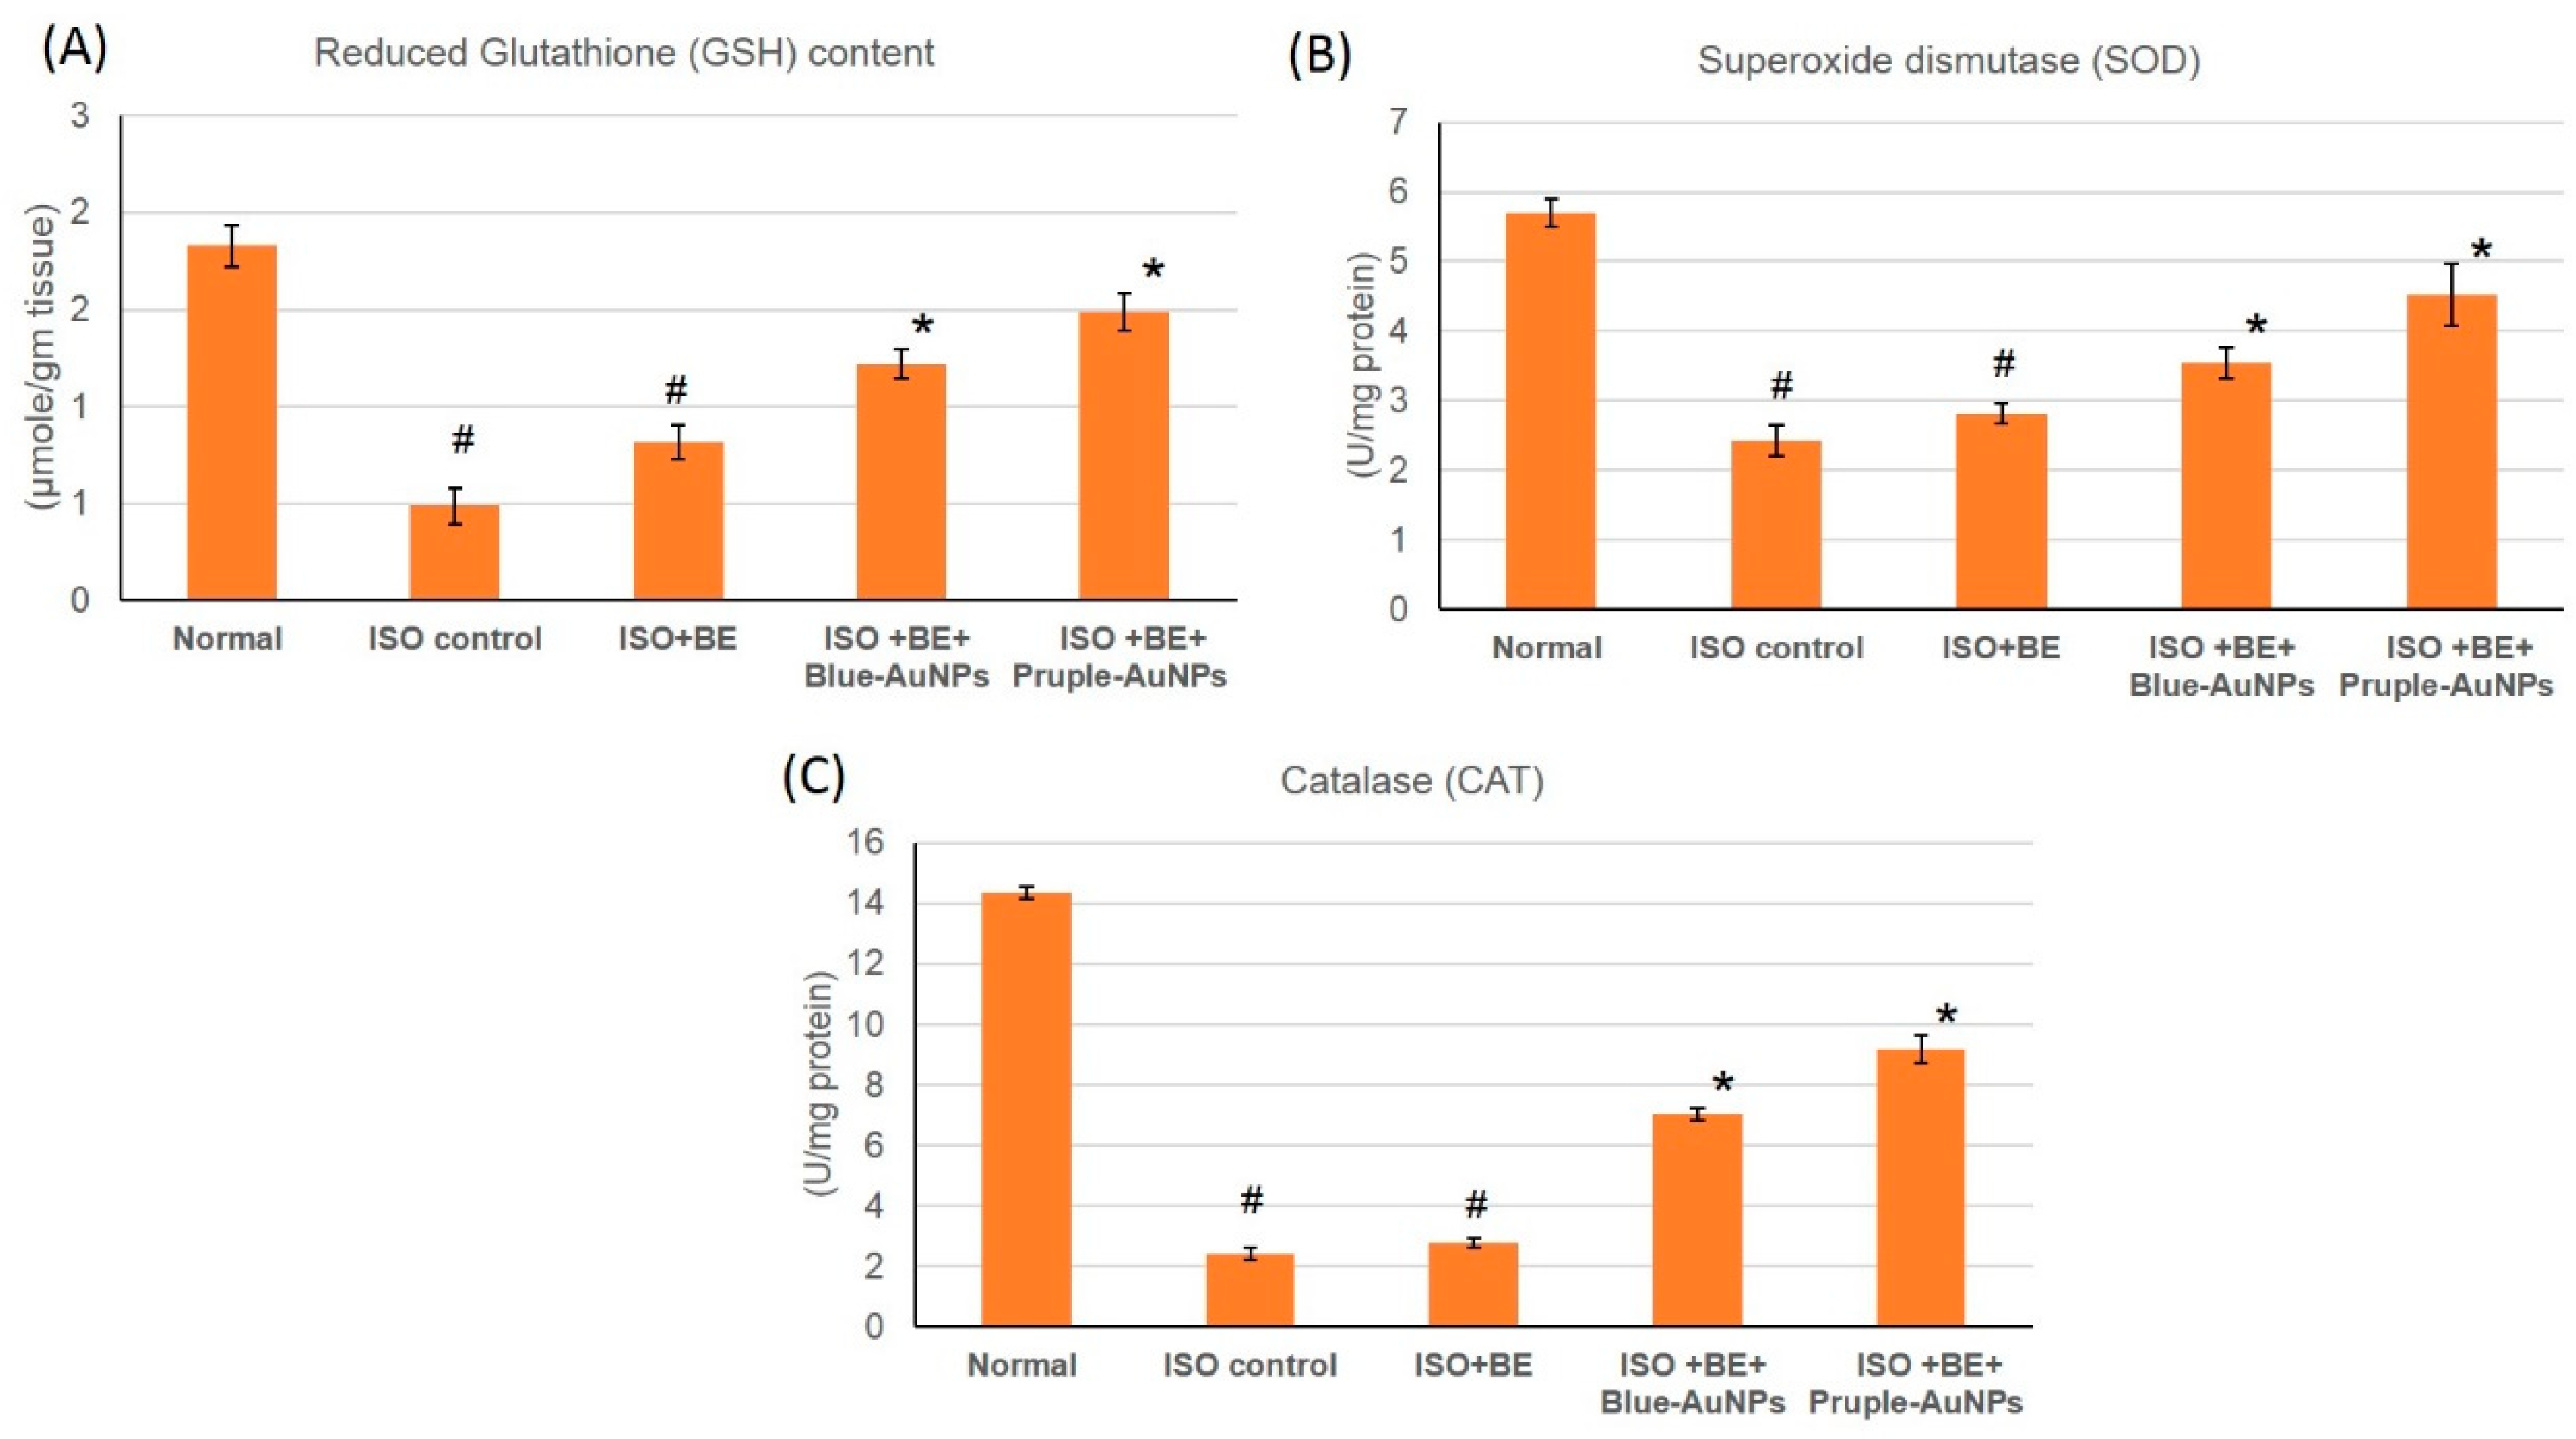
2.8. Effect of Cyanobacterial Extract, AuNPs and Their Combination on the Antioxidant Enzymes Activities in ISO-Induced MI in Rats
3. Discussion
3.1. Metabolomic background of Cyanothece sp.
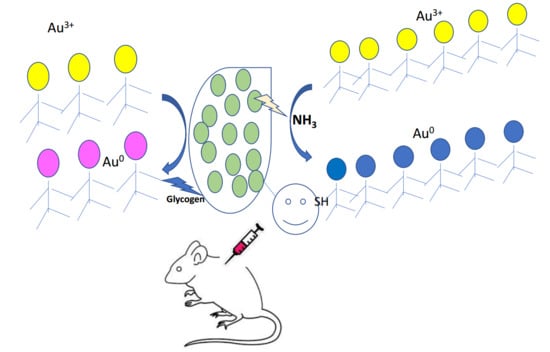
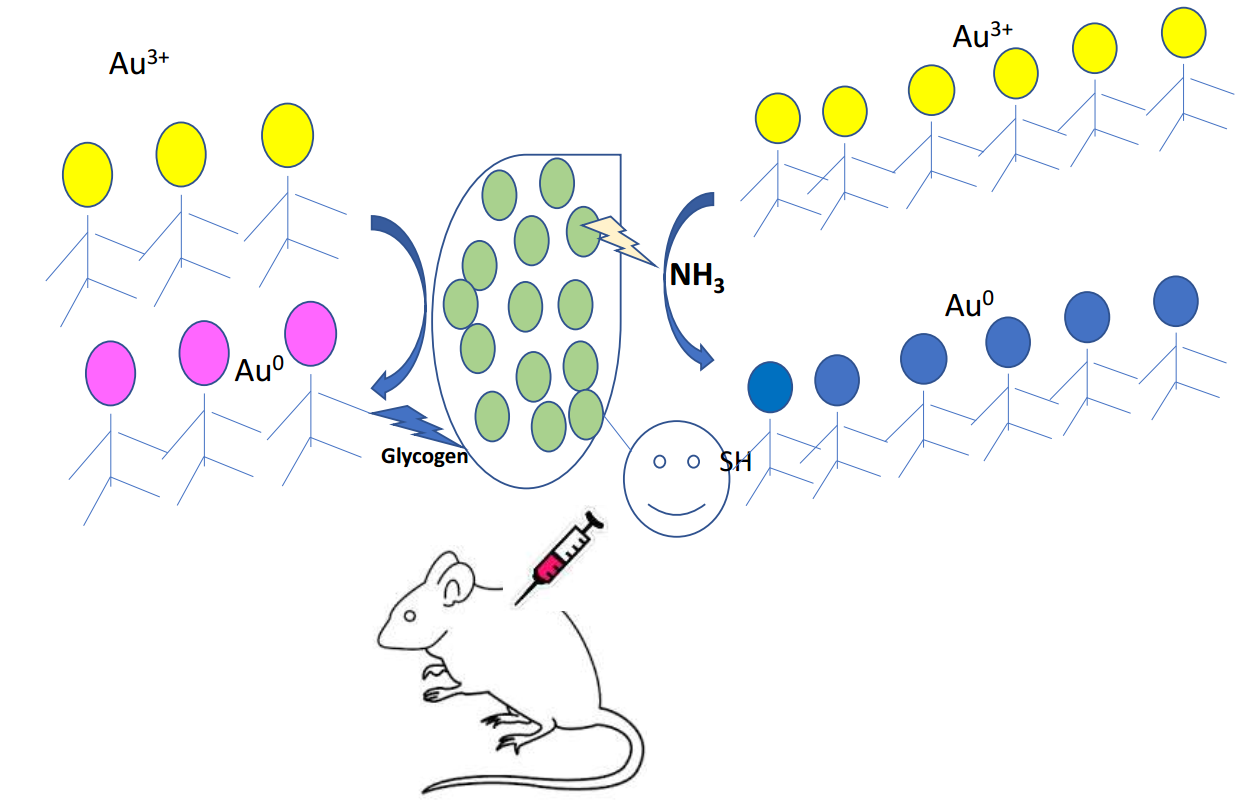
3.2. The Ability of Cyanothece sp. to Produce AuNPs
3.3. Cyanothece sp. Produces Two Types of AuNPs
3.4. The Two Forms of AuNPs Ameliorate the Myocardial Infarction State
3.5. Conclusion
4. Materials and Methods
4.1. Isolation and Characterization of the Cyanobacterium Cyanothece sp. from the Arabian Gulf Region
4.2. Production of Gold Nanoparticles in Cyanobacterial Cell Cultures
4.3. Instrumental Analysis
4.3.1. UV-Visible and Photo-Luminescence Spectroscopy and FTIR Analysis
4.3.2. Dynamic Light Scattering
4.3.3. Cyclic Voltammetry
4.3.4. Calculation of AuNPs Efficiency of Production
4.4. Determination of the Anti-Myocardial Infarction Activity
4.4.1. Materials
4.4.2. Extraction of the Cyanothece sp.
4.4.3. Preparation of AuNPs Solution for Animal Application
4.4.4. Animals
4.4.5. Experimental Design
4.4.6. Electrocardiogram (ECG) and Blood Pressure (BP) Recording and Measurement
4.4.7. Tissue Handling and Biochemical Estimation
4.4.8. Determination of Cardiac Marker Enzymes
4.4.9. Estimation of Antioxidant Activity
4.5. Statistical Analysis
Author Contributions
Funding
Acknowledgments
Conflicts of Interest
References
- Bandyopadhyay, A.; Elvitigala, T.; Welsh, E.; Stockel, J.; Liberton, M.; Min, H.; Sherman, L.A.; Pakrasi, H.B. Novel metabolic attributes of the genus Cyanothece, comprising a group of unicellular nitrogen-fixing Cyanothece. MBio 2011, 2, 1–10. [Google Scholar] [CrossRef] [PubMed]
- Feng, X.; Bandyopadhyay, A.; Berla, B.; Page, L.; Wu, B.; Pakrasi, H.B.; Tang, Y.J. Mixotrophic and photoheterotrophic metabolism in Cyanothece sp. ATCC 51142 under continuous light. Microbiology (Reading, England) 2010, 156, 2566–2574. [Google Scholar] [CrossRef] [PubMed]
- Ascencio, F.; Gama, N.L.; De Philippis, R.; Ho, B. Effectiveness of Cyanothece spp. and Cyanospira capsulata exocellular polysaccharides as antiadhesive agents for blocking attachment of Helicobacter pylori to human gastric cells. Folia. Microbiol. 2004, 49, 64–70. [Google Scholar] [CrossRef]
- Oftedal, L.; Skjærven, K.; Coyne, R.; Edvardsen, B.; Rohrlack, T.; Skulberg, O.; Døskeland, S.; Herfindal, L. The apoptosis-inducing activity towards leukemia and lymphoma cells in a cyanobacterial culture collection is not associated with mouse bioassay toxicity. J. Ind. Microbiol. Biotechnol. 2011, 38, 489–501. [Google Scholar] [CrossRef] [PubMed]
- Costa Lima, S.A.; Reis, S. Temperature-responsive polymeric nanospheres containing methotrexate and gold nanoparticles: A multi-drug system for theranostic in rheumatoid arthritis. Colloids Surf. B Biointerfaces 2015, 133, 378–387. [Google Scholar] [CrossRef] [PubMed]
- El Semary, N.A.; Fouda, M. Anticancer activity of Cyanothece sp. strain extracts from Egypt: First record. Asian Pac. J. Trop. Biomed. 2015, 5, 992–995. [Google Scholar] [CrossRef]
- Imran, M.; Hassan, M.Q.; Akhtar, M.S.; Rahman, O.; Akhtar, M.; Najmi, A.K. Sacubitril and valsartan protect from experimental myocardial infarction by ameliorating oxidative damage in Wistar rats. Clin. Exp. Hypertens. 2019, 41, 62–69. [Google Scholar] [CrossRef]
- Hassaan, M.; Hosny, S. Green Synthesis of Ag and Au Nanoparticles from Micro and Macro Algae—Review. Int. J. Atmos. Ocean. Sci. 2018, 2, 10. [Google Scholar] [CrossRef]
- Kalabegishvili, T.; Kirkesali, E.I.; Rcheulishvili, A.N.; Ginturi, E.; Murusidze, I.; Kuchava, N.; Bagdavadze, N.; Tsertsvadze, G.; Gabunia, V.; Frontasyeva, M.; et al. Synthesis of gold nanoparticles by blue-green algae Spirulina platensis. J. Appl. Microbiol. Biotechnol. 2013, 4, 31. [Google Scholar]
- Bakir, E.M.; Younis, N.S.; Mohamed, M.E.; El Semary, N.A. Cyanobacteria as Nanogold Factories: Chemical and Anti–Myocardial Infarction Properties of Gold Nanoparticles Synthesized by Lyngbya majuscula. Mar. Drugs 2018, 16, 217. [Google Scholar] [CrossRef]
- Kannan, V.; Subramanian, D. Effect of removal of molybdenum in two cyanobacteria Tolypothrix tenuis (Kutz) Schmidt em. and Mastigocladus laminosus Cohn. Indian J. Microbiol. 1992, 32, 185–187. [Google Scholar]
- Lengke, M.F.; Fleet, M.E.; Southam, G. Biosynthesis of silver nanoparticles by filamentous cyanobacteria from a silver(I) nitrate complex. Langmuir 2007, 23, 2694–2699. [Google Scholar] [CrossRef] [PubMed]
- Lengke, M.F.; Ravel, B.; Fleet, M.E.; Wanger, G.; Gordon, R.A.; Southam, G. Mechanisms of gold bioaccumulation by filamentous cyanobacteria from gold (III)– chloride complex. Environ. Sci. Technol. 2006, 40, 6304–6309. [Google Scholar] [CrossRef]
- Jakob, T.; Wagner, H.; Stehfest, K.; Wilhelm, C. A complete energy balance from photons to new biomass reveals a light- and nutrient-dependent variability in the metabolic costs of carbon assimilation. J. Exp. Bot. 2007, 58, 2101–2112. [Google Scholar] [CrossRef] [PubMed]
- Xiang, M.; Xu, X.; Li, D.; Liu, F.; Li, N. Selective enhancement of resonance light-scattering of gold nanoparticles by glycogen. Talanta 2008, 76, 1207–1211. [Google Scholar] [CrossRef] [PubMed]
- Vishwakarma, R.; Dhar, D.W.; Pabbi, S. Formulation of a minimal nutritional medium for enhanced lipid productivity in Chlorella sp. and Botryococcus sp. using response surface methodology. Water Sci. Technol. 2018, 77, 1660–1672. [Google Scholar] [CrossRef]
- Welkie, D.G.; Sherman, D.M.; Chrisler, W.B.; Orr, G.; Sherman, L.A. Analysis of carbohydrate storage granules in the diazotrophic cyanobacterium Cyanothece sp. PCC 7822. Photosynthesis Res. 2013, 118, 25–36. [Google Scholar] [CrossRef]
- Zavrel, T.; Chmelik, D.; Sinetova, M.A.; Cerveny, J. Spectrophotometric Determination of Phycobiliprotein Content in Cyanobacterium Synechocystis. J. Visual. Exp. 2018, 139, e58076. [Google Scholar] [CrossRef]
- Sekar, S.; Muruganandham, C. Phycobiliproteins as a commodity: Trends in applied research, patents and commercialization. J. Appl. Phys. 2007, 20, 113–136. [Google Scholar] [CrossRef]
- Borah, D.; Nainamalai, S.; Gopalakrishnan, S.; Rout, J.; Alharbi, N.S.; Alharbi, S.A.; Nooruddin, T. Biolubricant potential of exopolysaccharides from the cyanobacterium Cyanothece epiphytica. Appl. Microbiol. Biotechnol. 2018, 102, 3635–3647. [Google Scholar] [CrossRef]
- Chi, Z.; Su, C.D.; Lu, W.D. A new exopolysaccharide produced by marine Cyanothece sp. 113. Bioresour. Technol. 2007, 98, 1329–1332. [Google Scholar] [CrossRef] [PubMed]
- Jiao, G.; Yu, G.; Zhang, J.; Ewart, H. Chemical structures and bioactivities of sulfated polysaccharides from marine algae. Mar. Drugs 2011, 9, 196–223. [Google Scholar] [CrossRef] [PubMed]
- Patel, V.; Berthold, D.; Puranik, P.; Gantar, M. Screening of cyanobacteria and microalgae for their ability to synthesize silver nanoparticles with antibacterial activity. Biotechnol. Rep. 2015, 5, 112–119. [Google Scholar] [CrossRef] [PubMed]
- Srinath, B.S.; Rai, R.V. Biosynthesis of Gold Nanoparticles Using Extracellular Molecules Produced by Enterobacter aerogenes and their Catalytic Study. J. Cluster Sci. 2015, 26, 1483–1494. [Google Scholar] [CrossRef]
- Singh, O.V. Bio-Nanoparticles: Biosynthesis and Sustainable Biotechnological Implications; John Wiley & Sons, Inc.: New York, NY, USA, 2015; pp. 144–173. [Google Scholar]
- Zhang, X.; Yang, S.; Sun, J.; Wu, C.; Wang, J.; Zhang, G.; Ding, C. Morphology, ultrastructure and phylogeny of Cyanothece sp. (Cyanobacteriaceae: Cyanophyceae) isolated from the eastern Indian Ocean. Acta Oceanol. Sin. 2018, 37, 4–10. [Google Scholar] [CrossRef]
- Leng, W.; Pati, P.; Vikesland, P.J. Room temperature seed mediated growth of gold nanoparticles: mechanistic investigations and life cycle assesment. Environ. Sci. Nano 2015, 2, 440–453. [Google Scholar] [CrossRef]
- Morones, J.R.; Elechiguerra, J.L.; Camacho, A.; Holt, K.; Kouri, J.B.; Ramírez, J.T.; Yacaman, M.J. The bactericidal effect of silver nanoparticles. Nanotechnology 2005, 16, 2346–2353. [Google Scholar] [CrossRef]
- Zhu, J. Surface plasmon resonance from bimetallic interface in Au-Ag core-shell structure nanowires. Nanoscale Res. Lett. 2009, 9, 977. [Google Scholar] [CrossRef]
- Dulkeith, E.; Niedereichholz, T.; Klar, T.A.; Feldmann, J.; Von Plessen, G.; Gittins, D.I.; Mayya, K.S.; Caruso, F. Plasmon emission in photoexcited gold nanoparticles. Phys. Rev. B 2004, 70, 205424. [Google Scholar] [CrossRef]
- Pal, S.; Tak, Y.K.; Song, J.M. Does the antibacterial activity of silver nanoparticles depend on the shape of the nanoparticle? A study of the Gram-negative bacterium Escherichia coli. Appl. Environ. Microbiol. 2007, 73, 1712. [Google Scholar] [CrossRef]
- Vysotskii, V.V.; Uryupina, O.Y.; Gusel’nikova, A.V.; Roldugin, V.I. On the feasibility of determining nanoparticle concentration by the dynamic light scattering method. Colloid J. 2009, 71, 739. [Google Scholar] [CrossRef]
- Rhieu, S.Y.; Reipa, V. Tuning the Size of Gold Nanoparticles with Repetitive Oxidation-reduction Cycles. Am. J. Nanomater. 2015, 3, 15–21. [Google Scholar] [CrossRef]
- Mozaffarian, D.; Benjamin, E.J.; Go, A.S.; Arnett, D.K.; Blaha, M.J.; Cushman, M.; de Ferranti, S.; Despres, J.P.; Fullerton, H.J.; Howard, V.J.; et al. Heart disease and stroke statistics-2015 update: A report from the American Heart Association. Circulation 2015, 131, e29-322. [Google Scholar] [CrossRef] [PubMed]
- Suchal, K.; Malik, S.; Gamad, N.; Malhotra, R.K.; Goyal, S.N.; Bhatia, J.; Arya, D.S. Kampeferol protects against oxidative stress and apoptotic damage in experimental model of isoproterenol–induced cardiac toxicity in rats. Phytomed. Int. J. Phys. Phytopharmacol. 2016, 23, 1401–1408. [Google Scholar] [CrossRef] [PubMed]
- Verma, V.K.; Malik, S.; Narayanan, S.P.; Mutneja, E.; Sahu, A.K.; Bhatia, J.; Arya, D.S. Role of MAPK/NF–kappaB pathway in cardioprotective effect of Morin in isoproterenol induced myocardial injury in rats. Mol. Biol. Rep. 2019, 46, 1139–1148. [Google Scholar] [CrossRef]
- Yakimovich, N.; Ezhevskii, A.; Guseinov, D.; Smirnova, L.A.; Gracheva, T.; Klychkov, K. Antioxidant properties of gold nanoparticles studied by ESR spectroscopy. Russ. Chem. Bull. 2008, 57, 520–523. [Google Scholar] [CrossRef]
- Oueslati, M.H.; Tahar, L.B.; Harrath, A.H. Catalytic, antioxidant and anticancer activities of gold nanoparticles synthesized by kaempferol glucoside from Lotus leguminosae. Arabian J. Chem. 2018, in press. [Google Scholar] [CrossRef]
- Shukla, R.; Bansal, V.; Chaudhary, M.; Basu, A.; Bhonde, R.R.; Sastry, M. Biocompatibility of Gold Nanoparticles and Their Endocytotic Fate Inside the Cellular Compartment: A Microscopic Overview. Langmuir 2005, 21, 10644–10654. [Google Scholar] [CrossRef]
- Lopez-Chaves, C.; Soto-Alvaredo, J.; Montes-Bayon, M.; Bettmer, J.; Llopis, J.; Sanchez-Gonzalez, C. Gold nanoparticles: Distribution, bioaccumulation and toxicity. In vitro and in vivo studies. Nanomed. Nanotechnol. Biol. Med. 2018, 14, 1–12. [Google Scholar] [CrossRef]
- Huang, L. Molecular hydrogen: A therapeutic antioxidant and beyond. Med. Gas Res. 2016, 6, 219–222. [Google Scholar] [CrossRef]
- Ohta, S. Recent progress toward hydrogen medicine: Potential of molecular hydrogen for preventive and therapeutic applications. Curr. Pharma. Design 2011, 17, 2241–2252. [Google Scholar] [CrossRef]
- Alhaider, I.A.; Mohamed, M.E.; Ahmed, K.K.M.; Kumar, A.H.S. Date Palm (Phoenix dactylifera) Fruits as a Potential Cardioprotective Agent: The Role of Circulating Progenitor Cells. Frontiers Pharmacol. 2017, 8. [Google Scholar] [CrossRef] [PubMed]
- Zhang, Y.; Kong, N.; Zhang, Y.; Yang, W.; Yan, F. Size-dependent Effects of Gold Nanoparticles on Osteogenic Differentiation of Human Periodontal Ligament Progenitor Cells. Theranostics 2017, 7, 1214–1224. [Google Scholar] [CrossRef] [PubMed]
- Volkova, N.; Pavlovich, O.; Fesenko, O.; Budnyk, O.; Kovalchuk, S.; Goltsev, A. Studies of the Influence of Gold Nanoparticles on Characteristics of Mesenchymal Stem Cells. J. Nanomater. 2017, 2017, 1–9. [Google Scholar] [CrossRef]
- Guillard, R.R.L.; Ryther, J.H. Studies of marine planktonic diatoms: I. Cyclotella nana Hustedt, and Detonula confervacea (Cleve) Gran. Can. J. Microbiol. 1962, 8, 229–239. [Google Scholar] [CrossRef]
- Frens, G. Controlled Nucleation for the Regulation of the Particle Size in Monodisperse Gold Suspensions. Nat. Phys. Sci. 1973, 241, 20. [Google Scholar] [CrossRef]
- Ji, X.; Song, X.; Li, J.; Bai, Y.; Yang, W.; Peng, X. Size Control of Gold Nanocrystals in Citrate Reduction: The Third Role of Citrate. J. Am. Chem. Soc. 2007, 129, 13939–13948. [Google Scholar] [CrossRef]
- John, R.; Ahmad, P.; Gadgil, K.; Sharma, S. Effect of Cadmium and Lead on Growth, Biochemical Parameters and Uptake in Lemna PolyrrhizaL. Plant Soil Environ. 2008, 54, 262–270. [Google Scholar] [CrossRef]


| Sample | Diameter (nm) | Aggregation Time | Concentration (µmole.L−1) | Shape | System |
|---|---|---|---|---|---|
| blue- AuNPs | 129 ± 0.4 | 60 min | 25.00 | Non-spherical | Polydisperse |
| purple-AuNPs | 80 ± 0.3 | 24 h | 2.50 | Spherical | Polydisperse |
© 2019 by the authors. Licensee MDPI, Basel, Switzerland. This article is an open access article distributed under the terms and conditions of the Creative Commons Attribution (CC BY) license (http://creativecommons.org/licenses/by/4.0/).
Share and Cite
Younis, N.S.; Bakir, E.M.; Mohamed, M.E.; El Semary, N.A. Cyanobacteria as Nanogold Factories II: Chemical Reactivity and anti-Myocardial Infraction Properties of Customized Gold Nanoparticles Biosynthesized by Cyanothece sp. Mar. Drugs 2019, 17, 402. https://doi.org/10.3390/md17070402
Younis NS, Bakir EM, Mohamed ME, El Semary NA. Cyanobacteria as Nanogold Factories II: Chemical Reactivity and anti-Myocardial Infraction Properties of Customized Gold Nanoparticles Biosynthesized by Cyanothece sp. Marine Drugs. 2019; 17(7):402. https://doi.org/10.3390/md17070402
Chicago/Turabian StyleYounis, Nancy S., Esam M. Bakir, Maged E. Mohamed, and Nermin A. El Semary. 2019. "Cyanobacteria as Nanogold Factories II: Chemical Reactivity and anti-Myocardial Infraction Properties of Customized Gold Nanoparticles Biosynthesized by Cyanothece sp." Marine Drugs 17, no. 7: 402. https://doi.org/10.3390/md17070402
APA StyleYounis, N. S., Bakir, E. M., Mohamed, M. E., & El Semary, N. A. (2019). Cyanobacteria as Nanogold Factories II: Chemical Reactivity and anti-Myocardial Infraction Properties of Customized Gold Nanoparticles Biosynthesized by Cyanothece sp. Marine Drugs, 17(7), 402. https://doi.org/10.3390/md17070402