Optimization of Phlorotannins Extraction from Fucus vesiculosus and Evaluation of Their Potential to Prevent Metabolic Disorders


Abstract
:
1. Introduction
2. Results
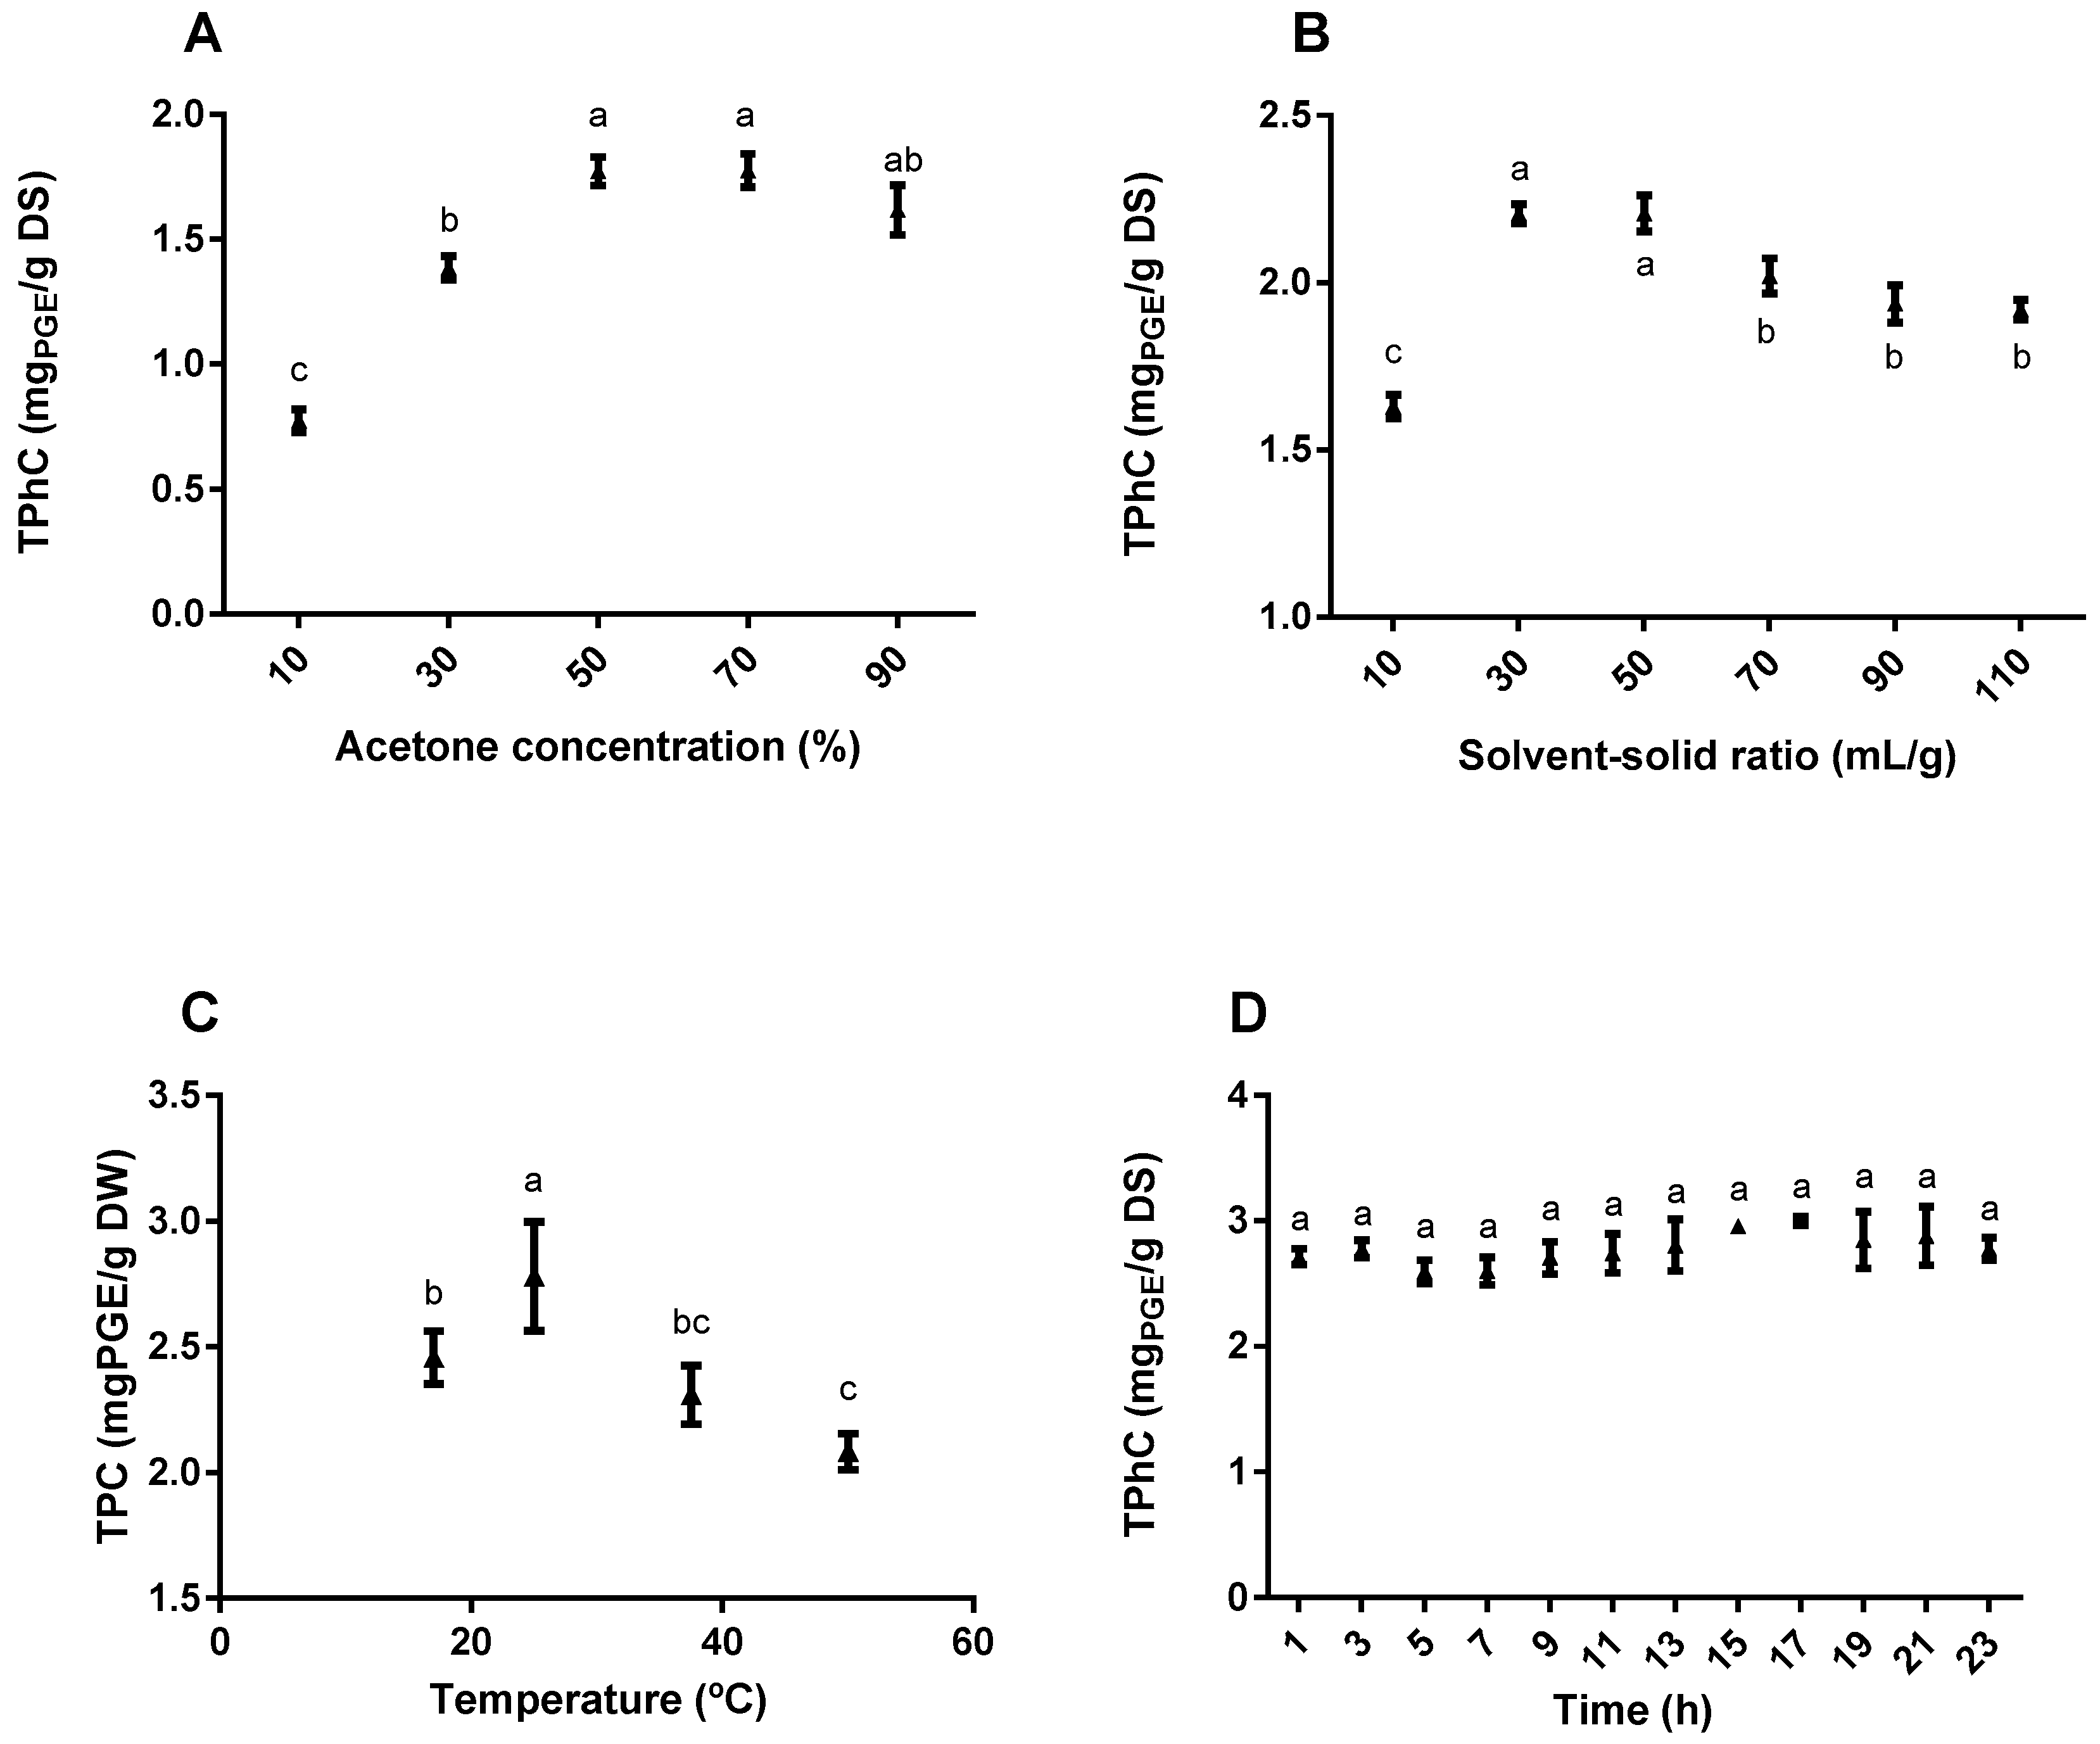
2.1. Single-Factor Experiments
2.1.1. Effect of the Acetone Concentration on Total Phlorotannin Content (TPhC)
2.1.2. Effect of the Solvent-Solid Ratio on TPhC
2.1.3. Effect of the Temperature on TPhC
2.1.4. Effect of Time on TPhC
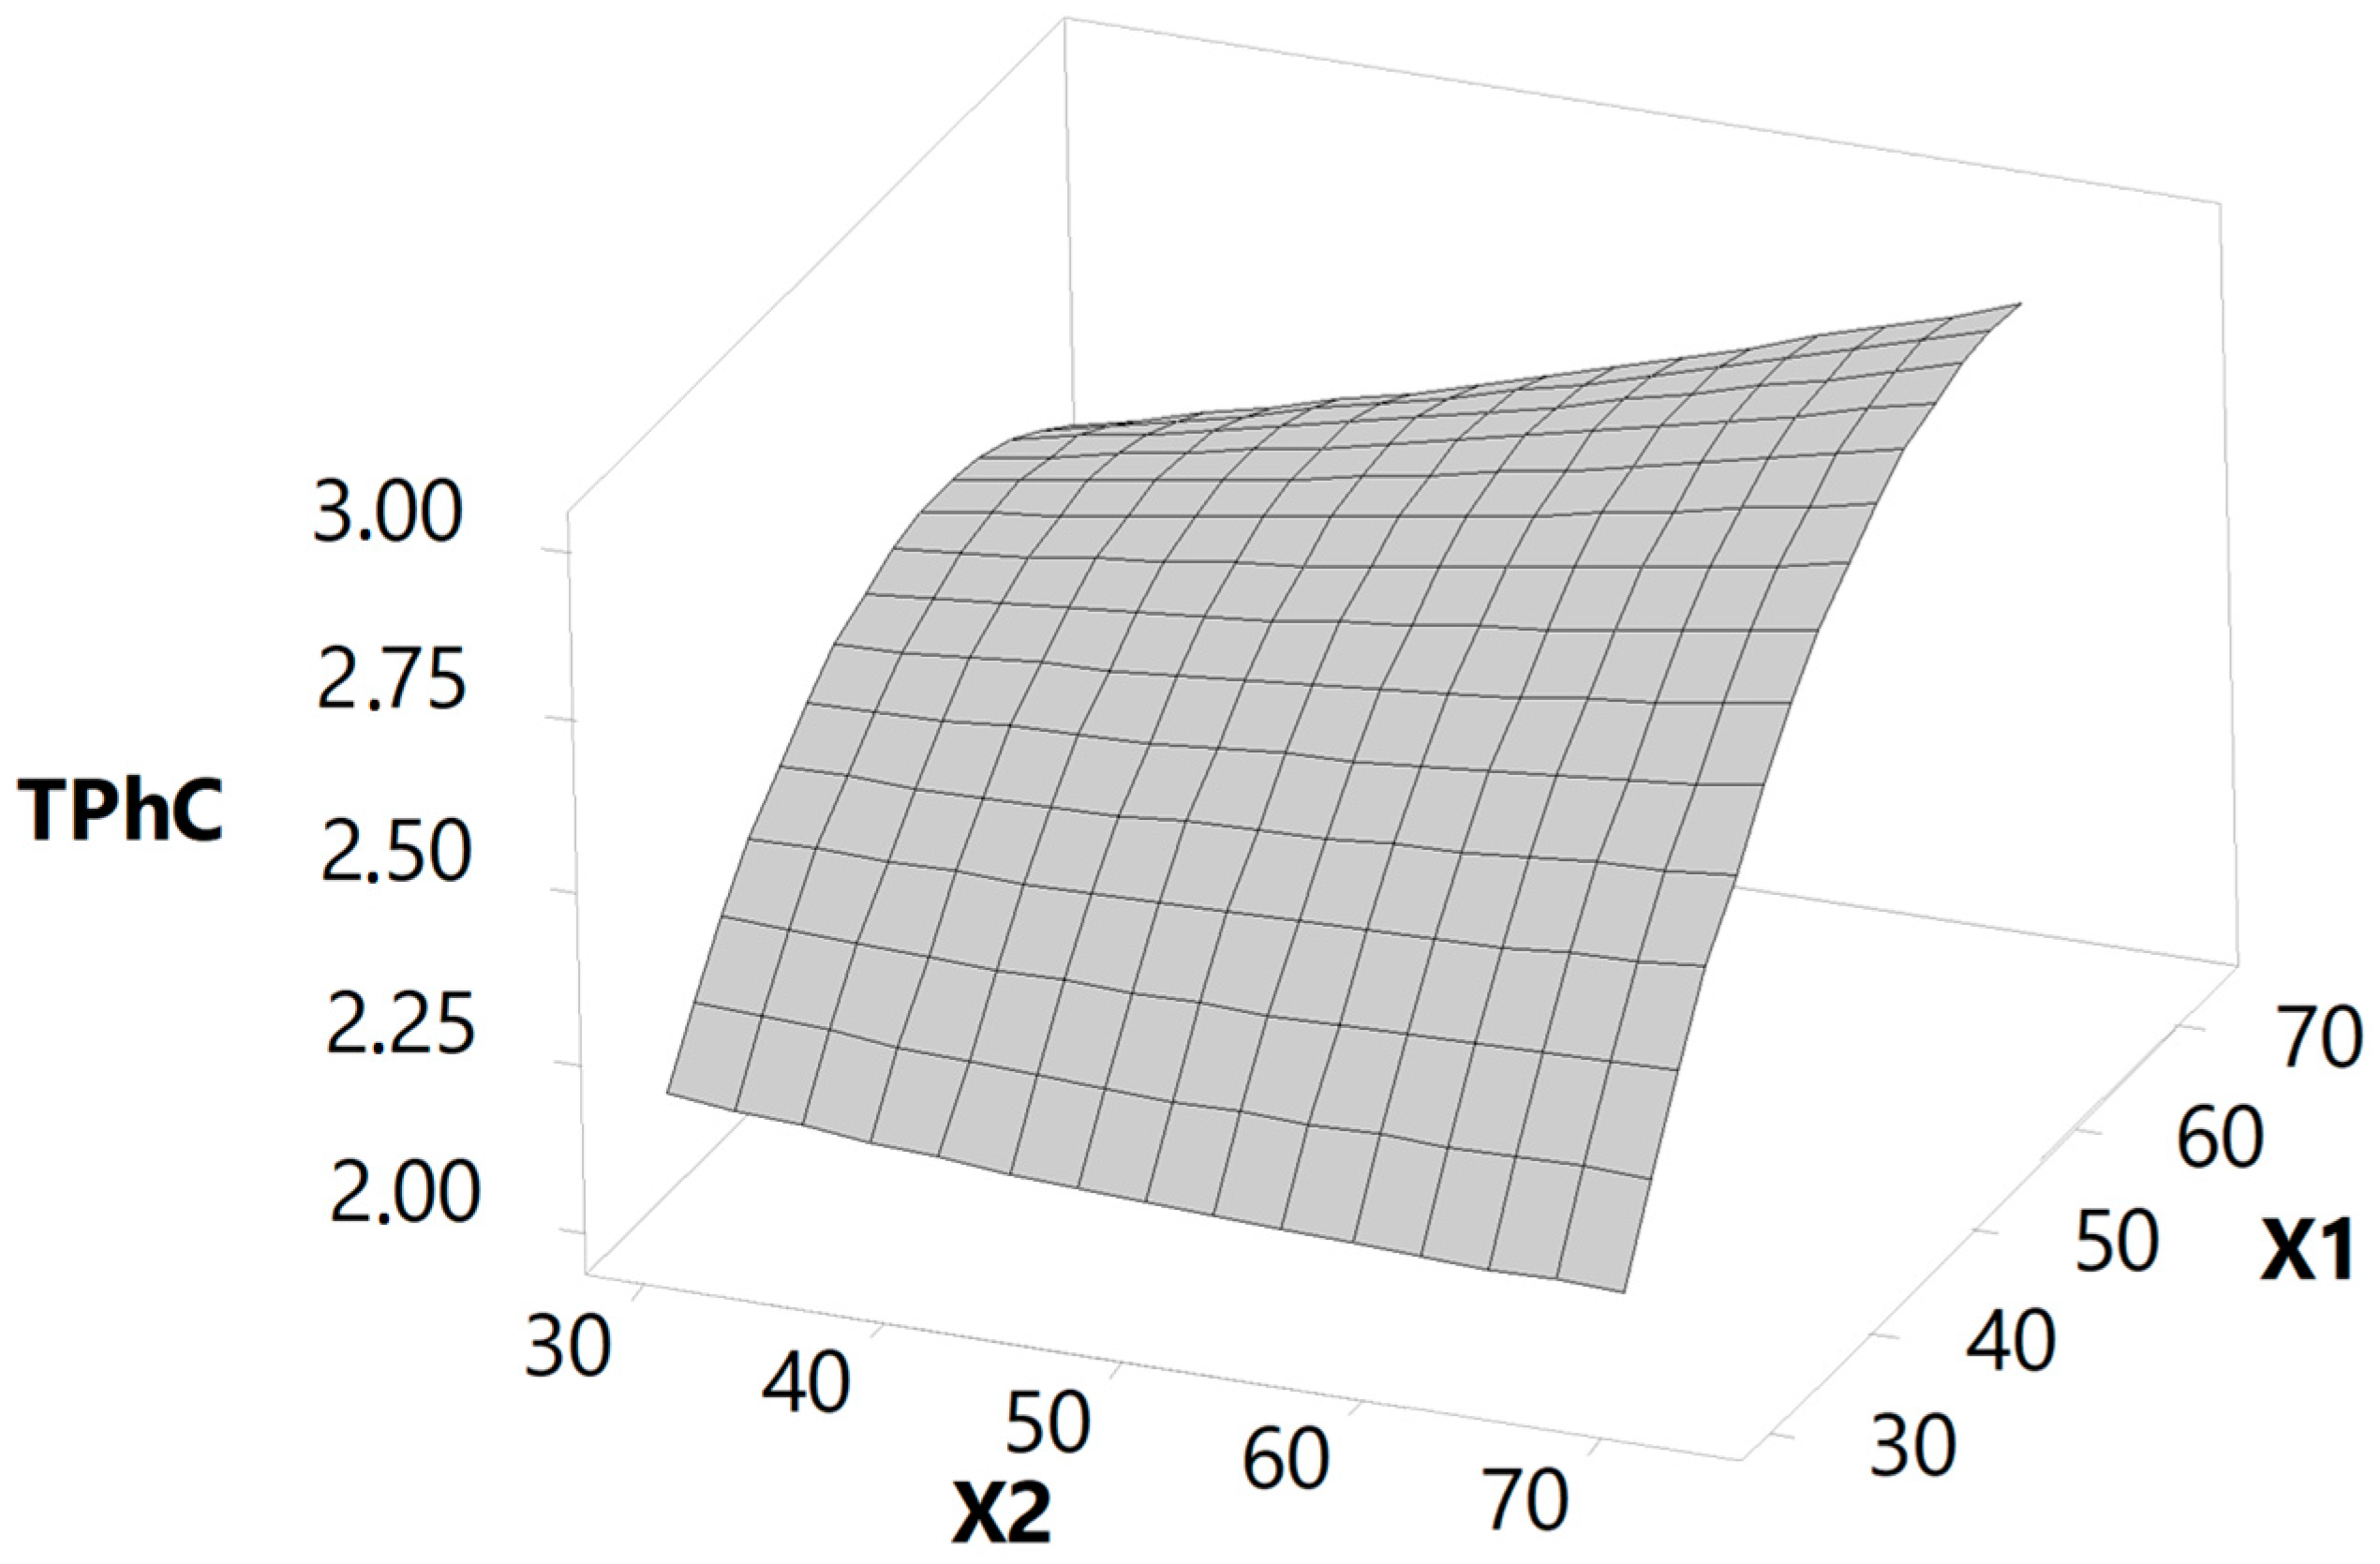
2.2. Analysis of the Response Surface Methodology
2.2.1. Fitting the Model
2.2.2. Effect of the Independent Variables on the TPhC
2.2.3. Optimization and Validation of the Models
2.3. Total Phlorotannin Content of the F. vesiculosus Extract and Respective Fractions
2.4. Inhibition of Enzymatic Activities
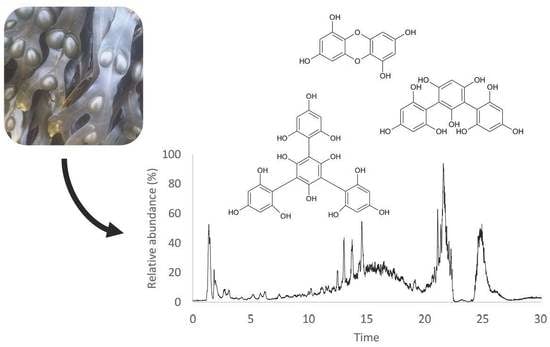
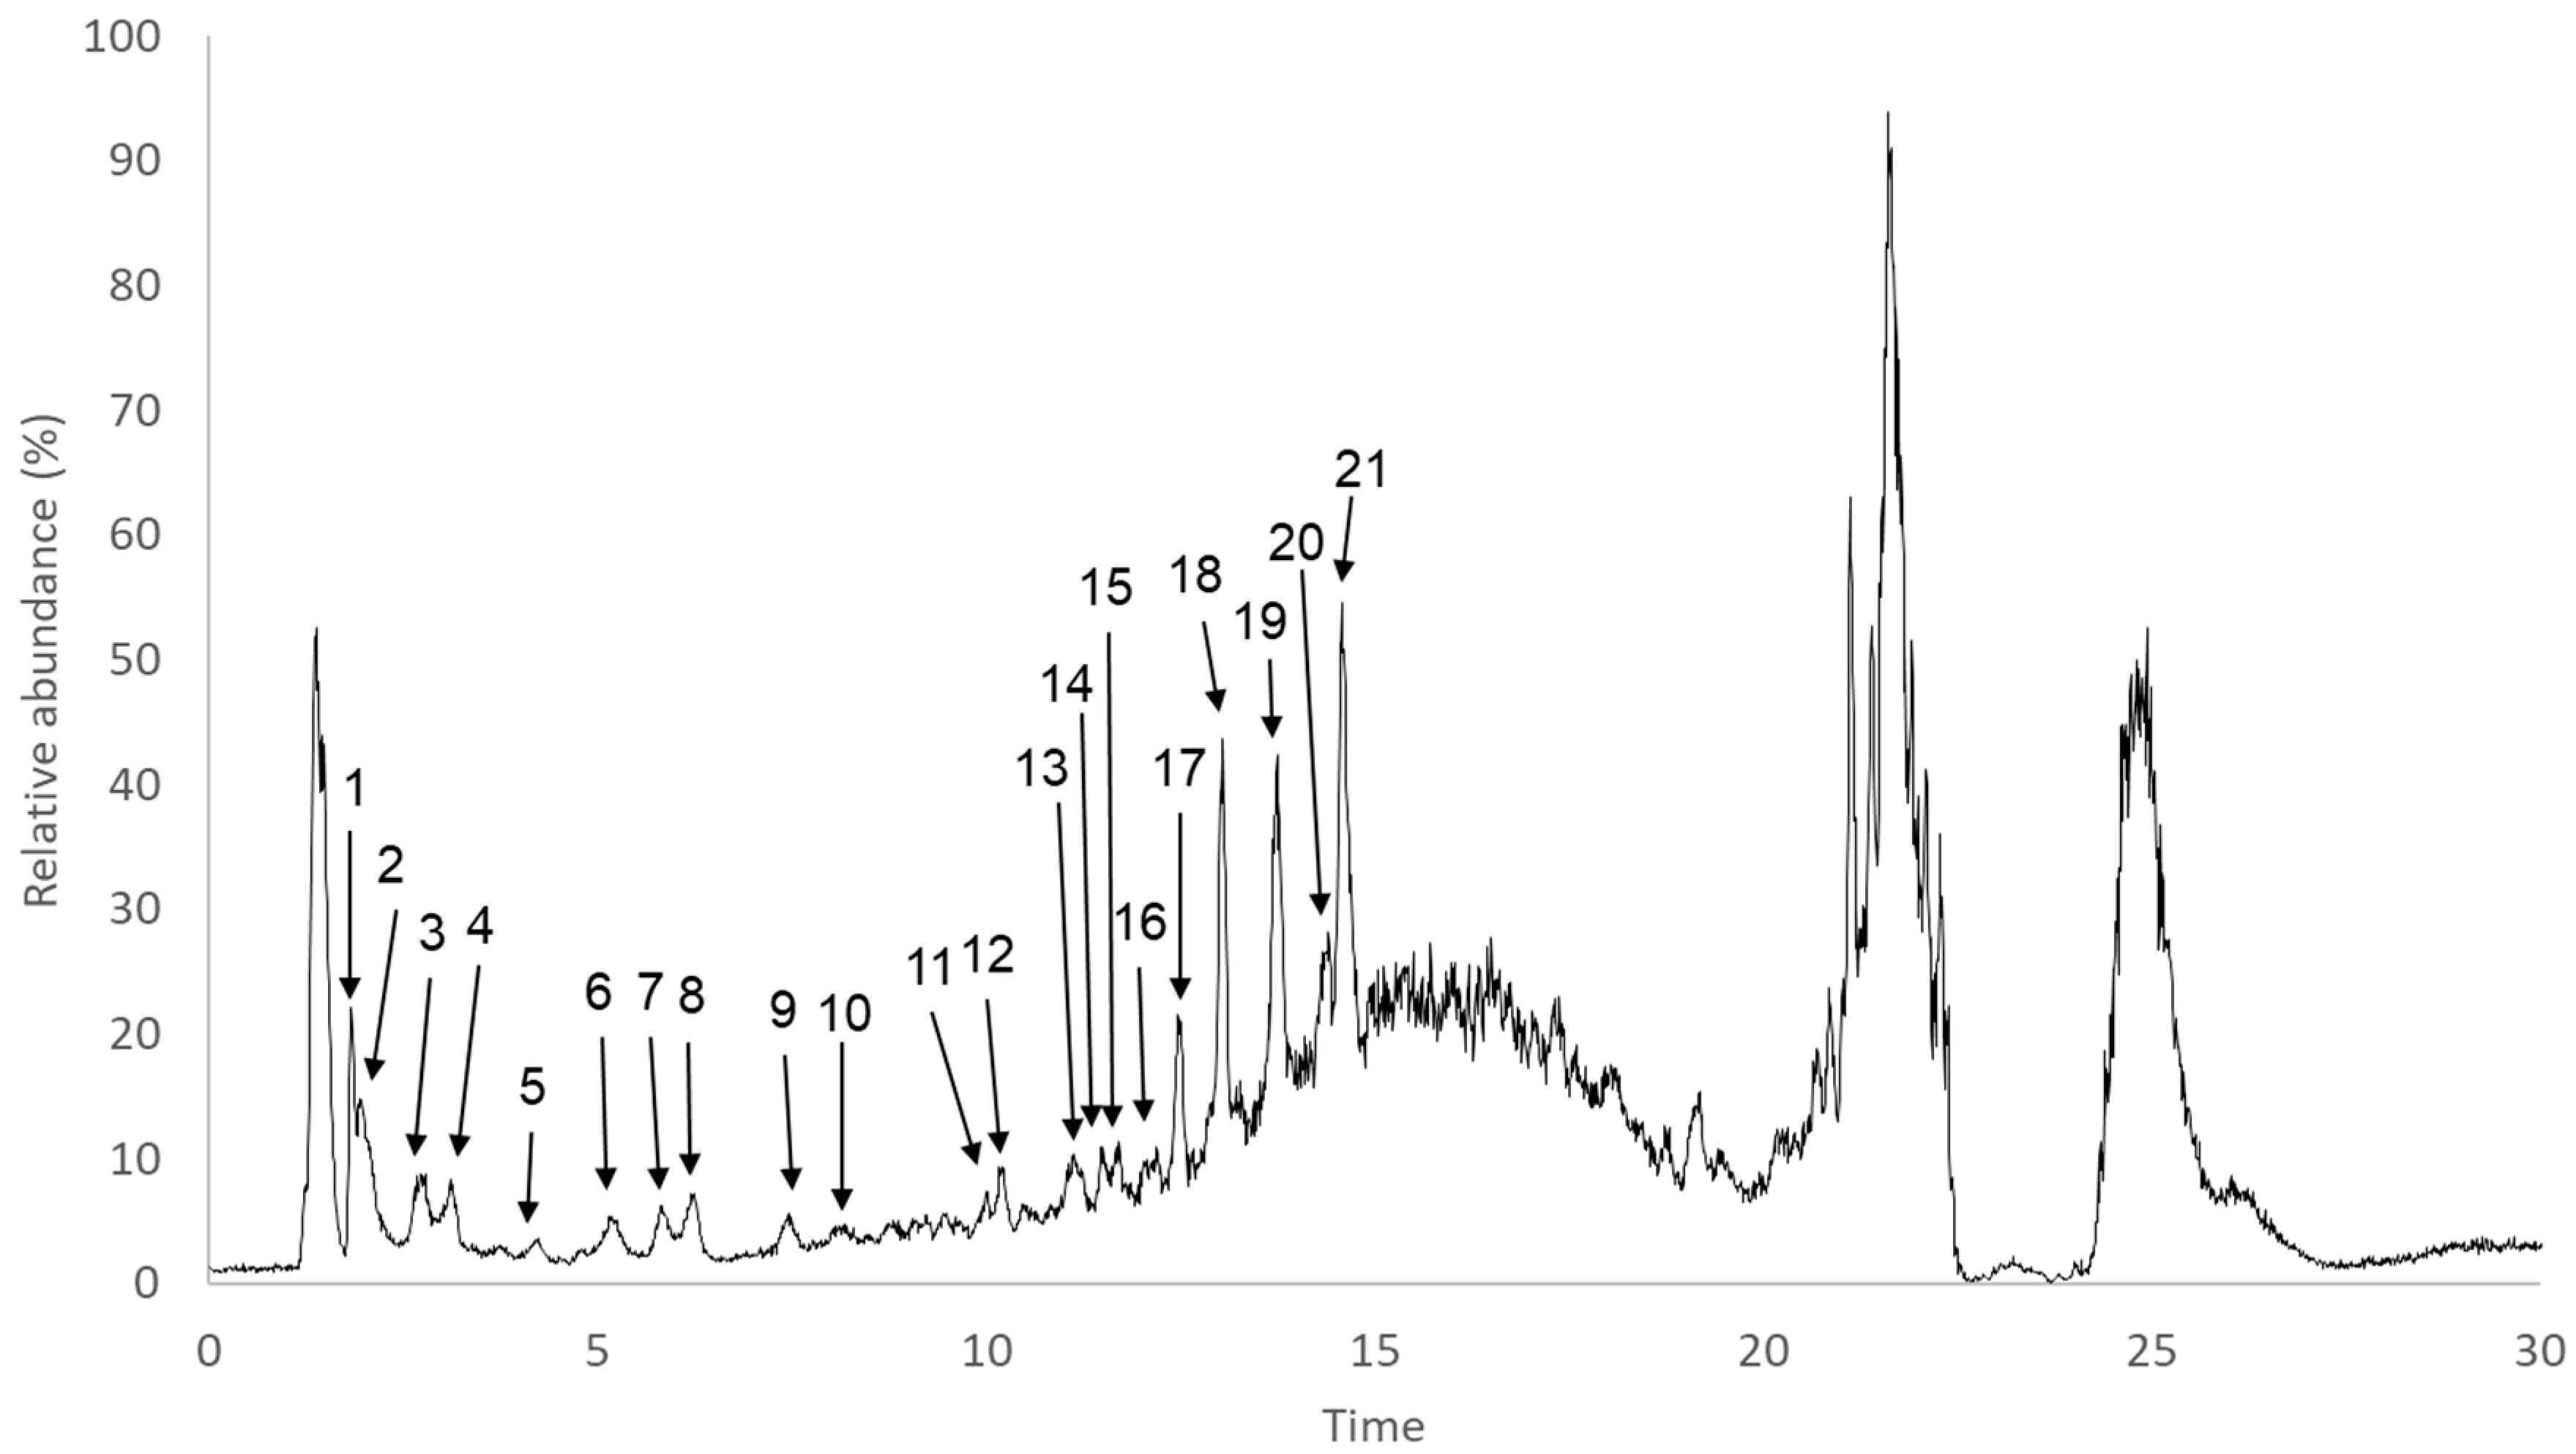
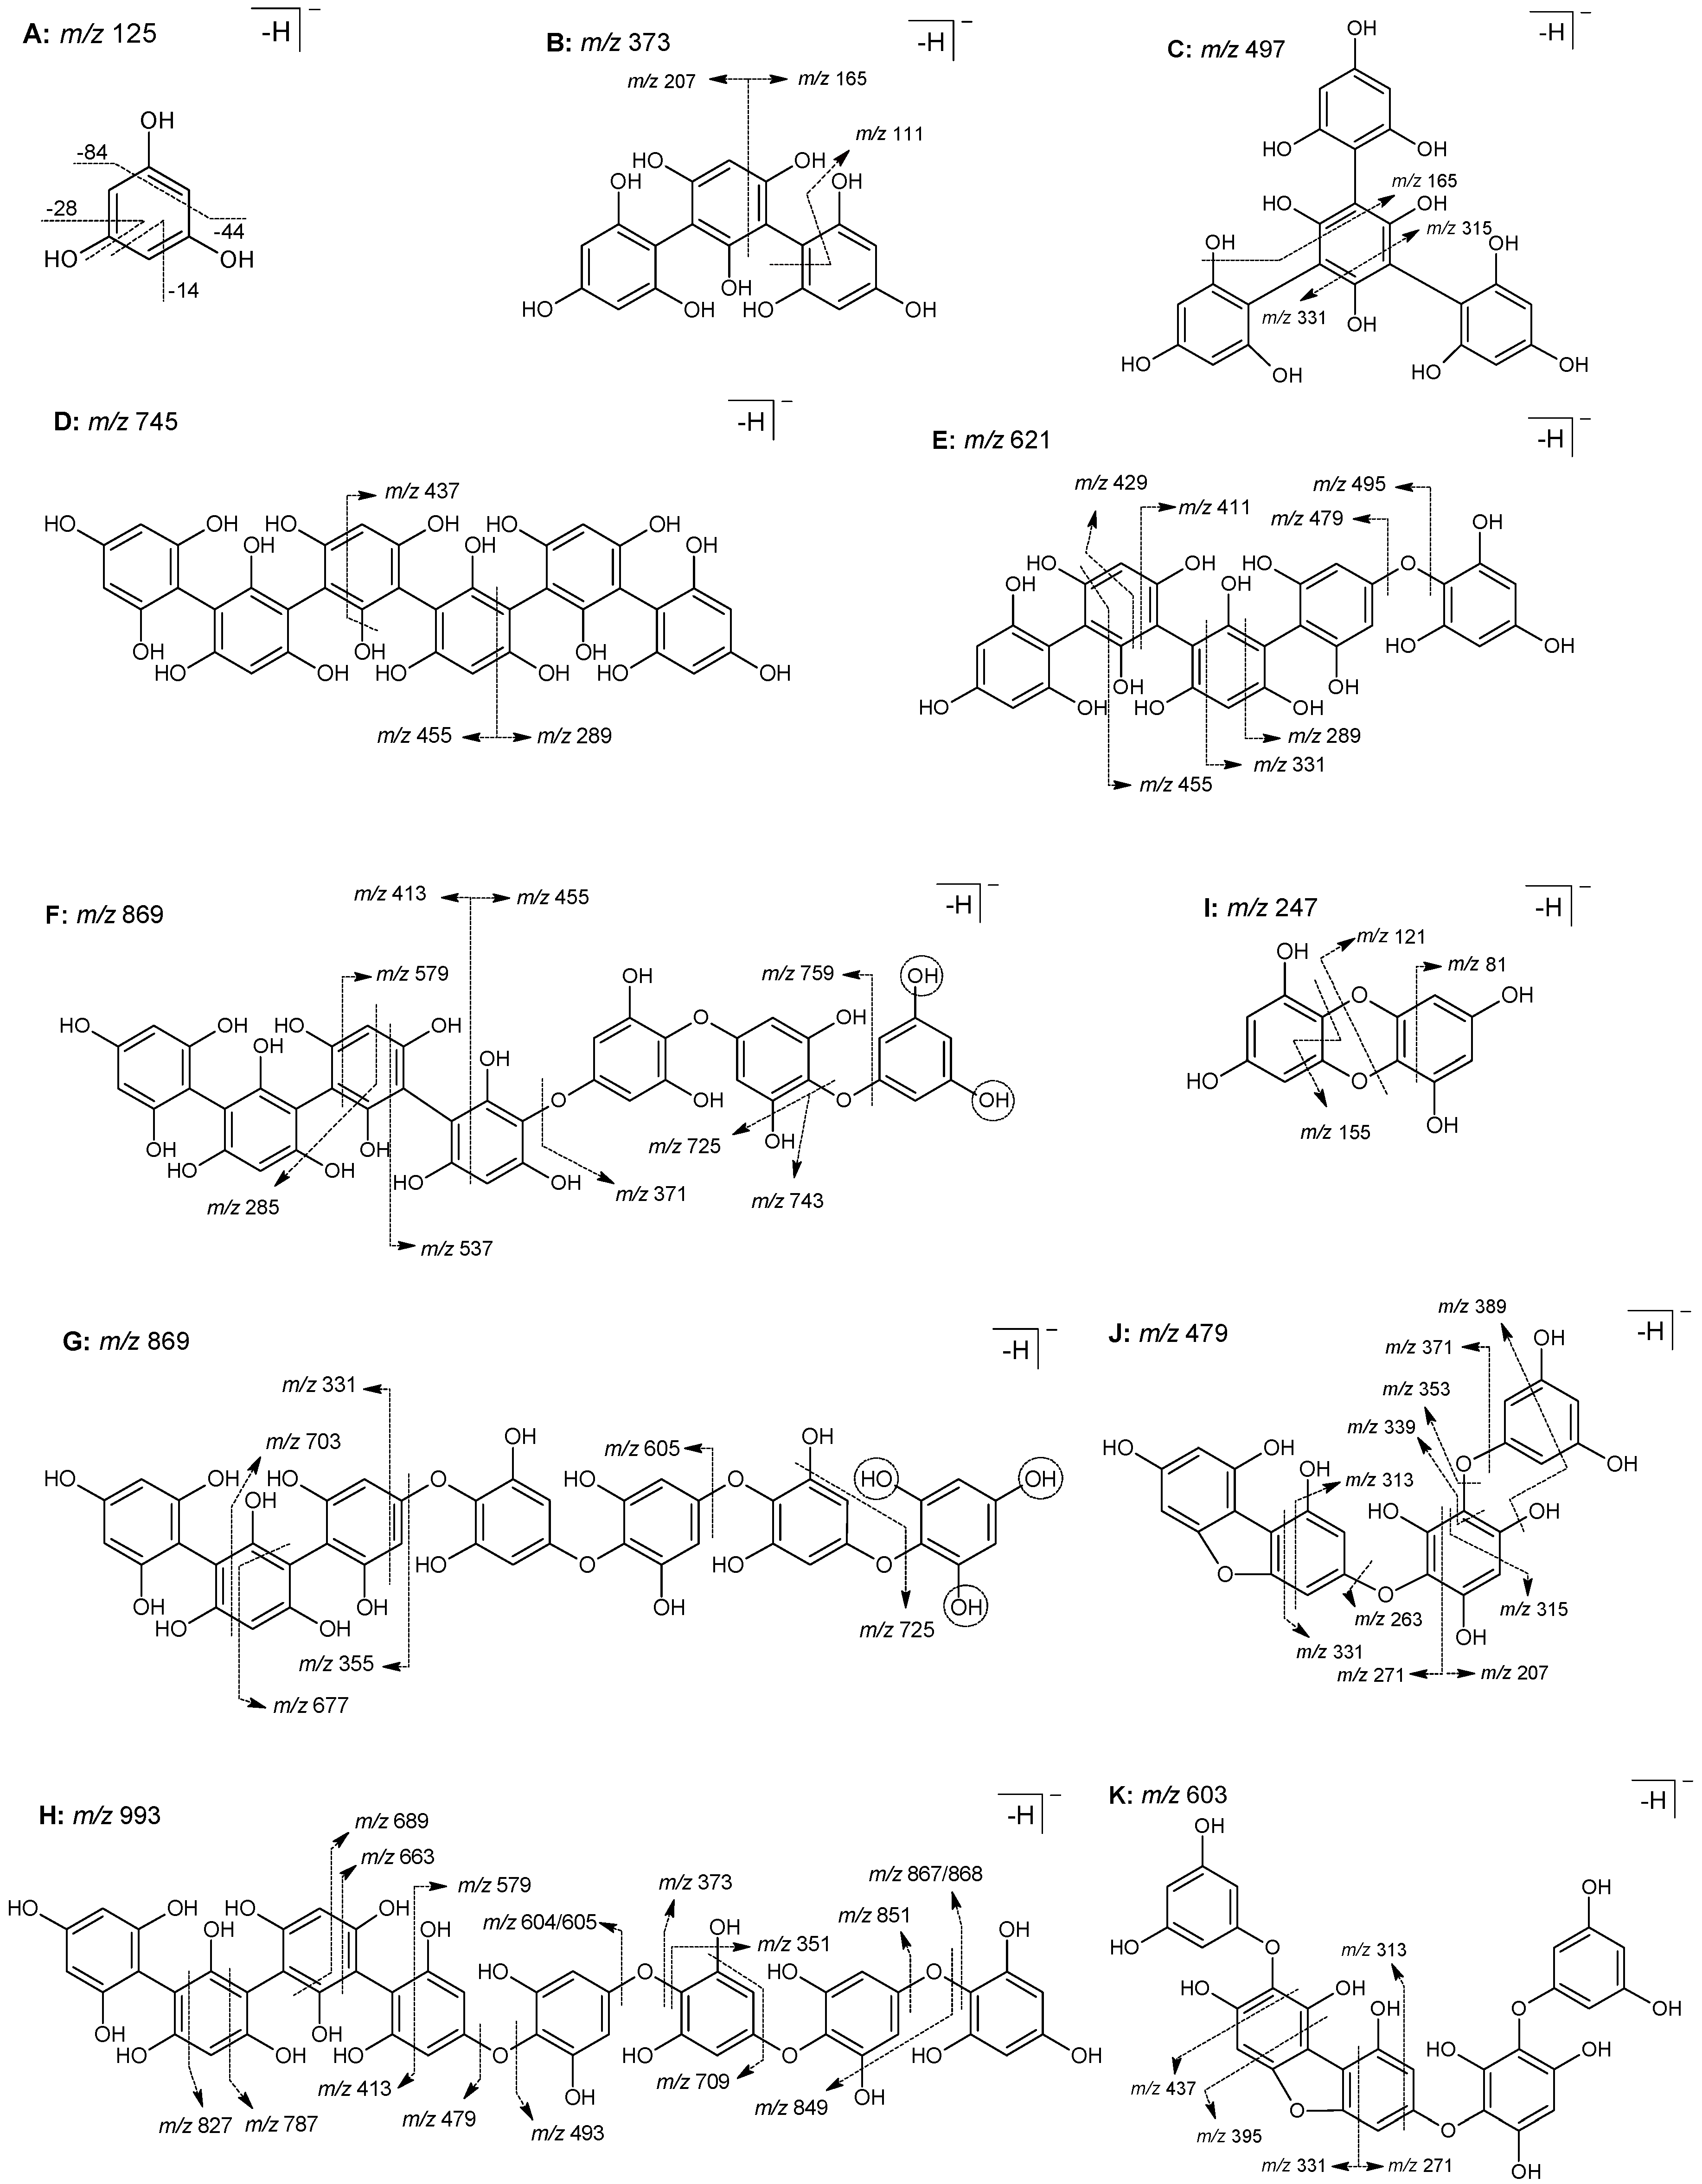
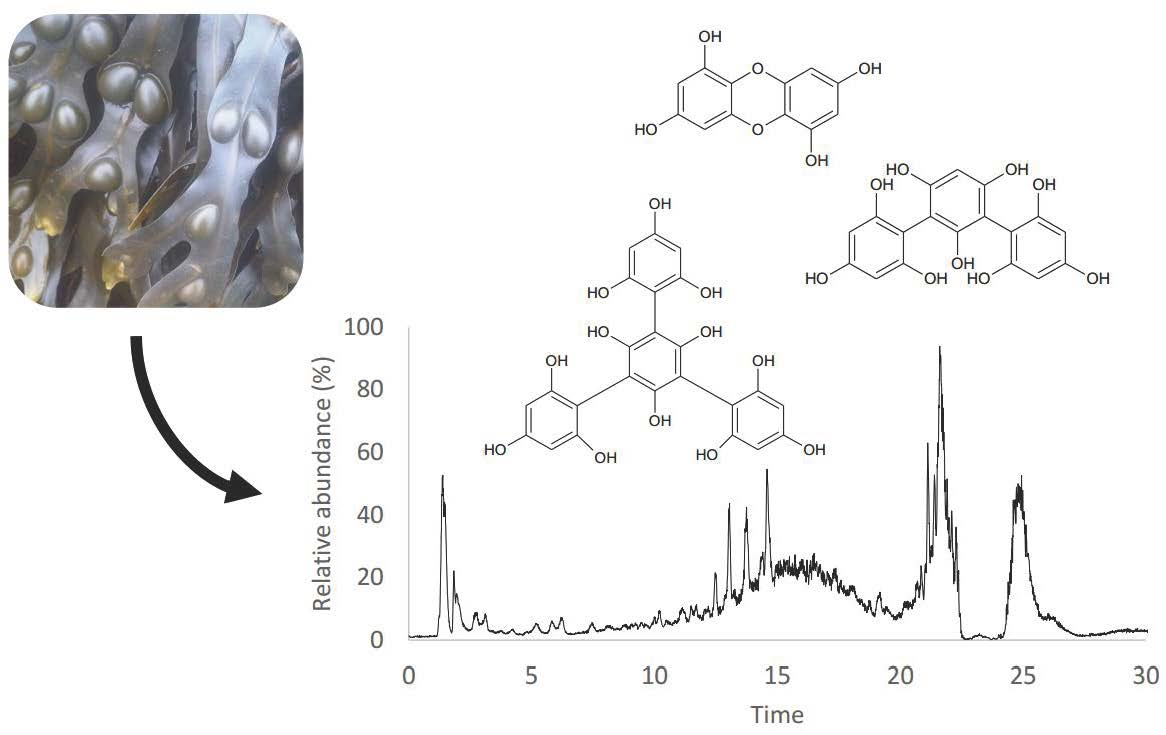
2.5. Characterization of Phlorotannin-Rich Fraction
3. Materials and Methods
3.1. Materials
3.2. Methods
3.2.1. Single-Factor Experiments
3.2.2. Experimental Design for Optimization of Phlorotannins Extraction
3.2.3. Preparation and Purification of Seaweed Extract
3.2.4. Determination of Total Phlorotannin Content
3.2.5. Enzymatic Assays
α-amylase Inhibition Assay
α-glucosidase Inhibition Assay
Pancreatic Lipase Inhibition Assay
3.2.6. UHPLC-DAD-ESI/MS Analysis
3.2.7. Statistical Analysis
4. Conclusions
Author Contributions
Funding
Conflicts of Interest
References
- Martinez, J.H.I.; Castaneda, H.G.T.; Isaza Martínez, J.H.; Torres Castañeda, H.G.; Martinez, J.H.I.; Castaneda, H.G.T. Preparation and chromatographic analysis of phlorotannins. J. Chromatogr. Sci. 2013, 51, 825–838. [Google Scholar] [CrossRef] [PubMed]
- Li, Y.-X.; Wijesekara, I.; Li, Y.; Kim, S.-K. Phlorotannins as bioactive agents from brown algae. Process Biochem. 2011, 46, 2219–2224. [Google Scholar] [CrossRef]
- Catarino, D.M.; Silva, M.A.; Cardoso, M.S. Fucaceae: A Source of Bioactive Phlorotannins. Int. J. Mol. Sci. 2017, 18, 1327. [Google Scholar] [CrossRef] [PubMed]
- Kucera, H.; Saunders, G.W. Assigning morphological variants of Fucus (Fucales, Phaeophyceae) in Canadian waters to recognized species using DNA barcoding. Botany 2008, 86, 1065–1079. [Google Scholar] [CrossRef]
- Pereira, L. Edible Seaweeds of the World; CRC Press: Boca Raton, FL, USA, 2016. [Google Scholar]
- Küpper, F.C.; Feiters, M.C.; Olofsson, B.; Kaiho, T.; Yanagida, S.; Zimmermann, M.B.; Carpenter, L.J.; Luther, G.W.; Lu, Z.; Jonsson, M.; et al. Commemorating two centuries of iodine research: An interdisciplinary overview of current research. Angew. Chem. Int. Ed. 2011, 50, 11598–11620. [Google Scholar] [CrossRef] [PubMed]
- Pereira, L. A review of the nutrient composition of selected edible seaweeds. In Seaweed: Ecology, Nutrient Composition and Medicinal Uses; Pomin, V.H., Ed.; Nova Science Publishers, Inc.: Hauppauge, NY, USA, 2011; pp. 15–47. [Google Scholar]
- Ale, M.T.; Mikkelsen, J.D.; Meyer, A.S. Important determinants for fucoidan bioactivity: A critical review of structure-function relations and extraction methods for fucose-containing sulfated polysaccharides from brown seaweeds. Mar. Drugs 2011, 9, 2106–2130. [Google Scholar] [CrossRef]
- Laekeman, G. Assessment Report on Fucus vesiculosus L., thallus Herbal Preparations in Solid Dosage form for Oral Use; European Medicines Agency: London, UK, 2014. [Google Scholar]
- Min, S.-K.; Han, S.-M.; Kim, H.-T.; Kwon, O.-C.; Lee, S.; Kim, J.-K. Algal fucoidan, unlike heparin, has thrombolytic activity in a murine arterial thrombosis model. Blood Coagul. Fibrinolysis 2012, 23, 359–366. [Google Scholar] [CrossRef]
- Holdt, S.L.; Kraan, S. Bioactive compounds in seaweed: Functional food applications and legislation. J. Appl. Phycol. 2011, 23, 543–597. [Google Scholar] [CrossRef]
- Catarino, M.; Silva, A.; Cardoso, S. Phycochemical Constituents and Biological Activities of Fucus spp. Mar. Drugs 2018, 16, 249. [Google Scholar] [CrossRef]
- Hermund, D.B.; Yeşiltaş, B.; Honold, P.; Jónsdóttir, R.; Kristinsson, H.G.; Jacobsen, C. Characterisation and antioxidant evaluation of Icelandic F. vesiculosus extracts in vitro and in fish-oil-enriched milk and mayonnaise. J. Funct. Foods 2015, 19, 828–841. [Google Scholar] [CrossRef]
- O’Sullivan, A.M.; O’Grady, M.N.; O’Callaghan, Y.C.; Smyth, T.J.; O’Brien, N.M.; Kerry, J.P. Seaweed extracts as potential functional ingredients in yogurt. Innov. Food Sci. Emerg. Technol. 2015, 37, 293–299. [Google Scholar] [CrossRef]
- O’Sullivan, A.M.; O’Callaghan, Y.C.; O’Grady, M.N.; Waldron, D.S.; Smyth, T.J.; O’Brien, N.M.; Kerry, J.P. An examination of the potential of seaweed extracts as functional ingredients in milk. Int. J. Dairy Technol. 2014, 67, 182–193. [Google Scholar] [CrossRef]
- Liu, B.; Kongstad, K.T.; Wiese, S.; Jäger, A.K.; Staerk, D. Edible seaweed as future functional food: Identification of α-glucosidase inhibitors by combined use of high-resolution α-glucosidase inhibition profiling and HPLC-HRMS-SPE-NMR. Food Chem. 2016, 203, 16–22. [Google Scholar] [CrossRef] [PubMed]
- Lordan, S.; Smyth, T.J.; Soler-Vila, A.; Stanton, C.; Paul Ross, R. The α-amylase and α-glucosidase inhibitory effects of Irish seaweed extracts. Food Chem. 2013, 141, 2170–2176. [Google Scholar] [CrossRef] [PubMed]
- Neto, R.T.; Marçal, C.; Queirós, A.S.; Abreu, H.; Silva, A.M.S.; Cardoso, S.M. Screening of Ulva rigida, Gracilaria sp., Fucus vesiculosus and Saccharina latissima as Functional Ingredients. Int. J. Mol. Sci. 2018, 19, 2987. [Google Scholar] [CrossRef] [PubMed]
- Chater, P.I.; Wilcox, M.; Cherry, P.; Herford, A.; Mustar, S.; Wheater, H.; Brownlee, I.; Seal, C.; Pearson, J. Inhibitory activity of extracts of Hebridean brown seaweeds on lipase activity. J. Appl. Phycol. 2016, 28, 1303–1313. [Google Scholar] [CrossRef]
- Dent, M.; Dragović-Uzelac, V.; Penić, M.; Brñić, M.; Bosiljkov, T.; Levaj, B. The effect of extraction solvents, temperature and time on the composition and mass fraction of polyphenols in dalmatian wild sage (Salvia officinalis L.) extracts. Food Technol. Biotechnol. 2013, 51, 84–91. [Google Scholar]
- O’Sullivan, A.M.; O’Callaghan, Y.C.; O’Grady, M.N.; Queguineur, B.; Hanniffy, D.; Troy, D.J.; Kerry, J.P.; O’Brien, N.M. In vitro and cellular antioxidant activities of seaweed extracts prepared from five brown seaweeds harvested in spring from the west coast of Ireland. Food Chem. 2011, 126, 1064–1070. [Google Scholar] [CrossRef]
- Koivikko, R.; Loponen, J.; Pihlaja, K.; Jormalainen, V. High-performance liquid chromatographic analysis of phlorotannins from the brown alga Fucus vesiculosus. Phytochem. Anal. 2007, 18, 326–332. [Google Scholar] [CrossRef]
- Bahar, B.; O’Doherty, J.V.; Smyth, T.J.; Sweeney, T. A comparison of the effects of an Ascophyllum nodosum ethanol extract and its molecular weight fractions on the inflammatory immune gene expression in-vitro and ex-vivo. Innov. Food Sci. Emerg. Technol. 2016, 37, 276–285. [Google Scholar] [CrossRef]
- Koivikko, R.; Loponen, J.; Honkanen, T.; Jormalainen, V. Contents of soluble, cell-wall-bound and exuded phlorotannins in the brown alga Fucus vesiculosus, with implications on their ecological functions. J. Chem. Ecol. 2005, 31, 195–212. [Google Scholar] [CrossRef] [PubMed]
- Liu, H.; Gu, L. Phlorotannins from brown algae (Fucus vesiculosus) inhibited the formation of advanced glycation endproducts by scavenging reactive carbonyls. J. Agric. Food Chem. 2012, 60, 1326–1334. [Google Scholar] [CrossRef] [PubMed]
- Breton, F.; Cérantola, S.; Ar Gall, E. Distribution and radical scavenging activity of phenols in Ascophyllum nodosum (Phaeophyceae). J. Exp. Mar. Biol. Ecol. 2011, 399, 167–172. [Google Scholar] [CrossRef]
- Kim, A.-R.; Shin, T.-S.; Lee, M.-S.; Park, J.-Y.; Park, K.-E.; Yoon, N.-Y.; Kim, J.-S.; Choi, J.-S.; Jang, B.-C.; Byun, D.-S.; et al. Isolation and identification of phlorotannins from Ecklonia stolonifera with antioxidant and anti-inflammatory properties. J. Agric. Food Chem. 2009, 57, 3483–3489. [Google Scholar] [CrossRef] [PubMed]
- Honold, P.J.; Jacobsen, C.; Jónsdóttir, R.; Kristinsson, H.G.; Hermund, D.B. Potential seaweed-based food ingredients to inhibit lipid oxidation in fish-oil-enriched mayonnaise. Eur. Food Res. Technol. 2016, 242, 571–584. [Google Scholar] [CrossRef]
- Belda, M.; Sanchez, D.; Bover, E.; Prieto, B.; Padrón, C.; Cejalvo, D.; Miguel, J. Extraction of polyphenols in Himanthalia elongata and determination by high performance liquid chromatography with diode array detector prior to its potential use against oxidative stress. J. Chromatogr. B 2016, 1033–1034, 334–341. [Google Scholar] [CrossRef] [PubMed]
- Tierney, M.S.; Smyth, T.J.; Hayes, M.; Soler-vila, A.; Croft, A.K.; Brunton, N. Influence of pressurised liquid extraction and solid–liquid extraction methods on the phenolic content and antioxidant activities of Irish macroalgae. Int. J. Food Sci. Technol. 2013, 48, 860–869. [Google Scholar] [CrossRef]
- Auezova, L.; Najjar, F.; Selivanova, O.; Hajj Moussa, E.; Diab Assaf, M. Antioxidant activity of brown alga Saccharina bongardiana from Kamchatka (Pacific coast of Russia). A methodological approach. J. Appl. Phycol. 2013, 25, 1189–1196. [Google Scholar] [CrossRef]
- Leyton, A.; Pezoa-Conte, R.; Barriga, A.; Buschmann, A.H.; Mäki-Arvela, P.; Mikkola, J.P.; Lienqueo, M.E. Identification and efficient extraction method of phlorotannins from the brown seaweed Macrocystis pyrifera using an orthogonal experimental design. Algal Res. 2016, 16, 201–208. [Google Scholar] [CrossRef]
- Wang, T.; Jónsdóttir, R.; Ólafsdóttir, G. Total phenolic compounds, radical scavenging and metal chelation of extracts from Icelandic seaweeds. Food Chem. 2009, 116, 240–248. [Google Scholar] [CrossRef]
- Topuz, O.K.; Gokoglu, N.; Yerlikaya, P.; Ucak, I.; Gumus, B. Optimization of antioxidant activity and phenolic compound extraction conditions from red seaweed (Laurencia obtuse). J. Aquat. Food Prod. Technol. 2016, 25, 414–422. [Google Scholar] [CrossRef]
- Boi, V.N.; Cuong, D.X.; Vinh, P.T.K.V. Effects of extraction conditions over the phlorotannin content and antioxidant activity of extract from brown algae Sargassum serratum. Free Radic. Antioxid. 2017, 7, 115–122. [Google Scholar] [CrossRef]
- Yang, L.; Cao, Y.L.; Jiang, J.G.; Lin, Q.S.; Chen, J.; Zhu, L. Response surface optimization of ultrasound-assisted flavonoids extraction from the flower of Citrus aurantium L. var. amara Engl. J. Sep. Sci. 2010, 33, 1349–1355. [Google Scholar] [PubMed]
- He, Z.; Chen, Y.; Chen, Y.; Liu, H.; Yuan, G.; Fan, Y.; Chen, K. Optimization of the microwave-assisted extraction of phlorotannins from Saccharina japonica Aresch and evaluation of the inhibitory effects of phlorotannin-containing extracts on HepG2 cancer cells. Chin. J. Oceanol. Limnol. 2013, 31, 1045–1054. [Google Scholar] [CrossRef]
- Li, Y.; Fu, X.; Duan, D.; Liu, X.; Xu, J.; Gao, X. Extraction and identification of phlorotannins from the brown alga, Sargassum fusiforme (Harvey) Setchell. Mar. Drugs 2017, 15, 49. [Google Scholar] [CrossRef] [PubMed]
- Mokrani, A.; Madani, K. Effect of solvent, time and temperature on the extraction of phenolic compounds and antioxidant capacity of peach (Prunus persica L.) fruit. Sep. Purif. Technol. 2016, 162, 68–76. [Google Scholar] [CrossRef]
- Kadam, S.U.; Tiwari, B.K.; O’Donnell, C.P. Application of novel extraction technologies for bioactives from marine algae. J. Agric. Food Chem. 2013, 61, 4667–4675. [Google Scholar] [CrossRef] [PubMed]
- Karadağ, A.; Hermund, D.B.; Jensen, L.H.S.; Andersen, U.; Jónsdóttir, R.; Kristinsson, H.G.; Alasalvar, C.; Jacobsen, C. Oxidative stability and microstructure of 5% fish-oil-enriched granola bars added natural antioxidants derived from brown alga Fucus vesiculosus. Eur. J. Lipid Sci. Technol. 2017, 119, 1–12. [Google Scholar] [CrossRef]
- Heffernan, N.; Brunton, N.P.; FitzGerald, R.J.; Smyth, T.J. Profiling of the molecular weight and structural isomer abundance of macroalgae-derived phlorotannins. Mar. Drugs 2015, 13, 509–528. [Google Scholar] [CrossRef]
- Wang, T.; Jónsdóttir, R.; Kristinsson, H.G.; Thorkelsson, G.; Jacobsen, C.; Hamaguchi, P.Y.; Ólafsdóttir, G. Inhibition of haemoglobin-mediated lipid oxidation in washed cod muscle and cod protein isolates by Fucus vesiculosus extract and fractions. Food Chem. 2010, 123, 321–330. [Google Scholar] [CrossRef]
- Alothman, M.; Bhat, R.; Karim, A.A. Antioxidant capacity and phenolic content of selected tropical fruits from Malaysia, extracted with different solvents. Food Chem. 2009, 115, 785–788. [Google Scholar] [CrossRef]
- Yoon, M.; Kim, J.S.; Um, M.Y.; Yang, H.; Kim, J.; Kim, Y.T.; Lee, C.; Kim, S.B.; Kwon, S.; Cho, S. Extraction optimization for phlorotannin recovery from the edible brown seaweed Ecklonia cava. J. Aquat. Food Prod. Technol. 2017, 26, 801–810. [Google Scholar] [CrossRef]
- Wang, T.; Jónsdóttir, R.; Liu, H.; Gu, L.; Kristinsson, H.G.; Raghavan, S.; Ólafsdóttir, G. Antioxidant capacities of phlorotannins extracted from the brown algae Fucus vesiculosus. J. Agric. Food Chem. 2012, 60, 5874–5883. [Google Scholar] [CrossRef] [PubMed]
- Stern, J.L.; Hagerman, A.E.; Steinberg, P.D.; Winter, F.C.; Estes, J. a. A new assay for quantifying brown algal phlorotannins and comparisons to previous methods. J. Chem. Ecol. 1996, 22, 1273–1293. [Google Scholar] [CrossRef] [PubMed]
- Bandyopadhyay, P.; Ghosh, A.K.; Ghosh, C. Recent developments on polyphenol-protein interactions: Effects on tea and coffee taste, antioxidant properties and the digestive system. Food Funct. 2012, 3, 592–605. [Google Scholar] [CrossRef] [PubMed]
- Kellogg, J.; Grace, M.H.; Lila, M.A. Phlorotannins from alaskan seaweed inhibit carbolytic enzyme activity. Mar. Drugs 2014, 12, 5277–5294. [Google Scholar] [CrossRef] [PubMed]
- Kim, K.T.; Rioux, L.E.; Turgeon, S.L. α-amylase and α-glucosidase inhibition is differentially modulated by fucoidan obtained from Fucus vesiculosus and Ascophyllum nodosum. Phytochemistry 2014, 98, 27–33. [Google Scholar] [CrossRef]
- Tierney, M.S.; Soler-Vila, A.; Rai, D.K.; Croft, A.K.; Brunton, N.P.; Smyth, T.J. UPLC-MS profiling of low molecular weight phlorotannin polymers in Ascophyllum nodosum, Pelvetia canaliculata and Fucus spiralis. Metabolomics 2014, 10, 524–535. [Google Scholar] [CrossRef]
- Vissers, A.M.; Caligiani, A.; Sforza, S.; Vincken, J.P.; Gruppen, H. Phlorotannin Composition of Laminaria digitata. Phytochem. Anal. 2017, 28, 487–495. [Google Scholar] [CrossRef]
- Lopes, G.; Barbosa, M.; Vallejo, F.; Gil-Izquierdo, Á.; Andrade, P.B.; Valentão, P.; Pereira, D.M.; Ferreres, F. Profiling phlorotannins from Fucus spp. of the Northern Portuguese coastline: Chemical approach by HPLC-DAD-ESI/MSnand UPLC-ESI-QTOF/MS. Algal Res. 2018, 29, 113–120. [Google Scholar] [CrossRef]
- Steevensz, A.J.; MacKinnon, S.L.; Hankinson, R.; Craft, C.; Connan, S.; Stengel, D.B.; Melanson, J.E. Profiling phlorotannins in brown macroalgae by liquid chromatography-high resolution mass spectrometry. Phytochem. Anal. 2012, 23, 547–553. [Google Scholar] [CrossRef] [PubMed]
- Montero, L.; Sánchez-Camargo, A.P.; García-Cañas, V.; Tanniou, A.; Stiger-Pouvreau, V.; Russo, M.; Rastrelli, L.; Cifuentes, A.; Herrero, M.; Ibáñez, E. Anti-proliferative activity and chemical characterization by comprehensive two-dimensional liquid chromatography coupled to mass spectrometry of phlorotannins from the brown macroalga Sargassum muticum collected on North-Atlantic coasts. J. Chromatogr. A 2016, 1428, 115–125. [Google Scholar] [CrossRef] [PubMed]
- Agregán, R.; Munekata, P.E.S.; Franco, D.; Dominguez, R.; Carballo, J.; Lorenzo, J.M. Phenolic compounds from three brown seaweed species using LC-DAD–ESI-MS/MS. Food Res. Int. 2017, 99, 979–985. [Google Scholar] [CrossRef] [PubMed]
- Corona, G.; Ji, Y.; Anegboonlap, P.; Hotchkiss, S.; Gill, C.; Yaqoob, P.; Spencer, J.P.E.; Rowland, I. Gastrointestinal modifications and bioavailability of brown seaweed phlorotannins and effects on inflammatory markers. Br. J. Nutr. 2016, 15, 1–14. [Google Scholar] [CrossRef] [PubMed]
- Lopes, G.; Sousa, C.; Silva, L.R.; Pinto, E.; Andrade, P.B.; Bernardo, J.; Mouga, T.; Valentão, P. Can phlorotannins purified extracts constitute a novel pharmacological alternative for microbial infections with associated inflammatory conditions? PLoS ONE 2012, 7, e31145. [Google Scholar] [CrossRef] [PubMed]
- Pereira, O.; Catarino, M.; Afonso, A.; Silva, A.; Cardoso, S. Salvia elegans, Salvia greggii and Salvia officinalis Decoctions: Antioxidant Activities and Inhibition of Carbohydrate and Lipid Metabolic Enzymes. Molecules 2018, 23, 3169. [Google Scholar] [CrossRef] [PubMed]
- Ferreres, F.; Lopes, G.; Gil-Izquierdo, A.; Andrade, P.B.; Sousa, C.; Mouga, T.; Valentão, P. Phlorotannin extracts from fucales characterized by HPLC-DAD-ESI-MSn: Approaches to hyaluronidase inhibitory capacity and antioxidant properties. Mar. Drugs 2012, 10, 2766–2781. [Google Scholar] [CrossRef]


| Parameter | Regression Coefficient |
|---|---|
| β0 | 2.69 *** |
| X1 | 0.31 *** |
| X2 | 0.08 ** |
| X3 | 0.02 |
| X1X1 | −0.25 *** |
| X2X2 | 0.02 |
| X3X3 | −0.07 |
| X1X2 | 0.12 ** |
| X1X3 | −0.02 |
| X2X3 | 0.01 |
| R2 | 0.99 |
| R2Adj | 0.96 |
| Model F-value | 39.24 |
| Model p-value | <0.001 |
| Lack-of-fit p-value | 0.46 |
| Response | Optimum Conditions | Results | |||
|---|---|---|---|---|---|
| X1 | X2 | X3 | Predicted | Experimental | |
| TPhC (mg PGE/g DS) | 67 | 70 | 25 | 2.97 | 2.92 ± 0.05 |
| Sample | Yield (%) | TPhC (mg PGE/g ext) |
|---|---|---|
| Crude extract | 28.2 ± 2.1 | 10.7 ± 1.5 b |
| Hex | 15.5 ± 1.2 b | 4.0 ± 0. 9 c |
| EtOAc | 3.9 ± 0.6 c | 17.1 ± 1.5 a |
| AQ | 82.2 ± 2.3 a | 3.7 ± 0.5 c |
| Sample | IC50 Value (μg/mL) | ||
|---|---|---|---|
| α-amylase | α-glucosidase | Pancreatic Lipase | |
| Crude extract | 28.8 ± 1.2 a | 4.5 ± 0.7 a | 45.9 ± 3.4 a |
| EtOAc | 2.8 ± 0.3 b | 0.82 ± 0.05 a | 19.0 ± 1.8 b |
| Acarbose | 0.7 ± 0.2 c | 206.6 ± 25.1 b | - |
| Orlistat * | - | - | 1.8 ± 0.5 c |
| Peak | RT (min) | [M − H]− (m/z) | MS/MS Fragments (-loss) * | Tentative Assignment |
|---|---|---|---|---|
| 1 | 1.8 | 373 | MS2[373]: 355 (−18), 329 (−44), 207 (−166), 165 (−PGU−84), 289 (−84), 111 (−2PGU−14), | Trifucol |
| 2 | 1.9 | 497 | MS2[497]: 479 (−18), 331 (−166), 461 (−36), 453 (−44), 435 (−44−18), 395 (−84−18), 165 (−2PGU−84), 315 (−166−18), 413 (−84) | Tetrafucol |
| 529 | MS2[529]: 511 (−18), 493 (−36), 467 (−44−18), 411 (−84−36, +2), 449 (−44−36), 485 (−44), 347 (−166−18, +2), 405 (−PGU), 377 (−PGU−28) | Hydroxytetrafuhalol | ||
| 689 | MS2[689]: 605 (−84), 497 (−192), 621 (−68), 553 (−136), 671 (−18), 653 (−36), 537 (−PGU−28), 643 (−46), 575 (−114), 507 (−182), 345 (−2PGU−96) | Phlorotannin derivative | ||
| 3 | 2.8 | 621 | MS2[621]: 603 (−18), 455 (−166), 585 (−36), 331 (−PGU-166), 577 (−44), 559 (−44−18), 519 (−84−18), 289 (−2PGU−84), 429 (−192), 537 (−84), 495 (−PGU), 479 (−O–PGU), 411 (−PGU-84) | Trifucophlorethol |
| 247 | MS2[247]: 202 (−45), 121 (−PGU), 81 (−166), 155 (−PGU-29) | Dibenzodioxine-1,3,6,8-tetraol | ||
| 4 | 3.1 | 555 | MS2[555]: 537 (−18), 511 (−44), 519 (−36), 389 (−166), 331 (−224), 363 (−192), 393 (−PGU−36), 413 (−O–PGU), 430 (−PGU, −1), 305 (−2PGU), 247 (−308), 223 (−2PGU-84), 165 (−trifuhalol) | Phlorotannin derivative |
| 5 | 4.2 | 745 | MS2[745]: 727 (−18), 455 (−PGU−166), 709 (−36), 579 (−166), 289 (−3PGU−84), 701 (−44), 683 (−44−18), 643 (−84−18) 437 (−PGU−166−18) | Hexafucol |
| 6 | 5.2 | 623 | MS2[623]: 495 (−110−18), 477 (−110−36), 605 (−18), 369 (−2PGU, −2), 249 (−3PGU) | Phlorotannin derivative |
| 869 | MS2[869]: 851 (−18), 833 (−36), 743 (−PGU), 841 (−28), 725 (−PGU−18), 313 (−2PGU−166−18), 759 (−110), 413 (−2PGU−166), 579 (−PGU−166), 537 (−2PGU-84), 285 (−4PGU−72−18), 825 (−44), 455 (−3PGU−84), 371 (−4PGU) | Trifucotriphlorethol | ||
| 7 | 5.8 | 869 | MS2[869]: 833 (−36), 851 (−18), 703 (−166), 677 (−192), 767 (−84−18), 785 (−84), 725 (−PGU−18), 605 (−PGU-140), 355 (−tetrafuhalol), 331 (−3PGU−166) | Difucotetraphlorethol |
| 479 | MS2[479]: 461 (−18), 435 (−44), 433 (−28−18), 389 (−72−18), 313 (−166), 315 (−164), 271 (−PGU−84), 443 (−36), 339 (−140), 371 (−108), 451 (−28), 207 (−272) | Fucofurodiphlorethol | ||
| 8 | 6.2 | 479 | MS2[479]: 461 (−18), 435 (−44), 433 (−28−18), 389 (−72−18), 315 (−164), 443 (−36), 371 (−108), 271 (−208), 331 (−148), 353 (−126), 451 (−28), 263 (−216) | Fucofurodiphlorethol |
| 9 | 7.5 | 993 | MS2[993]: 975 (−18), 965 (−28), 827 (−166), 849 (−PGU-18), 868 (−PGU, +1), 957 (−36), 413 (−4PGU-84), 709 (−bifuhalol−18) | Pentafucodiphlorethol |
| 603 | MS2[603]: 585 (−18), 559 (−44), 437 (−166), 395 (−PGU−84), 313 (−PGU−166), 271 (−2PGU−84), 331 (−272) | Fucofurotriphlorethol | ||
| 10 | 8.2 | 385 | MS2[385]: 259 (−PGU), 367 (−18), 341 (−44), 245 (−140), 357(−28), 261 (−PGU), 313 (−72), 219 (−166) | Phlorotannin derivative |
| 993 | MS2[993]: 975 (−18), 579 (−2PGU−166), 957 (−36), 827 (−166), 849 (−PGU-18), 909 (−84), 891 (−84−18), 867 (−PGU), 949 (−44), 413 (−4PGU−84) | Hexafucophlorethol | ||
| 623 | MS2[623]: 605 (−18), 579 (−44), 495 (−110−18), 535 (−88), 561 (−44−18), 551 (−72), 357 (−bifuhalol), 437 (−PGU−44−18), 457 (−166) | Phlorotannin derivative | ||
| 11 | 10.0 | 363 | MS2[363]: 319 (−44), 345 (−18), 222 (−O–PGU, −1), 331 (−32), 301 (−44−18), 178 (−185), 327 (−36), | Phlorotannin derivative |
| 993 | MS2[993]: 975 (−18), 965 (−28), 867 (−PGU), 604 (−trifuhalol, +1), 579 (−2PGU−166), 849 (−PGU−18), 479 (−tetrafuhalol), 831 (−PGU-36), 787 (−PGU-84, +2), 373 (−5PGU) | Tetrafucotetraphloretol | ||
| 771 | MS2[771]: 753 (−18), 727 (−44), 735 (-36), 496 (−274, +1), 471 (−300), 477 (−294), 504 (−bifuhalol, +1), 615 (−156), 263 (−508), 587 (−184), 643 (−110−18), 613 (−158), 373 (−398) | Phlorotannin derivative | ||
| 12 | 10.2 | 361 | MS2[361]: 317 (−44), 343 (−18), 178 (-183), 331 (−30), 273 (−88), 299 (−44−18), 289 (−72) | Phlorotannin derivative |
| 993 | MS2[993]: 975 (−18), 965 (−28), 957 (−36), 851 (−O–PGU), 493 (−4PGU, −2), 663 (−4PGU−166), 689 (−2PGU−56), 351 (−5PGU-18), 457 (−3PGU−84), 605 (−trifuhalol, +2) | Tetrafucotetraphloretol | ||
| 13 | 11.1 | 403 | MS2[403]: 261 (−O–PGU), 385 (−18), 259 (−44), 217 (−186), 327 (−76), 371 (−32), 309 (−94), 341 (−44−18), 353 (−50), 193 (−PGU−84), 141 (−262), 125 (−278) | Phlorotannin derivative |
| 711 | MS2[711]: 693 (−18), 623 (−88), 229 (−482), 563 (−148), 429 (−282), 579 (−132), 249 (−462) | Phlorotannin derivative | ||
| 637 | MS2[637]: 619 (−18), 496 (−141), 511 (−126), 335 (−248−54), 593 (−44), 575 (−62) 436 (−182−17), 371 (−266), 601 (−36), 261 (−374−18), 245 (−266−126) | Pentafuhalol | ||
| 14 | 11.5 | 317 | MS2[317]: 273 (−44), 176 (−141), 299 (−18), 255 (−44−18), 245 (−72), 229 (−88), 187 (−130), 124 (−193) | Phlorotannin derivative |
| 526 | MS2[526]: 482 (−44), 438 (−88), 508 (−18), 494 (−32), 466 (−60), 406 (−120), 349 (−177), 275 (−251), 263 (−263), 249 (−277) | Unidentified | ||
| 851 | MS2[851]: 833 (−18), 709 (−O–PGU), 817 (−34), 691 (−160), 587 (−bifuhalol, −2), 435 (−2PGU−166), 455 (−3PGU−18), 761 (−90), 601 (−2PGU), 297 (−554), 583 (−268) | Fucofuropentaphlorethol | ||
| 15 | 11.7 | 637 | MS2[637]: 619 (−18), 496 (−141), 601 (−36), 335 (−2PGU−54), 577 (−60), 436 (−201), 471 (−166), 525 (−112), 575 (−44−18), 593 (−44), 555 (−84, −2), 419 (−218), 247 (−390), 373 (−bifuhalol, −2), 385 (−2PGU) | Pentafuhalol |
| 16 | 12.2 | 610 | MS2[610]: 566 (−44), 592 (−18), 449 (−161), 534 (−76), 462 (−148), 367 (−243), 229 (−381), 245 (−365), 309 (−301), 496 (−114) | Unidentified |
| 317 | MS2[317]: 299 (−18), 274 (−43), 245 (−72), 259 (−58), 194 (−123), 125 (−192) | Phlorotannin derivative | ||
| 711 | MS2[711]: 631 (−80), 693 (−18), 565 (−146), 639 (−72), 675 (−36), 395 (−316), 313 (−398), 469 (−242), 427 (−284), 371 (−340), 267 (−444), 229 (−482), 479 (−232), 513 (−198) | Phlorotannin derivative | ||
| 899 | MS2[899]: 881 (−18), 863 (−36), 741 (−158), 755 (−PGU−18), 693 (−206), 759 (−140), 471 (−428), 453 (−446), 371 (−528), 263 (−636), 507 (−3PGU−18), 565 (−334), 649 (−2PGU) | Phlorotannin derivative | ||
| 17 | 12.5 | 527 | MS2[527]: 509 (−18), 483 (−44), 465 (−44−18), 437 (−90), 385 (−O–PGU), 261 (−bifuhalol), 401 (−PGU), 341 (−186), 491 (−36), 421 (−106), 455 (−72), 279 (−2PGU), 247 (−280) | Phlorotannin derivative |
| 635 | MS2[635]: 575 (−60), 617 (−18), 335 (−300), 557 (−78), 369 (−bifuhalol), 509 (−PGU), 493 (−O–PGU), 457 (−178), 473 (−162), 273 (−2PGU−114), 229 (−406) | Phlorotannin derivative | ||
| 719 | MS2[719]: 701 (−60), 553 (−166), 478 (−241), 460 (−259), 496 (−223), 683 (−36), 319 (−400), 331 (−388), 371 (−348), 249 (−3PGU−96) | Phlorotannin derivative | ||
| 18 | 13.0 | 723 | MS2[723]: 677 (−60), 695 (−28), 705 (−18), 659 (−64), 583 (−140), 356 (−367), 339 (−384), 477 (−246) | Unidentified |
| 587 | MS2[587]: 507 (−80) | Unidentified | ||
| 19 | 13.7 | 837 | MS2[837]: 789 (−48), 747 (−90), 619 (−218), 581 (−256), 453 (−384), 265 (−572) | Unidentified |
| 20 | 14.4 | 950 | MS2[950]: 904 (−46), 696 (−254) | Unidentified |
| 667 | MS2[667]: 649 (−18), 635 (−32), 605 (−44−18), 379 (−288), 521 (−146), 507 (−160), 451 (−216), 317 (−350), 297 (−370), 271 (−396) | Unidentified | ||
| 21 | 14.6 | 587 | MS2[587]: 507 (−80) | Unidentified |
| Symbols | Independent Variables | Levels | ||
|---|---|---|---|---|
| −1 | 0 | 1 | ||
| X1 | Solvent concentration (% v/v) | 30 | 50 | 70 |
| X2 | Solvent-solid ratio (mL/g) | 30 | 50 | 70 |
| X3 | Temperature (°C) | 15 | 25 | 35 |
| Extract No. | Independent Variables | TPhC (mg PGE/g DS) | |||
|---|---|---|---|---|---|
| X1 | X2 | X3 | Experimental | Predicted | |
| 1 | 30 | 30 | 25 | 2.21 | 2.19 |
| 2 | 30 | 70 | 25 | 2.13 | 2.12 |
| 3 | 70 | 30 | 25 | 2.55 | 2.56 |
| 4 | 70 | 70 | 25 | 2.94 | 2.97 |
| 5 | 50 | 30 | 15 | 2.56 | 2.54 |
| 6 | 50 | 30 | 35 | 2.53 | 2.57 |
| 7 | 50 | 70 | 15 | 2.73 | 2.69 |
| 8 | 50 | 70 | 35 | 2.72 | 2.74 |
| 9 | 30 | 50 | 15 | 1.98 | 2.03 |
| 10 | 70 | 50 | 15 | 2.67 | 2.68 |
| 11 | 30 | 50 | 35 | 2.12 | 2.11 |
| 12 | 70 | 50 | 35 | 2.73 | 2.68 |
| 13 | 50 | 50 | 25 | 2.63 | 2.69 |
| 14 | 50 | 50 | 25 | 2.70 | 2.69 |
| 15 | 50 | 50 | 25 | 2.73 | 2.69 |
© 2019 by the authors. Licensee MDPI, Basel, Switzerland. This article is an open access article distributed under the terms and conditions of the Creative Commons Attribution (CC BY) license (http://creativecommons.org/licenses/by/4.0/).
Share and Cite
Catarino, M.D.; Silva, A.M.S.; Mateus, N.; Cardoso, S.M. Optimization of Phlorotannins Extraction from Fucus vesiculosus and Evaluation of Their Potential to Prevent Metabolic Disorders. Mar. Drugs 2019, 17, 162. https://doi.org/10.3390/md17030162
Catarino MD, Silva AMS, Mateus N, Cardoso SM. Optimization of Phlorotannins Extraction from Fucus vesiculosus and Evaluation of Their Potential to Prevent Metabolic Disorders. Marine Drugs. 2019; 17(3):162. https://doi.org/10.3390/md17030162
Chicago/Turabian StyleCatarino, Marcelo D., Artur M. S. Silva, Nuno Mateus, and Susana M. Cardoso. 2019. "Optimization of Phlorotannins Extraction from Fucus vesiculosus and Evaluation of Their Potential to Prevent Metabolic Disorders" Marine Drugs 17, no. 3: 162. https://doi.org/10.3390/md17030162
APA StyleCatarino, M. D., Silva, A. M. S., Mateus, N., & Cardoso, S. M. (2019). Optimization of Phlorotannins Extraction from Fucus vesiculosus and Evaluation of Their Potential to Prevent Metabolic Disorders. Marine Drugs, 17(3), 162. https://doi.org/10.3390/md17030162