Article

Urban Seismic Risk Assessment and Damage Estimation: Case of Rif Buildings (North of Morocco)

by
Seif-Eddine Cherif
1,
Aboubakr Chaaraoui
2,
Mimoun Chourak
3,
Mohamed Oualid Mghazli
4,
Abdelhay EL Omari
3 and
Tiago Miguel Ferreira
5,*
1
Georessources, Geoenvironment and Civil Engineering Laboratory (L3G), Faculty of Science and Technology, Cadi Ayyad University, Marrakech 40000, Morocco
2
Laboratory of Applied Geosciences, Department of Geology, Faculty of Sciences, Mohamed First University, Oujda 60000, Morocco
3
Mechanics and Applied Mathematics Department, Industrial and Seismic Engineering Research Team, National School of Applied Sciences of Oujda, Mohammed First University, Oujda 60000, Morocco
4
Tribology and System Dynamics Laboratory (LTDS UMR CNRS 5513), ENTPE, University of Lyon, 69120 Lyon, France
5
Department of Geography and Environmental Management, University of the West of England, Bristol BS16 1QY, UK
*
Author to whom correspondence should be addressed.
Buildings 2022, 12(6), 742; https://doi.org/10.3390/buildings12060742
Submission received: 9 May 2022 / Revised: 27 May 2022 / Accepted: 28 May 2022 / Published: 30 May 2022
(This article belongs to the Section Construction Management, and Computers & Digitization)

Abstract

:
The interest in assessing seismic risk in earthquake-prone regions in Morocco has been increasing over recent decades, to a large extent due to the substantial amount of damage imposed by recent events and because the population in these regions has grown significantly. In this context, the present study is aimed to contribute to the understanding of seismic risk in the urban areas of the Rif region, one of the most seismically active zones of Morocco, through the development and analysis of 36 building models representative of this area. Two earthquake scenarios were considered for the assessment of the seismic hazard, based on the national seismic code and the European code adapted to local seismic parameters. The performance points, determined following generated response and capacity spectra, made it possible to establish damage probability matrices. Obtained results corroborate those of previous reports, confirming that the damage is more significant in Imzouren due to the nature of the soil. It has also been shown that the credibility of the response spectra drawn from the national code is questioned, given the extreme damage estimated. The adapted European spectrum proved to be a more reliable probabilistic earthquake scenario for damage estimation.

1. Introduction

In Morocco, the rural world is lagging in terms of development indicators such as weak infrastructure, isolation, and insecurity. These structural weaknesses, combined with the droughts that occasionally affect the country, have strongly contributed to the rural exodus. In 1960, 71% of Moroccans lived in rural areas [1]. In recent years, and mainly as a result of the rural exodus, less than 40% of the country’s population still live in rural areas [2].
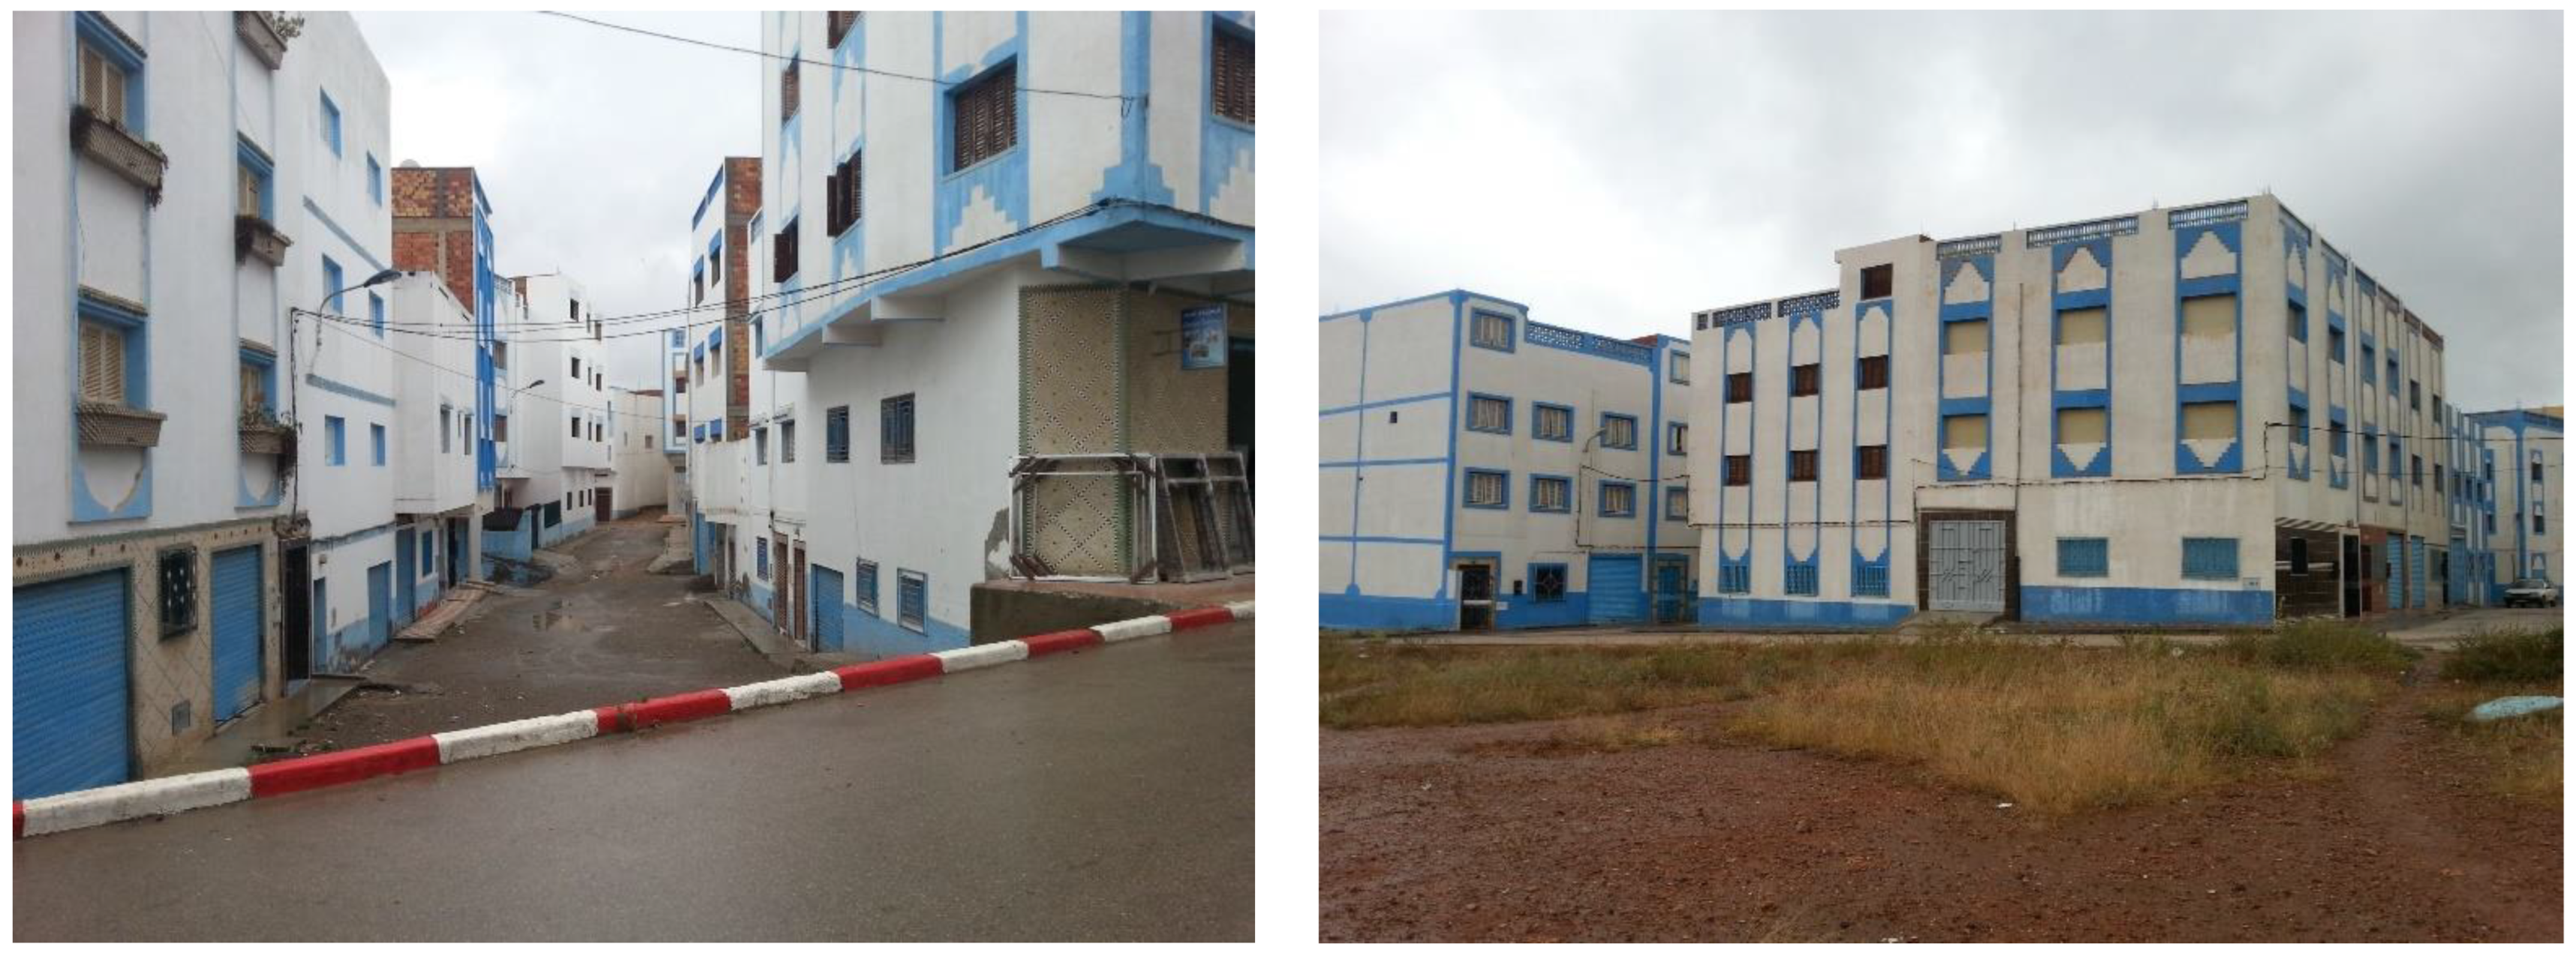
Across the country, urban planning has not been able to keep up with the significant increase in population following rural migration. The inadequate occupancy of the land contributes to increasing the damage due to seismic catastrophes. The high concentration of people, buildings, infrastructures, and exposed values turn these zones into high-risk areas. Districts that do not meet building standards are found in every city in Morocco. However, by adding moderate seismic activity to the equation, it becomes a recipe for disaster. This is the case for the urban and rural areas in the central Rif region.
The recent past has demonstrated that seismic risk is significant in this area [3,4]. Successive earthquake sequences between 1992 and 1994 [5,6], the 2004 earthquake [7,8,9] and, more recently, the 2016 earthquake [10,11,12], have caused fatalities and significant damage. Moderate seismicity combined with a high vulnerability of existing buildings and local site effects were mainly believed to be the causes of the extensive damage. On a larger scale, the Mediterranean region is no stranger to earthquakes of moderate intensity, causing significant damage. On the 12 June 2017, an earthquake of Mw = 6.3 struck Lesvos Island, causing one human fatality and severe damage to the built environment [13]. An Mw = 6.4 earthquake hit the NW region of Albania on 26 November 2019, resulting in extensive damage to the civil structures in the broader area of Durrës city and its surroundings [14]. More recently, a severe earthquake hit Zagreb on 22 March 2020 (magnitude ML = 5.5). The event occurred during the COVID-19 lockdown and caused significant damage to the built environment and enormous disruption in everyday life [15].
Pre-emptive measures were eventually taken to reduce the damage. The introduction of a national seismic standard R.P.S. in 2002 [16] and its revision in 2011 [17] were one of the most important steps, along with multiple studies to estimate risk aiming to guide the decision making at the urban level. In the literature, several methods are suitable to solve this kind of problem on a large scale and can be categorized into three classes [18,19]: (i) Empirical methods, based on damage reports following earthquakes and building characteristics to estimate a seismic vulnerability index. These empirical methods were the only reasonable approaches that could be used in a large-scale seismic hazard analysis [20,21,22,23,24,25,26]; (ii) mechanical and analytical methods, which are more detailed but laborious for a large-scale study. They use slightly more detailed algorithms for vulnerability assessments, which allow more delicate and detailed studies [27,28,29,30]; (iii) hybrid methods, which can be particularly advantageous in the absence of damage data at certain levels of intensity for the geographical area considered and they also make it possible to adjust the analytical model. Furthermore, the use of observational data reduces the computational effort that would be required to produce a full set of analytical vulnerability curves [31,32].
In recent years, the use of the Georeferenced Information System (GIS) has gained momentum in civil engineering applications, especially in the field of risk assessment on a large scale. One cannot deny the increase in popularity of data collection for seismic vulnerability and risk assessment and some proposals have been developed to rapidly obtain a large amount of information processing images of wide sets of existing buildings. For instance, the Global Earthquake Model (GEM) has been developing an open global earthquake risk model [33]. These efforts have led to the development of a repository of probabilistic seismic hazard models, a global exposure dataset comprising structural and occupancy information regarding the residential, commercial, and industrial buildings, and a comprehensive set of fragility and vulnerability functions for the most common building classes. These components were used to estimate probabilistic earthquake risk globally using the OpenQuake Engine, an open-source software for seismic hazard and risk analysis [34,35].
In Morocco, the first adapted methods are the European macroseismic scale and vulnerability index methods [36,37,38]. These approaches are time consuming in gathering data, but they are easy to apply and show conclusive results. Other studies like the seismic index [39] tried to tackle the problem differently by adapting the Japanese Seismic Index Method, making it more time efficient and tuned to the context of Moroccan construction.
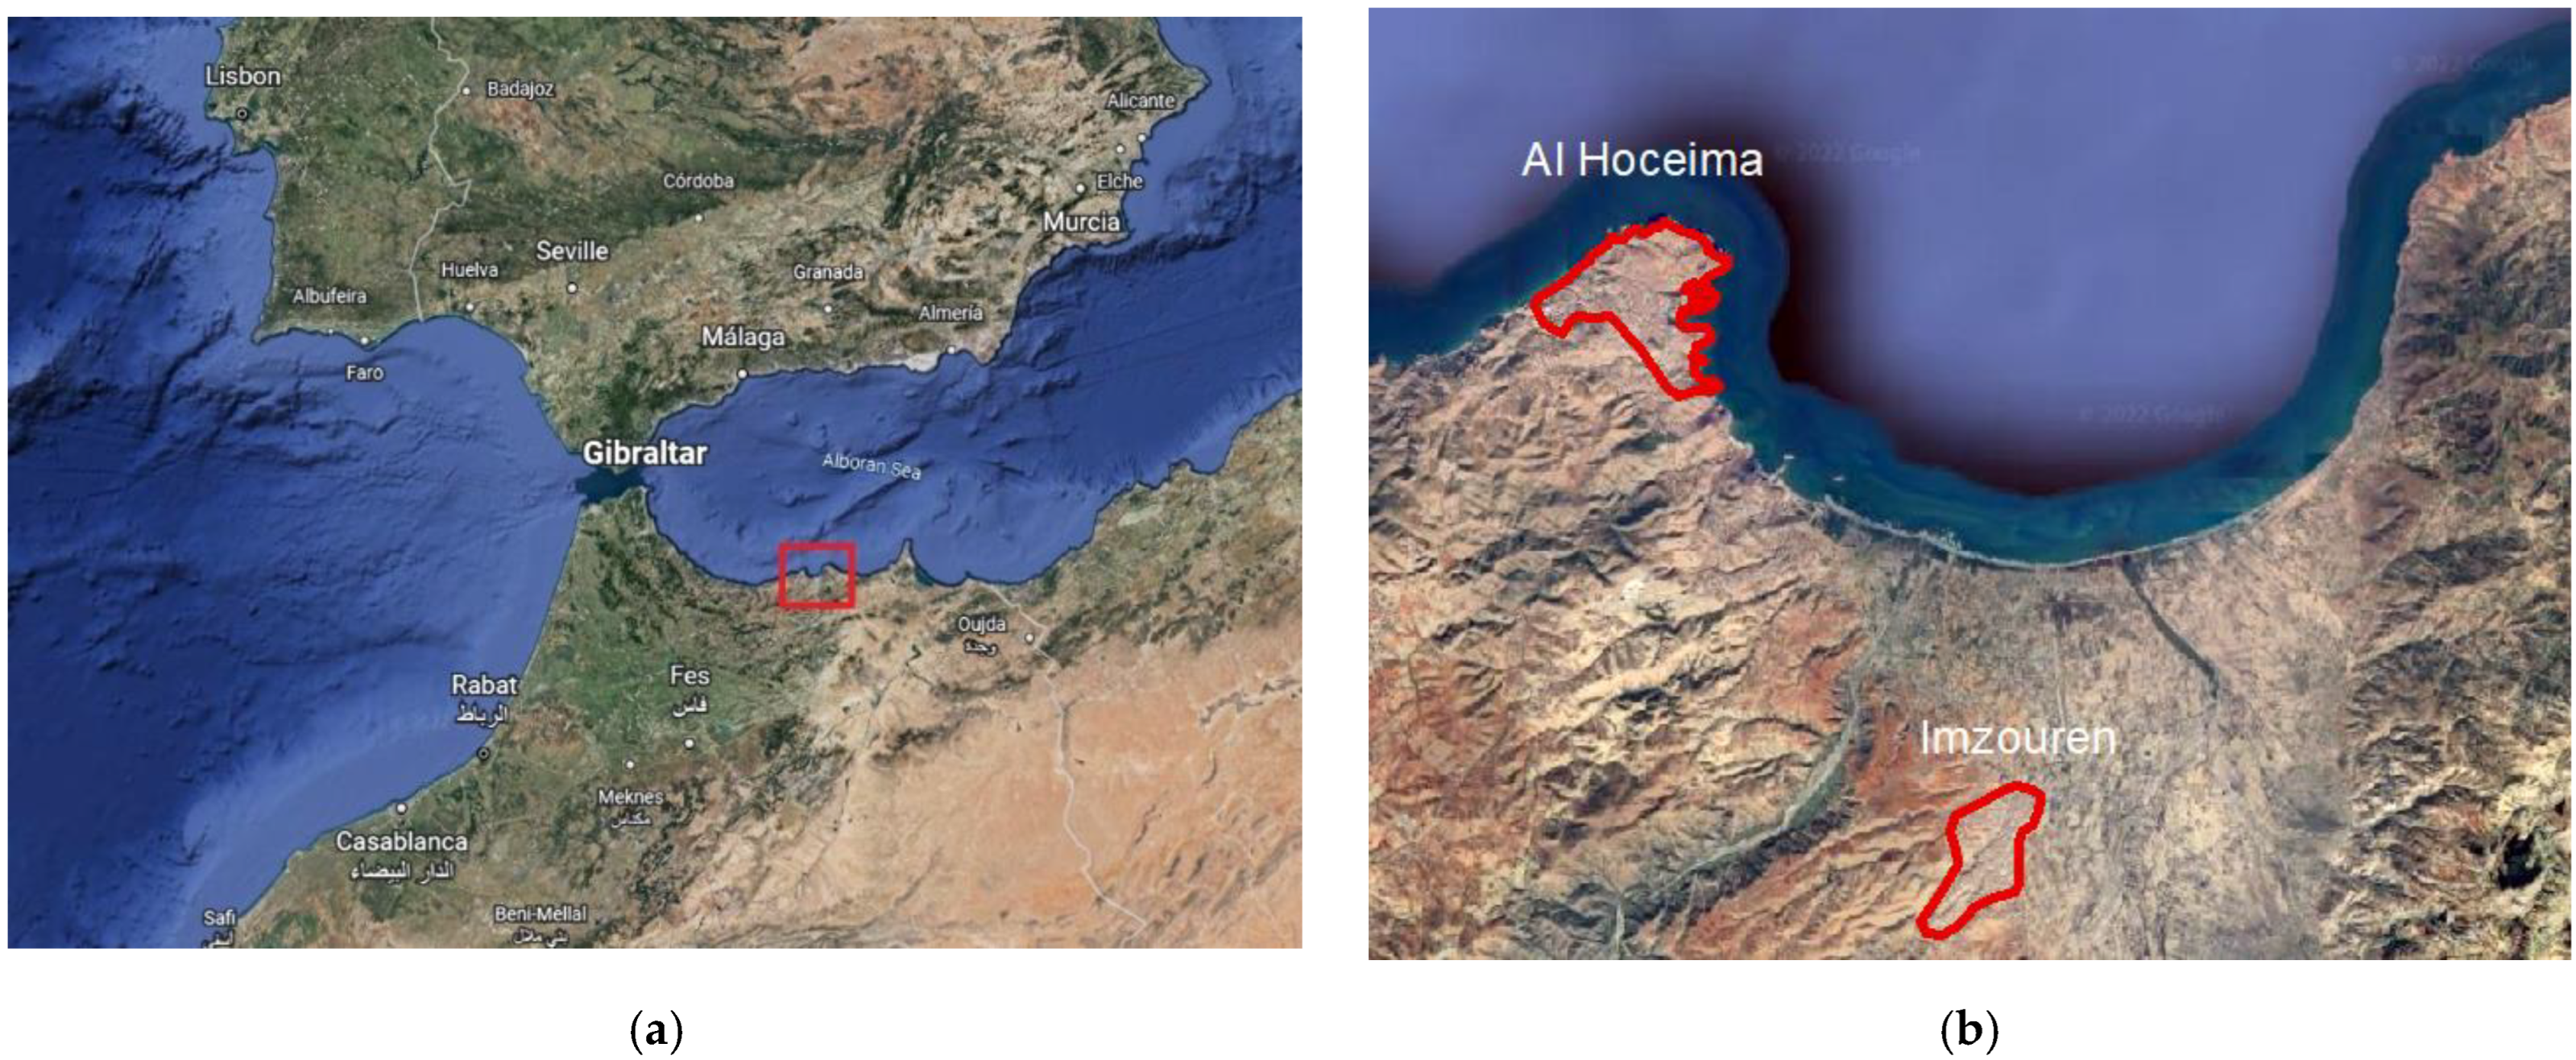
The present study follows the same strategy of estimating damage in the region by considering an advanced model to evaluate seismic risk in the cities of Al Hoceima and Imzouren. It is a predictive model obtained by applying the Capacity Spectrum Based Method (CSBM). The method considers four damage states in addition to a no-damage state [
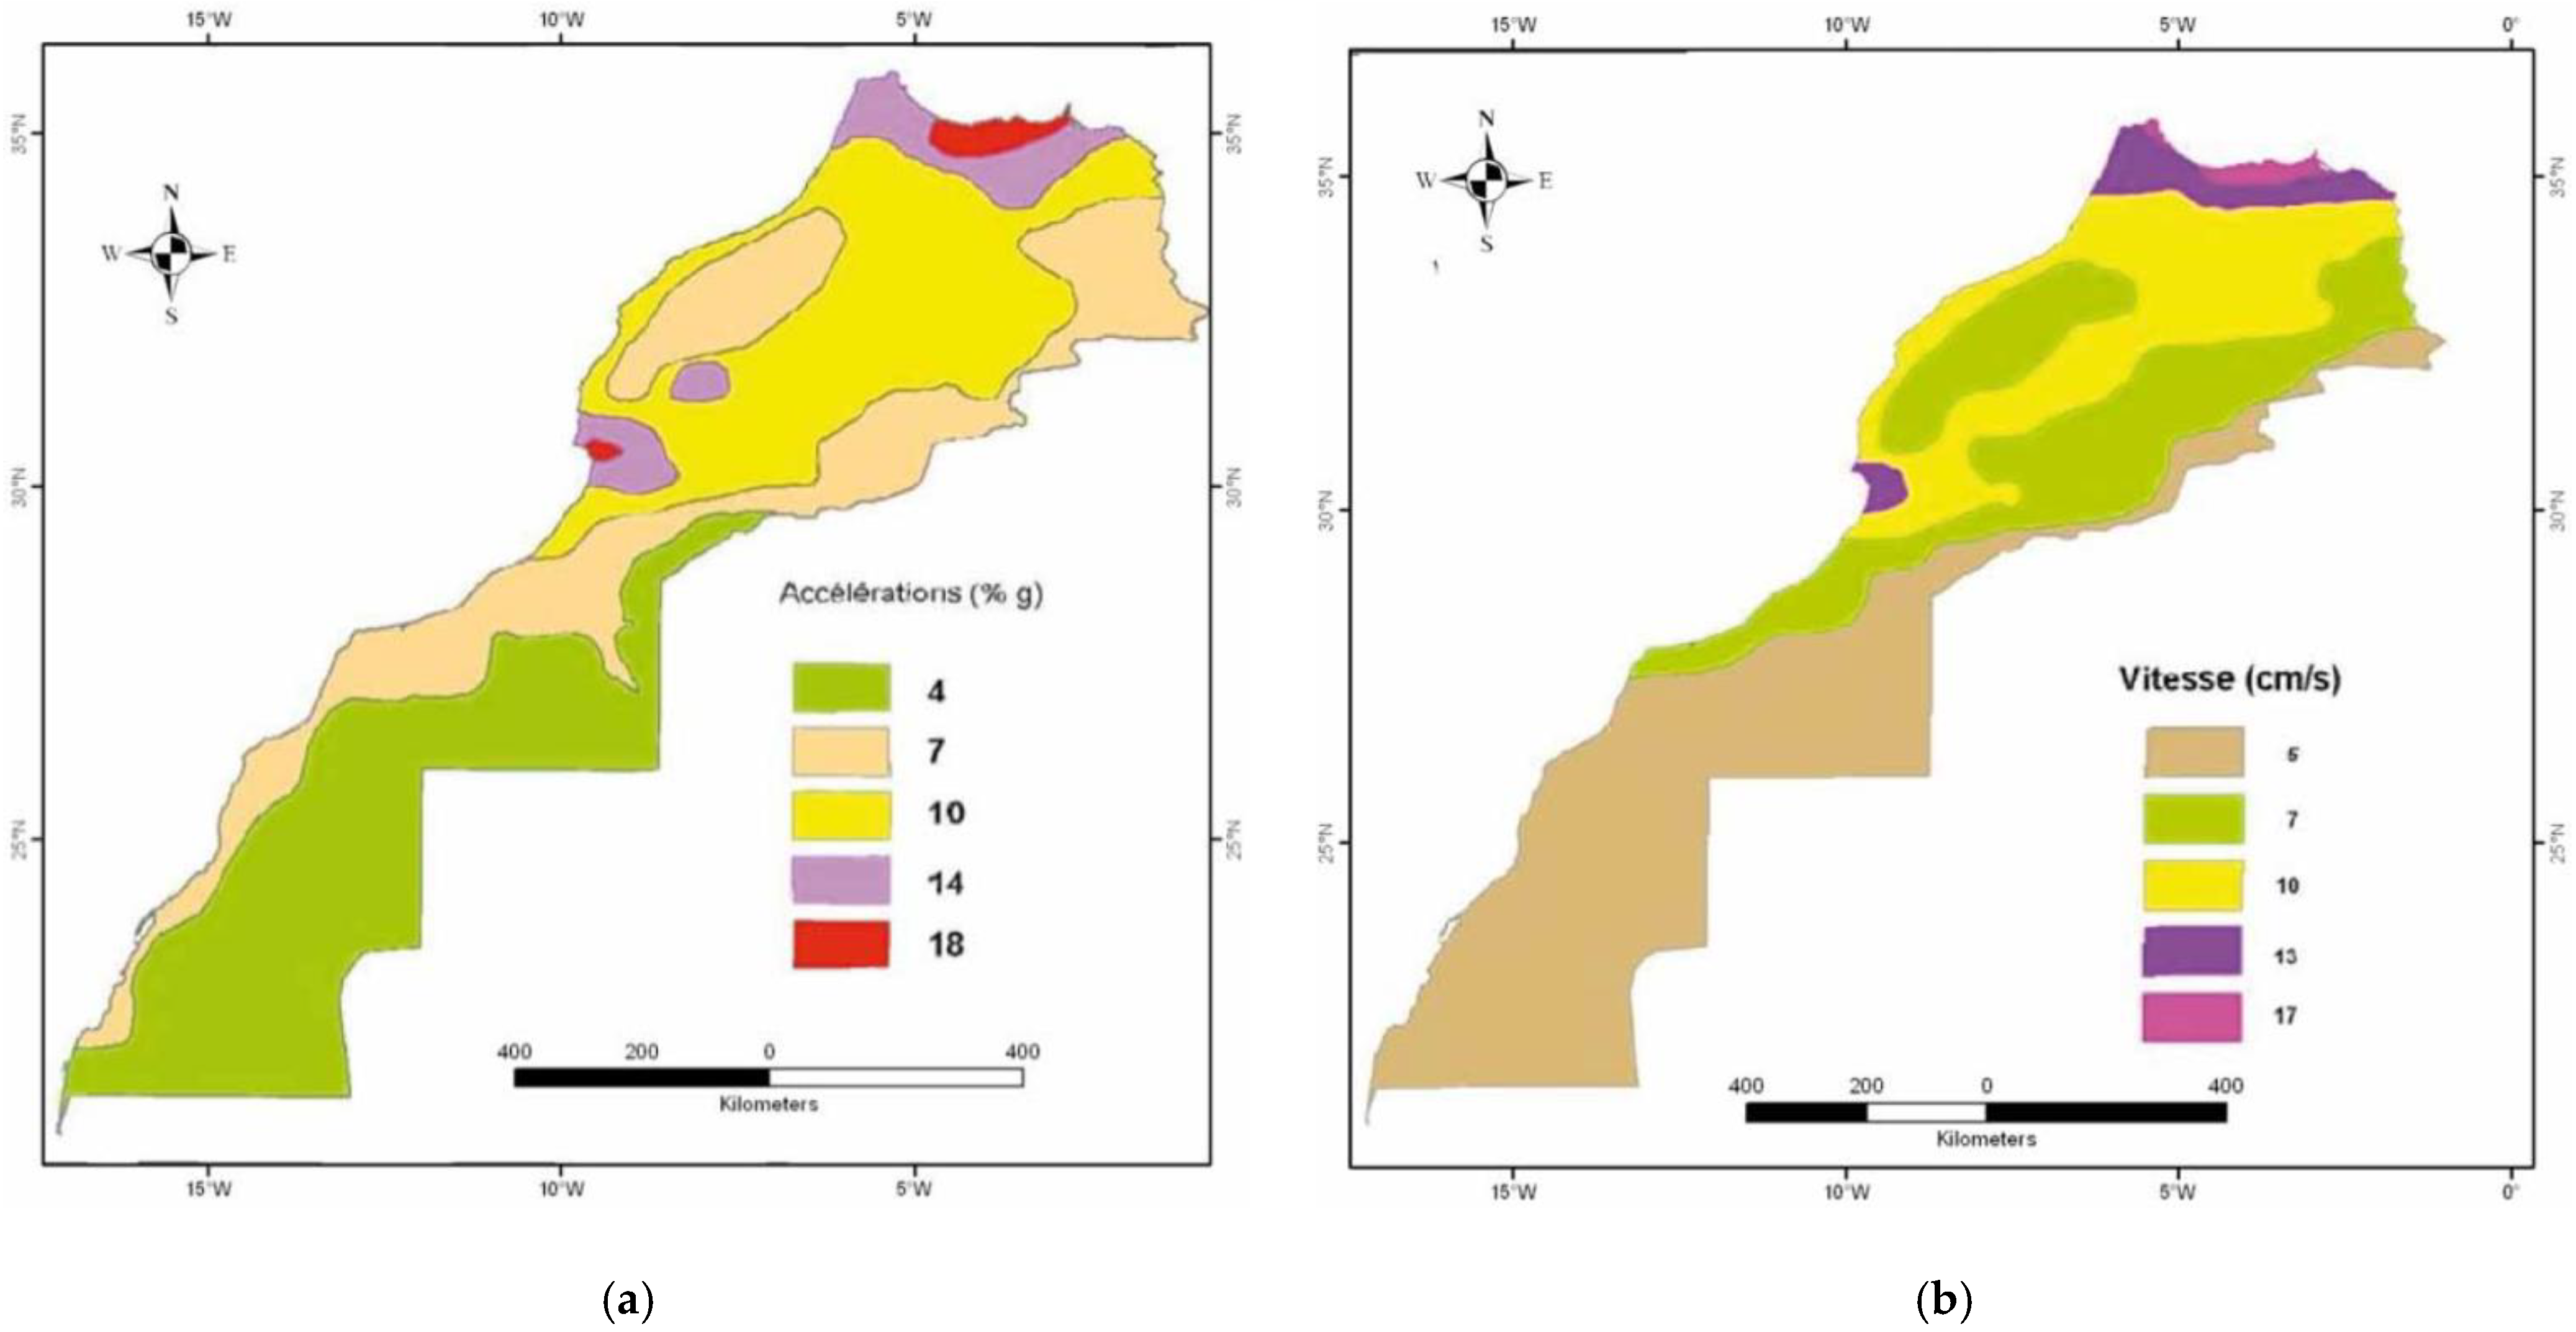
40]. Seismic action is defined in terms of response spectra and building vulnerability is evaluated through its capacity spectrum. A probabilistic seismic hazard scenario with a probability of exceedance of 10% in 50 years, in which soil effects are considered, is used herein.
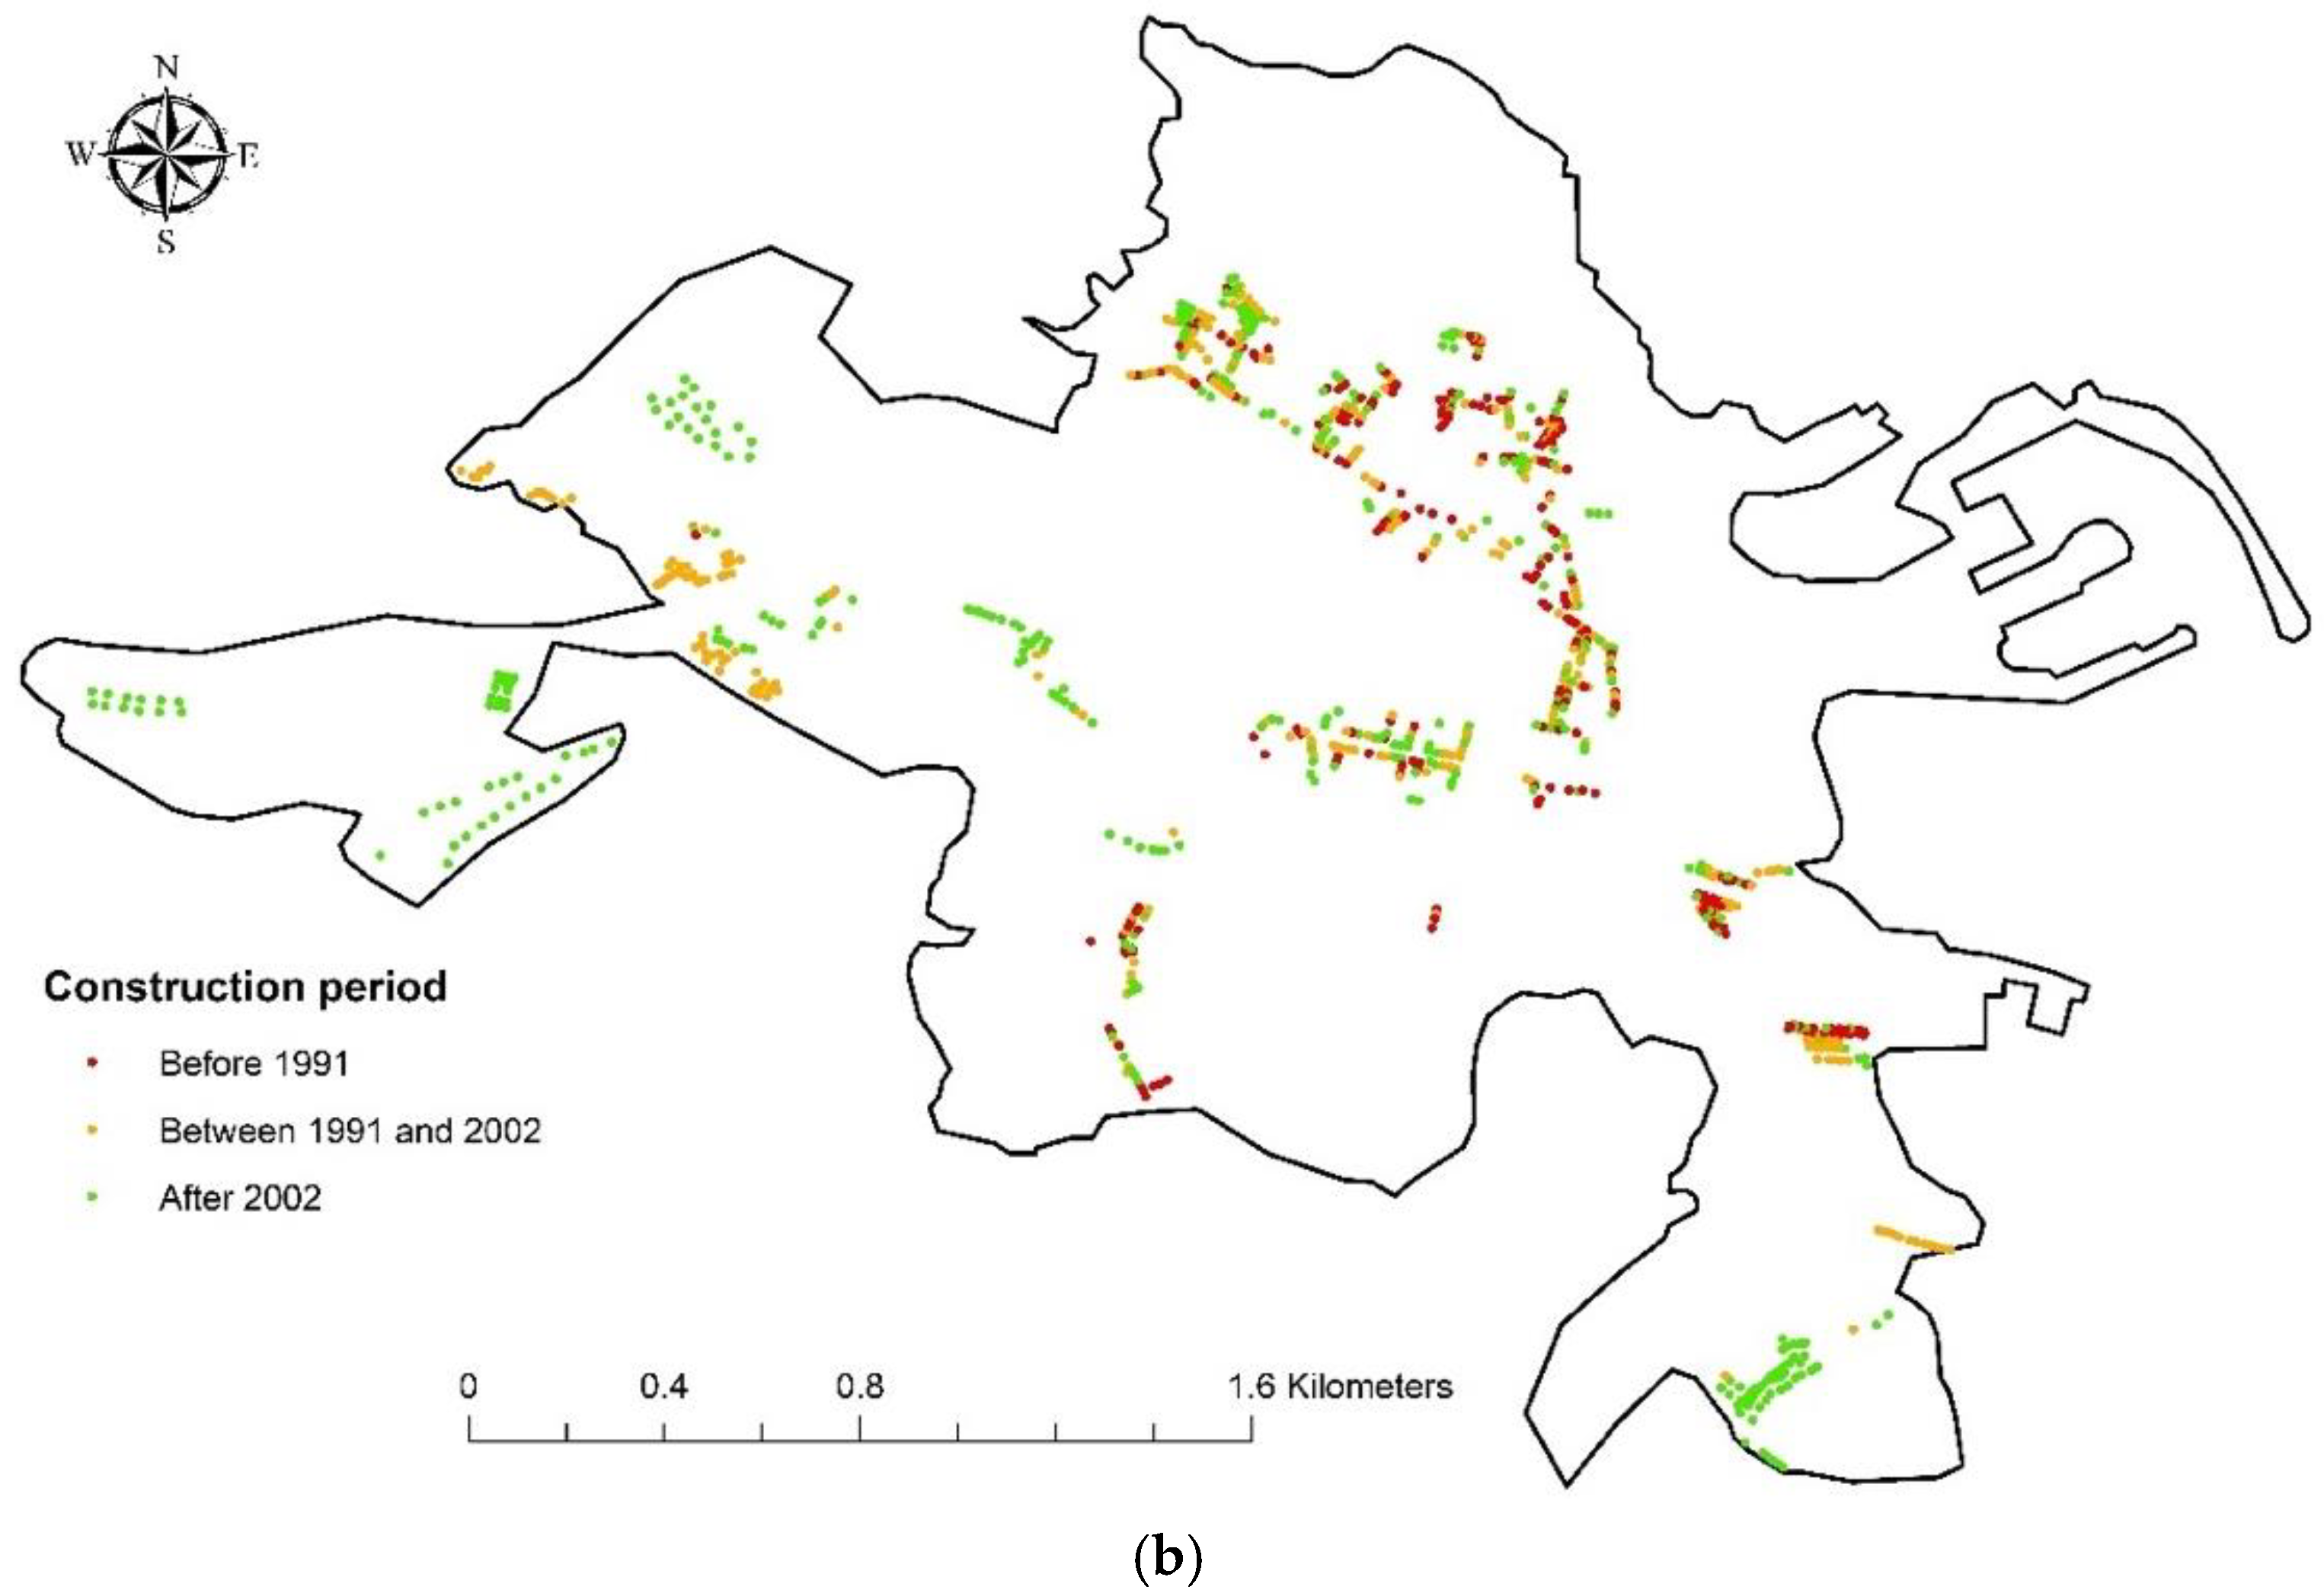
Capacity curves are developed from building models representative of the building typologies present in the study area. These models have been designed in previous studies based on a database gathered over the years [37,38,39]. Since 2014, information on existing buildings in the region has been collected, catalogued, and analyzed. The gathered information is based on field investigations, design and reinforced plans of some buildings, and information from consulting civil engineering offices working on residential buildings in the region.
The obtained results are stored and displayed in a GIS model where the predictive damage of buildings in both cities is spatially represented. The detailed risk maps obtained offer an excellent opportunity to guide the decision making in the field of seismic risk prevention, preparedness, and mitigation in the central Rif region. The study would also constitute the first step towards a newer and more reliable version of the national seismic standard R.P.S. [17].

2. Capacity Spectrum Based Method

The Capacity Spectrum Based Method (CSBM) [41] is a performance-based seismic analysis technique and may be used for a variety of purposes and on different scales. The approach can potentially be a time-efficient evaluation of a large inventory of buildings on a large scale, or on a smaller scale, an assessment of the seismic performance of a new or an existing structure to estimate its damage state. The CSBM was developed by Freeman to be a rapid evaluation procedure for assessing the seismic vulnerability of buildings at the Puget Sound Naval Shipyard [42]. The procedure compares the capacity of a structure with the demand of earthquake motion on the structure.
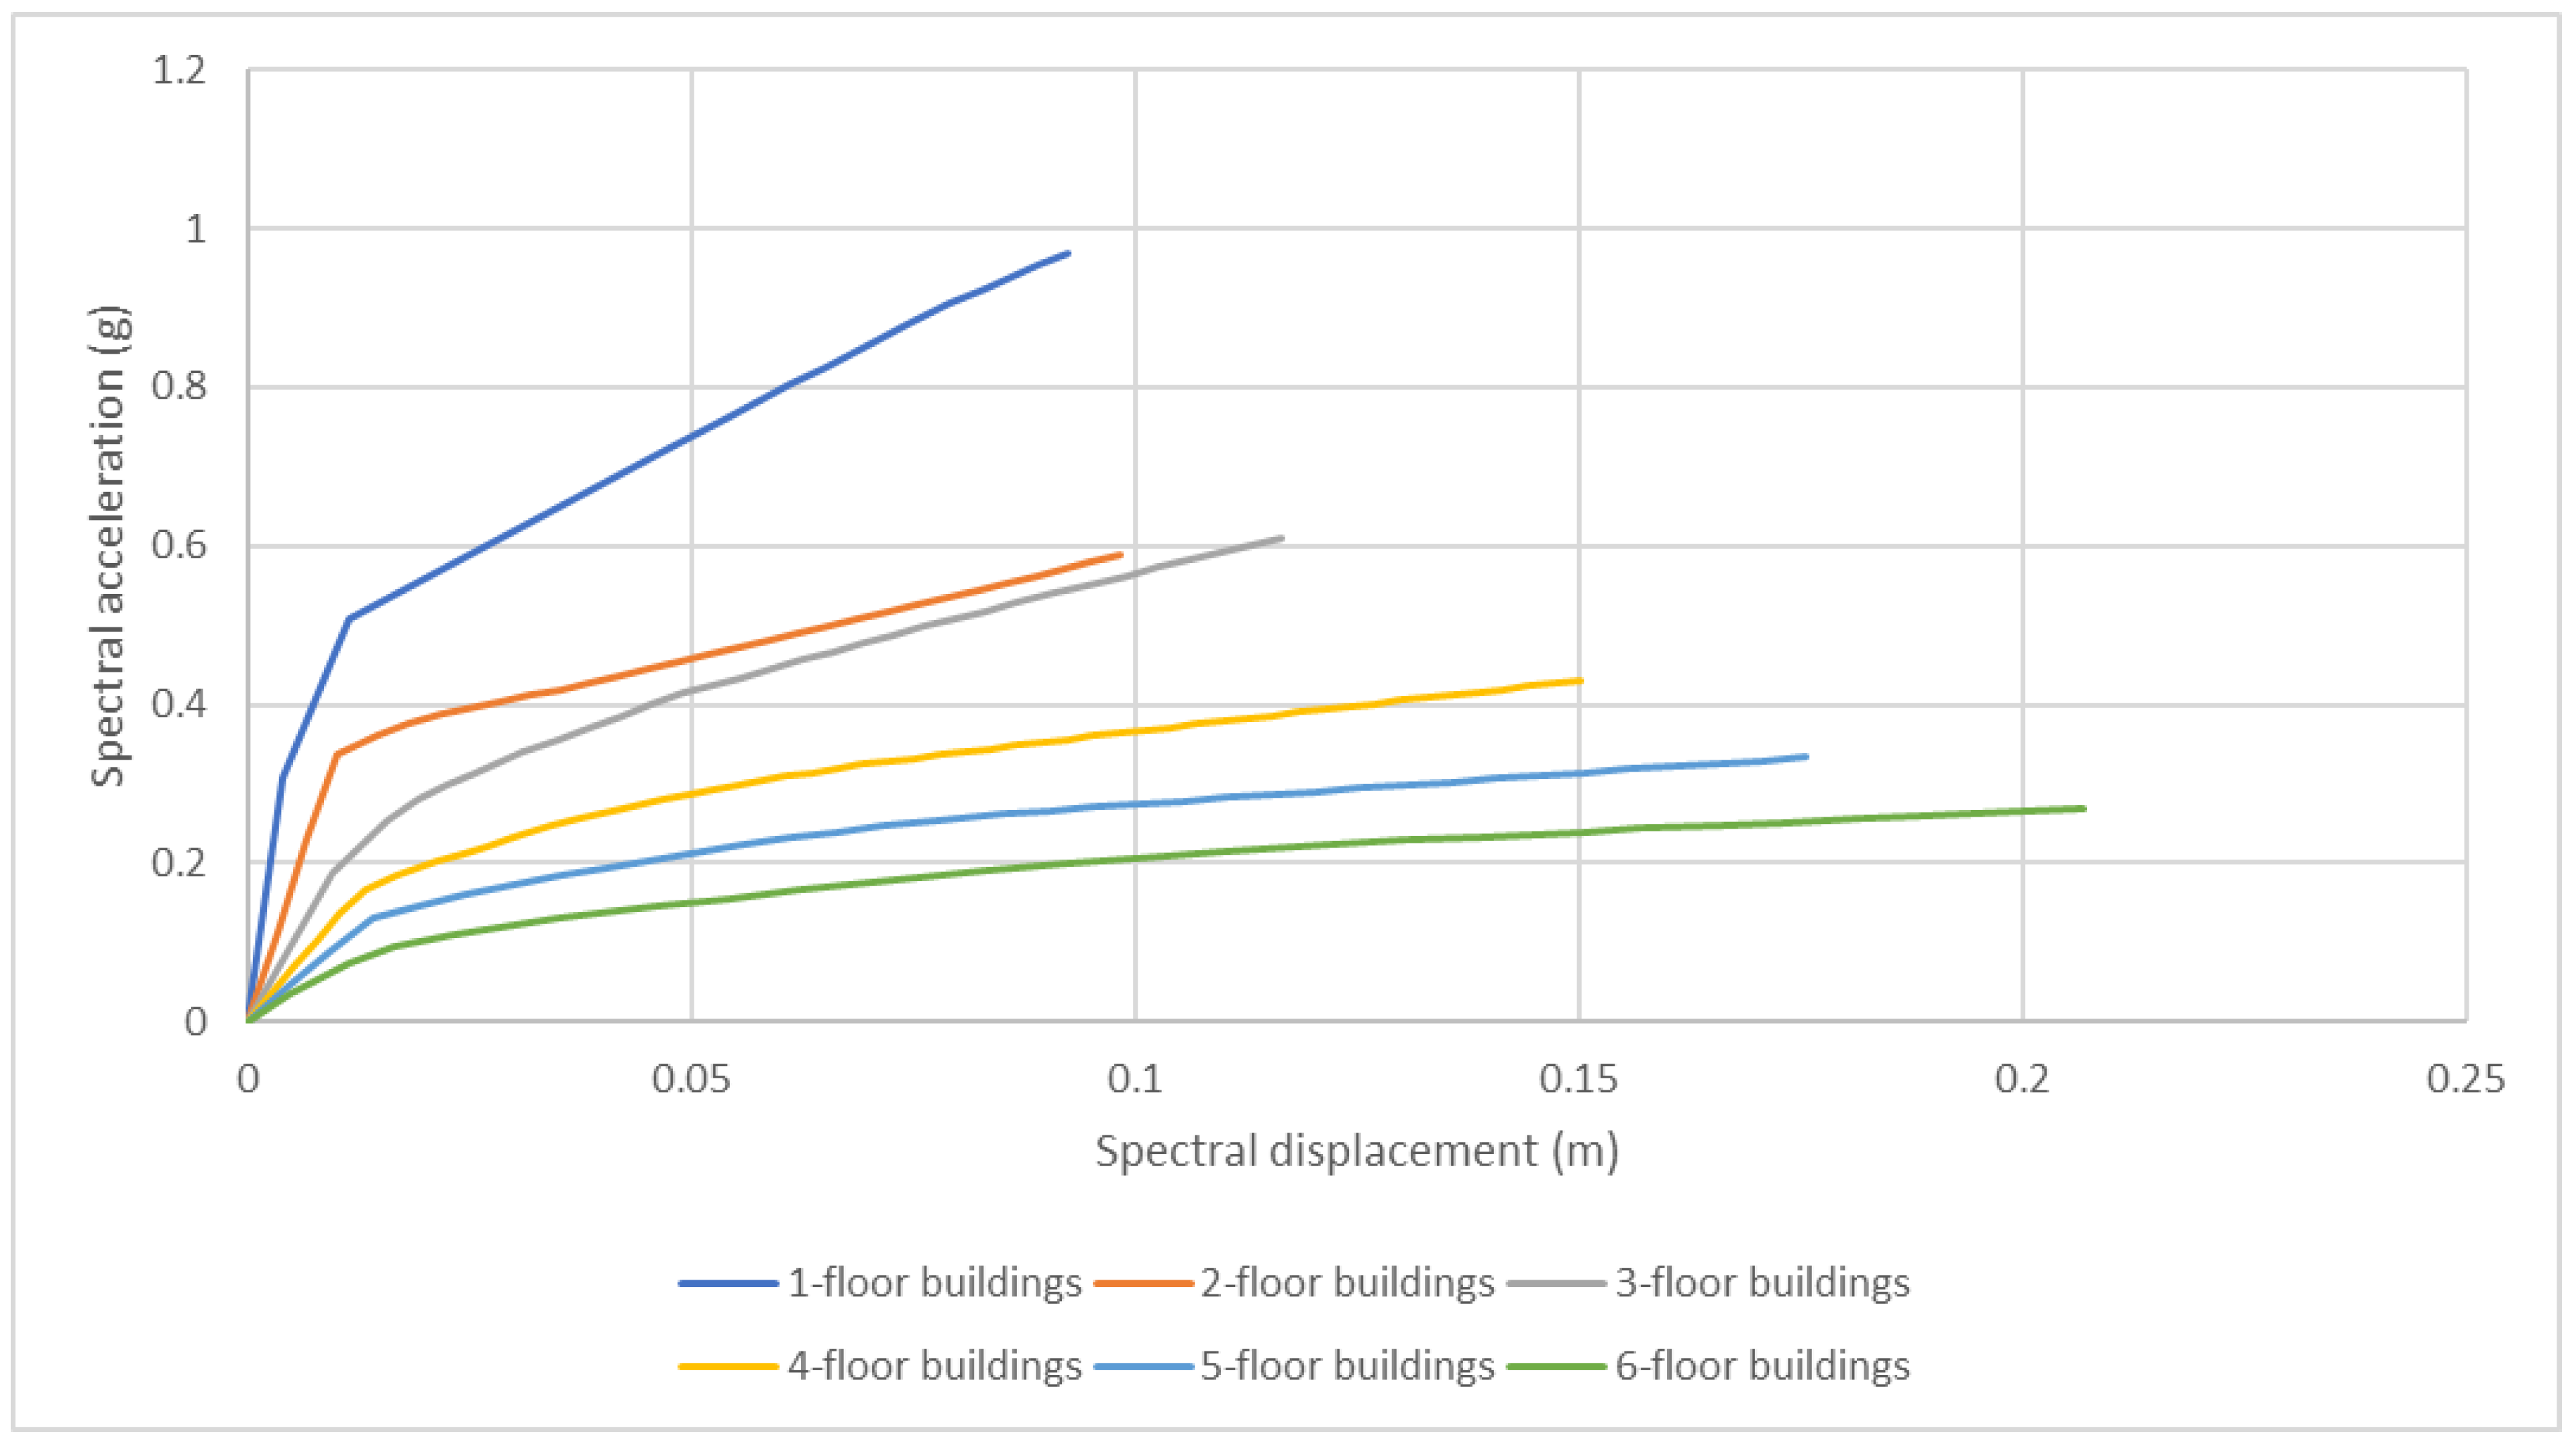
The capacity of the structure is represented in terms of a force-displacement curve obtained from a non-linear static (pushover) analysis. The shear force and roof displacement are converted to a spectral acceleration and spectral displacement of an equivalent Single Degree of Freedom (SDOF) system. The earthquake demand curve is represented by response spectra. An Acceleration/Displacement Response Spectrum (ADRS) format [43], where spectral accelerations are plotted against spectral displacements, is used. The graphical superposition of the two curves makes possible a visual evaluation of how the structure will perform under earthquake ground motion.
The CSBM considers five damage states: slight, moderate, severe, and complete, including the none damage state. For reinforced concrete buildings, these damage states have the same meaning as in HAZUS [44]. The only exception is the complete damage state, which is subdivided into two states: very heavy and destruction, as per the 1998 European Macroseismic Scale [45]. A weighted average damage index, D S m can be calculated as:
D S m = k = 0 4 k · P [ D S k ]
where k takes the values 0, 1, 2, 3, and 4 for the damage states k considered in the analysis and P [ D S k ] are the corresponding probabilities. It can be considered that D S m is close to the most likely damage state of the structure. The damage index D S m will be useful for representing and analyzing damage distributions by using a single parameter.
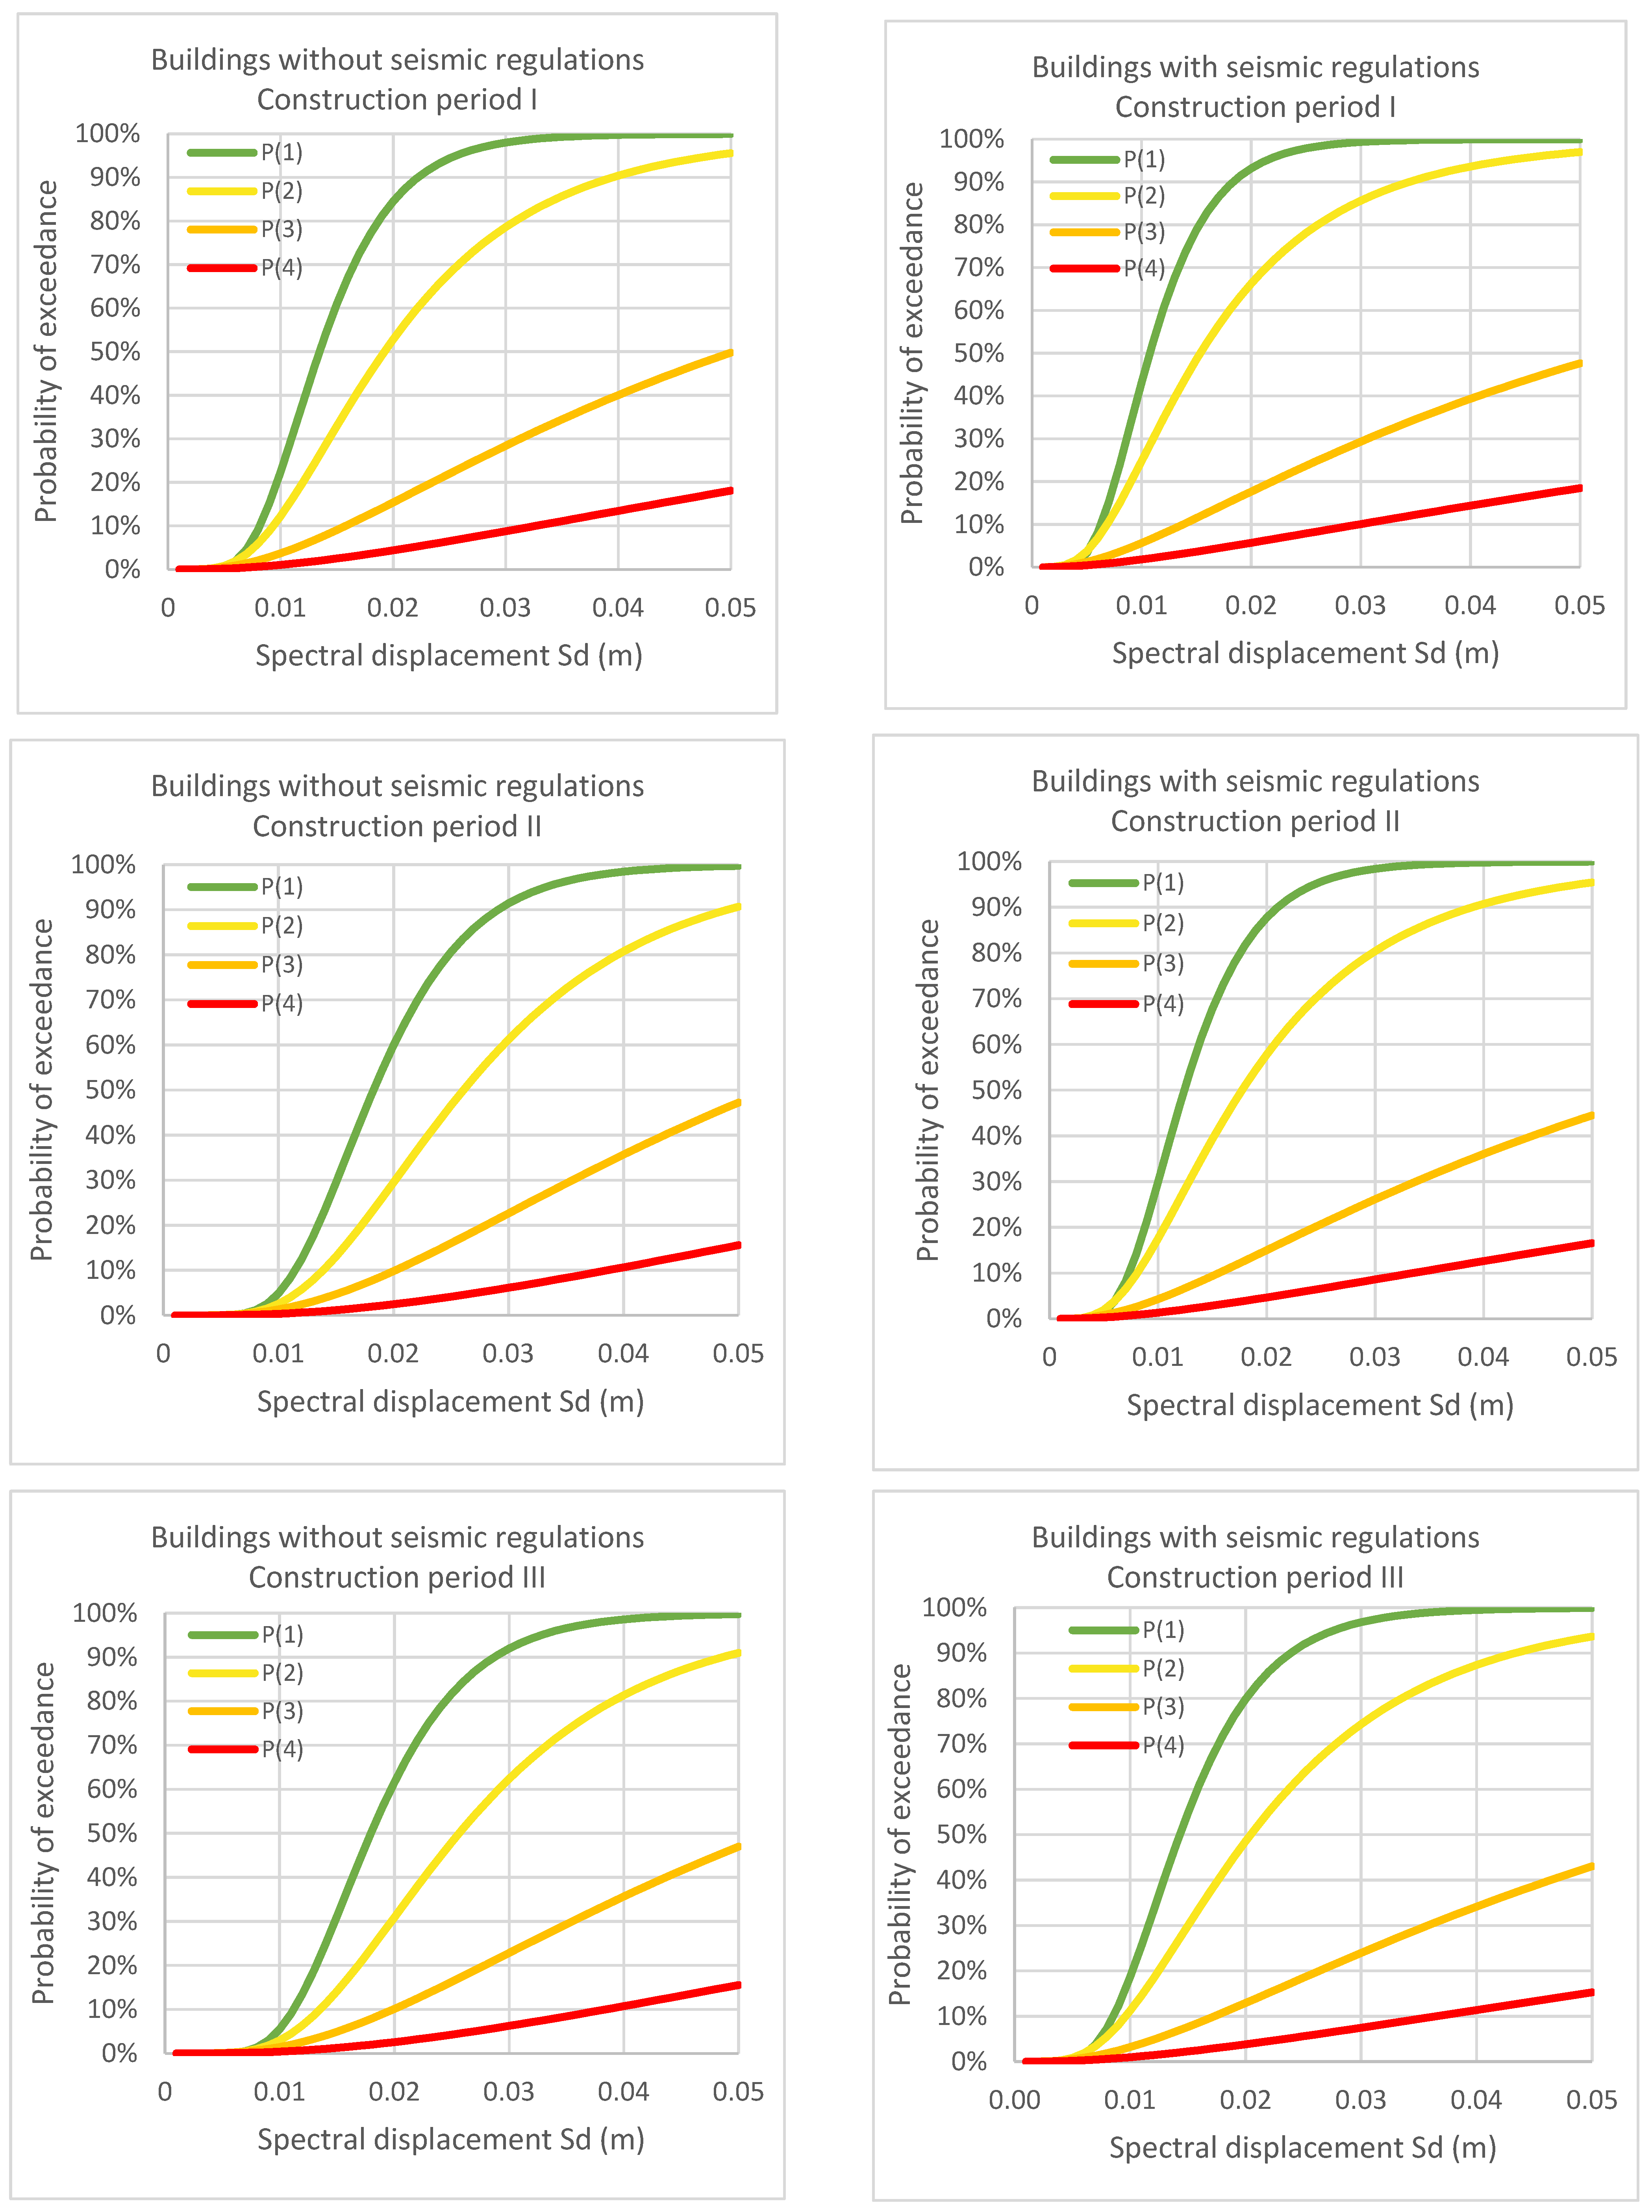
Fragility curves define the probability that the expected damage d of a structure exceeds a given damage state d s i , as a function of a parameter quantifying the severity of the seismic action. In this study, the quantifying parameter is the spectral displacement S d . It is usually assumed that fragility curves are well described by the following lognormal probability density function:
P [ d s i S d ] = ϕ [ 1 β d s i ln ( S d S d ¯ d s i ) ]
where S d ¯ d s i is the threshold spectral displacement at which the probability of the damage state d s i is 50%, β d s i is the standard deviation of the natural logarithm of this spectral displacement, ϕ is the standard cumulative distribution function, and S d is the spectral displacement.
Capacity spectra are approximated with bilinear curves using FEMA 273 guidelines [46]. Table 1 shows how the thresholds S d ¯ d s i are obtained as a function of the yield displacement D y and the ultimate displacement D u of the structure. Concerning β d s , it is well known that the expected seismic damage in buildings follows a binomial probability distribution [45]. β d s is calculated directly as a function of ultimate ductility μ u [40] and is displayed in Table 1.

3. Description of the Study Area

3.1. Seismicity in the Cities of Al Hoceima and Imzouren

The north region of Morocco is the most seismic area of the country. In recent decades, the region has experienced several earthquakes, some very violent, as was the case of the 1994 (MW = 6.0) and 2004 (MW = 6.4) earthquakes [47]. Recently, a 6.3 magnitude earthquake struck 50 km off the coast of Al Hoceima on Monday, January 26th 2016 [10,11,12] causing property damage. The central Rif area, in particular, has been affected by several recent seismic episodes, which proves the high level of seismicity of this zone [48,49,50]. This issue has been the subject of multiple studies related to seismology, seismic hazard, and seismic vulnerability [37,38,39,51,52].
Al Hoceima (35°25′ N, 3°93′ W) and Imzouren (35°09′ N, 3°52′ W) are cities located on the northern coast of Morocco, both in the same province (Figure 1). Being at the heart of the Rif chain, they have been subject to many seismic episodes. As a reminder, the earthquake of 24 February 2004 caused 629 deaths, 966 injuries, 2539 households damaged or destroyed, and left 15,600 people homeless. The difference in observed damage following the same earthquake was significant. Even though Imzouren and Al Hoceima are equidistant from the epicenter, Imzouren was damaged the most. It was reported that the damage differences were linked to the nature of the soil and construction quality [7]. While it is almost impossible to check the quality of construction for existing buildings, according to Cherif et al. [39], the nature of soil definitely played a role in the damage differences observed.
As previously stated, several studies have targeted the two cities given the consecutive seismic episodes, population growth, and the significant vulnerability of existing structures, especially those recently built due to rural exodus. The probability of significant damage due to earthquakes will only grow because of these factors.

3.2. Seismic Hazard

The seismic hazard is defined in terms of 5% damped elastic response spectra from a probabilistic point of view corresponding to a 475-year return period. Two response spectra are proposed: a response spectrum taken from the national seismic code [17] and another based on Eurocode 8 [53], considering local parameters. The second scenario is considered, because building conception and construction in Morocco are still profoundly influenced by European construction standards. To this day, the French construction code, BAEL91 [54], and the Eurocode are still considered in our construction practices.
RPS2000 does not contain specific site response spectra and shows many limitations in terms of the typology of the structures and their regularity. Any building project outside of those limitations would require a complementary study following the Eurocode 8. Thus, an additional probabilistic scenario has been considered: Moroccan seismic parameters used in the basic representation of the seismic action in Eurocode 8.
The national seismic standard [17] introduces two seismic zoning maps, one in terms of acceleration and the other in terms of velocity. Both maps contain five seismic zones (Figure 2), in which acceleration values range between 0.04 g and 0.18 g and seismic velocity from 5 cm/s to 17 cm/s. The expected elastic response spectrum S e ( T ) is defined in Table 2. Five soil types are considered: S1 rocky ground, S2 firm ground, S3 loose soil, S4 soft soil, and S5 special-case soil. The corresponding shear-wave velocity ranges are displayed in Table 3. According to Eurocode 8, two types of spectra are proposed: Type 1 and Type 2. Since the Rif region, where Imzouren and Al Hoceima are located, is subjected to moderate seismic activity, Type 2 response spectrum seems to be the most suitable option.
For each town, two response spectra are proposed (one for each soil type). The first is based on the RPS2000 and the second on Eurocode 8. For rocky soil, the RPS assigns the same acceleration value of 0.18 g to the towns of Imzouren and Al Hoceima. For the second spectrum, and in keeping up with the most recent works, acceleration values are based on a conducted study on risk analysis by the RMSI (Risk Management Solutions Inc.) in 2012 [55], which provides the following a g results:
  • Al Hoceima: a peak ground acceleration of 0.253 g for a return period of 475 years;
  • Imzouren: a peak ground acceleration of 0.303 g for a return period of 475 years.
Figure 3 shows the obtained 5% damped elastic response spectra on rocky soil. As we can see, the RPS response spectrum is relatively flat compared with the two other spectra, which decreases the amplification values for the short return periods but dampens the decline effect of the accelerations values the more the return period increases.
As for the other types of soil, Table 3 shows that both seismic standards introduce the same soil classification. Figure 4 and Figure 5 show soil distribution in the towns of Al Hoceima and Imzouren, respectively. The soil type will undoubtedly come into play in the evaluation of seismic risk between the two cities. The structures of Al Hoceima are mostly built on firm or rocky ground, while the structures of Imzouren are mostly built on relatively soft soils. All of the response spectra for each soil type are shown in Figure 6.

3.3. Building Typologies

Urban communes within the central Rif area are modern twentieth-century establishments. According to the most recent census [2], the modern Moroccan house is the dominant building typology, see Figure 7. It is usually a low- to mid-rise structure with a reinforced concrete moment frame. The existing constructions in Al Hoceima and Imzouren are no exception and have similar features. Most of the buildings are regular in geometry and do not exceed six stories (Figure 8). They also have relatively small construction surfaces, ranging between 100 m2 and 150 m2 [39].
The used structural models that allowed us to generate capacity and fragility curves have been obtained by considering the constructive peculiarities of the existing reinforced concrete buildings. Detailed information on their design has been obtained through years of collecting, georeferencing, arranging, classifying, and improving the database of existing buildings in both cities [37,38]. The database collection initially started with a preliminary survey in the cities to determine the best method for assessing the seismic performance of existing buildings. In addition to that, building design and conception, obtained from design offices working in the study area, helped us generate 3D building models designed according to the existent structural typologies [39].
The inspection focused mainly on residential buildings spread across the two cities representing the different districts and typologies. A total number of 2746 existing buildings between the two cities was considered (Figure 9 and Figure 10). Information like the structural system, position, number of floors, observed irregularities, etc., were stored in a GIS database. The following observations highlighted the existence of several similarities, which made it possible to classify the buildings according to a reduced number of typologies:
  • Most buildings are reinforced concrete moment frame structures;
  • Low-rise structures built on relatively small surfaces (100–150 m2);
  • Most buildings are regular structures having simple geometrical shapes.
A total of 2746 buildings were inspected and classified into 36 typologies according to three factors: seismic code, construction period, and the number of floors. Each typology is represented by a 3D building model that can be used for a suitable and convenient illustration of these structures.

4. Results and Discussion

4.1. Structural Capacity of the Buildings in Al Hoceima and Imzouren

The 36 building models are designed to represent a large part of the existing residential buildings in the urban municipalities of the central Rif. The observations collected as a result of the field investigations, the analysis of the reinforced concrete plans, and the consultations carried out with the design offices are all aspects considered in the development of the models. Even construction practices, often prioritizing the cost of building materials over build quality, were included in the analysis. The seismic performance of a building, represented in this study by a building model, can be characterized by its capacity spectrum obtained by means of a pushover analysis [57]. This capacity spectrum is usually modeled in its simplified bilinear form defined by the yielding (Dy, Ay) and ultimate capacity points (Du, Au).
As stated before, seismic code, construction period, and the number of stories are the main factors contemplated in the 36 building models. All existent buildings in the target area are low- to mid-rise constructions, so the considered number of floors ranges between one and six stories. Constructions were built with different types of materials (steel and concrete) depending on the construction period. Thus, three different construction periods are considered: before 1991, between 1991 and 2002, and after 2002 [39]. The third and final factor is the seismic code and there is only one national seismic code (RPS 2000), introduced in 2002 and revised in 2011. Buildings respecting the seismic code are designed to support seismic loads and they are projected essentially in the cross-sectional area of the columns, giving more strength to vertical structural elements.
The floor area of the built models has a rectangular shape and is equal to 12 m by 10 m. The structural nature of the models is an RC frame since this is the structural system that is most frequently found in residential dwellings. Particular emphasis was given to the vertical structural elements because of their importance in resisting horizontal loads. The cross-sectional area of the vertical structural element and the disposition of steel rebar for the adopted 3D models were calculated similarly to the ones accomplished by design offices. The following mechanical properties have been assumed: concrete compression strength is equal to 16 MPa or 22 MPa and steel yield stress is equal to 235 MPa, 400 MPa, or 500 MPa, depending on the construction period (Table 4). Constructions were built with different types of materials (steel and concrete) depending on the period of construction. For instance, Fe E 235 steel rebar was commonly used before 1991, while Fe E 500 was more frequently used after the 2000s. In addition, concrete compression strength is taken equal to 22 MPa for buildings with seismic code (after RPS2000) and 16 MPa (before RPS2000) for those without seismic code. This assumption, of course, is only a proxy for real strength values. However, these two values (16 MPa and 22 MPa) are target values for both the construction company and the client. Any value below would not respect regulations and the values above would lead to unnecessary additional costs [39].
Based on the results of this study, the longest fundamental period is equal to 0.74 s, found at the level of the highest buildings (six floors for our case). The existing buildings, like their corresponding models, are regular. We can therefore assume that the response of structures is represented by their fundamental mode of vibration. This makes pushover analysis, despite its limitations, suitable for assessing seismic risk scenarios in the towns of Al Hoceima and Imzouren.
For a developing country like Morocco, savings on construction materials is important and is of great concern to construction companies, to the point of altering and penalizing the behavior of structures. One example would be the cross-sectional area of columns, which can change from one story to another if the load is theoretically supported, which can potentially compromise the performance of the building due to weak linking. Even more, it could indirectly increase the price since the connection of the nodes is more complex, requiring skilled labor and taking more time to complete.
Considering these construction practices, the following models have been proposed [39]. The designed structures have a rectangular shape and a 12   m × 10   m surface (Figure 11). The construction area of most residential buildings in the study area varies between 100 m2 and 150 m2. Taking a surface of 120 m2 is suitable and convenient for the representation of the inspected buildings. The structural nature of the models is an RC frame since it is the main type found in residential dwellings. Table 5 and Table 6 show the cross-sectional area and disposition of steel rebar for the adopted 3D models. The loading and sizing calculations are carried out in a similar manner to that accomplished by design offices. Each building model was subjected to a static non-linear pushover analysis in the weakest direction in order to obtain the base shear versus roof displacement curves [57].
Capacity curves were generated and allowed us to obtain capacity spectra, as can be shown in an example in Figure 12. One can clearly see from the results that the spectral displacement increases while the spectral acceleration decreases as the height of the building increases, as one would expect. The curves only represent six models, but the rest of the models show a similar pattern. Subsequently, the capacity spectra were approximated to bilinear curves using the FEMA 273 guidelines [46]. The set of points representing the yield limit and the ultimate limit of the 36 models is shown in Table A1 and Table A2 (Appendix A).

4.2. Fragility Curves and Damage Index for the Buildings of Al Hoceima and Imzouren

Fragility curves of the building models were obtained after having calculated the S d ¯ i and β i parameters used in Equations (2) and (3). The complete results of the listed parameters are given in Table A3. As an example of buildings of the same height, we chose to display the fragility curves of four-story RC building models in Figure 13. We notice no significant difference in spectral displacements between buildings that comply with the seismic regulations and those that do not. This difference is mainly reflected at the level of spectral accelerations, as can be seen in Table A1 and Table A2. However, there is a noticeable change in terms of the construction period; newly constructed buildings perform slightly better than older buildings in terms of spectral displacement. These results show the high vulnerability of the buildings in the target area. Even in the case of a moderate seismic event, the damage probability is significant.
Fragility curves enable us to estimate the seismic performance of the structure for a given spectral displacement. Therefore, it is important to determine a spectral displacement indicative of the most probable performance of the structure in the event of a seismic event. The spectral displacement resulting from the performance point is exactly the desired parameter, derived from the intersection between the capacity spectrum and the response spectrum as previously indicated. Table A4 represents said displacements for the probabilistic scenarios considered in the study.
The damage probability matrices are then generated from the limit damage states S d ¯ i with i = 1 to 4, presented above in Table A3, and the performance points are given in Table A4. For some cases, performance points could not be computed because of the relatively high RPS acceleration values in the higher fundamental period range (Figure 3).
Then, the weighted average damage index D S m is calculated, which is used to represent the damage distribution using one parameter only (Table A5). The values of the damage index generate some expected results. In fact, the buildings respecting the seismic code have a better performance and the newly built structures also perform better. The highest damage index values are mostly for structures built on soft soils S4. There are also significant differences when we compare the results of the probabilistic scenarios (RPS and Eurocode 8). According to the first scenario, the higher the rise of the building the more the damage increase. This increase is more significant for loose and soft soils. For the second scenario, the values are more balanced with respect to the elevation of the structure. In addition, we note that on average, the D S m values of the RPS scenario are a little higher than those from the Eurocode 8 scenario.

4.3. Probabilistic Risk Scenarios

Damage distribution according to probabilistic risk scenarios in Al Hoceima and Imzouren is discussed in this section. The average damage indices D S m calculated in the previous section will be represented for each of the 2746 buildings targeted in this study. The results are shown in Figure 14 for the town of Al Hoceima and in Figure 15 for Imzouren. The average value of the damage index in Al Hoceima is equal to 2.05 and 1.78 according to the RPS and Eurocode 8 scenarios, respectively, which corresponds to a “moderate” damage state. The damage index in the town of Imzouren is equal to 2.77 and 2.75 according to the RPS and Eurocode 8 risk scenarios, which corresponds to a “heavy” damage state.
The distribution of damage in the city of Al Hoceima and Imzouren is quite similar to the results found in previous studies [37,38,39]. The disparity of results in Al Hoceima comes mainly from the vulnerability of the structures. The seismic hazard uniformly affects the whole city and site effects are minimal since the soil is mostly of S1 or S2 types. Buildings with high vulnerabilities are structures that have been built without considering seismic regulations, often having three or four stories. These structures are being built on the outskirts of Al Hoceima, indicating that it is generally linked to the rural exodus. There are also old vulnerable structures located randomly in the city center, which have not been reinforced since the 2004 earthquake. As for the town of Imzouren, the distribution of damage is more linked to the type of soil. We can clearly see that the distribution of damage follows the pattern of soil typology shown in Figure 5. The buildings with the highest damage indices are structures that do not respect the seismic code and are built on loose soils.
In terms of risk scenarios, the damage in the city of Al Hoceima for the RPS2000 scenario is more significant than the one obtained for Eurocode 8. In Imzouren, the damage values are more spread out according to the first scenario, ranging from 1.61 to 3.76, compared with the values of the Eurocode 8 scenario, which are between 1.94 and 3.25. According to the first scenario, the percentage of buildings having a “collapse” damage state is equal to 25% of the buildings inspected, all built on S4 soft soils. These results call into question the reliability of the spectrum taken from the national seismic code [17], which, as the conclusions of this study suggest, should be reviewed. The Eurocode 8 risk scenario results are closer to the results and observations reported by Cherif et al. [37,38,39] for these two cities.

5. Final Remarks

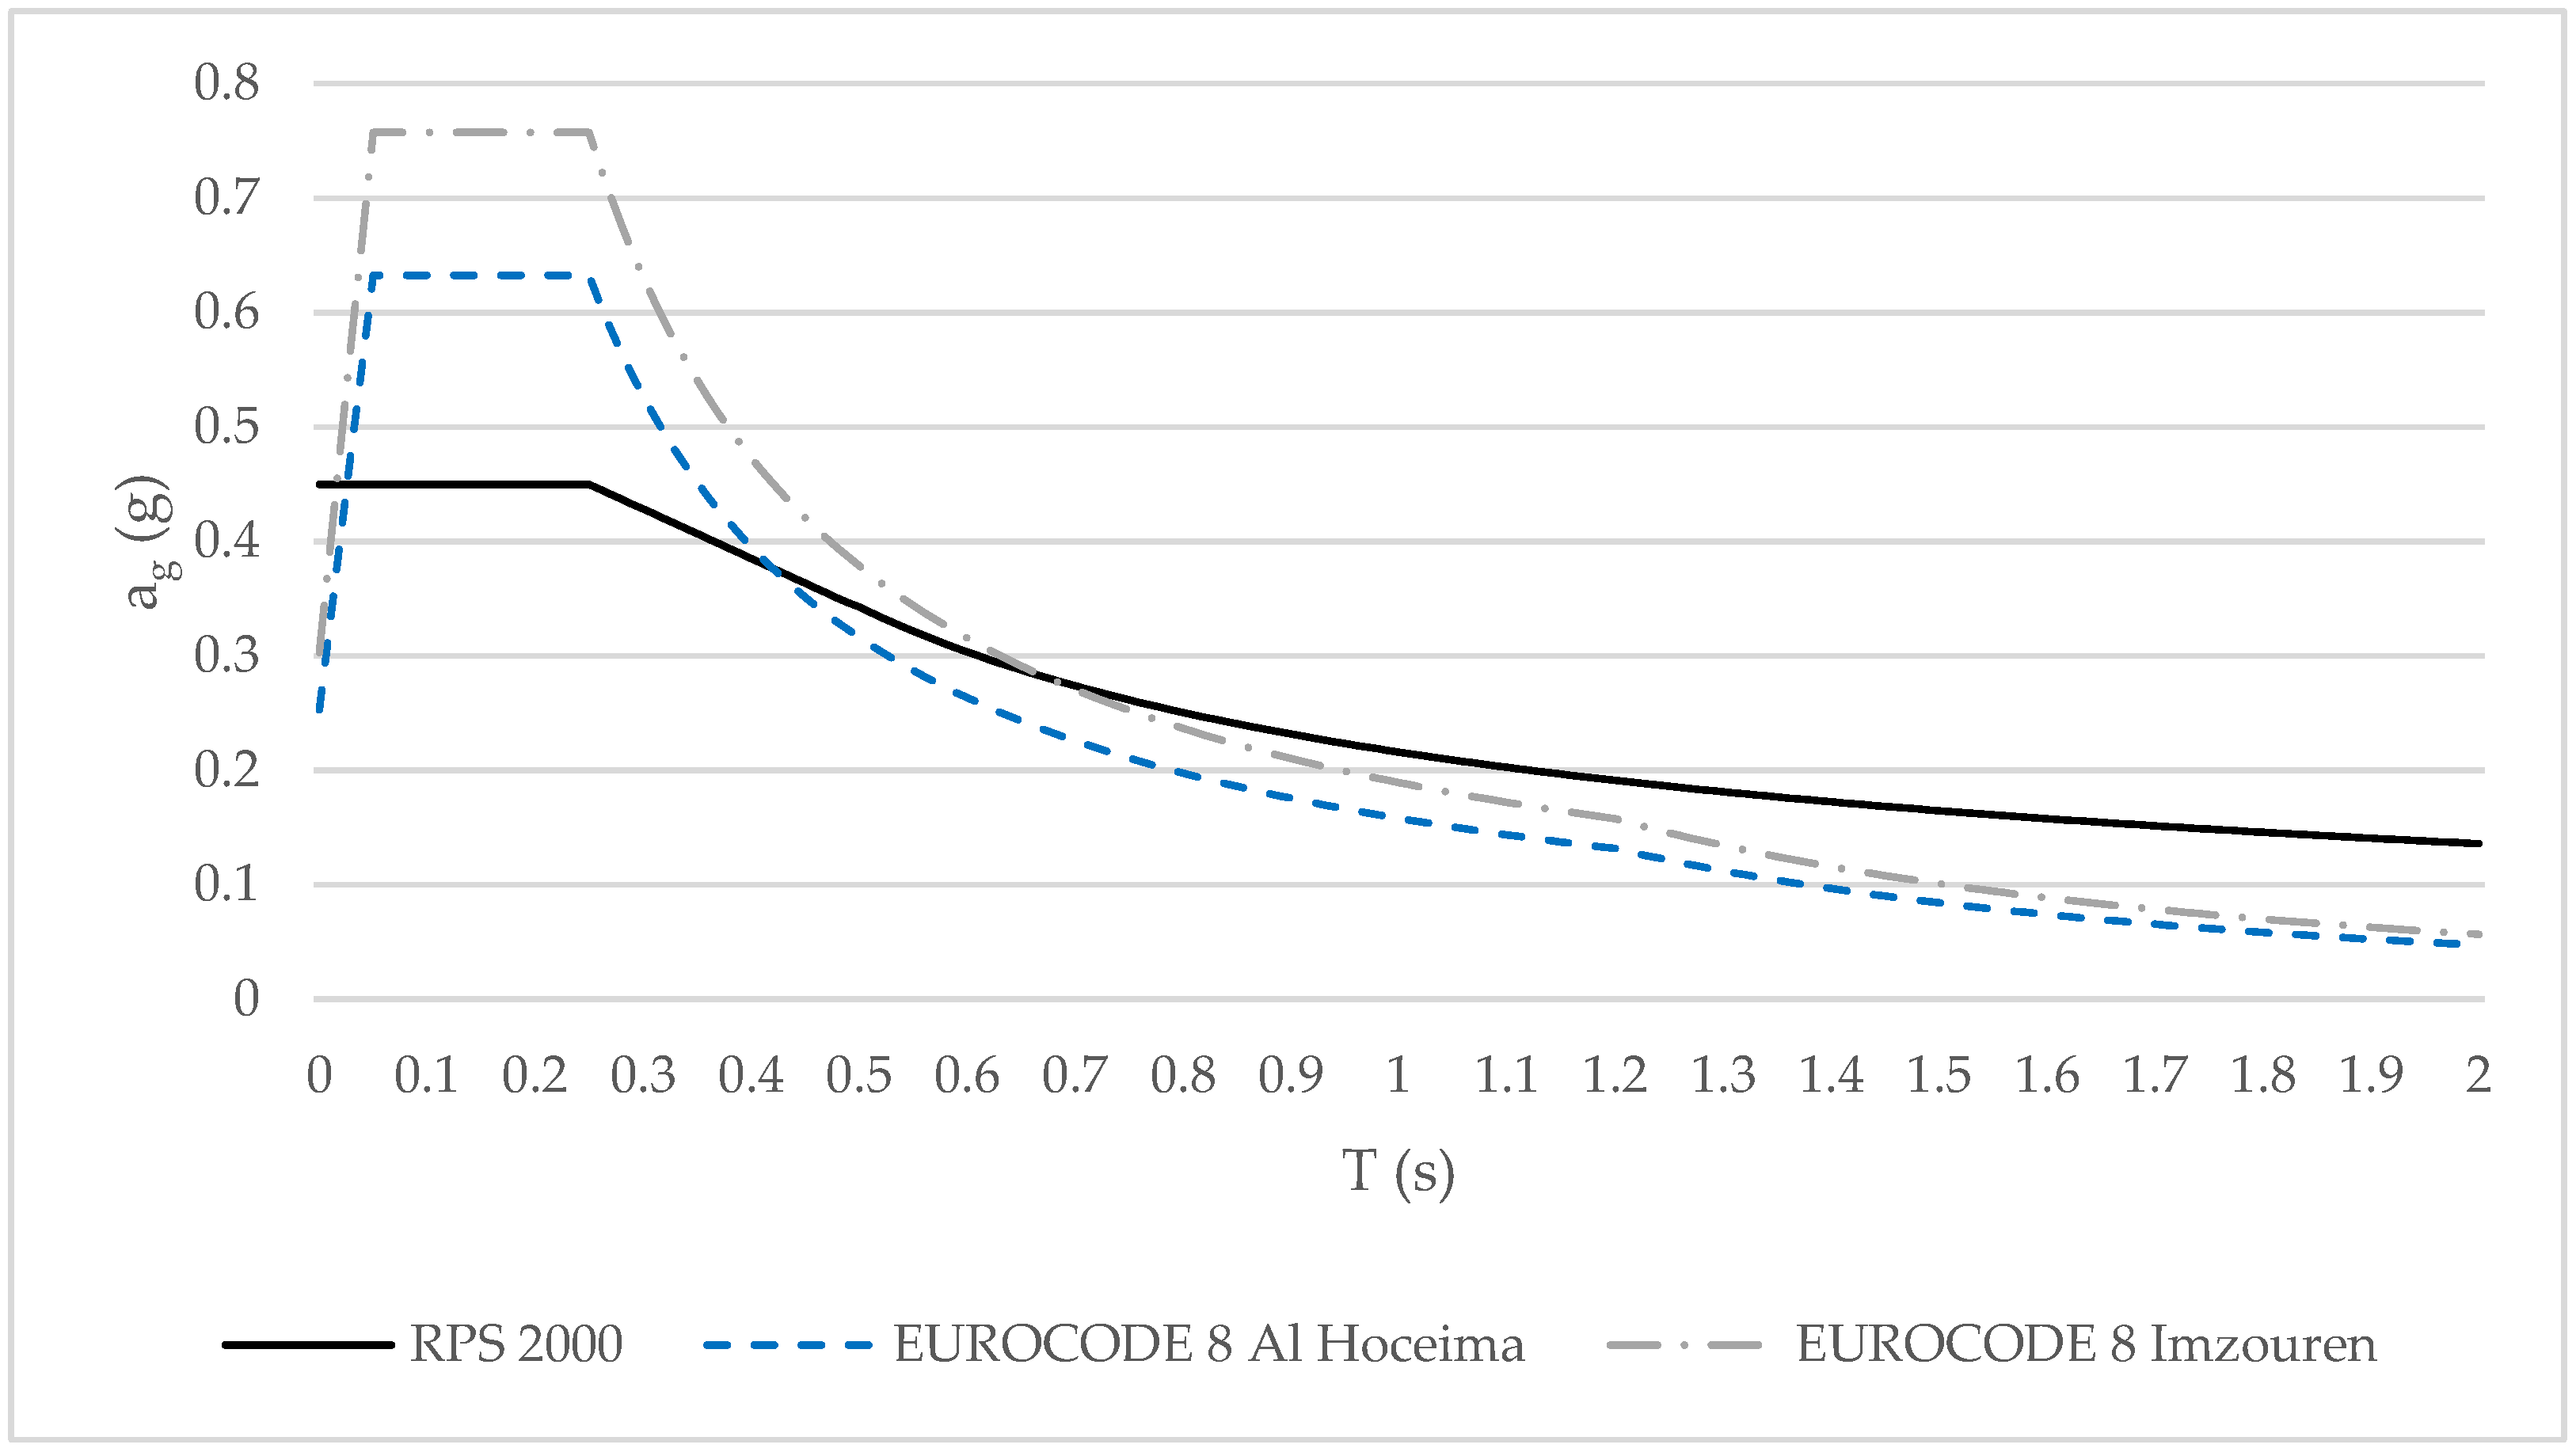
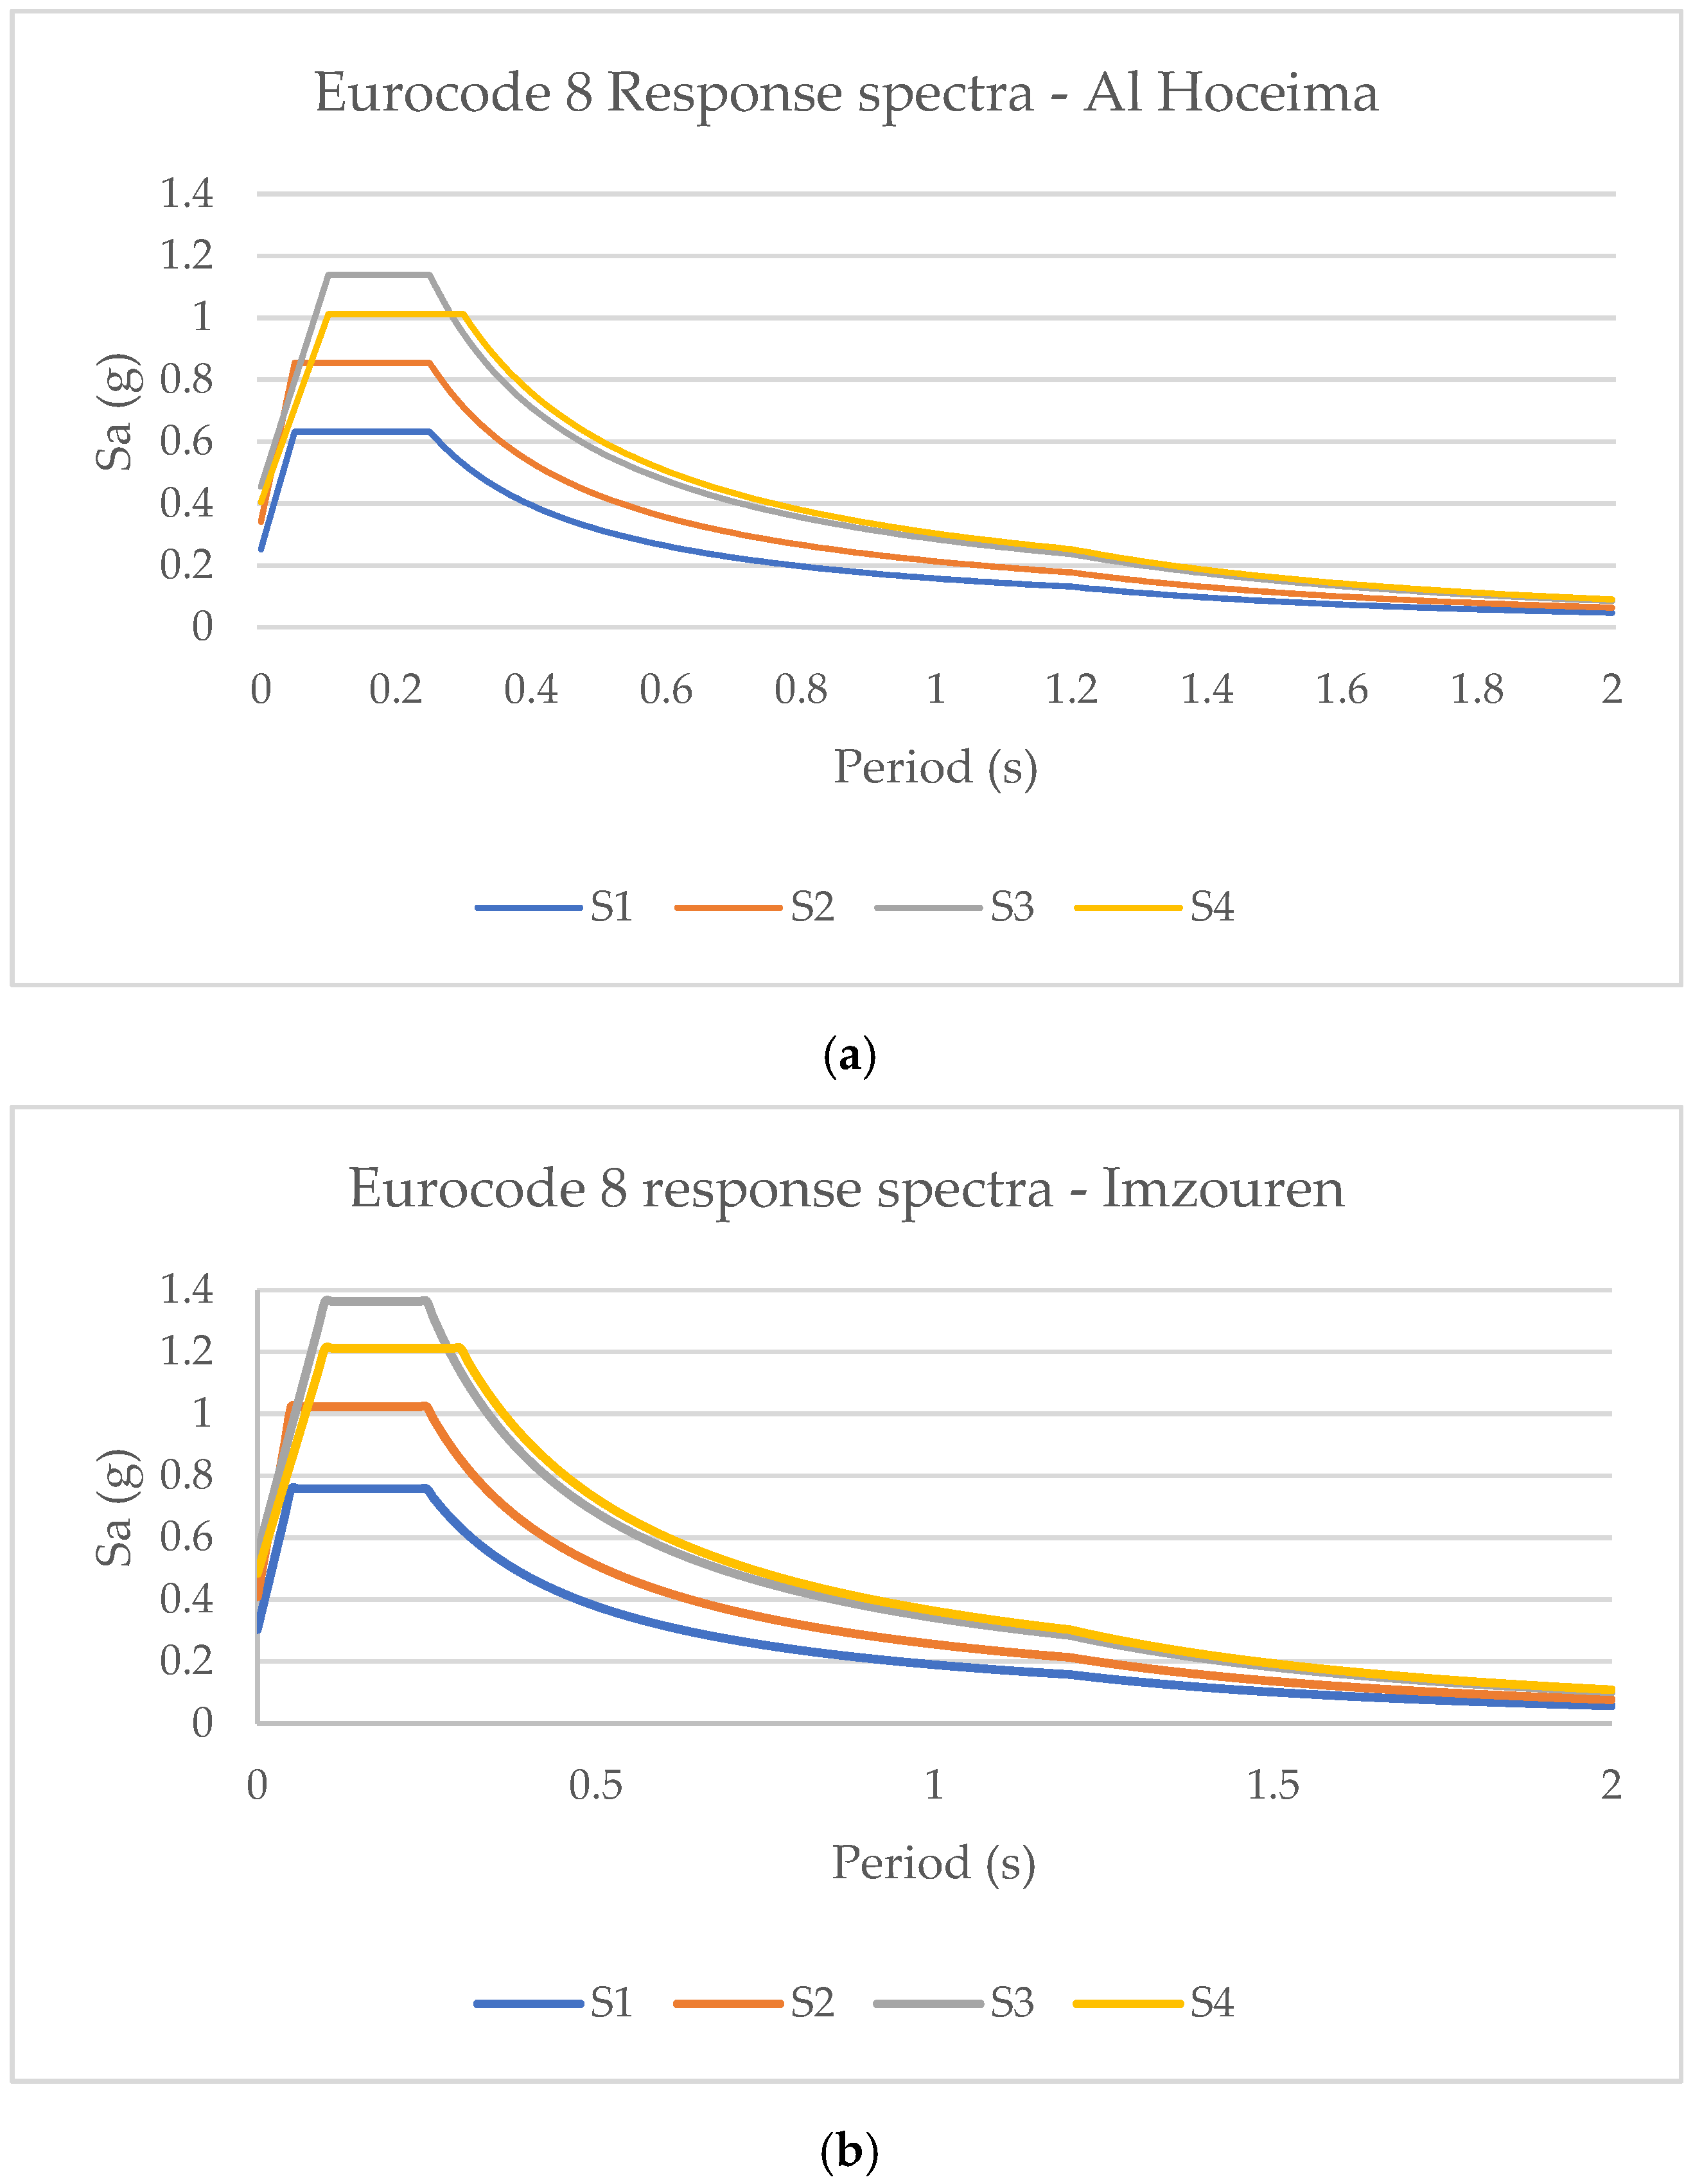
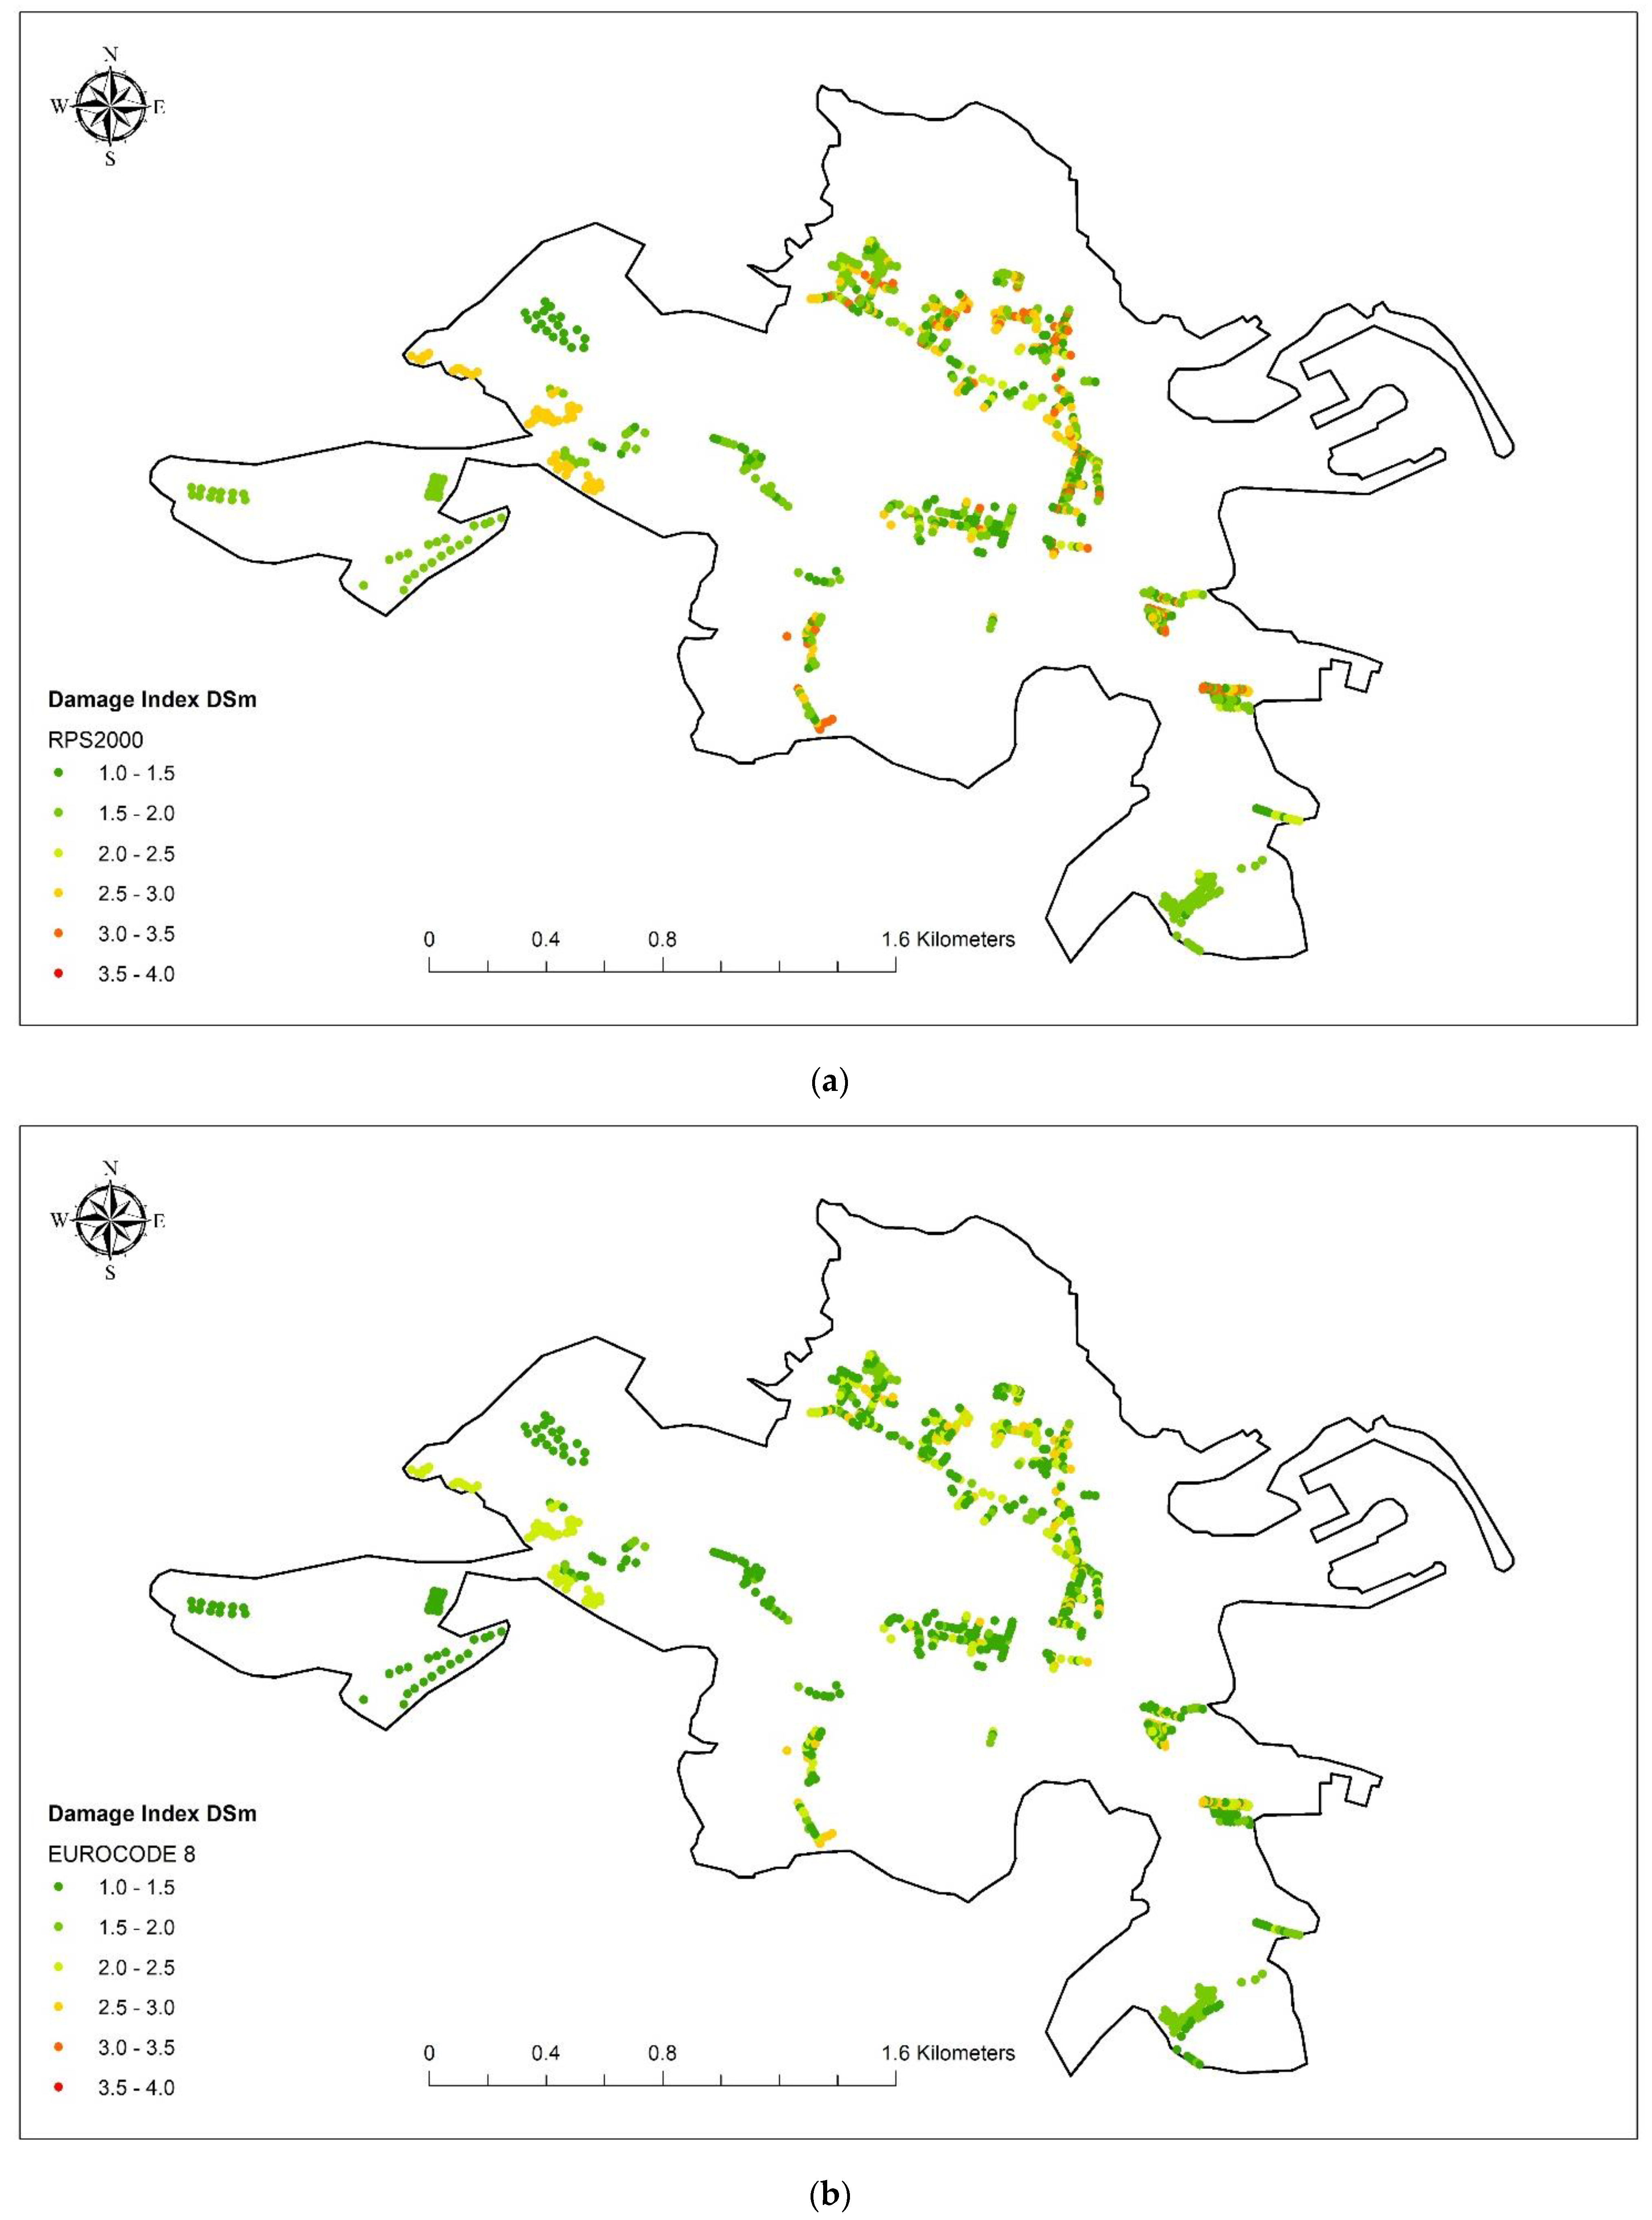
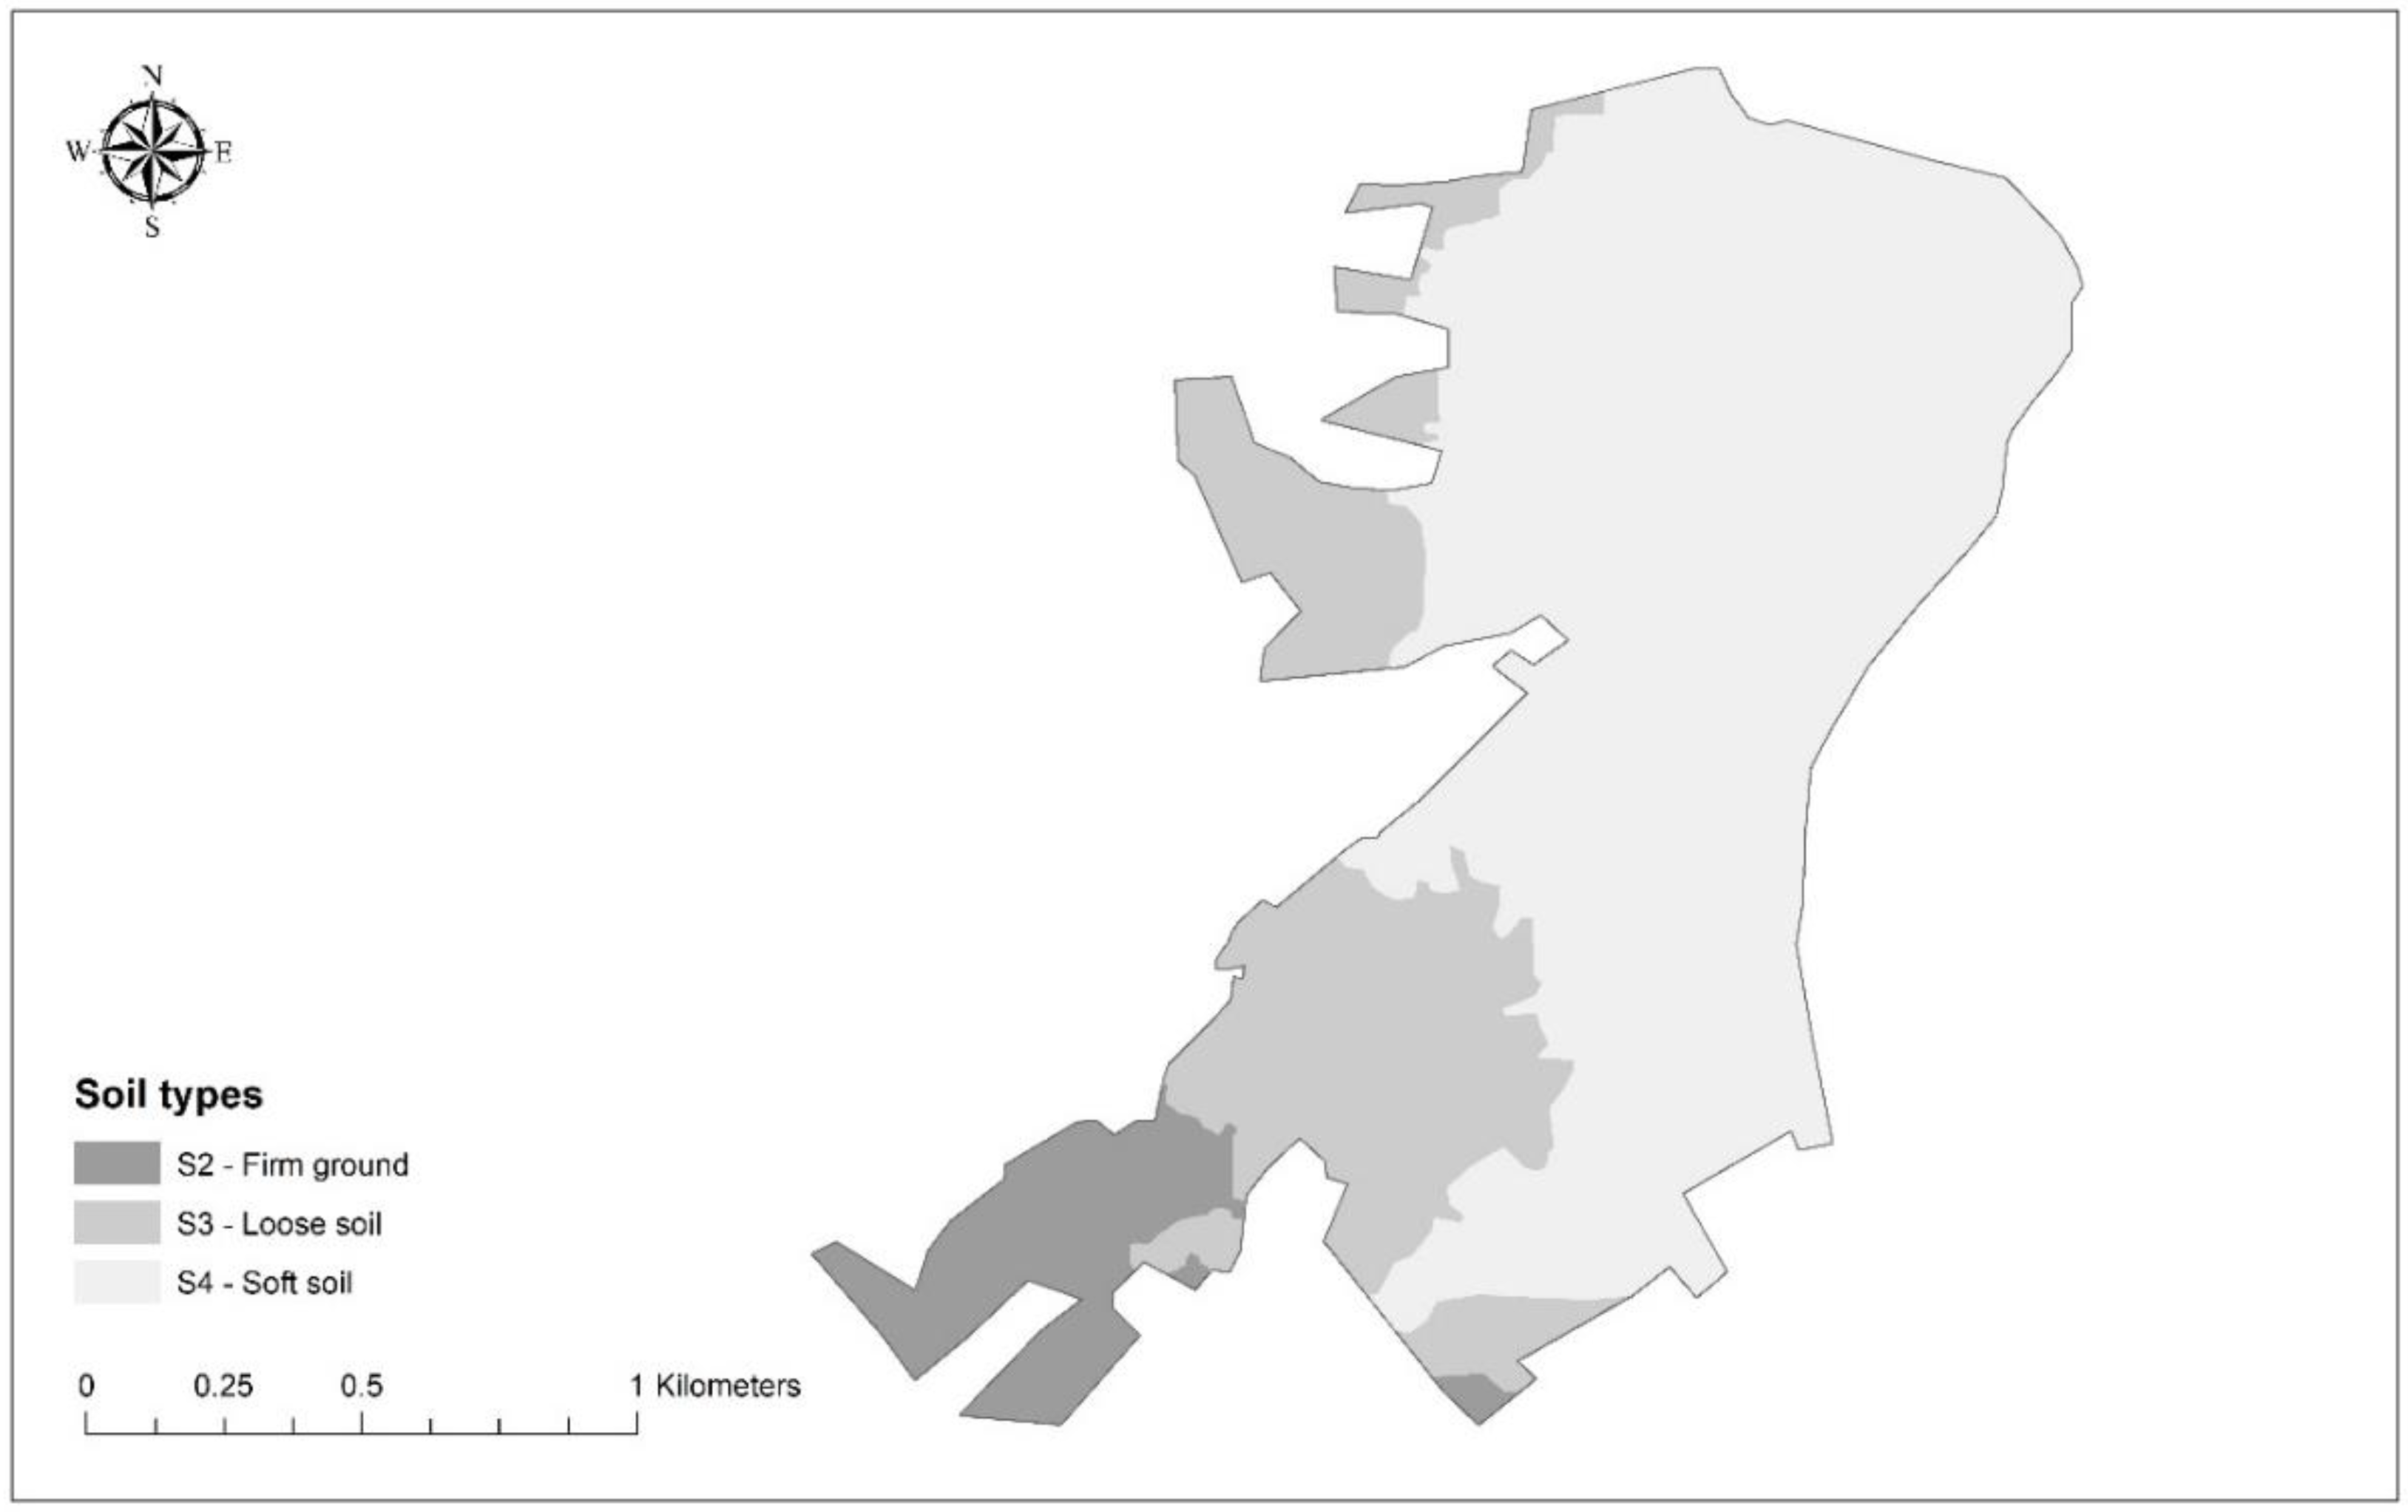
Seismic risk assessment based on the Capacity Spectrum method was used in this study and applied to the buildings of Al Hoceima and Imzouren, the most important towns of the central Rif region in Morocco. The region has experienced devastating earthquakes in the recent past and multiple studies have been carried out to assess the vulnerability and seismic risk of buildings in the region. This study falls within this framework, where importance is given to the development of building capacity spectra for the estimation of seismic performance. Two probabilistic risk scenarios were considered, using 5% damped elastic response spectra. The first scenario is based on the response spectrum taken from the national seismic code RPS2000, while the second scenario is based on the response spectrum model of Eurocode 8, using the seismic parameters and properties of the central Rif region. Response spectra were generated for four types of soil, ranging from rocky soil to soft soil.
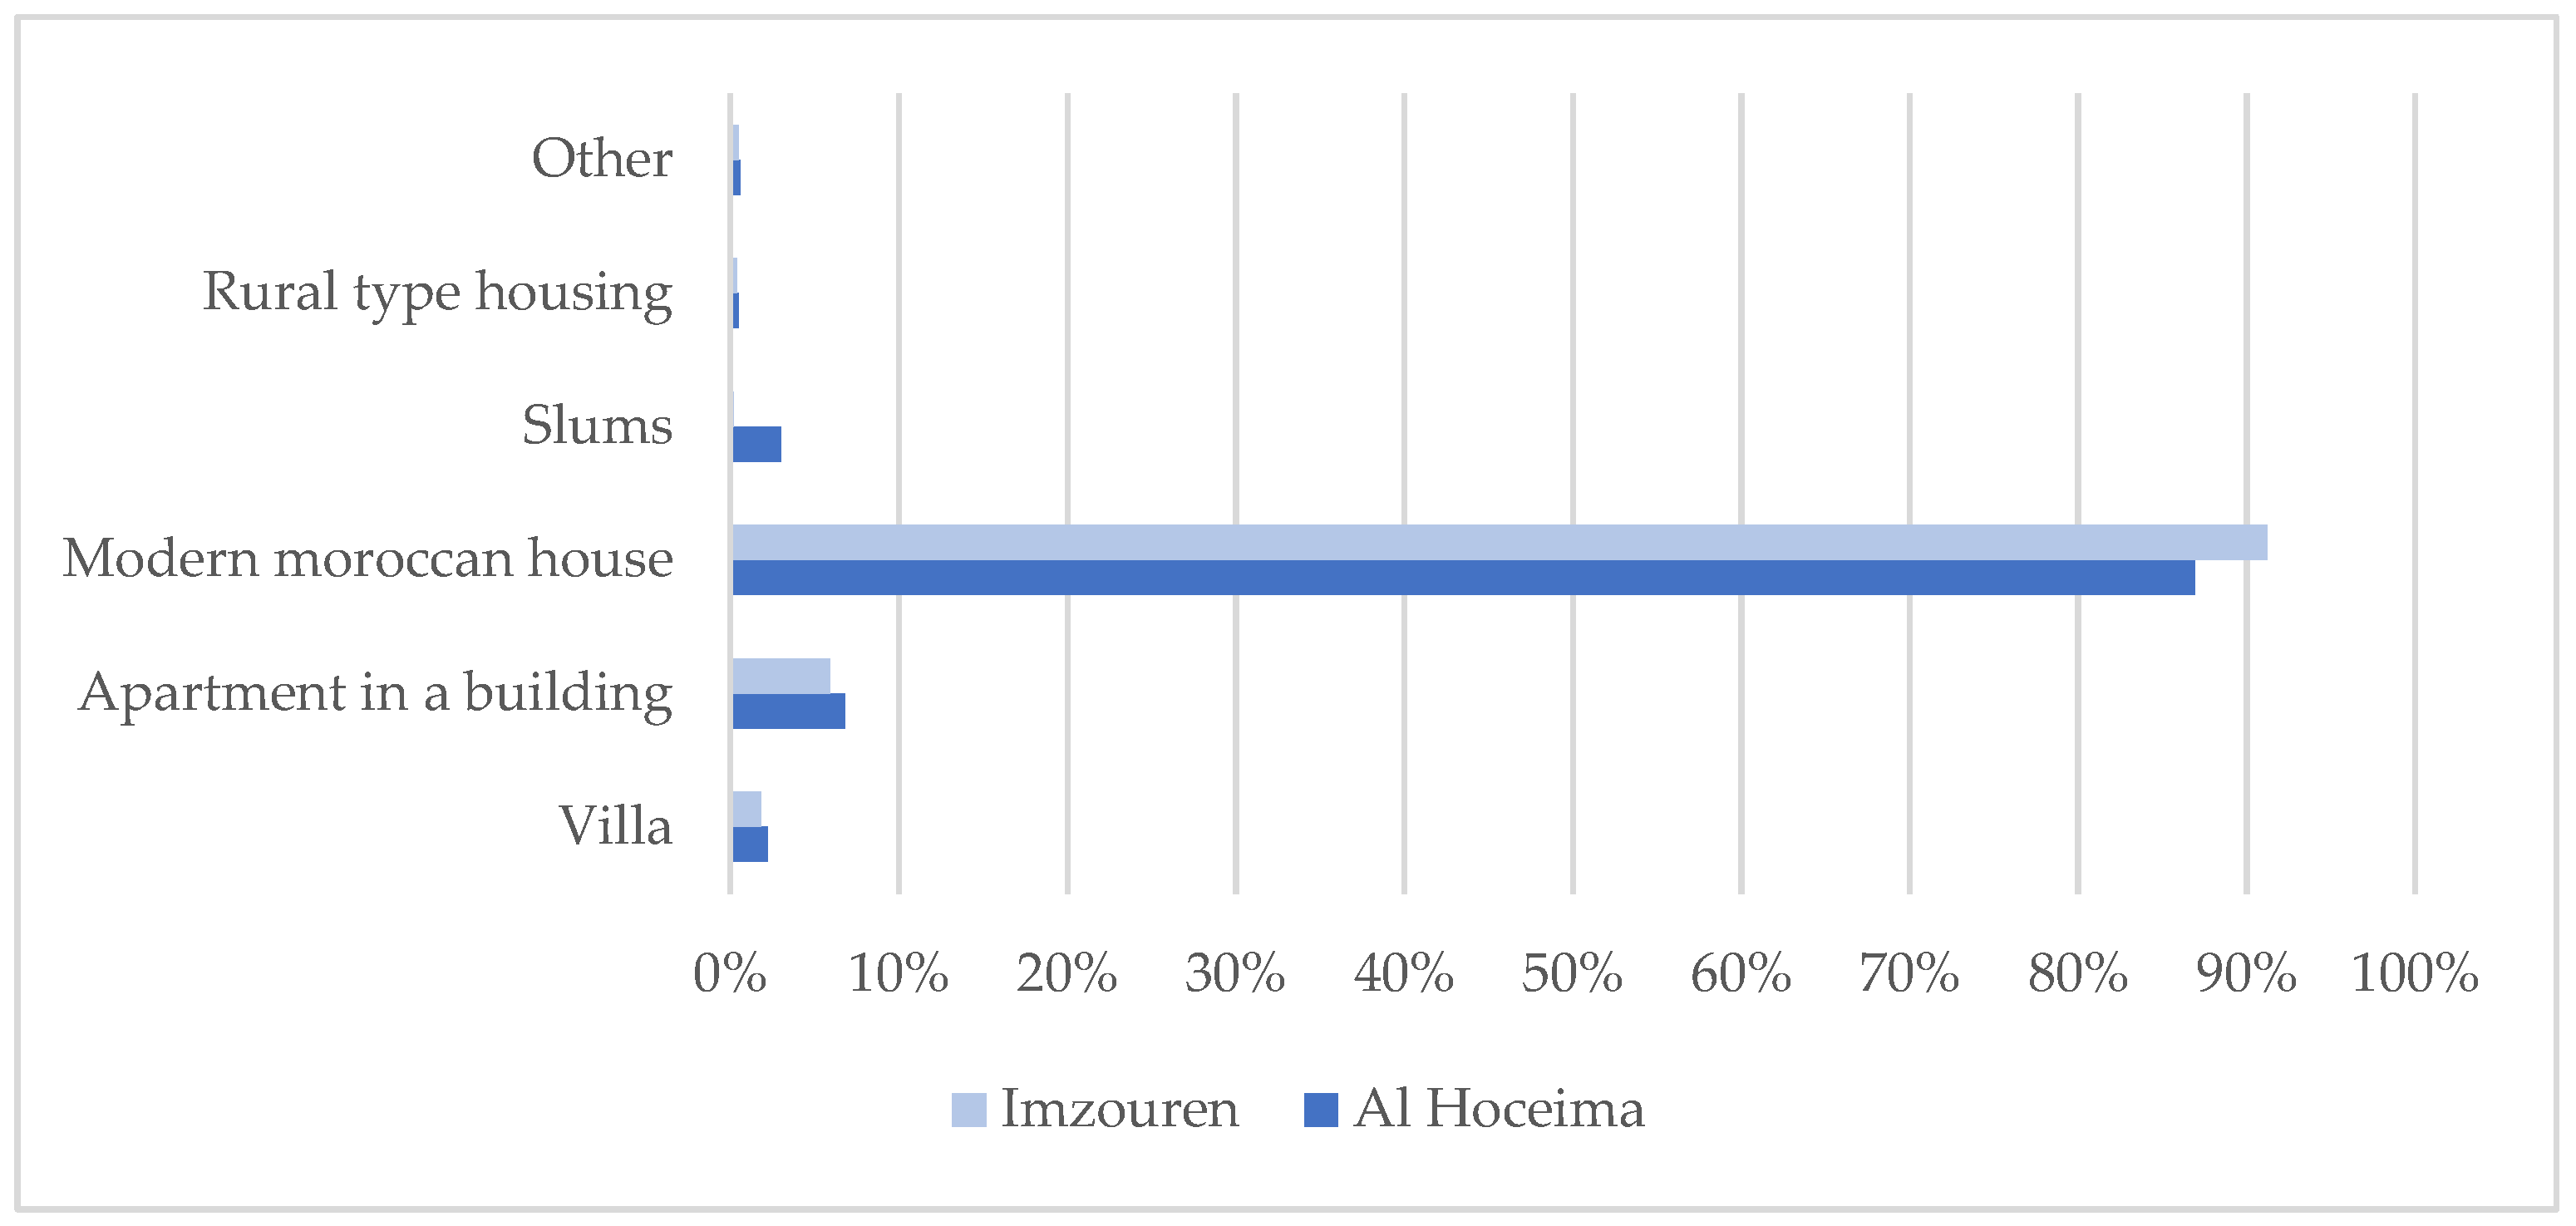
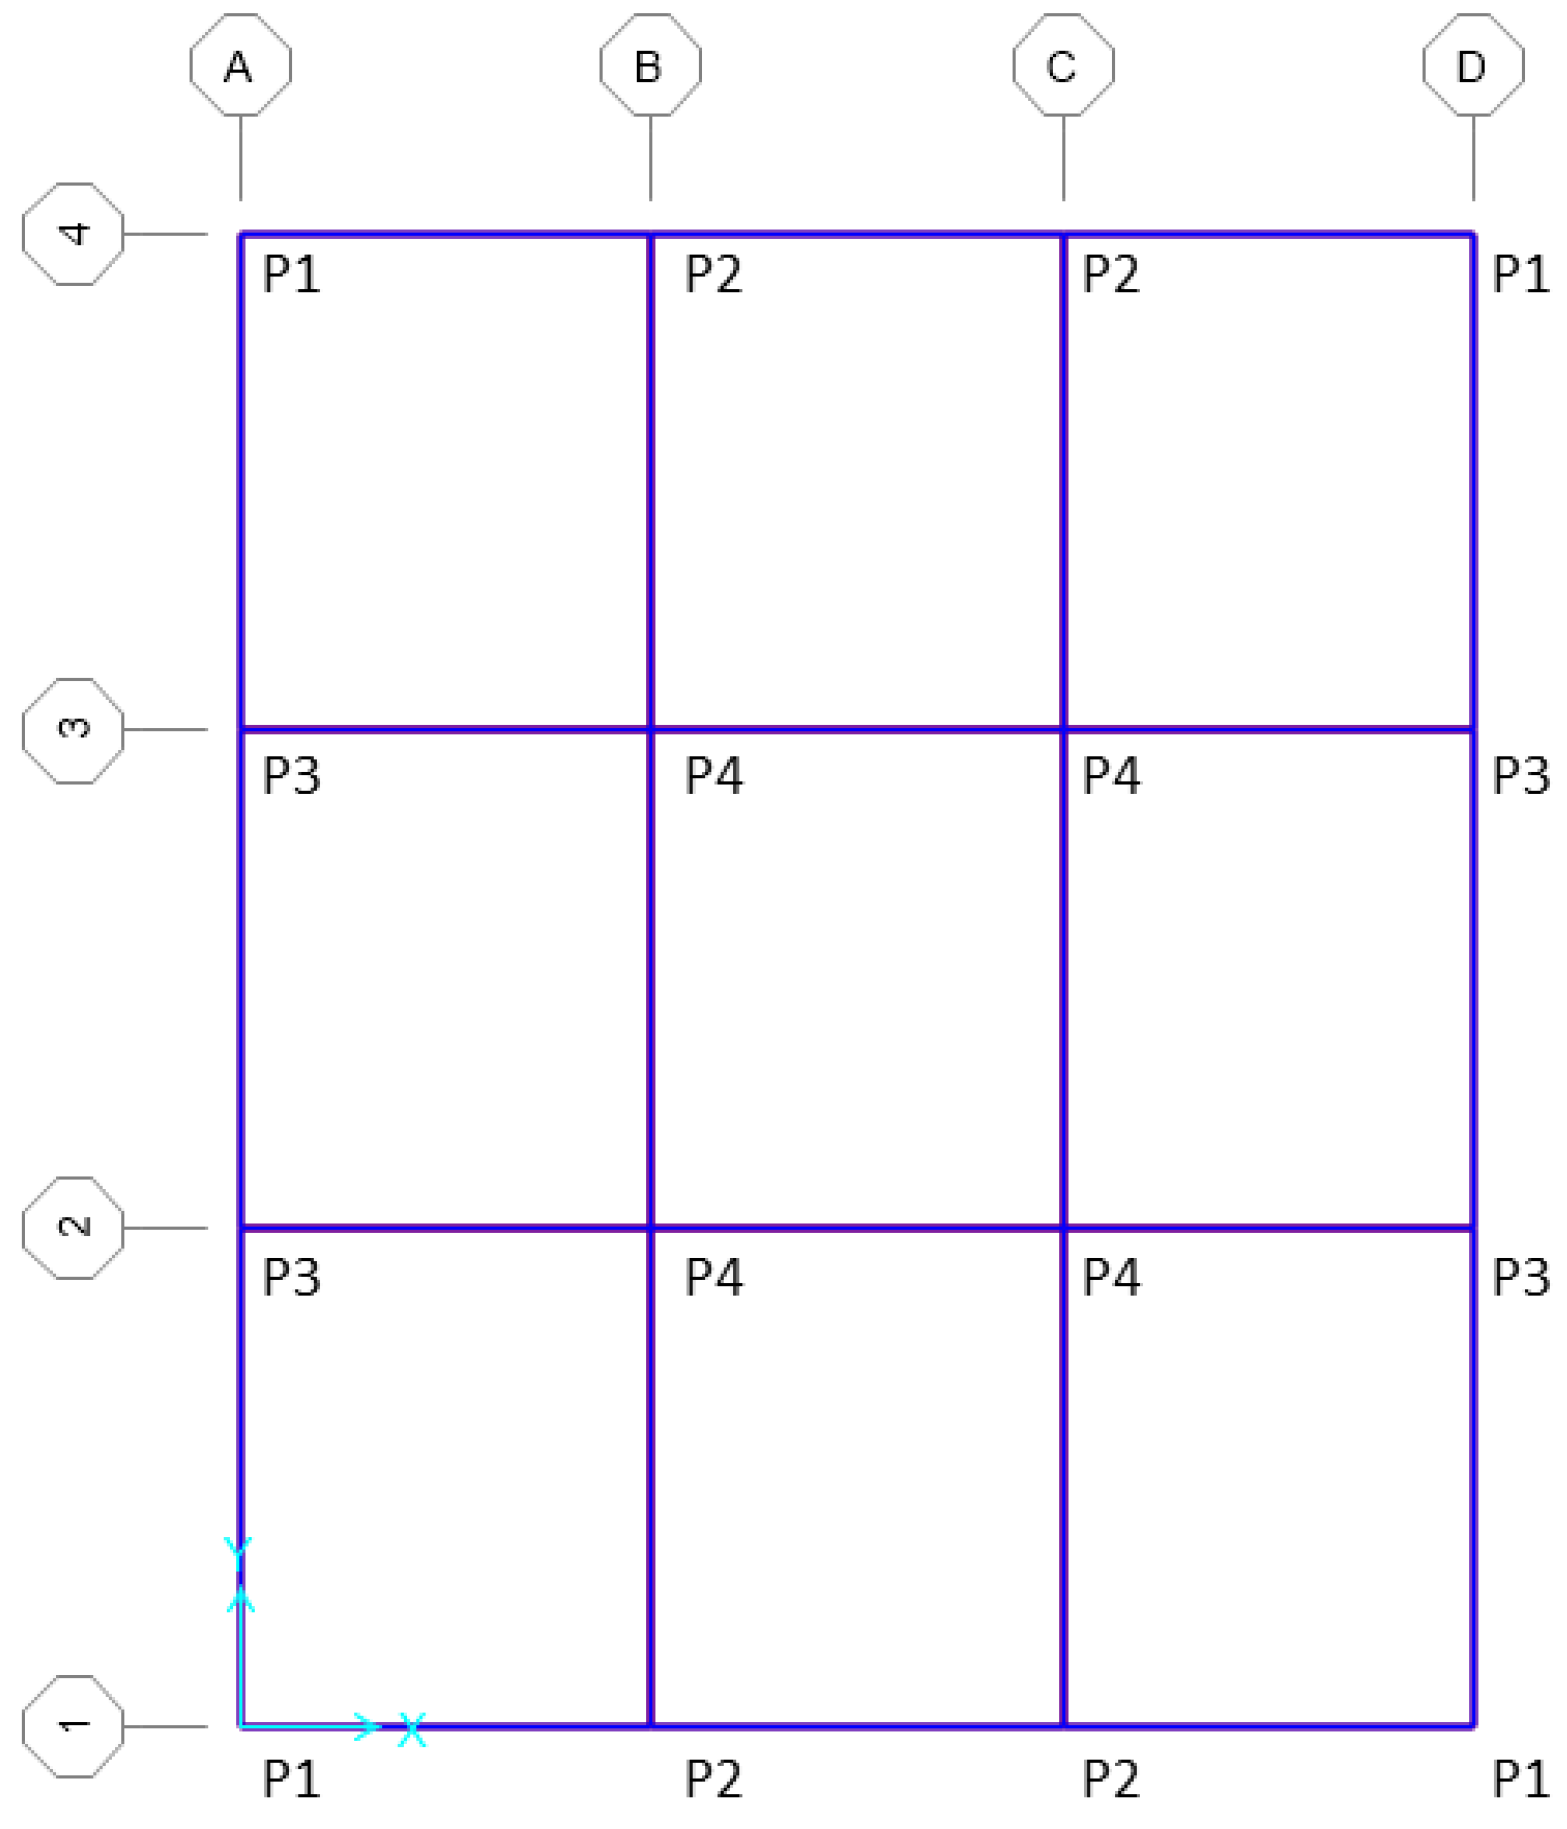
The capacity spectra were developed for 36 building models, which were designed to represent the two cities’ most common types of structures. The model determination is related to the seismic code, the construction period, and the number of floors. Capacity spectra were generated by performing a non-linear pushover analysis. Fragility curves were estimated for the building models, following capacity spectra. They are used to estimate the damage induced following a chosen seismic action. By specifying the spectral displacement of the structure, one can build damage probability matrices and calculate the average damage index. Performance points for each model and each suggested risk scenario are calculated afterwards. The adopted method was applied to the buildings of the city of Al Hoceima and Imzouren. A database of 2746 existing buildings in the region was used to carry out this study. The damage estimate was made by calculating the average damage index.
The most important results show that the damage is more significant in Imzouren than in Al Hoceima, mainly because of the seismic hazard and the soil typology. The distribution of damage in the two cities is quite similar to previous studies carried out in the same cities. Buildings with high damage indices are mainly high vulnerability buildings in the city of Al Hoceima and buildings that do not comply with earthquake regulations and are built on loose soil in Imzouren. By reflecting on the risk scenarios considered, the credibility of the response spectra drawn from the RPS2000 is questioned, given the extreme damage estimated, especially in Imzouren, and which do not reflect the results found in studies carried out previously. The models of the response spectra derived from the Eurocode and adapted to the seismic properties of the region prove to be a reliable model for future studies in the region.
The results related to the capacity spectra and fragility curves, as well as the generated seismic risk maps, constitute a valuable source of information that can be used to support effective seismic risk mitigation and management actions in the central Rif region. However, it is part of a broader vision for a better understanding of the seismic risk in the Rif region. The limitations of the work will be explored in future projects that will revolve around the following points:
  • Expanding the existing databases and planning investigations in the rural areas of the Rif chain.
  • Developing response spectra of target regions using seismograph recordings.
  • Estimating site effects using shear wave velocity vs30.
  • Considering new building models such as shear wall structures or mixed structures, which became widespread after the seismic regulations.

Author Contributions

Conceptualization, S.-E.C., M.C. and T.M.F.; methodology, S.-E.C.; validation A.C., M.O.M. and A.E.O.; formal analysis, A.C., M.O.M. and A.E.O.; investigation, S.-E.C.; resources, S.-E.C.; data curation, M.O.M.; writing—original draft preparation, S.-E.C.; writing—review and editing, M.C. and T.M.F.; visualization, S.-E.C.; supervision, M.C. and T.M.F.; project administration, M.C. All authors have read and agreed to the published version of the manuscript.

Funding

This research received no external funding.

Institutional Review Board Statement

Not applicable.

Informed Consent Statement

Not applicable.

Data Availability Statement

Not applicable.

Conflicts of Interest

The authors declare no conflict of interest.

Appendix A

Table A1. Yield and ultimate capacity for buildings with seismic code.
Construction Period IConstruction Period IIConstruction Period III
Yield CapacityUltimate CapacityYield CapacityUltimate CapacityYield CapacityUltimate Capacity
BuildingsDy (cm)Ay (g)Du (cm)Au (g)Dy (cm)Ay (g)Du (cm)Au
(g)
Dy (cm)Ay (g)Du (cm)Au
(g)
1 floor0.4090.2978.9340.4220.5780.4428.8560.5210.630.4849.250.969
2 floors0.6890.2349.0780.2740.8740.2989.1450.3661.020.3529.820.588
3 floors1.4030.25010.1780.3561.4940.27512.8330.5011.560.30311.640.609
4 floors1.1930.15512.3610.2772.1860.24316.1650.3662.030.24515.010.430
5 floors1.5360.12316.6730.2331.7730.15917.7250.3032.040.19217.560.333
6 floors1.5070.10420.8290.1962.4040.13220.6010.2372.490.14720.690.270
Table A2. Yield and ultimate capacity for buildings without seismic code.
Construction Period IConstruction Period IIConstruction Period III
Yield CapacityUltimate CapacityYield CapacityUltimate CapacityYield CapacityUltimate Capacity
BuildingsDy (cm)Ay (g)Du (cm)Au (g)Dy (cm)Ay (g)Du (cm)Au
(g)
Dy (cm)Ay (g)Du (cm)Au
(g)
1 floor0.4390.1459.1000.1640.5590.1889.0570.2800.640.2179.140.260
2 floors0.6500.1008.6890.1150.8690.1349.0250.1740.970.1508.900.175
3 floors1.4460.1439.2590.1611.5980.16510.0520.2271.480.15211.000.284
4 floors1.8320.12811.0640.1382.1380.15411.3250.1742.280.16610.880.223
5 floors1.9230.10114.3360.1422.6080.13913.2510.1592.560.14313.520.178
6 floors2.2790.08618.4930.1292.8800.11718.4350.1592.940.12820.800.186
Table A3. Parameters characterizing the fragility curves for the building models.
Buildings without seismic codeConstruction Period I
Number of floorsSd1 (cm)βSD1Sd2 (cm)βSD2Sd3 (cm)βSD3Sd4 (cm)βSD4
10.310.460.440.752.601.319.101.67
20.460.430.650.672.661.148.691.45
31.010.381.450.533.400.849.261.08
41.280.381.830.524.140.8211.061.05
51.350.391.920.565.030.9014.341.15
61.600.402.280.586.330.9418.491.20
Construction Period II
Number of floorsSd1 (cm)βSD1Sd2 (cm)βSD2Sd3 (cm)βSD3Sd4 (cm)βSD4
10.390.440.560.702.681.219.061.54
20.610.410.870.622.911.049.031.32
31.120.381.600.533.710.8410.051.07
41.500.372.140.504.430.7711.320.98
51.830.362.610.495.270.7513.250.96
62.020.382.880.536.770.8418.431.08
Construction Period III
Number of floorsSd1 (cm)βSD1Sd2 (cm)βSD2Sd3 (cm)βSD3Sd4 (cm)βSD4
10.450.440.640.682.771.169.141.48
20.680.410.970.602.950.998.901.26
31.030.391.480.563.860.9011.001.15
41.600.362.280.484.430.7210.880.93
51.800.372.560.505.300.7613.520.98
62.060.392.940.557.410.8820.801.13
Buildings with seismic codeConstruction Period I
Number of floorsSd1 (cm)βSD1Sd2 (cm)βSD2Sd3 (cm)βSD3Sd4 (cm)βSD4
10.290.470.410.752.541.338.931.69
20.480.430.690.662.791.139.081.44
30.980.391.400.563.600.8910.181.14
40.840.411.190.623.991.0412.361.32
51.080.421.540.635.321.0516.671.34
61.050.431.510.676.341.1520.831.46
Construction Period II
Number of floorsSd1 (cm)βSD1Sd2 (cm)βSD2Sd3 (cm)βSD3Sd4 (cm)βSD4
10.400.440.580.692.651.198.861.51
20.610.410.870.622.941.049.141.32
31.050.401.490.594.330.9612.831.23
41.530.392.190.565.680.9016.171.15
51.240.411.770.615.761.0217.721.30
61.680.402.400.596.950.9620.601.22
Construction Period III
Number of floorsSd1 (cm)βSD1Sd2 (cm)βSD2Sd3 (cm)βSD3Sd4 (cm)βSD4
10.440.440.630.682.791.179.251.49
20.720.411.020.613.221.009.821.28
31.090.391.560.564.080.9011.641.15
41.420.392.030.565.280.9015.011.15
51.430.402.040.595.920.9617.561.23
61.750.402.490.587.040.9520.691.21
Table A4. Spectral displacement (cm) of the performance points for the RC building models according to both probabilistic scenarios (RPS2000 and Eurocode 8).
Construction Period IConstruction Period IIConstruction Period III
Buildings without seismic codeNumber of storiesSoil TypeRPSE8 ALHE8 IMZRPSE8 ALHE8 IMZRPSE8 ALHE8 IMZ
1S12.801.702.402.001.602.101.801.502.00
S24.503.004.202.902.503.302.502.303.10
S36.705.106.404.104.005.403.503.705.10
S4 5.606.906.804.506.006.304.105.60
2S15.602.503.403.402.202.903.102.102.70
S28.504.004.805.203.404.704.703.304.40
S3 5.306.607.305.506.806.705.306.60
S4 5.707.00 6.007.30 5.807.10
3S14.202.703.403.402.403.003.102.402.90
S25.804.005.204.603.604.504.103.404.30
S37.905.907.006.105.307.005.405.006.50
S4 6.307.409.805.907.608.805.407.20
4S15.203.204.004.302.903.604.002.903.50
S27.204.705.605.804.205.305.304.005.00
S39.906.207.107.706.107.206.805.807.40
S4 6.507.60 6.407.5010.606.407.90
5S16.903.704.405.403.404.204.903.304.00
S29.404.905.807.204.905.806.504.705.80
S312.506.407.609.606.407.508.606.407.40
S4 6.908.10 6.807.90 6.707.70
6S18.703.604.406.903.804.506.103.804.60
S212.005.005.909.105.105.908.105.106.00
S3 6.607.7011.906.607.9010.506.607.80
S4 6.908.20 7.008.3016.707.008.30
Construction Period IConstruction Period IIConstruction Period III
Buildings with seismic codeNumber of storiesSoil TypeRPSE8 ALHE8 IMZRPSE8 ALHE8 IMZRPSE8 ALHE8 IMZ
1S10.620.760.870.600.780.920.600.790.94
S20.751.001.300.731.001.200.721.001.20
S30.881.602.100.861.401.800.851.401.70
S41.701.802.401.201.501.901.101.501.80
2S11.101.101.301.101.101.301.101.201.30
S21.401.501.801.201.401.701.301.401.60
S31.702.102.801.501.902.401.401.802.30
S42.702.303.202.202.102.701.902.002.50
3S11.601.401.701.601.501.701.601.501.80
S22.002.002.501.902.002.401.902.002.30
S32.502.803.602.302.703.302.202.603.20
S43.703.103.903.302.903.603.002.803.40
4S12.401.802.202.101.702.102.001.802.10
S23.202.603.402.602.402.902.502.302.80
S34.003.904.903.303.404.203.003.204.00
S45.904.205.304.803.604.704.203.504.30
5S13.202.102.602.702.002.502.502.002.40
S24.403.104.103.402.803.503.102.703.30
S35.604.705.904.304.005.203.903.804.70
S48.205.206.406.404.405.605.704.105.20
6S14.102.403.103.802.503.003.502.403.00
S25.503.604.304.903.504.404.503.404.20
S37.104.905.806.305.006.005.604.806.00
S410.505.206.209.305.306.408.205.206.40
Table A5. Damage index D S m values for the RC building models according to both probabilistic scenarios (RPS2000 and Eurocode 8).
Construction Period IConstruction Period IIConstruction Period III
Buildings without seismic codeNumber of storiesSoil TypeRPSE8 ALHE8 IMZRPSE8 ALHE8 IMZRPSE8 ALHE8 IMZ
1S12.762.492.682.532.402.562.432.302.49
S23.002.792.962.752.662.822.632.582.76
S33.193.063.172.942.923.092.832.863.05
S43.393.113.203.202.993.143.162.923.10
2S13.122.652.842.782.472.672.692.392.59
S23.342.933.043.052.782.992.982.742.94
S33.513.093.213.253.083.213.213.063.20
S43.603.133.243.533.143.253.513.123.24
3S12.812.392.622.532.152.412.452.182.38
S23.062.772.982.812.592.792.692.532.73
S33.283.083.203.042.933.142.902.853.04
S43.583.133.243.373.013.203.242.903.11
4S12.822.342.582.562.072.362.462.002.28
S23.092.732.892.862.542.782.782.462.72
S33.312.973.083.112.913.053.022.873.09
S43.633.013.133.492.953.083.372.963.15
5S12.892.362.522.622.022.322.511.992.26
S23.112.622.752.902.512.692.802.462.69
S33.302.832.963.152.792.943.052.792.92
S43.522.893.013.502.852.993.402.832.96
6S12.892.132.332.641.972.192.461.912.16
S23.112.452.592.882.342.492.712.272.44
S33.452.682.803.092.602.762.922.532.68
S43.762.712.843.512.652.803.242.582.73
Construction Period IConstruction Period IIConstruction Period III
Buildings with seismic codeNumber of storiesSoil TypeRPSE8 ALHE8 IMZRPSE8 ALHE8 IMZRPSE8 ALHE8 IMZ
1S11.872.032.131.481.811.971.351.731.91
S22.022.222.371.732.052.191.611.982.14
S32.132.482.621.902.312.471.812.252.39
S42.522.542.692.192.352.502.062.302.43
2S12.012.012.161.791.791.991.591.711.82
S22.222.272.411.902.072.251.821.912.06
S32.372.512.692.142.352.531.912.182.40
S42.672.572.772.462.422.612.242.282.47
3S11.721.501.811.601.491.691.551.441.74
S22.042.042.291.851.912.131.821.892.07
S32.292.412.642.082.252.432.022.212.42
S42.662.502.702.432.322.512.362.292.48
4S12.282.012.211.441.051.441.481.291.56
S22.512.352.561.781.661.941.831.711.99
S32.672.652.812.102.142.362.082.152.39
S42.932.712.862.492.202.472.432.252.46
5S12.301.892.112.031.651.941.791.451.73
S22.542.272.492.252.072.282.061.902.13
S32.712.592.742.452.392.592.302.272.47
S42.952.662.802.742.472.652.622.352.55
6S12.422.002.222.111.551.821.981.431.78
S22.612.332.452.362.022.262.261.942.19
S32.762.532.642.572.382.542.462.322.52
S42.992.572.682.872.432.592.772.392.57

References

  1. Abdesslam, B. Evolution of rural–urban health gaps in Morocco: 1992–2011. BMC Res. Notes 2012, 5, 381. [Google Scholar] [CrossRef] [Green Version]
  2. Institut National de la Statistique. Recensement Général de la Population et de l’Habitat 2014 (RGPH 2014); Haut Commissariat au Plan (HCP): Casablanca, Morocco, 2014. [Google Scholar]
  3. Cherkaoui, T.E.; Hatzfeld, D.; Jebli, H.; Medina, F.; Caillot, V. Etude microsismique de la région d’Al Hoceima. Bull. Inct. Sci. Rabat. 1990, 12, 25–34. [Google Scholar]
  4. Kariche, J.; Meghraoui, M.; Timoulali, Y.; Cetin, E.; Toussaint, R. The Al Hoceima earthquake sequence of 1994, 2004 and 2016: Stress transfer and poroelasticity in the Rif and Alboran Sea region. Geophys. J. Int. 2018, 212, 42–53. [Google Scholar] [CrossRef]
  5. Bezzeghoud, M.; Buforn, E. Source parameters of the 1992 Melilla (Spain, MW = 4.8), 1994 Alhoceima (Morocco, MW = 5.8), and 1994 Mascara (Algeria, MW = 5.7) earthquakes and seismotectonic implications. Bull. Seismol. Soc. Am. 1999, 89, 359–372. [Google Scholar] [CrossRef]
  6. El Alami, S.O.; Tadili, B.A.; Cherkaoui, T.E.; Medina, F.; Ramdani, M.; Brahim, L.A.; Harnafi, M. The Al Hoceima earthquake of May 26, 1994 and its aftershocks: A seismotectonic study. Ann. Geophys. 1998, 41, 519–537. [Google Scholar] [CrossRef]
  7. Goula, X.; Gonzalez, M. Visite Technique à la zone Endommagée par le séisme d’Al-hoceima du 24 février 2004. Generalitat de Catalunya. Institut Cartogràfic de Catalunya; ICC-GS-192/2004 (fr): Barcelona, Spain, 2004. [Google Scholar]
  8. Jabour, N.; Kasmi, M.; Menzhi, M.; Birouk, A.; Hni, L.; Hahou, Y.; Timoulali, Y.; Bedrane, S. The February 24th, 2004 Al Hoceima Earthquake; Newsletter of the European-Mediterranean Seismological Centre: Essonne, France, 2004. [Google Scholar]
  9. Cherkaoui, T.E.; Harnafi, M. Le séisme d’Al Hoceima du 24 février 2004. Trav. Col. Nat. Sur: Région de Taza-Al Hoceima-Taounate, ressources et stratégies de développement. Pub. Fac. Polydiscip. Taza 2005, 27–38. Available online: http://www.afps-seisme.org/content/download/34357/740092/file/AFPS_Rapport_mission_2004_Seisme%20Al%20Hoceima%20(Maroc)%202.pdf (accessed on 8 May 2022).
  10. Buforn, E.; Pro, C.; Sanz de Galdeano, C.; Cantavella, J.V.; Cesca, S.; Caldeira, B.; Udías, A.; Mattesini, M. The 2016 south Alboran earthquake (Mw=6.4): A reactivation of the Ibero-Maghrebian region? Tectonophysics 2017, 712–713, 704–715. [Google Scholar] [CrossRef]
  11. Medina, F.; Cherkaoui, T. The South-Western Alboran Earthquake Sequence of January-March 2016 and Its Associated Coulomb Stress Changes. Open J. Earthq. Res. 2016, 6, 35–54. [Google Scholar] [CrossRef] [Green Version]
  12. Galindo-Zaldivar, J.; Ercilla, G.; Estrada, F.; Catalán, M.; d’Acremont, E.; Azzouz, O.; Casas, D.; Chourak, M.; Vazquez, J.T.; Chalouan, A.; et al. Imaging the growth of recent faults: The case of 2016–2017 seismic sequence sea bottom deformation in the Alboran Sea (Western Mediterranean). Tectonics 2018, 37, 2513–2530. [Google Scholar] [CrossRef]
  13. Vlachakis, G.; Vlachaki, E.; Lourenço, P.B. Learning from failure: Damage and failure of masonry structures, after the 2017 Lesvos earthquake (Greece). Eng. Fail. Anal. 2020, 117, 104803. [Google Scholar] [CrossRef]
  14. Bilgin, H.; Shkodrani, N.; Hysenlliu, M.; Ozmen, H.B.; Isik, E.; Harirchian, E. Damage and performance evaluation of masonry buildings constructed in 1970s during the 2019 Albania earthquakes. Eng. Fail. Anal. 2022, 131, 105824. [Google Scholar] [CrossRef]
  15. Stepinac, M.; Lourenço, P.B.; Atalić, J.; Kišiček, T.; Uroš, M.; Baniček, M.; Novak, M.Š. Damage classification of residential buildings in historical downtown after the ML5. 5 earthquake in Zagreb, Croatia in 2020. Int. J. Disaster Risk Reduct. 2021, 56, 102140. [Google Scholar] [CrossRef]
  16. RPS. Règlement de Construction Parasismique. Ministère de l’Aménagement du Territoire, de l’Urbanisme, de l’Habitat et de l’Environnement; Secrétariat d’Etat à l’Habitat: Rabat, Morocco, 2000. [Google Scholar]
  17. RPS. Règlement de Construction Parasismique; Version 2011; Ministère de l’Habitat, de l’Urbanisme et de l’Aménagement de l’Espace: Rabat, Morocco, 2000. [Google Scholar]
  18. Ferreira, T.M.; Mendes, N.; Silva, R. Multiscale Seismic Vulnerability Assessment and Retrofit of Existing Masonry Buildings. Buildings 2019, 9, 91. [Google Scholar] [CrossRef] [Green Version]
  19. Shabani, A.; Kioumarsi, M.; Zucconi, M. State of the art of simplified analytical methods for seismic vulnerability assessment of unreinforced masonry buildings. Eng. Struct. 2021, 239, 112280. [Google Scholar] [CrossRef]
  20. Benedetti, D.; Petrini, V. On the seismic vulnerability of masonry buildings: Proposal of year procedure evaluation. Ind. Constr. 1984, 18, 66–74. [Google Scholar]
  21. Cosenza, E.; Manfredi, G.; Polese, M.; Verderame, G.M. A multi-level approach to the capacity assessment of existing RC buildings. J. Earthq. Eng. 2005, 9, 1–22. [Google Scholar] [CrossRef]
  22. Lagomarsino, S.; Giovinazzi, S. Macroseismic and mechanical models for the vulnerability and damage assessment of current buildings. Bull. Earthq. Eng. 2006, 4, 415–443. [Google Scholar] [CrossRef]
  23. Rosti, A.; Rota, M.; Penna, A. Damage classification and derivation of damage probability matrices from L’Aquila (2009) post-earthquake survey data. Bull. Earthq. Eng. 2018, 16, 3687–3720. [Google Scholar] [CrossRef]
  24. Diana, L.; Lestuzzi, P.; Podestá, L.; Luchini, G. Improved Urban Seismic Vulnerability Assessment Using Typological Curves and Accurate Displacement Demand Prediction. J. Earthq. Eng. 2019, 25, 1709–1731. [Google Scholar] [CrossRef]
  25. Sangiorgio, V.; Uva, G.; Fatiguso, F.; Adam, J.M. A new index to evaluate exposure and potential damage to RC building structures incoastal areas. Eng. Fail. Anal. 2019, 100, 439–455. [Google Scholar] [CrossRef]
  26. Rosti, A.; Del Gaudio, C.; Di Ludovico, M.; Magenes, G.; Penna, A.; Polese, M.; Prota, A.; Ricci, P.; Rota, M.; Verderame, G.M. Empirical vulnerability curves for italian residential buildings. Boll. Di. Geofis. Teor. Ed. Appl. 2020, 61, 357–374. [Google Scholar]
  27. Del Gaudio, C.; Ricci, P.; Verderame, G.M.; Manfredi, G. Development and urban-scale application of a simplified method for seismic fragility assessment of RC buildings. Eng. Struct. 2015, 91, 40–57. [Google Scholar] [CrossRef]
  28. Gaetani d’Aragona, M.; Polese, M.; Prota, A. Stick-IT: A simplified model for rapid estimation of IDR and PFA for existing low-rise symmetric infilled RC building typologies. Eng. Struct. 2020, 223, 111182. [Google Scholar] [CrossRef]
  29. Ruggieri, S.; Porco, F.; Uva, G.; Vamvatsikos, D. Two frugal options to assess class fragility and seismic safety for low-rise reinforced concrete school buildings in Southern Italy. Bull. Earthq. Eng. 2021, 19, 1415–1439. [Google Scholar] [CrossRef]
  30. Leggieri, V.; Ruggieri, S.; Zagari, G.; Uva, G. Appraising seismic vulnerability of masonry aggregates through an automated mechanical-typological approach. Autom. Constr. 2021, 132, 103972. [Google Scholar] [CrossRef]
  31. Kappos, A.J.; Panagopoulos, G.; Panagiotopoulos, C.; Penelis, C.G. A hybrid method for the vulnerability assessment of R/C and URM buildings. Bull. Earthq. Eng. 2006, 4, 391–413. [Google Scholar] [CrossRef]
  32. Barbat, A.H.; Moya, F.Y.; Canas, J.A. Damage scenarios simulation for seismic risk assessment in urban zones. Earthq. Spectra 1996, 12, 371–394. [Google Scholar] [CrossRef]
  33. Pagani, M.; Monelli, D.; Weatherill, G.; Danciu, L.; Crowley, H.; Silva, V.; Henshaw, P.; Butler, L.; Nastasi, M.; Panzeri, L.; et al. OpenQuake Engine: An Open Hazard (and Risk) Software for the Global Earthquake Model. Seismol. Res. Lett. 2014, 85, 692–702. [Google Scholar] [CrossRef] [Green Version]
  34. Crowley, H.; Despotaki, V.; Rodrigues, D.; Silva, V.; Toma-Danila, D.; Riga, E.; Karatzetzou, A.; Fotopoulou, S.; Zugic, Z.; Sousa, L.; et al. Exposure model for European seismic risk assessment. Earthq. Spectra 2020, 36 (Suppl. S1), 252–273. [Google Scholar] [CrossRef]
  35. Silva, V.; Amo-Oduro, D.; Calderon, A.; Costa, C.; Dabbeek, J.; Despotaki, V.; Martins, L.; Pagani, M.; Rao, A.; Simionato, M.; et al. Development of a global seismic risk model. Earthq. Spectra 2020, 36 (Suppl. S1), 372–394. [Google Scholar] [CrossRef]
  36. Louhibi, S.; Chourak, M.; El Kihel, E.; El Hammoumi, A.; Douiri, A. Evaluation of the seismic vulnerability of buildings in Al Hoceima (Morocco). Int. J. Earth Sci. Eng. 2013, 6, 1505–1511. [Google Scholar]
  37. Cherif, S.; Chourak, M.; Abed, M.; Pujades, L. Seismic risk in the city of Al Hoceima (north of Morocco) using the vulnerability index method, applied in Risk-UE project. Nat. Hazards 2017, 85, 329–347. [Google Scholar] [CrossRef]
  38. Cherif, S.; Chourak, M.; Abed, M.; Douiri, A. Potential Seismic Damage Assessment of Residential Buildings in Imzouren City (Northern Morocco). Buildings 2018, 8, 179. [Google Scholar] [CrossRef] [Green Version]
  39. Cherif, S.; Chourak, M.; Abed, M.; Pujades, L. Seismic evaluation method for existing reinforced concrete buildings in North of Morocco. Bull. Earthquake Eng. 2019, 17, 3873–3894. [Google Scholar] [CrossRef]
  40. Milutinovic, Z.V.; Trendafiloski, G.S. Risk-UE an Advanced Approach to Earthquake Risk Scenarios with Applications to Different European Towns; Contract: EVK4-CT-2000-00014, WP4; Vulnerability of Current Buildings; 2003; pp. 1–111. Available online: http://www.civil.ist.utl.pt/~mlopes/conteudos/DamageStates/Risk%20UE%20WP04_Vulnerability.pdf (accessed on 8 May 2022).
  41. Freeman, S.A. Review of the development of the capacity spectrum method. ISET J. Earthq. Technol. 2004, 41, 1–13. [Google Scholar]
  42. Freeman, S.A. Evaluations of existing buildings for seismic risk-A case study of Puget Sound Naval Shipyard. In Proceedings of the U.S. National Conference on Earthquake Engineering, Bremerton, WA, USA, 18–20 June 1975; pp. 113–122. [Google Scholar]
  43. Mahaney, J.A.; Paret, T.F.; Kehoe, B.E.; Freeman, S.A. The Capacity Spectrum Method for Evaluating Structural Response during the Loma Prieta Earthquake; Mitigation and damage to the built environment; U.S. Central United States Earthquake Consortium (CUSEC): Memphis, Tennessee, 1993; pp. 501–510. [Google Scholar]
  44. HAZUS. Earthquake Loss Estimation Methodology Technical Manual; National Institute of Building Sciences for Federal Emergency Management Agency (FEMA): Washington, DC, USA, 1999. [Google Scholar]
  45. Grünthal, G. European Macroseismic Scale 1998; European Seismological Commission (ESC): Luxembourg, 1998. [Google Scholar]
  46. Seminar, C. NEHRP Guidelines for the Seismic Rehabilitation of Buildings (FEMA 273); Building Seismic Safety Council: Washington, DC, USA, 1997. [Google Scholar]
  47. van der Woerd, J.; Dorbath, C.; Ousadou, F.; Dorbath, L.; Delouis, B.; Jacques, E.; Tapponnier, P.; Hahou, Y.; Menzhi, M.; Frogneux, M.; et al. The Al Hoceima Mw 6.4 earthquake of 24 February 2004 and its aftershocks sequence. J. Geodyn. 2014, 77, 89–109. [Google Scholar] [CrossRef]
  48. Cherkaoui, T.E.; El Hassani, A. Seismicity and Seismic Hazard in Morocco 1901–2010. Bull. L’institut Sci. Sect. Sci. Terre 2012, 34, 45–55. [Google Scholar]
  49. Mourabit, T.; Abou Elenean, K.M.; Ayadi, A.; Benouar, D.; Ben Suleman, A.; Bezzeghoud, M.; Cheddadi, A.; Chourak, M.; ElGabry, M.N.; Harbi, A.; et al. Neo-deterministic seismic hazard assessment in North Africa. J. Seismol. 2013, 18, 301–318. [Google Scholar] [CrossRef]
  50. Valerio, P.; Garcia-Peláez, J.; Styron, R.; Pagani, M.; Gee, R. A probabilistic seismic hazard model for North Africa. Bull. Earthq. Eng. 2020, 18, 2917–2951. [Google Scholar] [CrossRef]
  51. d’Acremont, E.; Gutscher, M.A.; Rabaute, A.; Mercier de Lépinay, B.; Lafosse, M.; Poort, J.; Ammar, A.; Tahayt, A.; Le Roy, P.; Smit, J.; et al. High-resolution imagery of active faulting offshore Al Hoceima, Northern Morocco. Tectonophysics 2014, 632, 160–166. [Google Scholar] [CrossRef]
  52. Tahayt, A.; Feigl, K.L.; Mourabit, T.; Rigo, A.; Reilinger, R.; McClusky, S.; Fadil, A.; Berthier, E.; Dorbath, L.; Serroukh, M.; et al. The Al Hoceima (Morocco) earthquake of 24 February 2004, analysis and interpretation of data from ENVISAT ASAR and SPOT5 validated by ground-based observations. Remote Sens. Environ. 2009, 113, 306–316. [Google Scholar] [CrossRef]
  53. European Committee for Standardization. Eurocode 8: Design Provisions for Earthquake Resistance of Structures; Central Secretariat, CEN: Bruxelles, Belgium, 1994. [Google Scholar]
  54. BAEL 91. Règles Techniques de Conception et de Calcul des Ouvrages et Constructions en Béton Armé suivant la Méthode des Etats Limites; Edition Eyrolles: Paris, France, 1992; ISBN 221210023X. [Google Scholar]
  55. RMSI. Morocco natural hazards probabilistic analysis and national strategy development. In Earthquake Hazard Report; Department of Economic and General Affairs: Rabat, Marocco, 2012. [Google Scholar]
  56. Douiri, A.; Mourabit, T.; Cheddadi, A.; Chourak, M.; Louhibi, S. Coïncidences spectrales du bruit de fond entre sol et bâti existant dans la ville d’Imzouren, Maroc (Spectral coincidences of background noise between soil and existing buildings in Imzouren city, Morocco). J. Mater. Environ. Sci. 2015, 6, 366–376. [Google Scholar]
  57. Council, A.T. Seismic Evaluation and Retrofit of Concrete Buildings; Report No. SSC 96-01: ATC-40, 1; Applied Technology Council: Redwood City, CA, USA, 1996. [Google Scholar]
Figure 1. (a) Landsat satellite image of western Mediterranean (Google Earth) and location of the study area. (b) Satellite image (Google Earth) of the cities of Al Hoceima and Imzouren.
Buildings 12 00742 g001
Figure 2. Seismic zoning in terms of (a) acceleration and velocity and (b) for probabilities of 10% in 50 years according to the national seismic code (RPS2000) [17].
Buildings 12 00742 g002
Figure 3. The 5% elastic response spectra for the probabilistic scenario expected on outcrop rock.
Buildings 12 00742 g003
Figure 4. Distribution of soil types in the city of Al Hoceima [37].
Buildings 12 00742 g004
Figure 5. Distribution of soil types in the city of Imzouren [56].
Buildings 12 00742 g005
Figure 6. Response spectra of the cities of Al Hoceima and Imzouren for each soil type: (a) Eurocode 8 response spectra Al Hoceima; (b) Eurocode 8 response spectra Imzouren; (c) RPS response spectra Al Hoceima and Imzouren.
Buildings 12 00742 g006aBuildings 12 00742 g006b
Figure 7. Distribution of building typologies in Al Hoceima and Imzouren of Central Rif [2].
Buildings 12 00742 g007
Figure 8. Examples of residential buildings in the study region.
Buildings 12 00742 g008
Figure 9. Inspected buildings in the city of Al Hoceima based on (a) seismic code and (b) construction period.
Buildings 12 00742 g009aBuildings 12 00742 g009b
Figure 10. Inspected buildings in the city of Imzouren based on (a) seismic code and (b) construction period.
Buildings 12 00742 g010aBuildings 12 00742 g010b
Figure 11. Distribution of column types for constructed models [39].
Buildings 12 00742 g011
Figure 12. Capacity spectra of buildings with seismic code built after 2002.
Buildings 12 00742 g012
Figure 13. Fragility curves for 4-floor RC building models.
Buildings 12 00742 g013
Figure 14. Damage distribution in the city of Al Hoceima following (a) the RPS2000 risk scenario and (b) the Eurocode 8 risk scenario.
Buildings 12 00742 g014
Figure 15. Damage distribution in the city of Imzouren following (a) the RPS2000 risk scenario and (b) the Eurocode 8 risk scenario.
Buildings 12 00742 g015
Table 1. Damage state thresholds.
Damage State ThresholdsDefinition β d s Damage State
S d ¯ 1 0.7 D y β S d 1 = 0.25 + 0.07 ln ( μ u ) Slight
S d ¯ 2 D y β S d 2 = 0.2 + 0.18 ln ( μ u ) Moderate
S d ¯ 3 D y + 0.25 ( D u D y ) β S d 3 = 0.1 + 0.4 ln ( μ u ) Severe
S d ¯ 4 D u β S d 4 = 0.15 + 0.5 ln ( μ u ) Complete
Table 2. Seismic acceleration values based on the national seismic standard [17].
Z a / Z v   Ratio   * 0 T 0.25 0.25 T 0.5 0.5 T
Z a Z v > 1 1.9   S · a g ** 1.9   S · a g 1.20   a g · S / ( T ) 2 / 3
Z a Z v = 1 2.5   S · a g ( 2.4   T + 3.1 )   S · a g
Z a Z v < 1 3.5   S · a g ( 6.4 T + 5.1 )   S · a g
*   Z a is the acceleration value and Z v is the velocity value corresponding to the seismic zone. ** S is the soil factor, having values displayed in Table 3.
Table 3. Ground types, according to Eurocode 8 [53] and the national seismic standard (RPS2000) [17].
Description of Stratigraphic ProfileEUROCODE 8National Seismic Code (RPS2000)
Ground Type V s ( m / s ) Soil Class V s ( m / s ) Soil Factor
Rock or other rock-like geological formationA>800S1 V s 760 1
Deposits of very dense sand, gravel, or very stiff clayB360–800S2360–7601.2
Deep deposits of dense or medium dense sand, gravel, or stiff clayC180–360S3180–3601.4
Deposits of a loose-to-medium cohesionless soil or predominantly soft-to-firm cohesive soilD<180S4<1801.8
A soil profile consisting of a surface alluvium layerE-S5--
Table 4. Construction material characteristics for defined periods [39].
Construction PeriodConcrete StrengthSteel Rebar
Period I (Pre 1991)16 MPaFe E 235
Period II (1991–2002)16 MPaFe E 400
Period III (Post 2002)22 MPaFe E 500
Table 5. Cross-sectional area of columns and adopted steel rebar for buildings with seismic code [39].
Cross-Sectional Area (cm2)Floor 1Floor 2Floor 3Floor 4Floor 5Floor 6
P130 × 3030 × 3025 × 3025 × 2525 × 2525 × 25
P230 × 4025 × 4025 × 4025 × 3025 × 3025 × 25
P330 × 4025 × 4025 × 4025 × 3525 × 3025 × 25
P445 × 4540 × 4035 × 3535 × 3530 × 3025 × 25
Steel rebarFloor 1Floor 2Floor 3Floor 4Floor 5Floor 6
P16T146T144T14 + 2T126T126T126T12
P28T146T146T144T14 + 2T124T14 + 2T126T12
P38T146T146T146T144T14 + 2T126T12
P48T168T168T148T146T146T12
Table 6. Cross-sectional area of columns and adopted steel rebar for buildings without seismic code [39].
Cross-Sectional Area (cm2)Floor 1Floor 2Floor 3Floor 4Floor 5Floor 6
P125 × 2525 × 2525 × 2520 × 2020 × 2020 × 20
P225 × 3025 × 3025 × 2525 × 2520 × 2020 × 20
P325 × 3025 × 3025 × 2525 × 2520 × 2020 × 20
P440 × 4035 × 3530 × 3025 × 3025 × 2520 × 20
Steel rebarFloor 1Floor 2Floor 3Floor 4Floor 5Floor 6
P14T124T124T124T104T104T10
P26T126T124T124T124T124T12
P34T14 + 2T126T124T124T124T104T10
P48T146T146T146T124T124T10
Publisher’s Note: MDPI stays neutral with regard to jurisdictional claims in published maps and institutional affiliations.

