1. Introduction
Liver cancer represents a significant global health burden, ranking as the sixth most diagnosed malignancy and the fourth leading cause of cancer-related mortality worldwide [
1,
2]. Liver hepatocellular carcinoma (LIHC), the predominant histological subtype of primary liver cancer, accounts for approximately 75–85% of cases. The clinical outcomes of patients with LIHC are highly heterogeneous, largely owing to its multifactorial etiology. The well-established risk factors include chronic hepatitis B or C viral infections, alcohol consumption, tobacco use, metabolic disorders, and environmental carcinogens [
3,
4,
5,
6]. The heterogeneity of LIHC, driven by diverse pathogenic factors, hinders accurate prognostication, highlighting the need for more precise models that incorporate molecular and immune-related characteristics [
7,
8,
9]. Although high-throughput sequencing and bioinformatics have enabled the discovery of various biomarkers, their clinical application remains limited, underscoring the need to integrate multidimensional molecular data.
Vacuolar protein sorting-associated protein 26A (VPS26A) is a core component of the retromer complex, a conserved multimeric protein assembly that mediates the retrograde trafficking of transmembrane proteins from endosomes to the trans-Golgi network. This process is essential for sorting and recycling various cargo proteins and is tightly linked to intracellular signaling, membrane homeostasis, and cellular differentiation processes [
10,
11,
12,
13]. Previous studies on VPS26A have primarily focused on its physiological and pathological roles in the nervous system. VPS26A facilitates the transition from stemness to differentiation in embryonic stem cells through the Nox4/ROS/ERK1/2 signaling cascade [
14]. Moreover, decreased VPS26A expression has been observed in Alzheimer’s disease, and its dysregulation contributes to abnormal amyloid precursor protein processing and tau phosphorylation, implicating it in the pathogenesis of neurodegeneration [
15,
16]. Despite the increasing evidence implicating VPS26A in neurobiology, its role in tumorigenesis remains poorly understood. Few studies have investigated the involvement of VPS26A in cancer development. A recent integrative bioinformatics analysis identified VPS26A as a potential prognostic marker for LIHC [
17]. However, comprehensive investigations of the expression patterns, prognostic significance, immune microenvironment associations, epigenetic regulation, and functional networks of VPS26A in cancer remain lacking. Given the crucial role of intracellular trafficking in oncogenic signaling, immune evasion, and therapeutic resistance, elucidating the role of VPS26A in cancer may offer novel insights into tumor biology and help identify new targets for intervention. This study aimed to systematically explore the expression landscape and clinical relevance of VPS26A in LIHC, specifically focusing on its prognostic value, correlation with immune infiltration, epigenetic modification, drug sensitivity, and the underlying molecular network. We propose that VPS26A functions as a regulator of tumor progression in LIHC, and may serve as a valuable biomarker for prognosis and therapeutic response.
The immune system plays a crucial role in modulating cancer progression [
18]. Previous studies have demonstrated that tumor-infiltrating immune cells (TIICs) can aid the host in countering the development of cancer [
19]. TIICs have emerged as a central focus in cancer research [
20]. The density and classification of TIICs are significantly associated with the clinical outcomes of tumors and the efficacy of immunotherapy [
21]. Numerous investigations have highlighted the characteristics of the immune response and its correlation with prognosis [
22]. The prognostic relevance of TIICs has been emphasized in the context of LIHC.
DNA methylation plays a pivotal role in cancer onset and advancement, primarily by silencing tumor suppressor genes through promoter hypermethylation and activating various oncogenes via promoter hypomethylation [
23,
24,
25,
26]. Previous studies have indicated that during the pathogenesis of hepatitis B virus-related liver cancer development, the dysregulation of critical DNA methylation enzymes, including DNA methyltransferases, results in the silencing of tumor suppressor genes and the activation of oncogenes, thereby facilitating liver cancer progression [
27,
28]. Several studies have focused on identifying the DNA methylation biomarkers of LIHC [
29,
30,
31]. Nevertheless, research examining the dynamic alterations in DNA methylation during LIHC progression remains limited.
Copy number variations (CNVs) in chromosomal segments, commonly referred to as aneuploidy, are prevalent in human cancers and have been identified as critical factors in the mechanisms underlying tumorigenesis [
32,
33]. Recent findings indicate that the loads of broad and focal CNVs exhibit differential correlations with gene expression markers associated with the key characteristics of cancer, including cell proliferation and immune evasion [
34,
35]. The interaction between the cancer genome and immune system may be influenced by a general gene dosage imbalance that governs specific genetic alterations. However, none of the cited studies, nor any other published research, have specifically investigated this phenomenon in the context of LIHC. This suggests that these alterations contribute to carcinogenesis through distinct mechanisms. Recent studies have indicated that the strength and orientation of the relationship between CNVs and tumor immunity may not be consistent across all cancer types [
36,
37,
38]. This highlights the necessity of examining the effects of aneuploidy within the specific context of tumor tissues.
MicroRNAs (miRNAs) are small, endogenous, noncoding, single-stranded RNA molecules that play crucial roles in regulating the expression of target genes at both the post-transcriptional and translational stages. Dysregulated expression of miRNAs has been commonly identified in genomic regions associated with cancer or in fragile sites across various human cancers, including LIHC, where such alterations have been noted in both cellular and tissue contexts [
39]. miRNAs have been associated with tumor prognosis, tumorigenesis, and tumor suppressors, as supported by several studies [
40,
41,
42]. Research indicates that miRNAs display dysregulated expression patterns in LIHC and play a significant role in its growth, development, and metastasis by acting as either oncogenes or tumor suppressors [
43]. Nevertheless, the underlying mechanisms and relationships between miRNAs and the pathogenesis of LIHC across different etiological contexts remain unclear [
44].
Drug therapy remains a cornerstone in the treatment of numerous patients with cancer, as it can markedly enhance survival rates and elevate quality of life [
45,
46]. Recently, an improved understanding of the molecular biology of hepatocarcinogenesis and rapid advancements in diagnostic techniques have led to the approval of multiple drugs for advanced LIHC. Drug sensitivity tests have been successfully used in assay-guided chemotherapy for certain cancers. Nevertheless, the emergence of resistance to antineoplastic agents owing to genetic mutations and various nongenetic factors poses a significant challenge that restricts the effectiveness of treatment [
47,
48,
49,
50]. Increasing clinical evidence indicates that both intrinsic and acquired drug resistance in tumors is linked with genetic and epigenetic modifications.
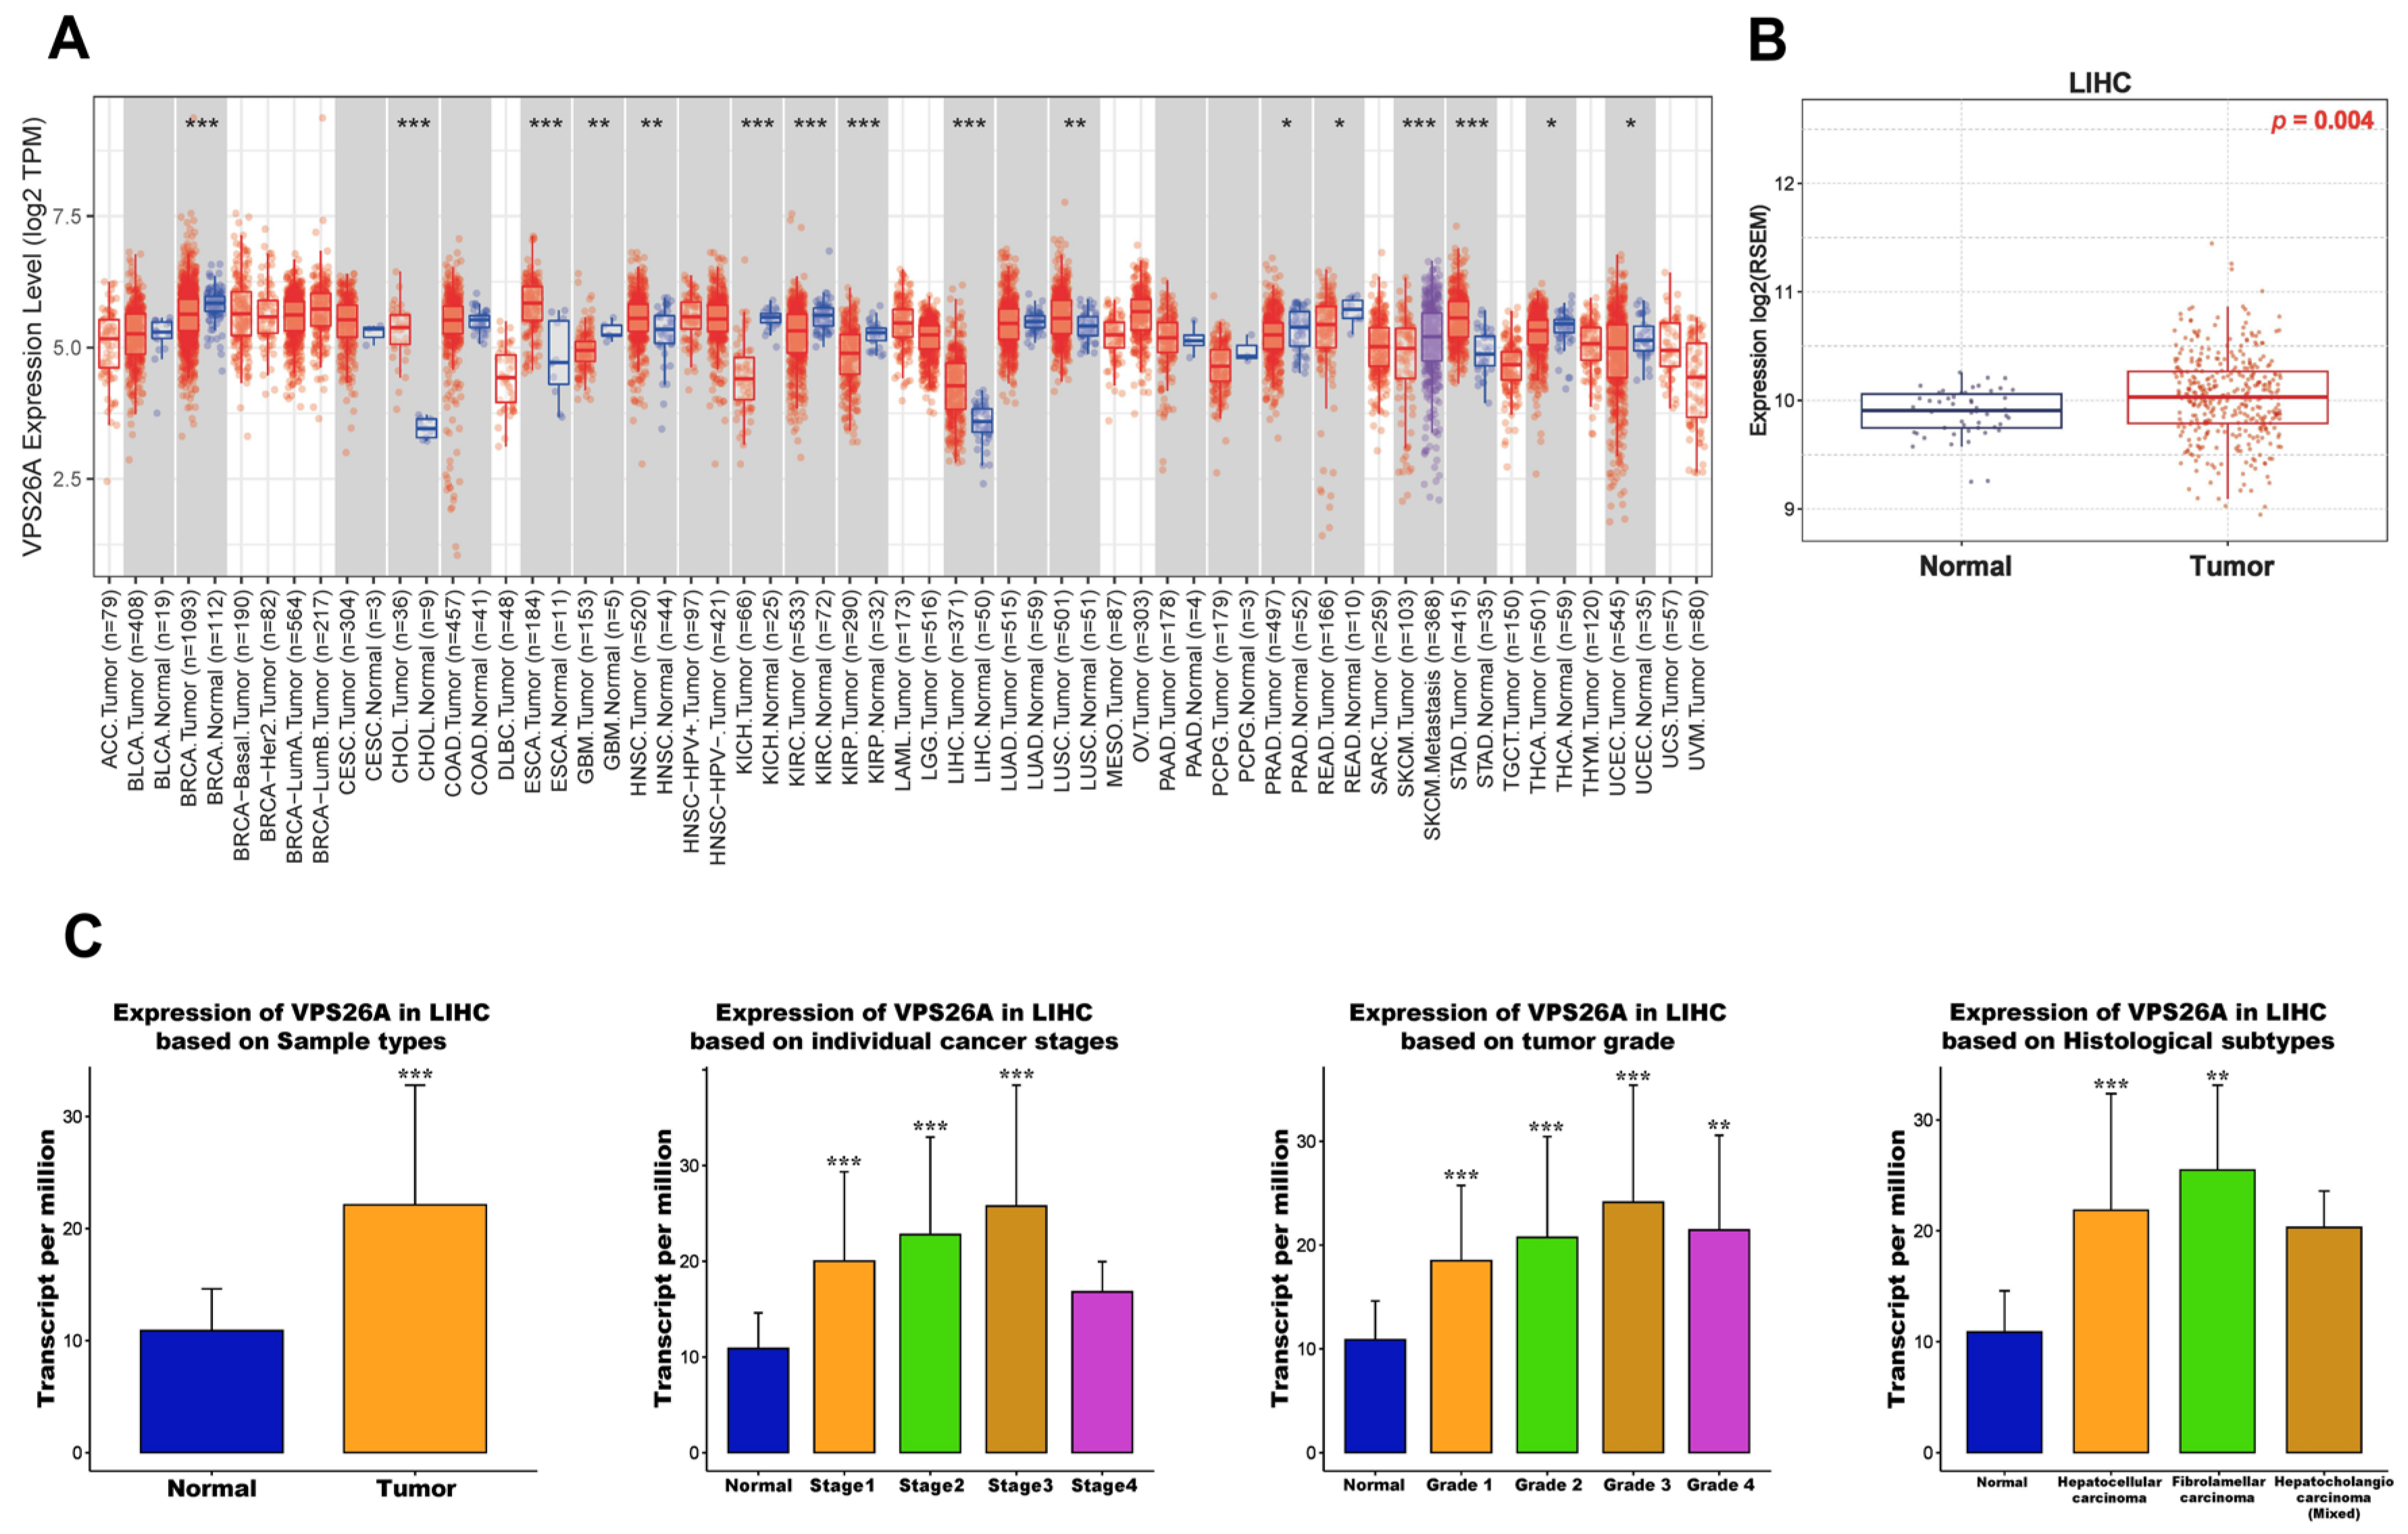
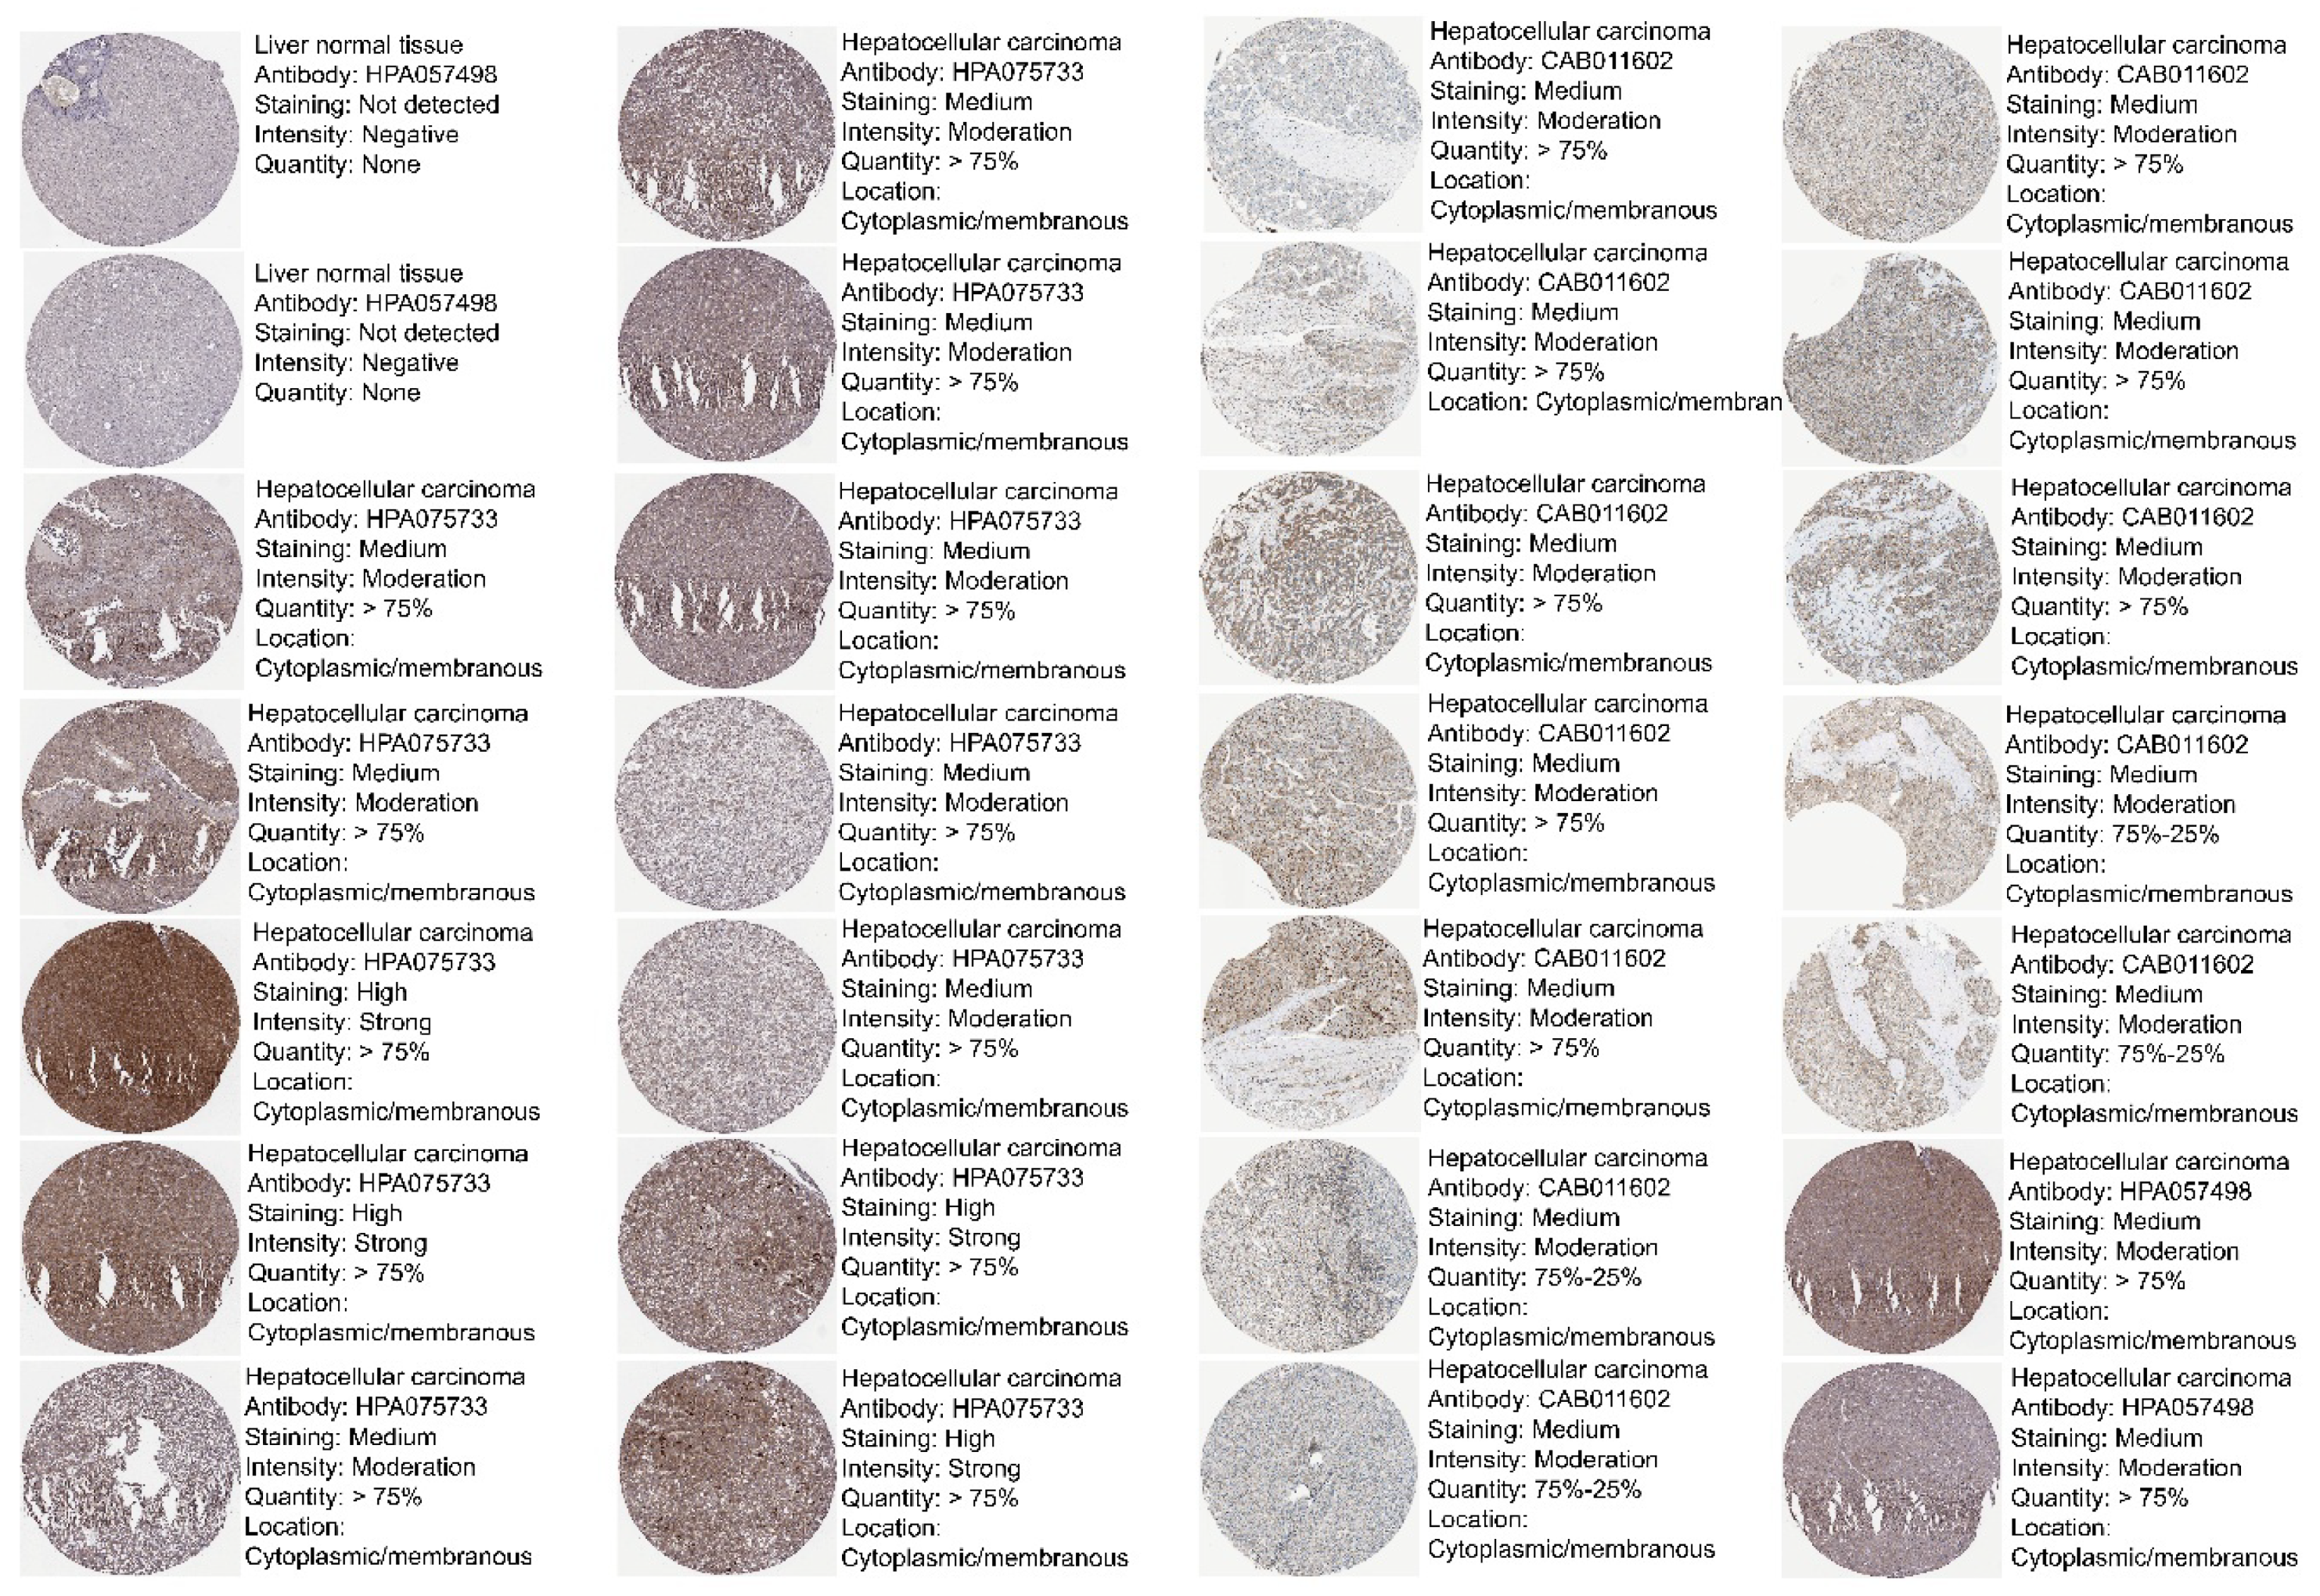
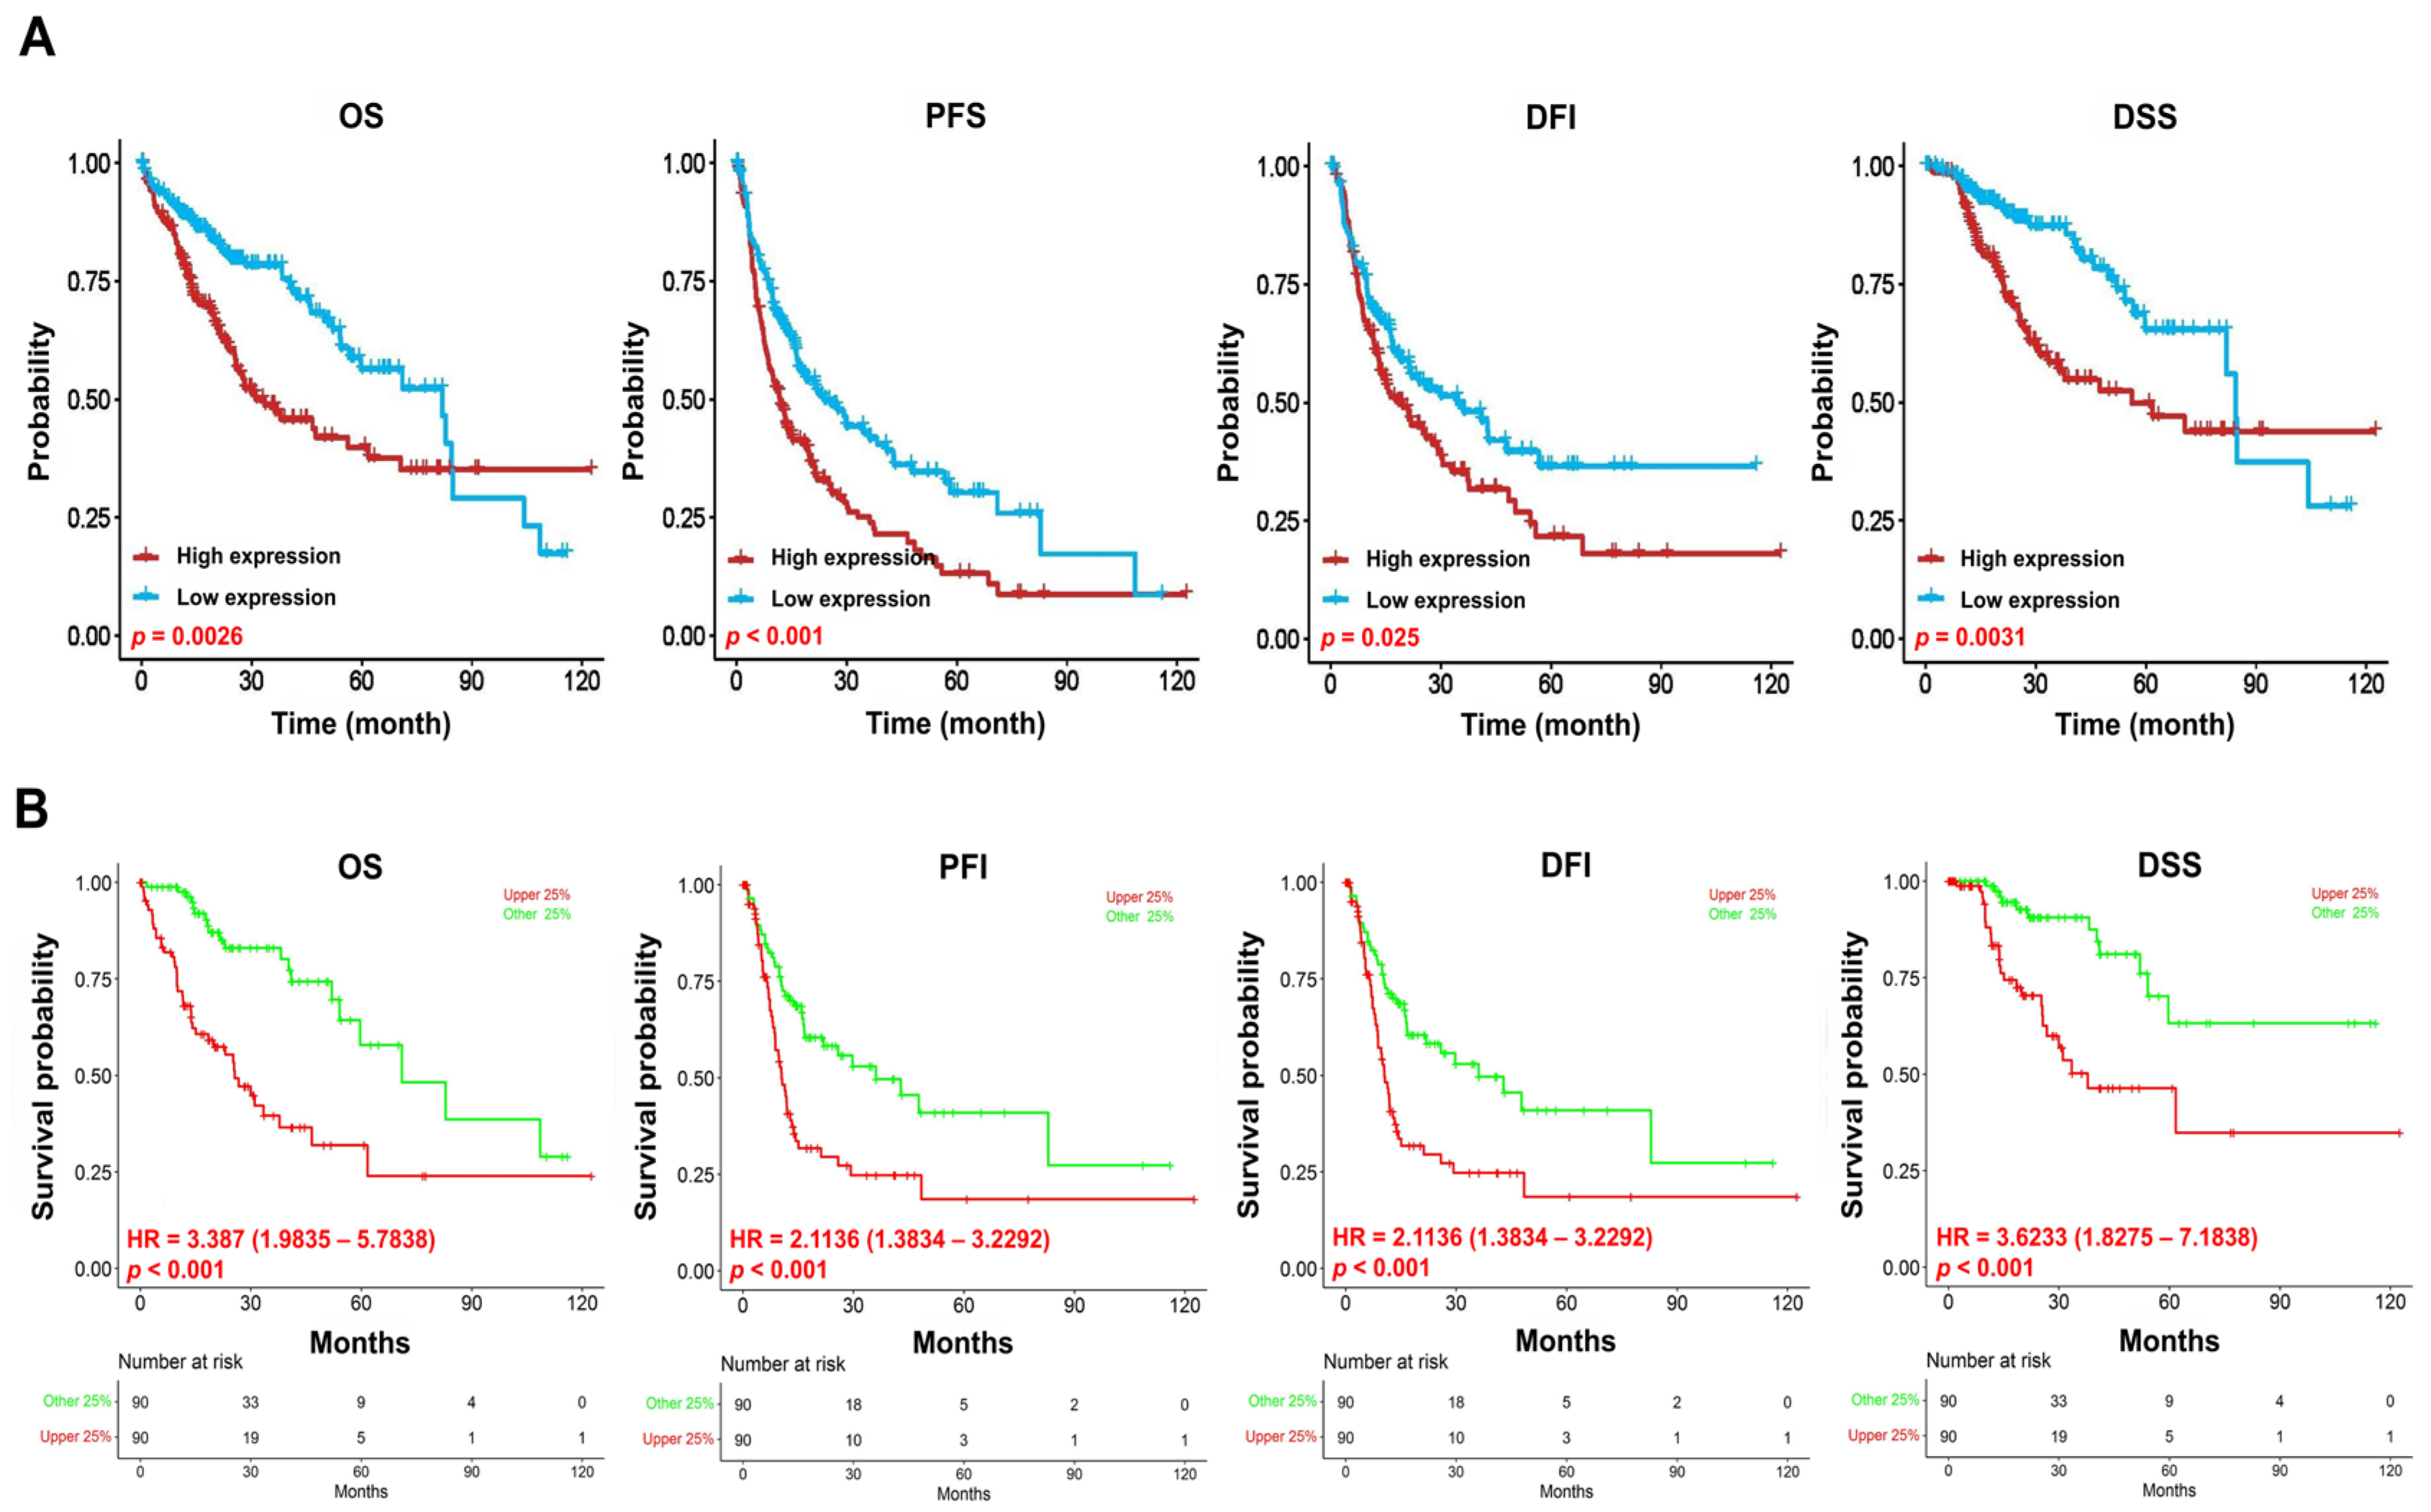
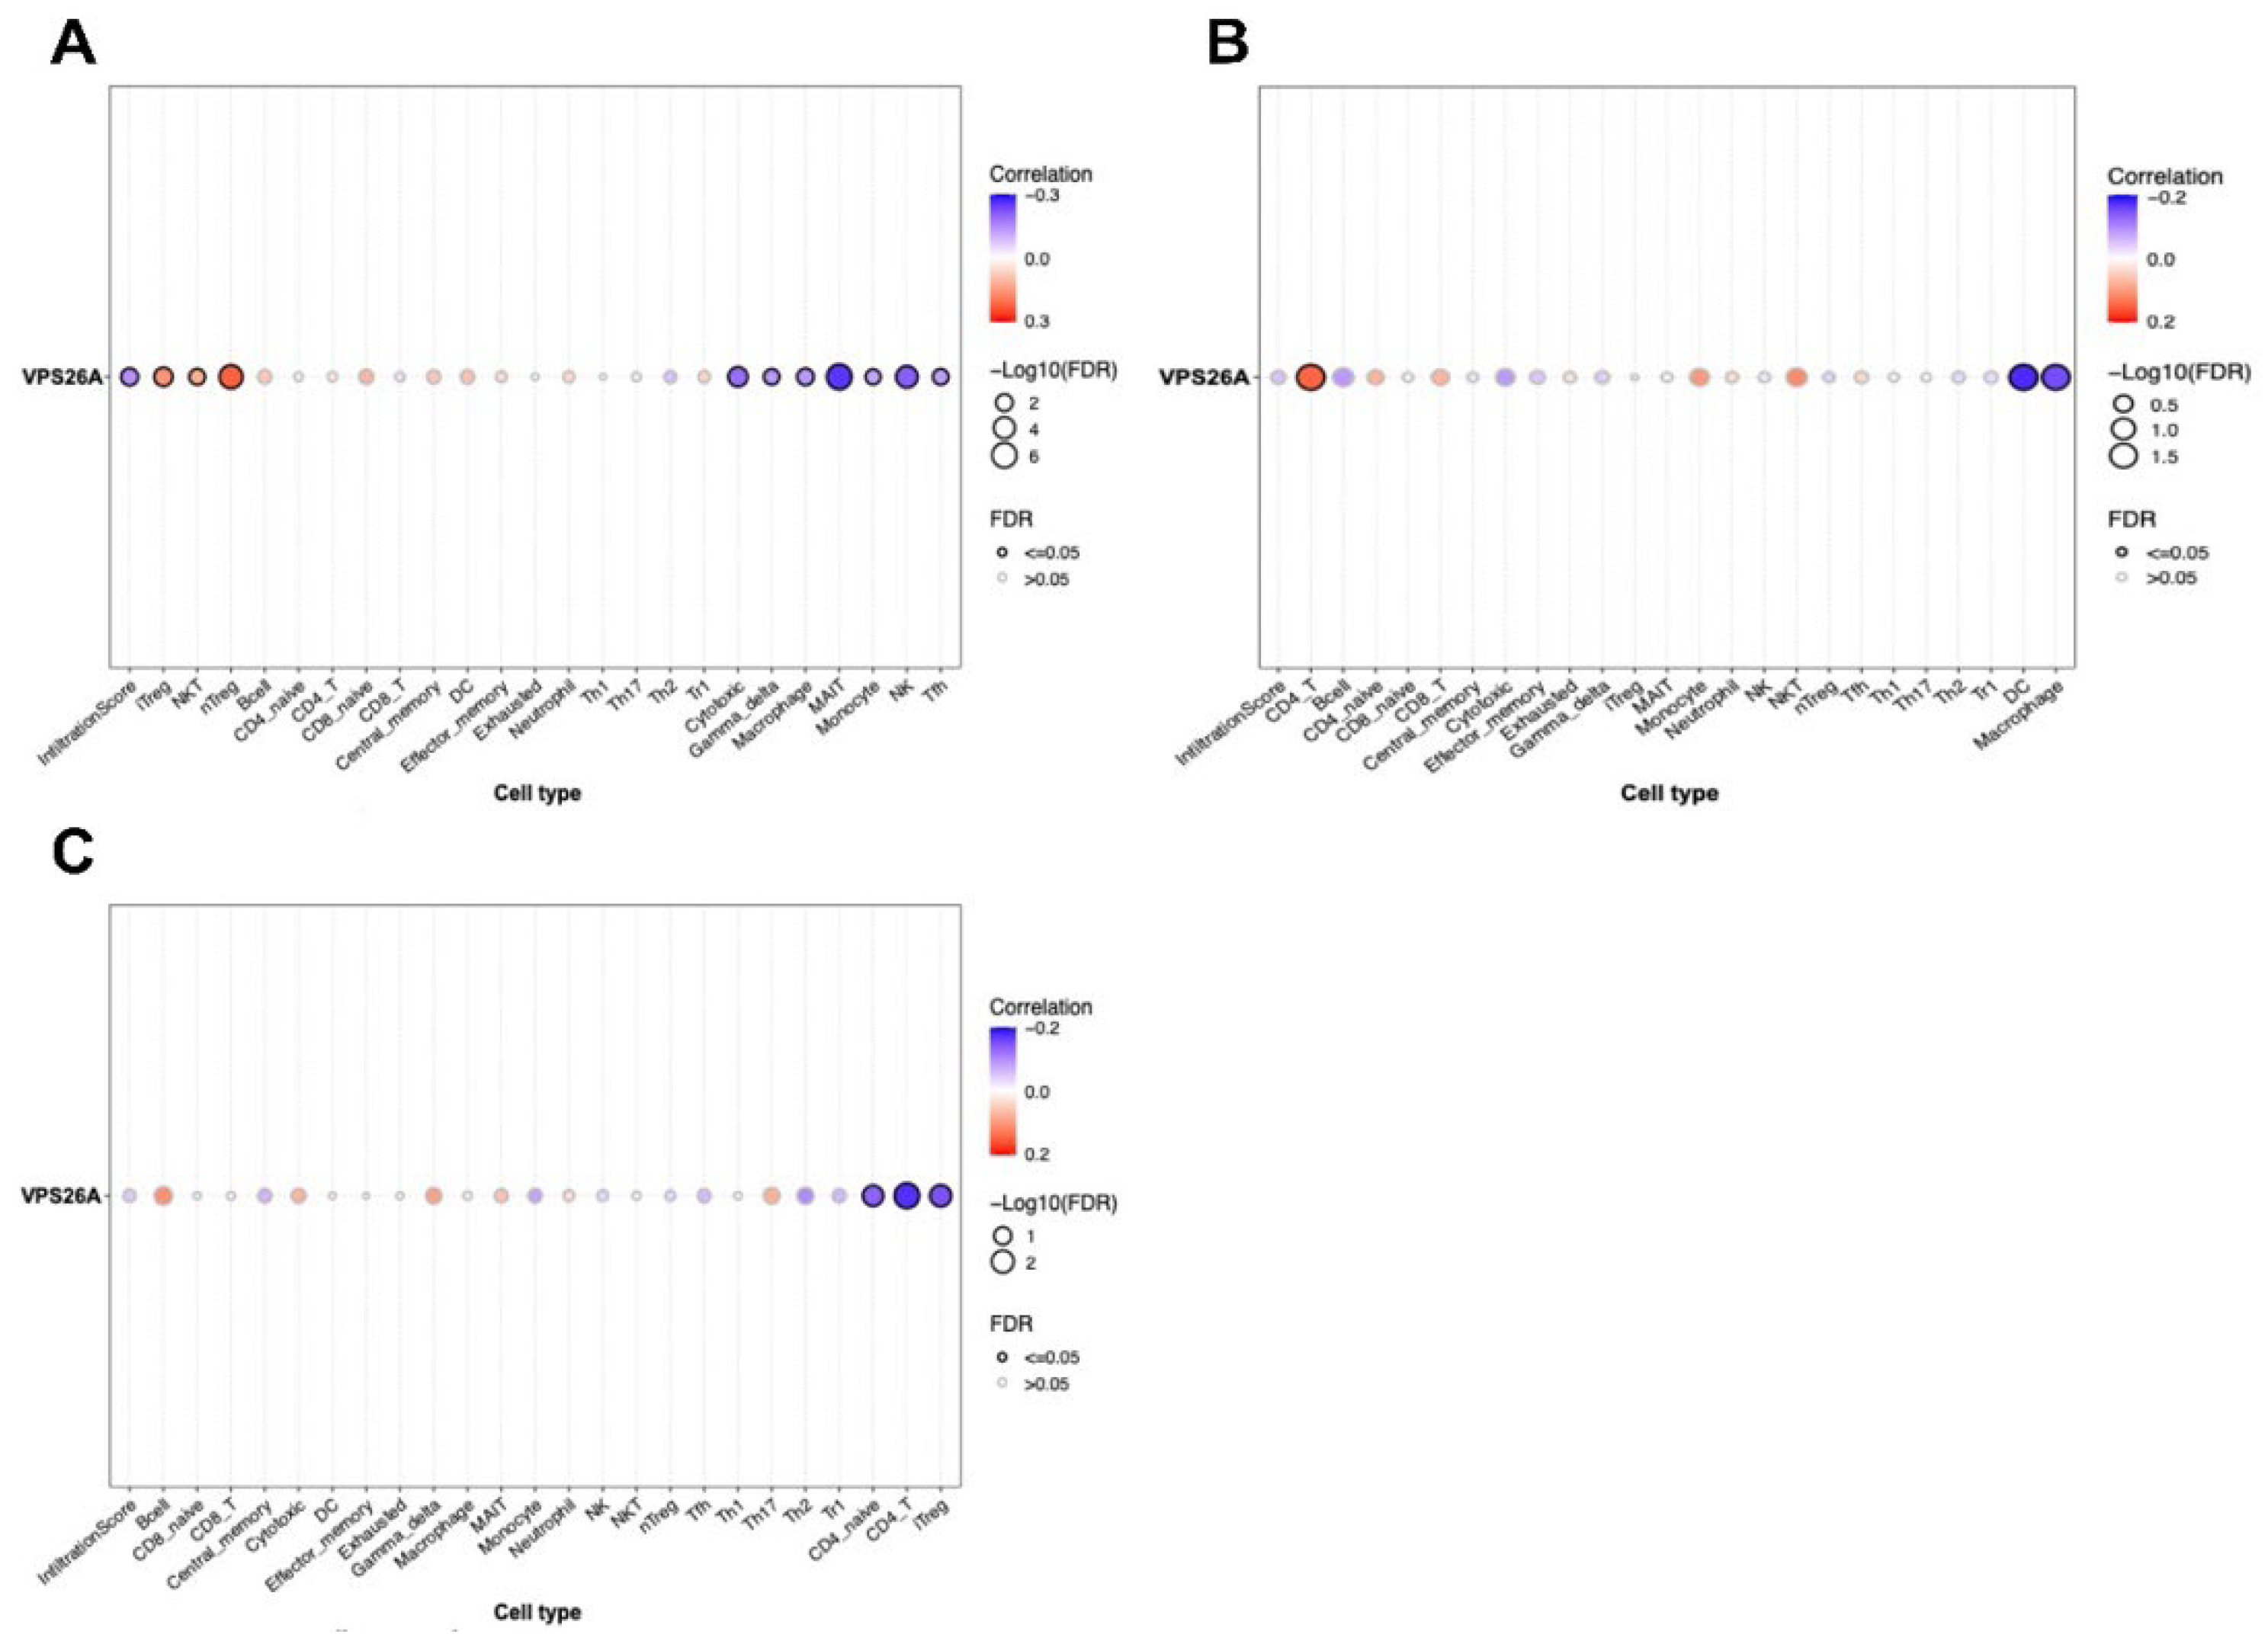
In the present study, we comprehensively analyzed VPS26A expression in LIHC. Using an integrative bioinformatics approach, we evaluated VPS26A expression across various cancer types and confirmed its significant upregulation in LIHC at both mRNA and protein levels. Furthermore, we investigated the prognostic significance of VPS26A expression and demonstrated its association with poor prognosis across multiple subgroups. To elucidate the biological role of VPS26A in LIHC, we investigated its association with tumor-infiltrating immune cells and identified distinct immunological patterns, suggesting its involvement in modulating the tumor immune microenvironment. We found that VPS26A expression was influenced by both promoter and regional DNA methylation, underscoring its complex epigenetic regulation. Drug sensitivity profiling suggested that VPS26A could serve as a predictive biomarker of therapeutic responses. Further, co-expression and functional enrichment analyses demonstrated that VPS26A was closely associated with several oncogenic signaling pathways, including the PI3K/AKT and Wnt cascades. Collectively, these findings reveal that VPS26A is consistently overexpressed in LIHC and is functionally associated with tumor progression, immune regulation, and therapeutic responsiveness. We suggest that VPS26A functions as a multifaceted regulator of LIHC and has the potential as a biomarker for its diagnosis, prognosis, and therapeutic stratification. Overall, this study established a foundational framework for subsequent mechanistic studies and emphasized the potential clinical significance of targeting VPS26A for treating LIHC.
4. Discussion
Liver hepatocellular carcinoma (LIHC), the most common primary malignancy of the liver, remains a major global health challenge because of its high incidence, aggressive clinical behavior, and poor prognosis. Currently, surgical resection is considered the cornerstone of curative therapy for LIHC and is frequently complemented by chemotherapy, radiotherapy, molecular targeted agents, interventional techniques, and traditional medicine in a multidisciplinary setting [
71]. Despite progress in comprehensive treatment techniques, the prognosis of LIHC remains poor with a 5-year survival rate of <20%, which is mainly attributed to the high recurrence rate [
72,
73]. Therefore, identifying potential biomarkers to improve the prognosis of patients with LIHC is necessary. This poor outcome is primarily because of the high rate of tumor recurrence and intrahepatic metastasis following the initial treatment. These challenges highlight the critical unmet need for improved prognostic tools and novel therapeutic targets that can support early diagnosis, predict disease progression, and inform personalized treatment strategies. Our findings highlight the significance of identifying biomarkers that can facilitate early diagnosis, monitor treatment responses, and predict clinical outcomes in patients with LIHC.
In recent years, the retromer complex has been documented to exhibit a wide array of functions. It is involved in receptor recycling, endosomal tubule dynamics, and the modulation of the actin cytoskeleton [
74,
75]. This retromer has been implicated in apoptosis [
76], mitochondrial membrane dynamics, and Parkinson’s disease [
77,
78]. Our investigation underscores that VPS26A is a critical component of the retromer complex, which plays a crucial role in endosomal protein sorting and receptor recycling. This positions VPS26A as a potential biomarker for LIHC. Although alterations in other retromer components, such as VPS35 and VPS29, have been associated with cancer and neurodegenerative diseases [
79], the role of VPS26A in malignancies, particularly LIHC, has not been thoroughly examined.
In the present study, we evaluated the potential prognostic value of VPS26A by analyzing its association with clinicopathological features and TIICs in LIHC. VPS26A has been identified as a potential prognostic gene; however, its expression and functional roles in LIHC remain unclear. In this study, bioinformatics analyses using various databases demonstrated that both the mRNA and protein expression levels of VPS26A were significantly elevated in LIHC. Furthermore, VPS26A expression was found to correlate with the histological type and tumor stage simplified in LIHC. Prognostic analyses also demonstrated that VPS26A expression had great value for LIHC diagnosis and that VPS26A upregulation was associated with poor prognosis in LIHC. These findings suggest that VPS26A may serve as a valuable biomarker for LIHC diagnosis and prognosis. Notably, combining VPS26A with conventional biomarkers such as alpha-fetoprotein (AFP) could improve diagnostic sensitivity and specificity, particularly in early-stage LIHC or in AFP-negative patients. This combinatorial approach may enhance the clinical applicability of VPS26A and contribute to the development of multi-marker-based precision diagnostic strategies.
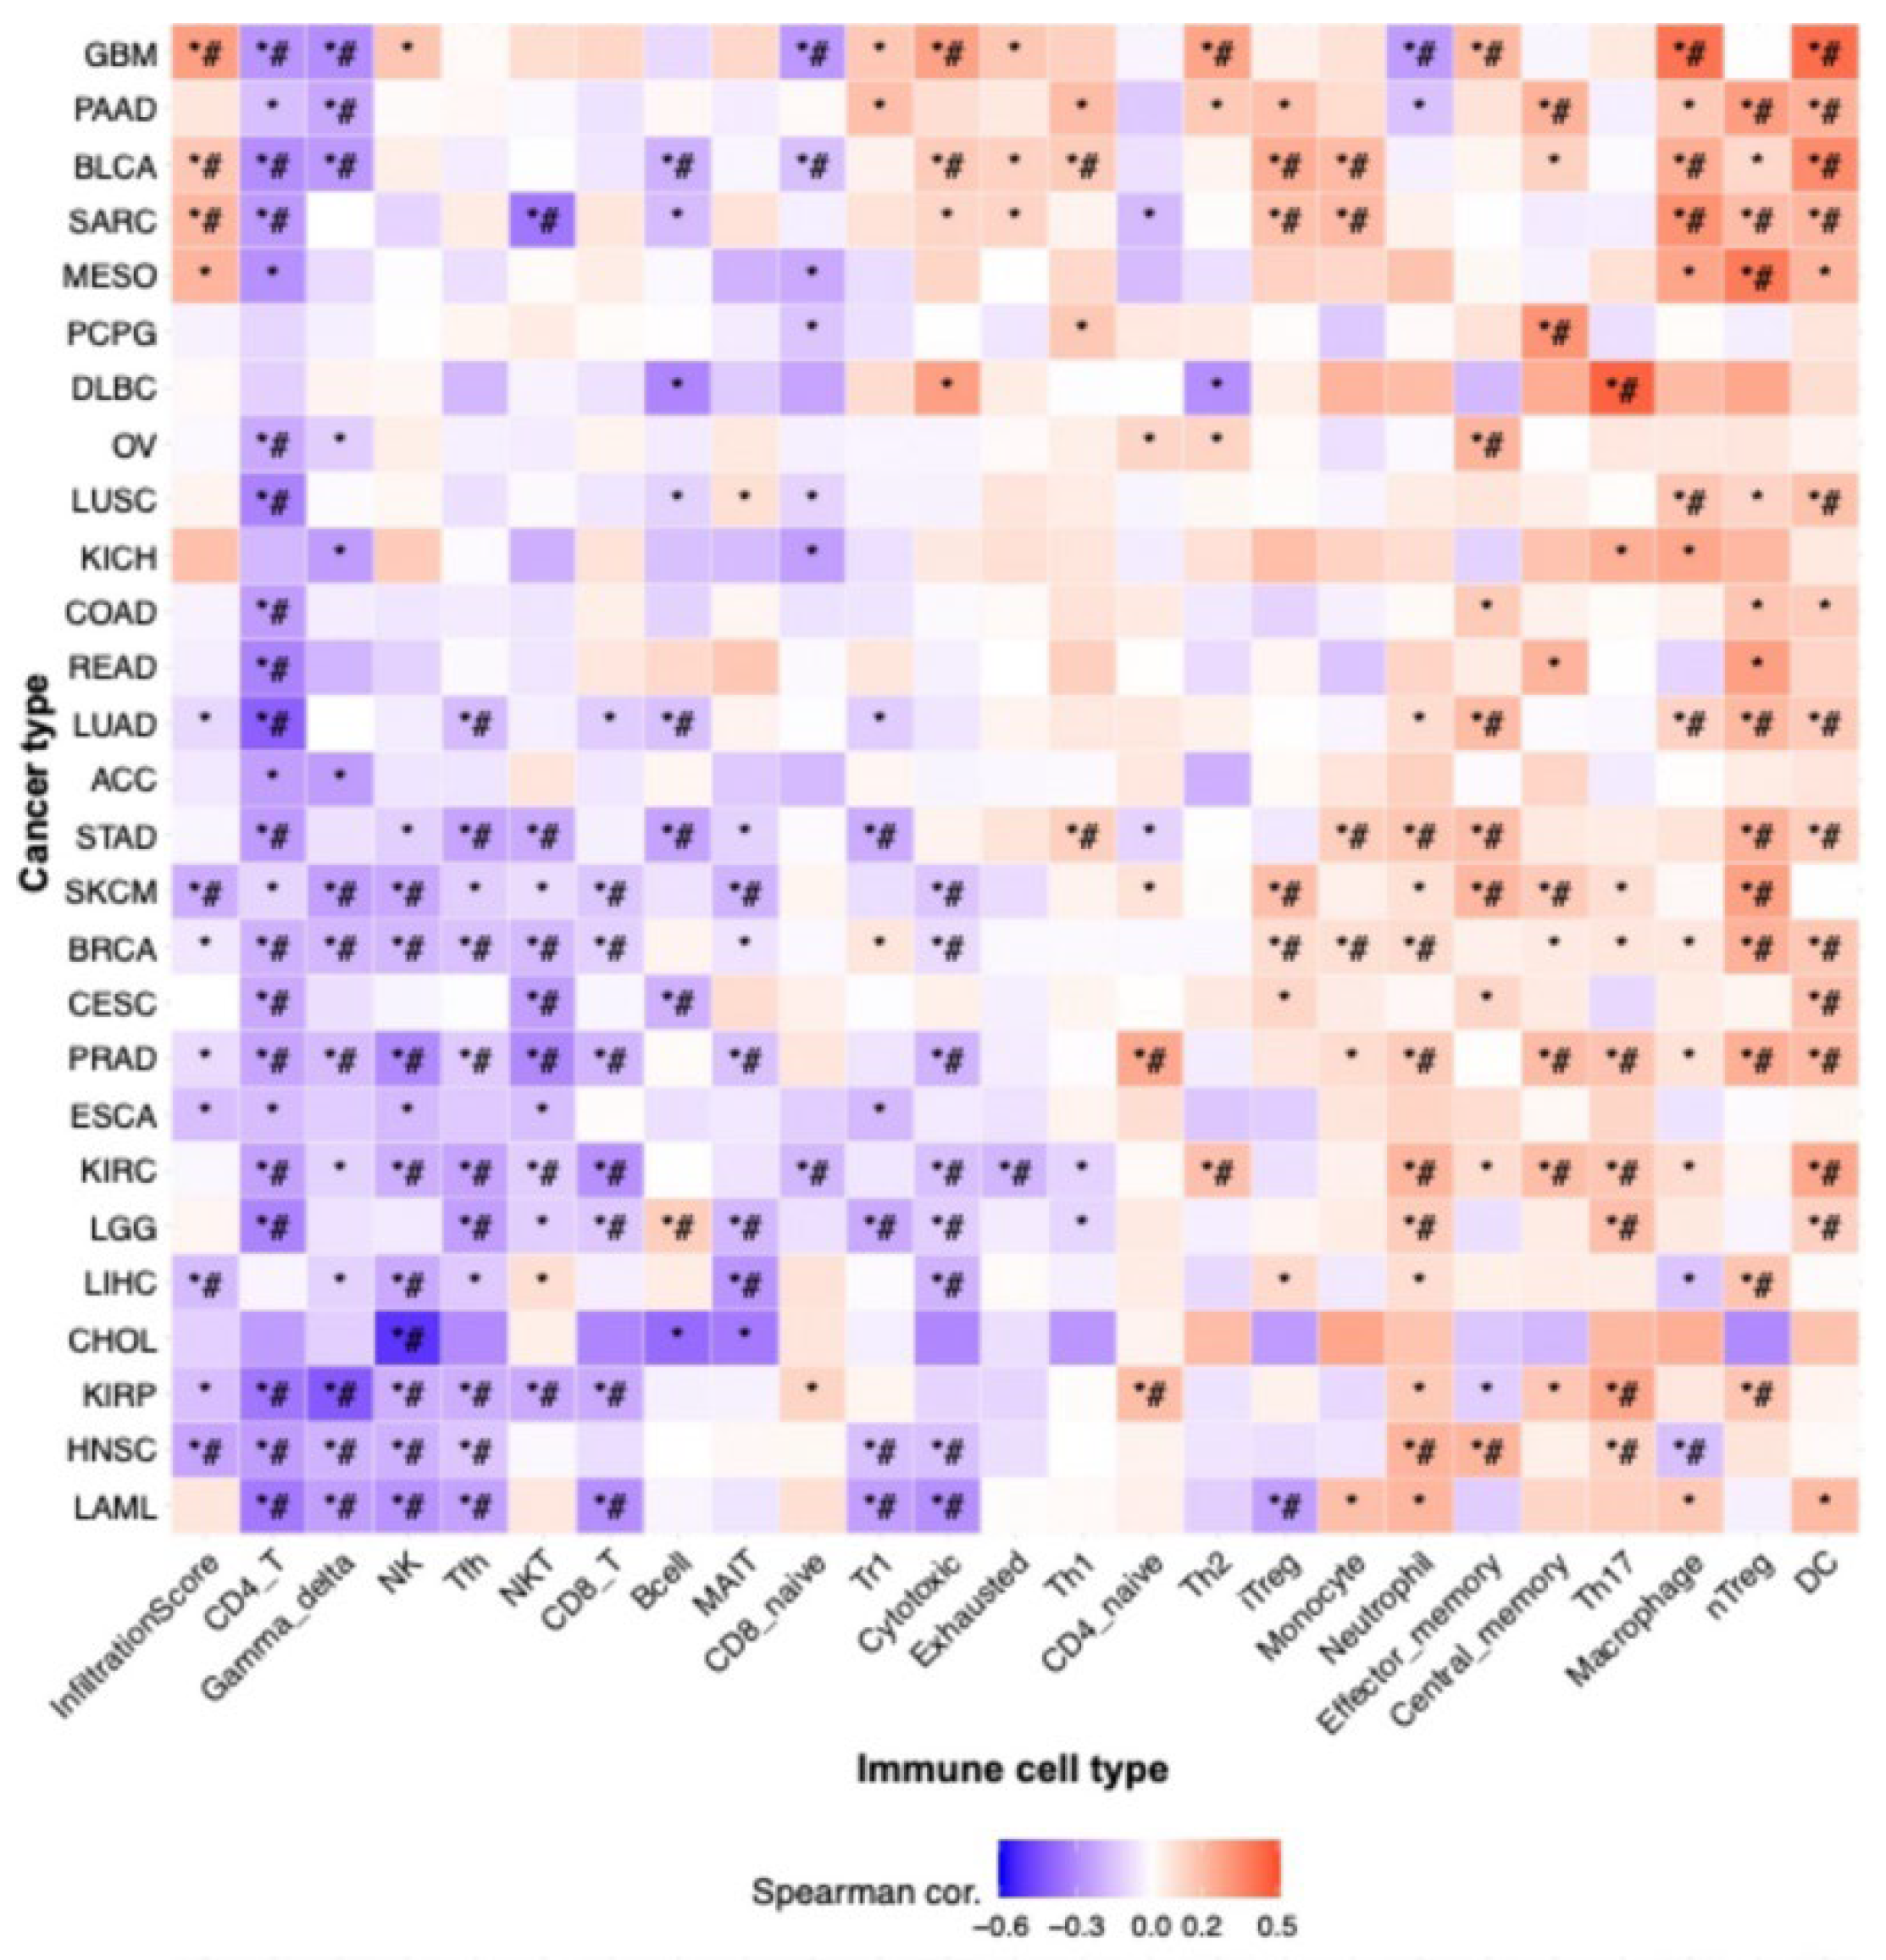
The immune system plays a crucial role in modulating cancer progression [
18]. TIICs have emerged as a central focus in cancer research [
20]. Several studies have highlighted the characteristics of the immune response and its correlation with prognosis [
22]. The prognostic relevance of TIICs in LIHC has been notably emphasized. TIICs have been shown to correlate with disease outcomes, leading to the growing recognition of their potential as prognostic markers [
80]. Our findings regarding TIICs in LIHC indicated that the expression of VPS26A correlated with various TIICs. These findings suggest that VPS26A may help establish an immune-tolerant TME in advanced LIHC, contributing to poor prognosis and immunotherapy resistance. Its strong link with immunosuppressive TIICs highlights its potential as a biomarker for stratifying patients for immunotherapy.
CNVs are recognized as a defining characteristic of cancer. CNVs have been found to correlate with LIHC stage and prognosis [
81,
82,
83] and are associated with infections caused by hepatitis B or C viruses [
84]. Pan-cancer investigations have identified both broad and focal CNV burdens as genomic attributes that can influence tumor immune infiltration and exclusion across various cancer types. Nonetheless, the interpretation of CNVs in LIHC within a diagnostic context remains problematic, primarily owing to the absence of a consensus regarding the relationship between CNVs and clinicopathological characteristics. CNVs and DNA methylation of VPS26A were found to be associated with variations in TIICs.
DNA methylation plays a pivotal role in cancer and several studies have outlined the use of methylated DNA loci as cancer detection markers, focusing mainly on gene promoter markers [
85,
86]. Some epigenetic markers hold significant promise for the early detection of cancers because they play a crucial role in the initiation of carcinogenic pathways [
87,
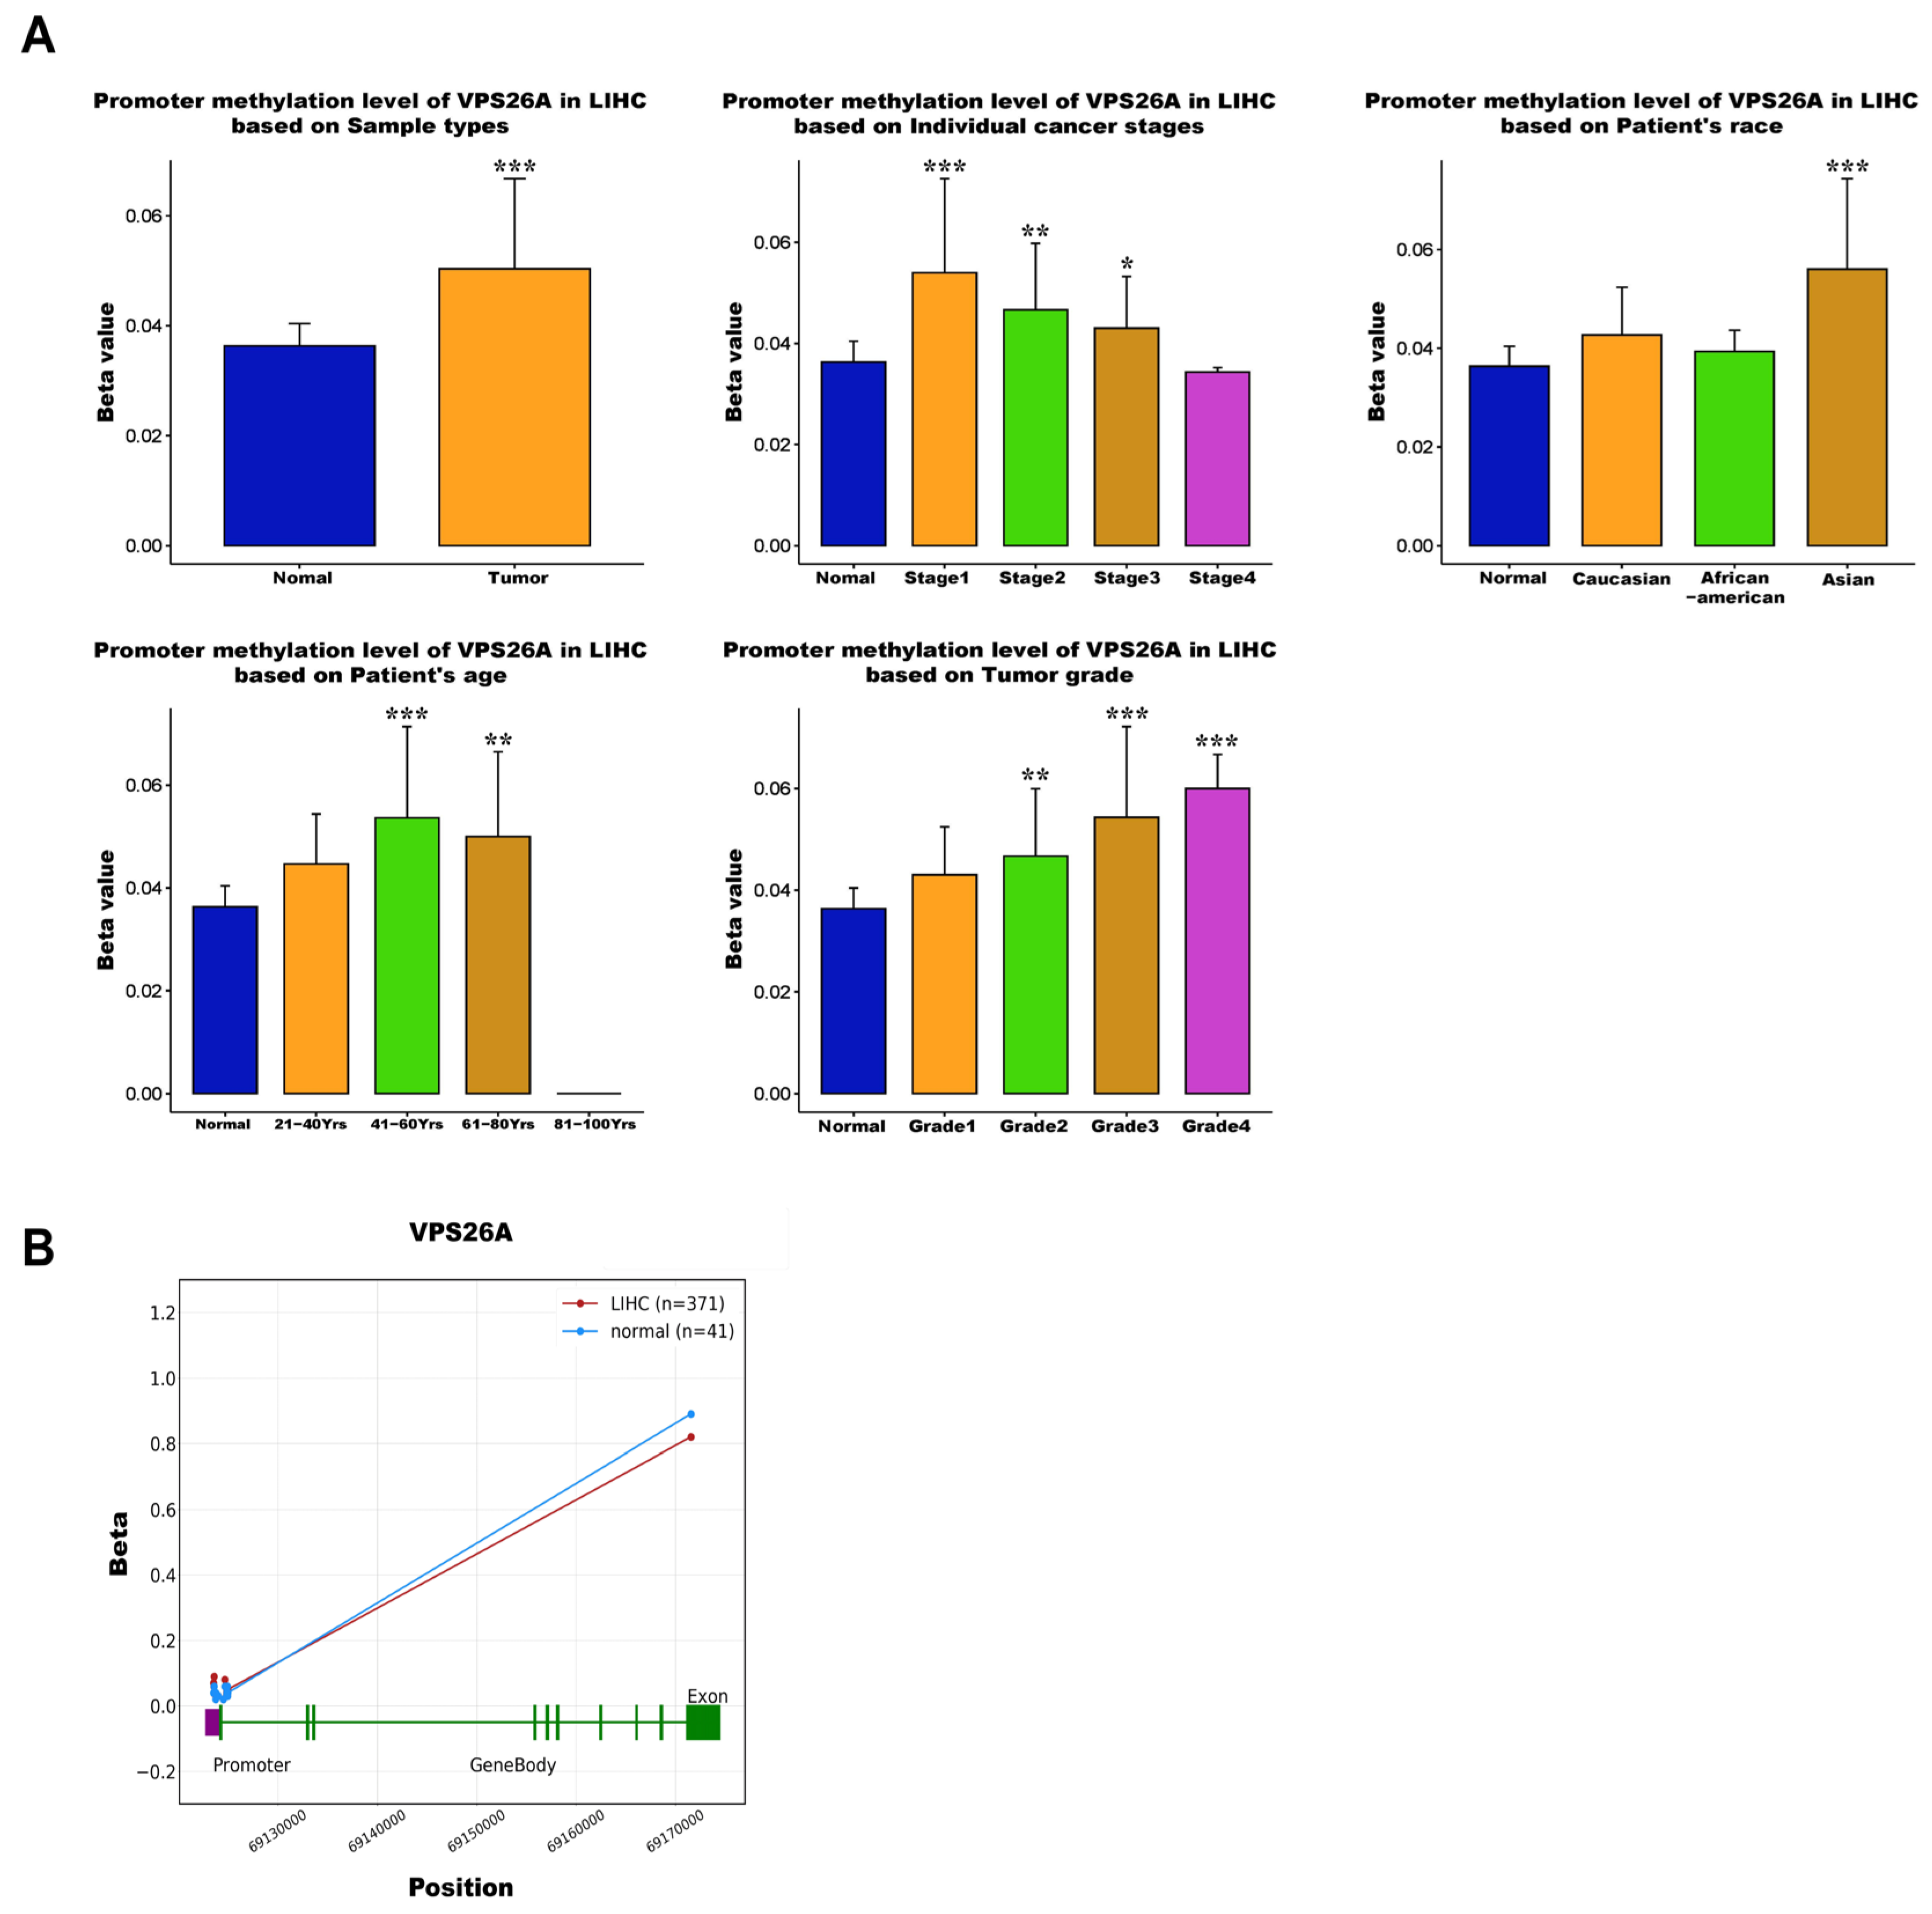
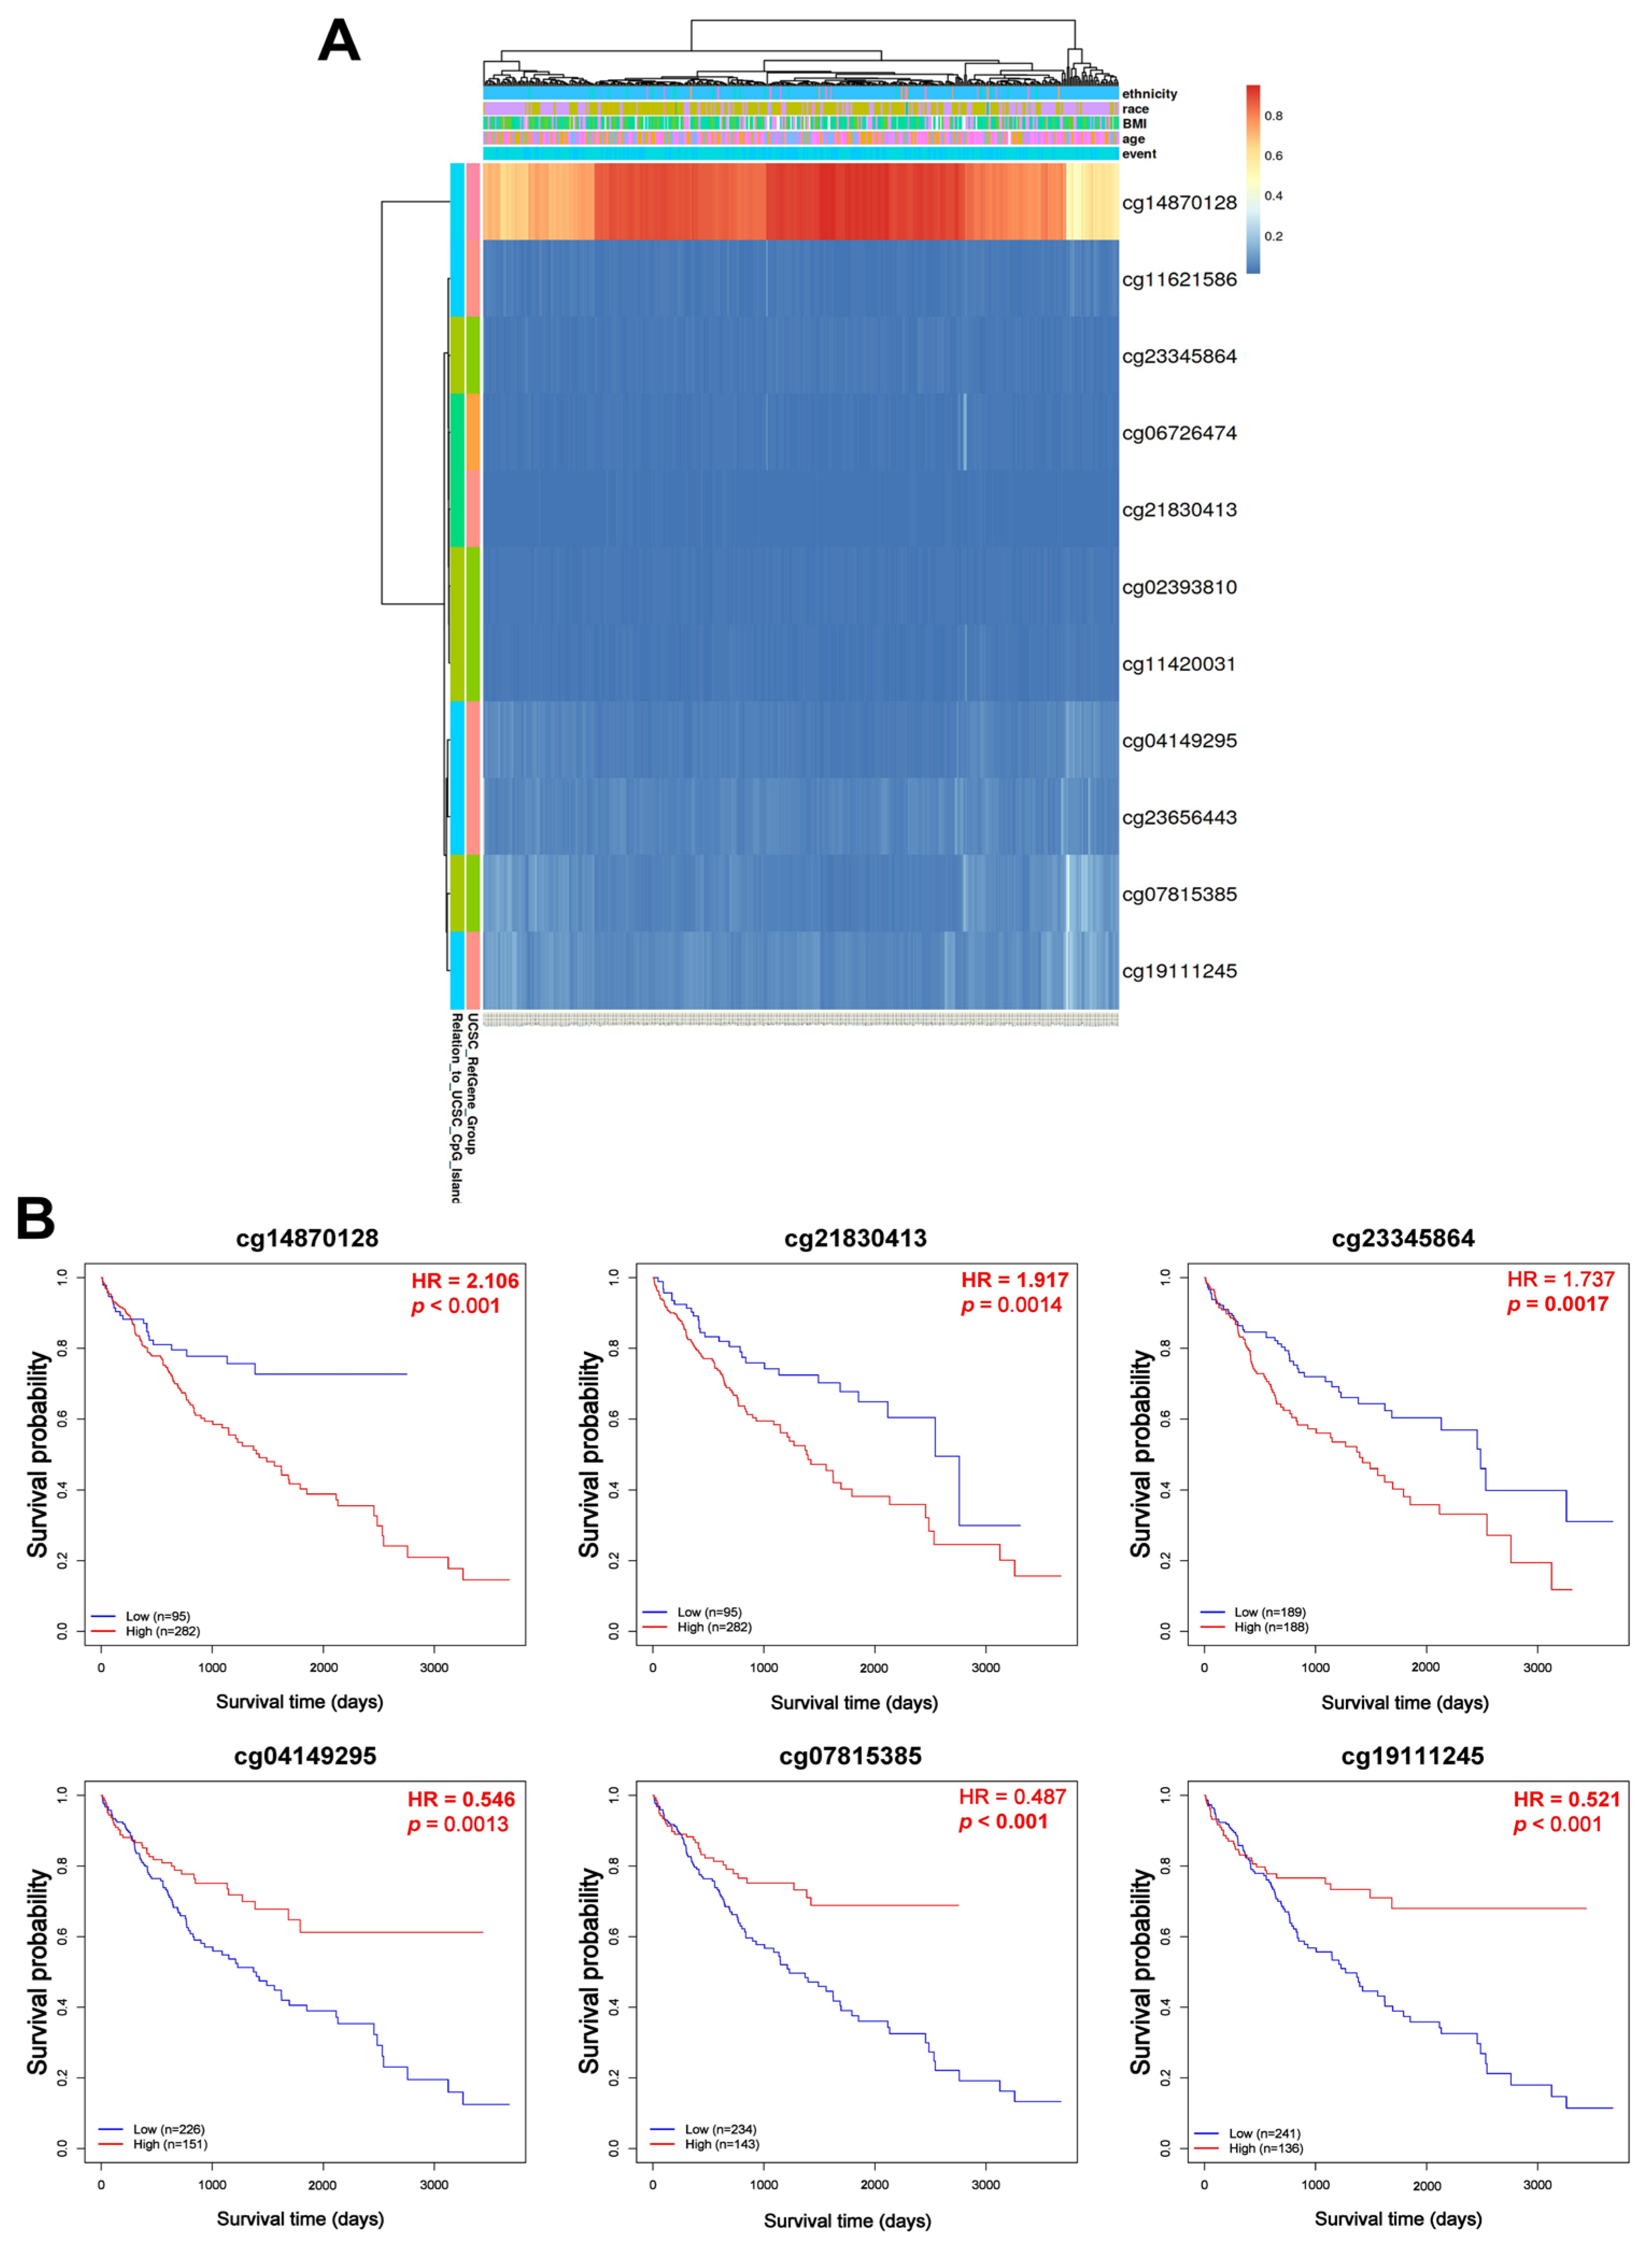
88]. Consequently, epigenetic biomarkers show considerable potential for broad application as early diagnostic indicators. Our investigation revealed that the promoter hypomethylation of VPS26A was prevalent in LIHC and was significantly correlated with elevated gene expression. Importantly, this hypomethylation pattern appeared to be influenced by various clinicopathological parameters, including race, age, tumor stage, and tumor grade. These results reinforce the hypothesis that the epigenetic deregulation of VPS26A represents an early and progressive event in LIHC pathogenesis. Site-specific methylation analysis of VPS26A revealed its prognostic significance. Both hypermethylated and hypomethylated probes located within the promoter and exon regions of VPS26A were associated with poor survival. Hypermethylated probes such as cg14870128, cg21830413, and cg23345864 were significantly correlated with an elevated risk of mortality. Similarly, hypomethylated probes such as cg04149295 and cg07815385 were associated with poor prognosis.
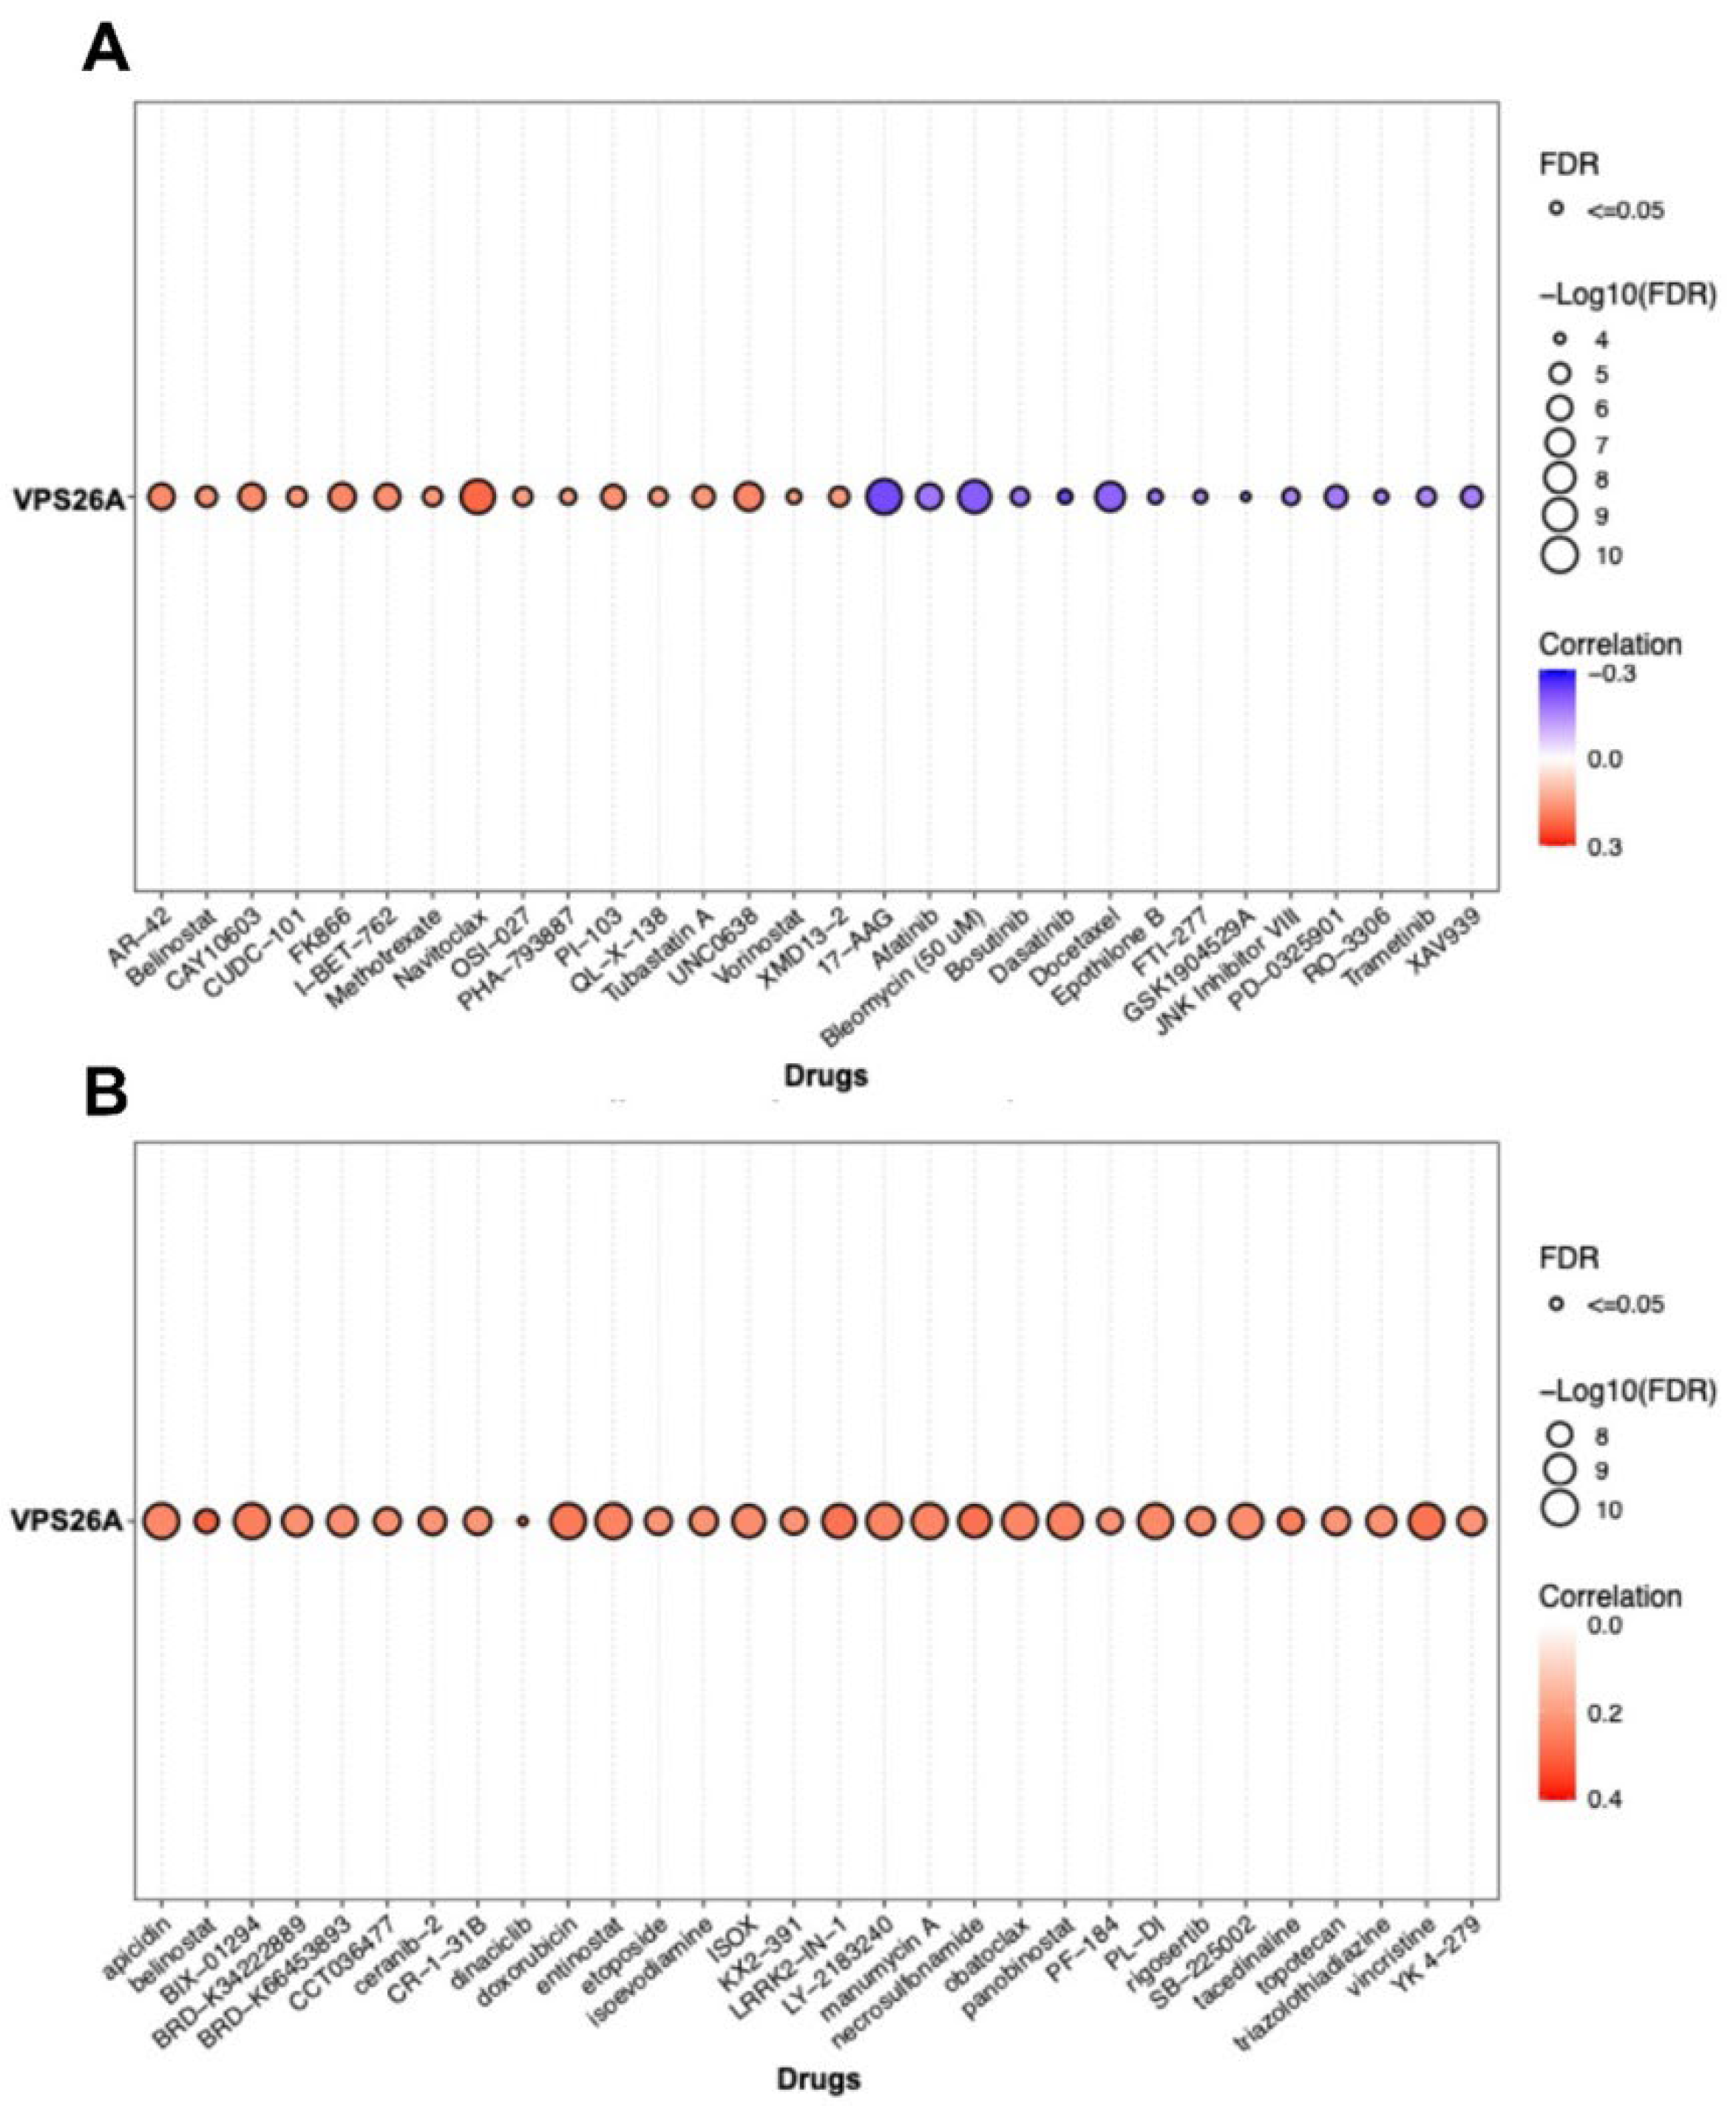
Recent advancements in our understanding of the molecular mechanisms underlying hepatocarcinogenesis coupled with rapid progress in diagnostic methodologies have led to the approval of several therapeutic agents for advanced LIHC. Drug sensitivity assays have been effectively employed in assay-guided chemotherapy for specific malignancies. However, the development of resistance to antineoplastic therapies driven by genetic mutations and various nongenetic factors presents a significant challenge that limits treatment efficacy. This study examined the association between VPS26A expression and drug response in LIHC and found a positive correlation between VPS26A expression and sensitivity to various anticancer agents. Specifically, compounds such as AR-42, belinostat, CAY10603, CUDC-101, FK866, I-BET-762, methotrexate, navitoclax, OSI-027, PHA-793887, OU-103, QL-X-138, tubastatin, UNC0638, vorinostat, and XMD13-2 showed significant positive correlations with VPS26A expression. Conversely, a negative correlation was identified between VPS26A expression and sensitivity to drugs like17-AAG, afatinib, bleomycin, bosutinib, dasatinib, docetaxel, epothilone B, FTI-277, GSK1904529A, JNK inhibitor VIII, PD-0325901, RO-3306, trametinib, and XAV939. These findings suggest that VPS26A plays a crucial role in modulating cellular responses to a diverse array of anticancer agents, underscoring its potential as a predictive biomarker of drug sensitivity in LIHC.
Furthermore, we explored the influence of chemical compounds on the expression of VPS26A. The investigation identified 82 chemicals associated with VPS26A, of which 59 were predicted to enhance its expression, and 23 were linked to its downregulation. Furthermore, the top 20 gene–chemical interactions involving VPS26A were identified, revealing significant correlations with several genes. Notably, VPS26A was strongly associated with genes such as VPS35, GCN1, VTI1B, UFM1, and VPS29. These findings suggest that VPS26A is part of a chemically responsive network that includes key components involved in vesicular trafficking, stress response, and protein sorting. Furthermore, we conducted a systematic examination of the chemical interaction landscape of VPS26A in LIHC, leveraging data from the CTD to identify agents that may affect VPS26A expression. The findings indicated the presence of 82 chemicals with predicted regulatory effects on VPS26A, comprising 59 compounds that upregulate and 23 agents that downregulate VPS26A expression. These interactions provide novel insights into the chemically modifiable characteristics of VPS26A, suggesting its potential involvement in broader regulatory networks that may influence tumor progression and treatment responses in LIHC.
Genes exhibiting strong positive correlations with VPS26A, including DDX50, AP3M1, SMNDC1, RUFY2, and PPP3BX, have been recognized for their roles in RNA metabolism, vesicle transport, and cell division. In contrast, the genes with negative correlations, such as ECHDC2, DHRS3, and AKR7L, are primarily associated with metabolic detoxification and redox regulation. The genes co-expressed with VPS26A are significantly implicated in G2/M phase transition, RNA localization, chromosomal segregation, and spindle organization, all of which are critical for cell proliferation and genomic stability. Furthermore, enrichment analyses of KEGG pathways, including spliceosomes, RNA transport, Wnt signaling, and Hedgehog signaling, suggest that VPS26A may influence oncogenesis by modulating the transcriptional machinery and developmental signaling pathways. Findings from the co-expression and enrichment analyses indicate that VPS26A occupies a central position within the transcriptional network that regulates critical oncogenic processes in LIHC.
We investigated the prognostic significance of genes co-expressed with VPS26A in patients with LIHC. Specifically, among the genes that positively correlated with VPS26A, 31 were associated with a high HR for OS, whereas 13 showed a high HR for DFS. In contrast, 10 of these genes were associated with a low HR for OS and 13 genes showed a low HR for DFS. These findings suggest that VPS26A and its positively correlated gene set are associated with poor prognosis in patients with LIHC.
A gene–gene interaction network was constructed to investigate the functional associations of VPS35, VPS29, VPS26B, and SNX3 with VPS26A. These genes were associated with key cellular processes, including the regulation of autophagy, macroautophagy, endosomal transport, cytosolic transport, and vesicle-mediated transport to the plasma membrane. Their functional convergence highlights their central roles in maintaining intracellular trafficking and homeostasis. These findings provide valuable insights into the molecular framework governing vesicular trafficking, with potential implications for understanding the disorders associated with defects in endosomal transport and autophagy.
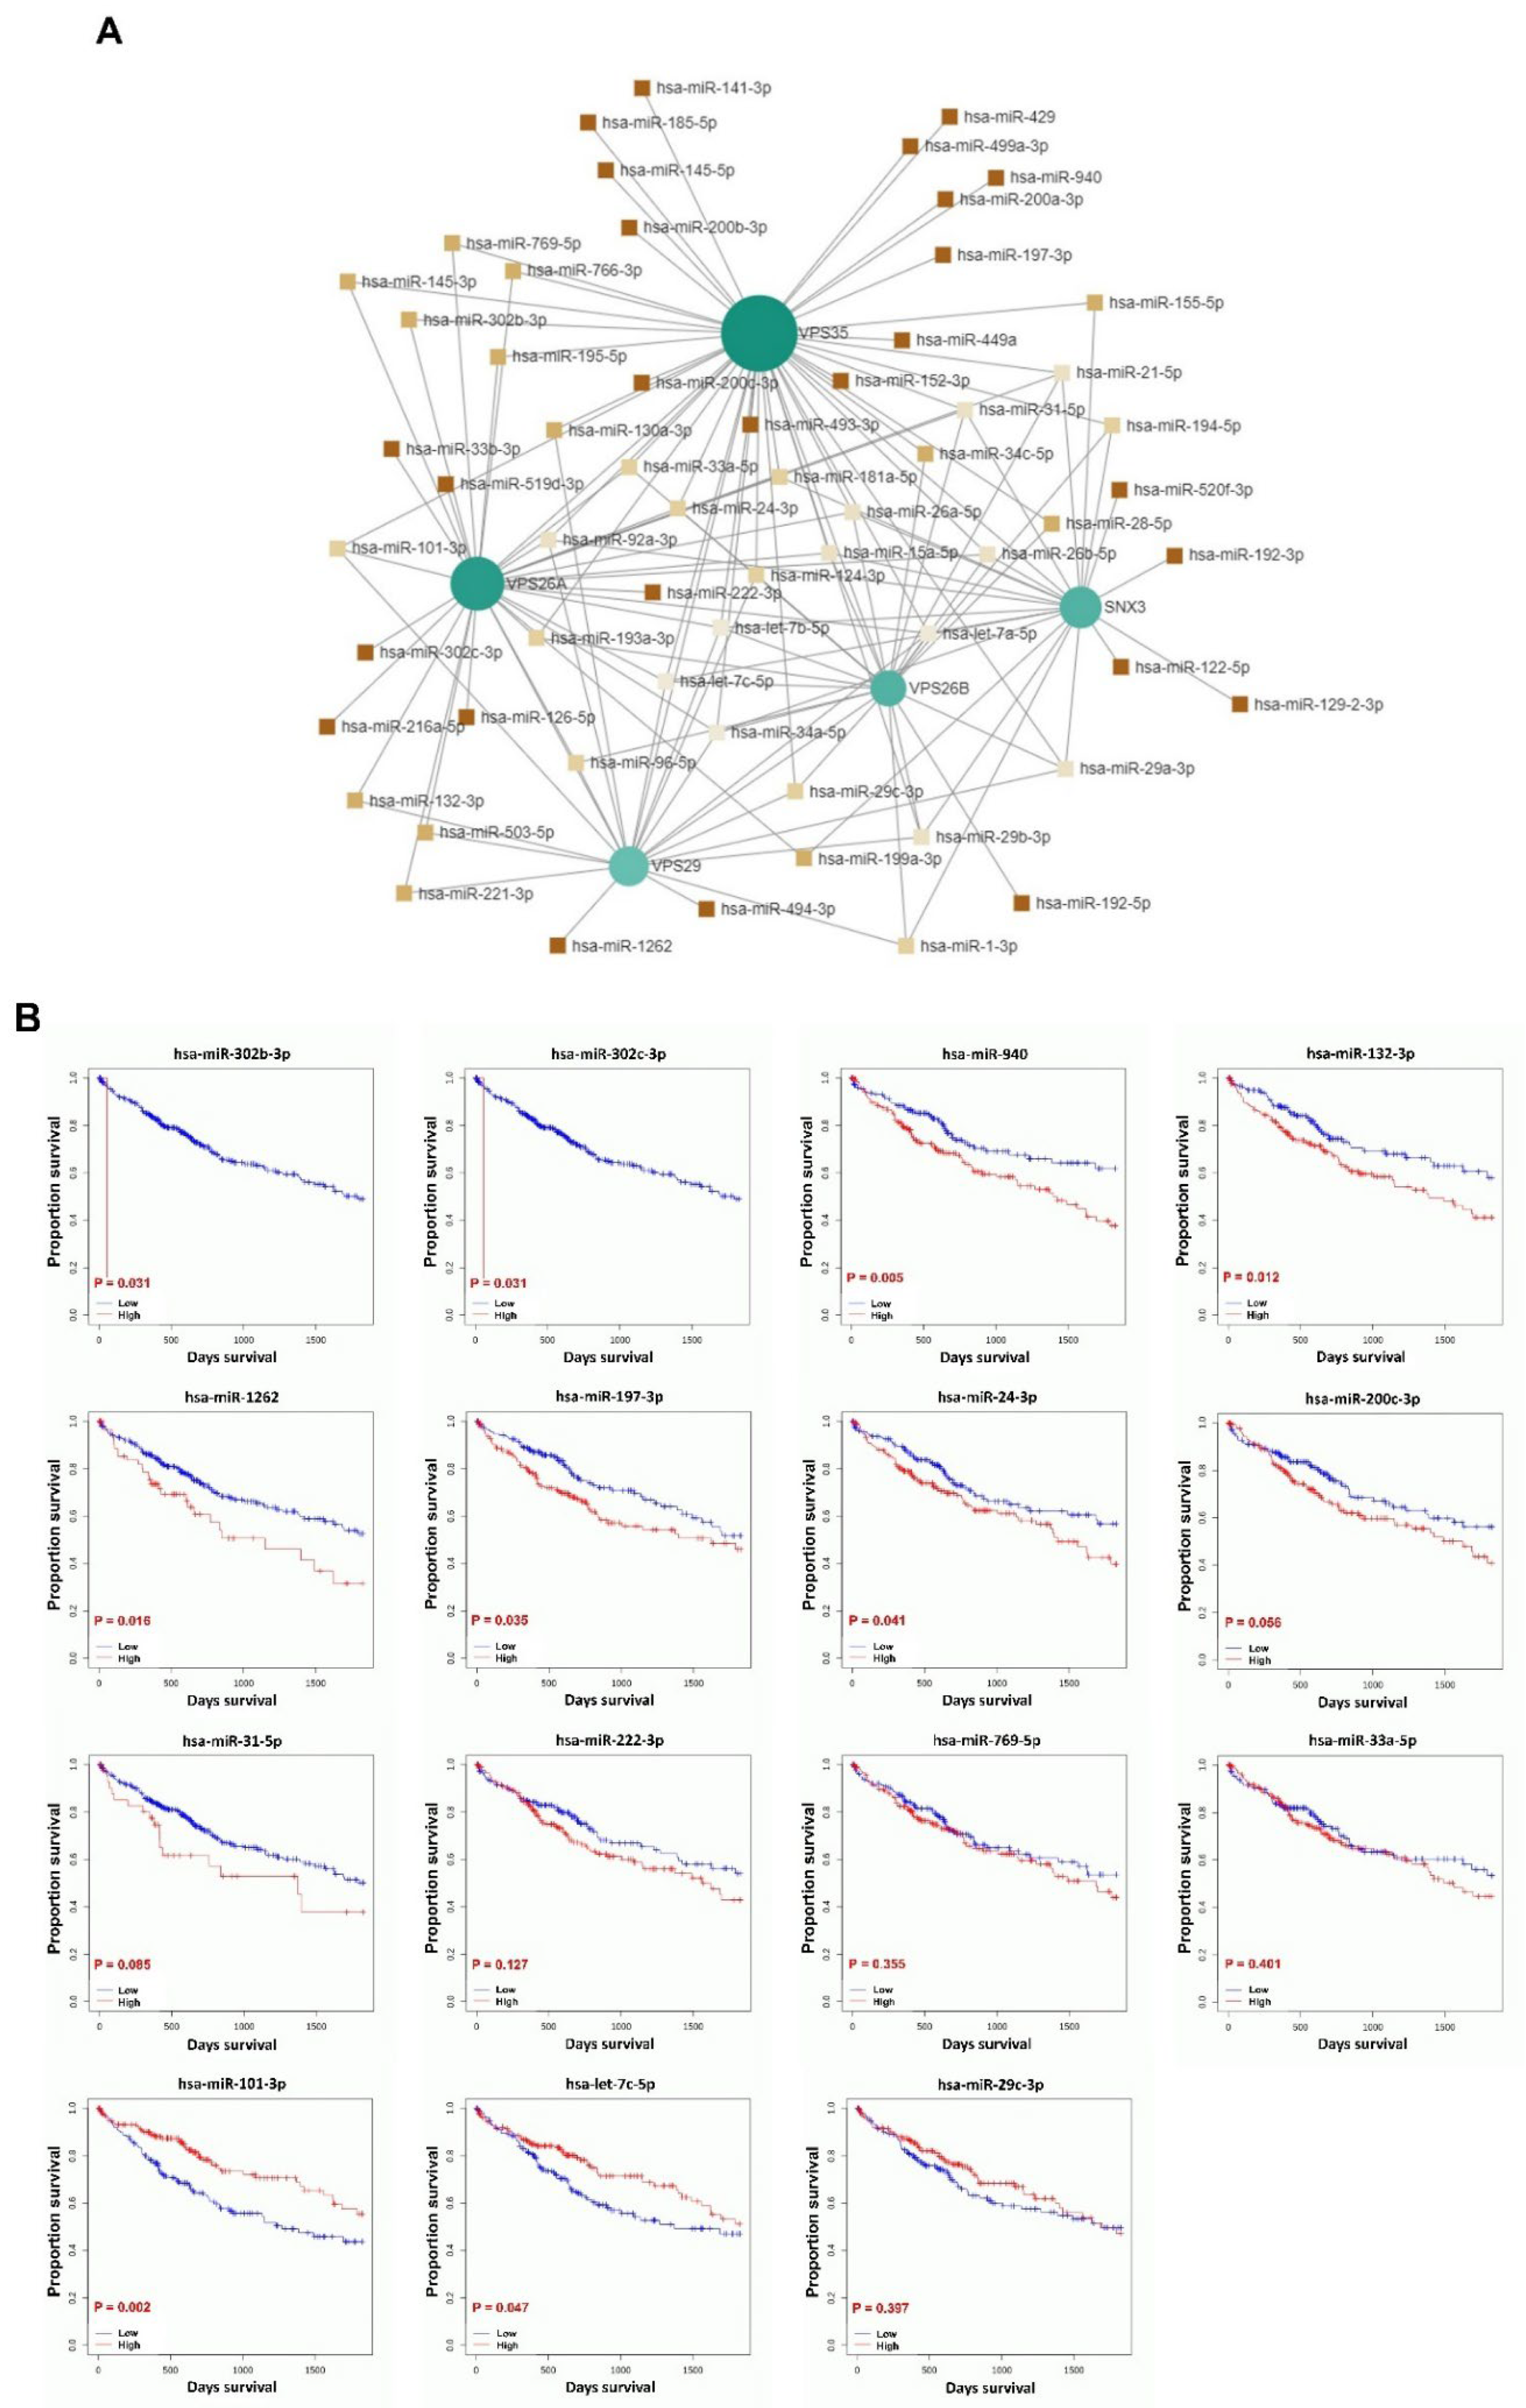
MicroRNAs (miRNAs) have been implicated in both the promotion of tumorigenesis and the inhibition of tumor progression, as evidenced in numerous studies. Additionally, the role of miRNAs in tumor prognosis has been well-documented [
89]. Research has demonstrated that miRNAs exhibit aberrant expression patterns in LIHC and contribute to the growth, development, and metastasis of this malignancy by functioning as either oncogenes or tumor suppressors. Despite these findings, there remains a lack of validated prognostic models for predicting patient outcomes and guiding treatment strategies for LIHC. Consequently, there is an urgent need to develop an miRNA-based prognostic model for patients with LIHC, which could facilitate accurate prognostication and enable targeted therapies aimed at enhancing overall survival. To investigate the regulatory roles and prognostic significance of miRNAs that target genes associated with VPS26A in LIHC, 61 miRNAs that simultaneously target multiple VPS26A-associated genes were identified, indicating a high level of shared regulatory potential. Among the 61 miRNAs, 15 were significantly correlated with survival outcomes in patients with LIHC. Notably, hsa-miR-302b-3p, hsa-miR-302c-3p, hsa-miR-940, hsa-miR-132-3p, hsa-miR-1262, hsa-miR-197-3p, and hsa-miR-24-3p were associated with a poor prognosis when highly expressed in LIHC. In contrast, low expression levels of hsa-miR-101-3p and hsa-miR-let-7c-5p were associated with poor survival in LIHC. These findings suggest that miRNAs targeting VPS26A-related gene networks may serve as valuable prognostic biomarkers for LIHC.
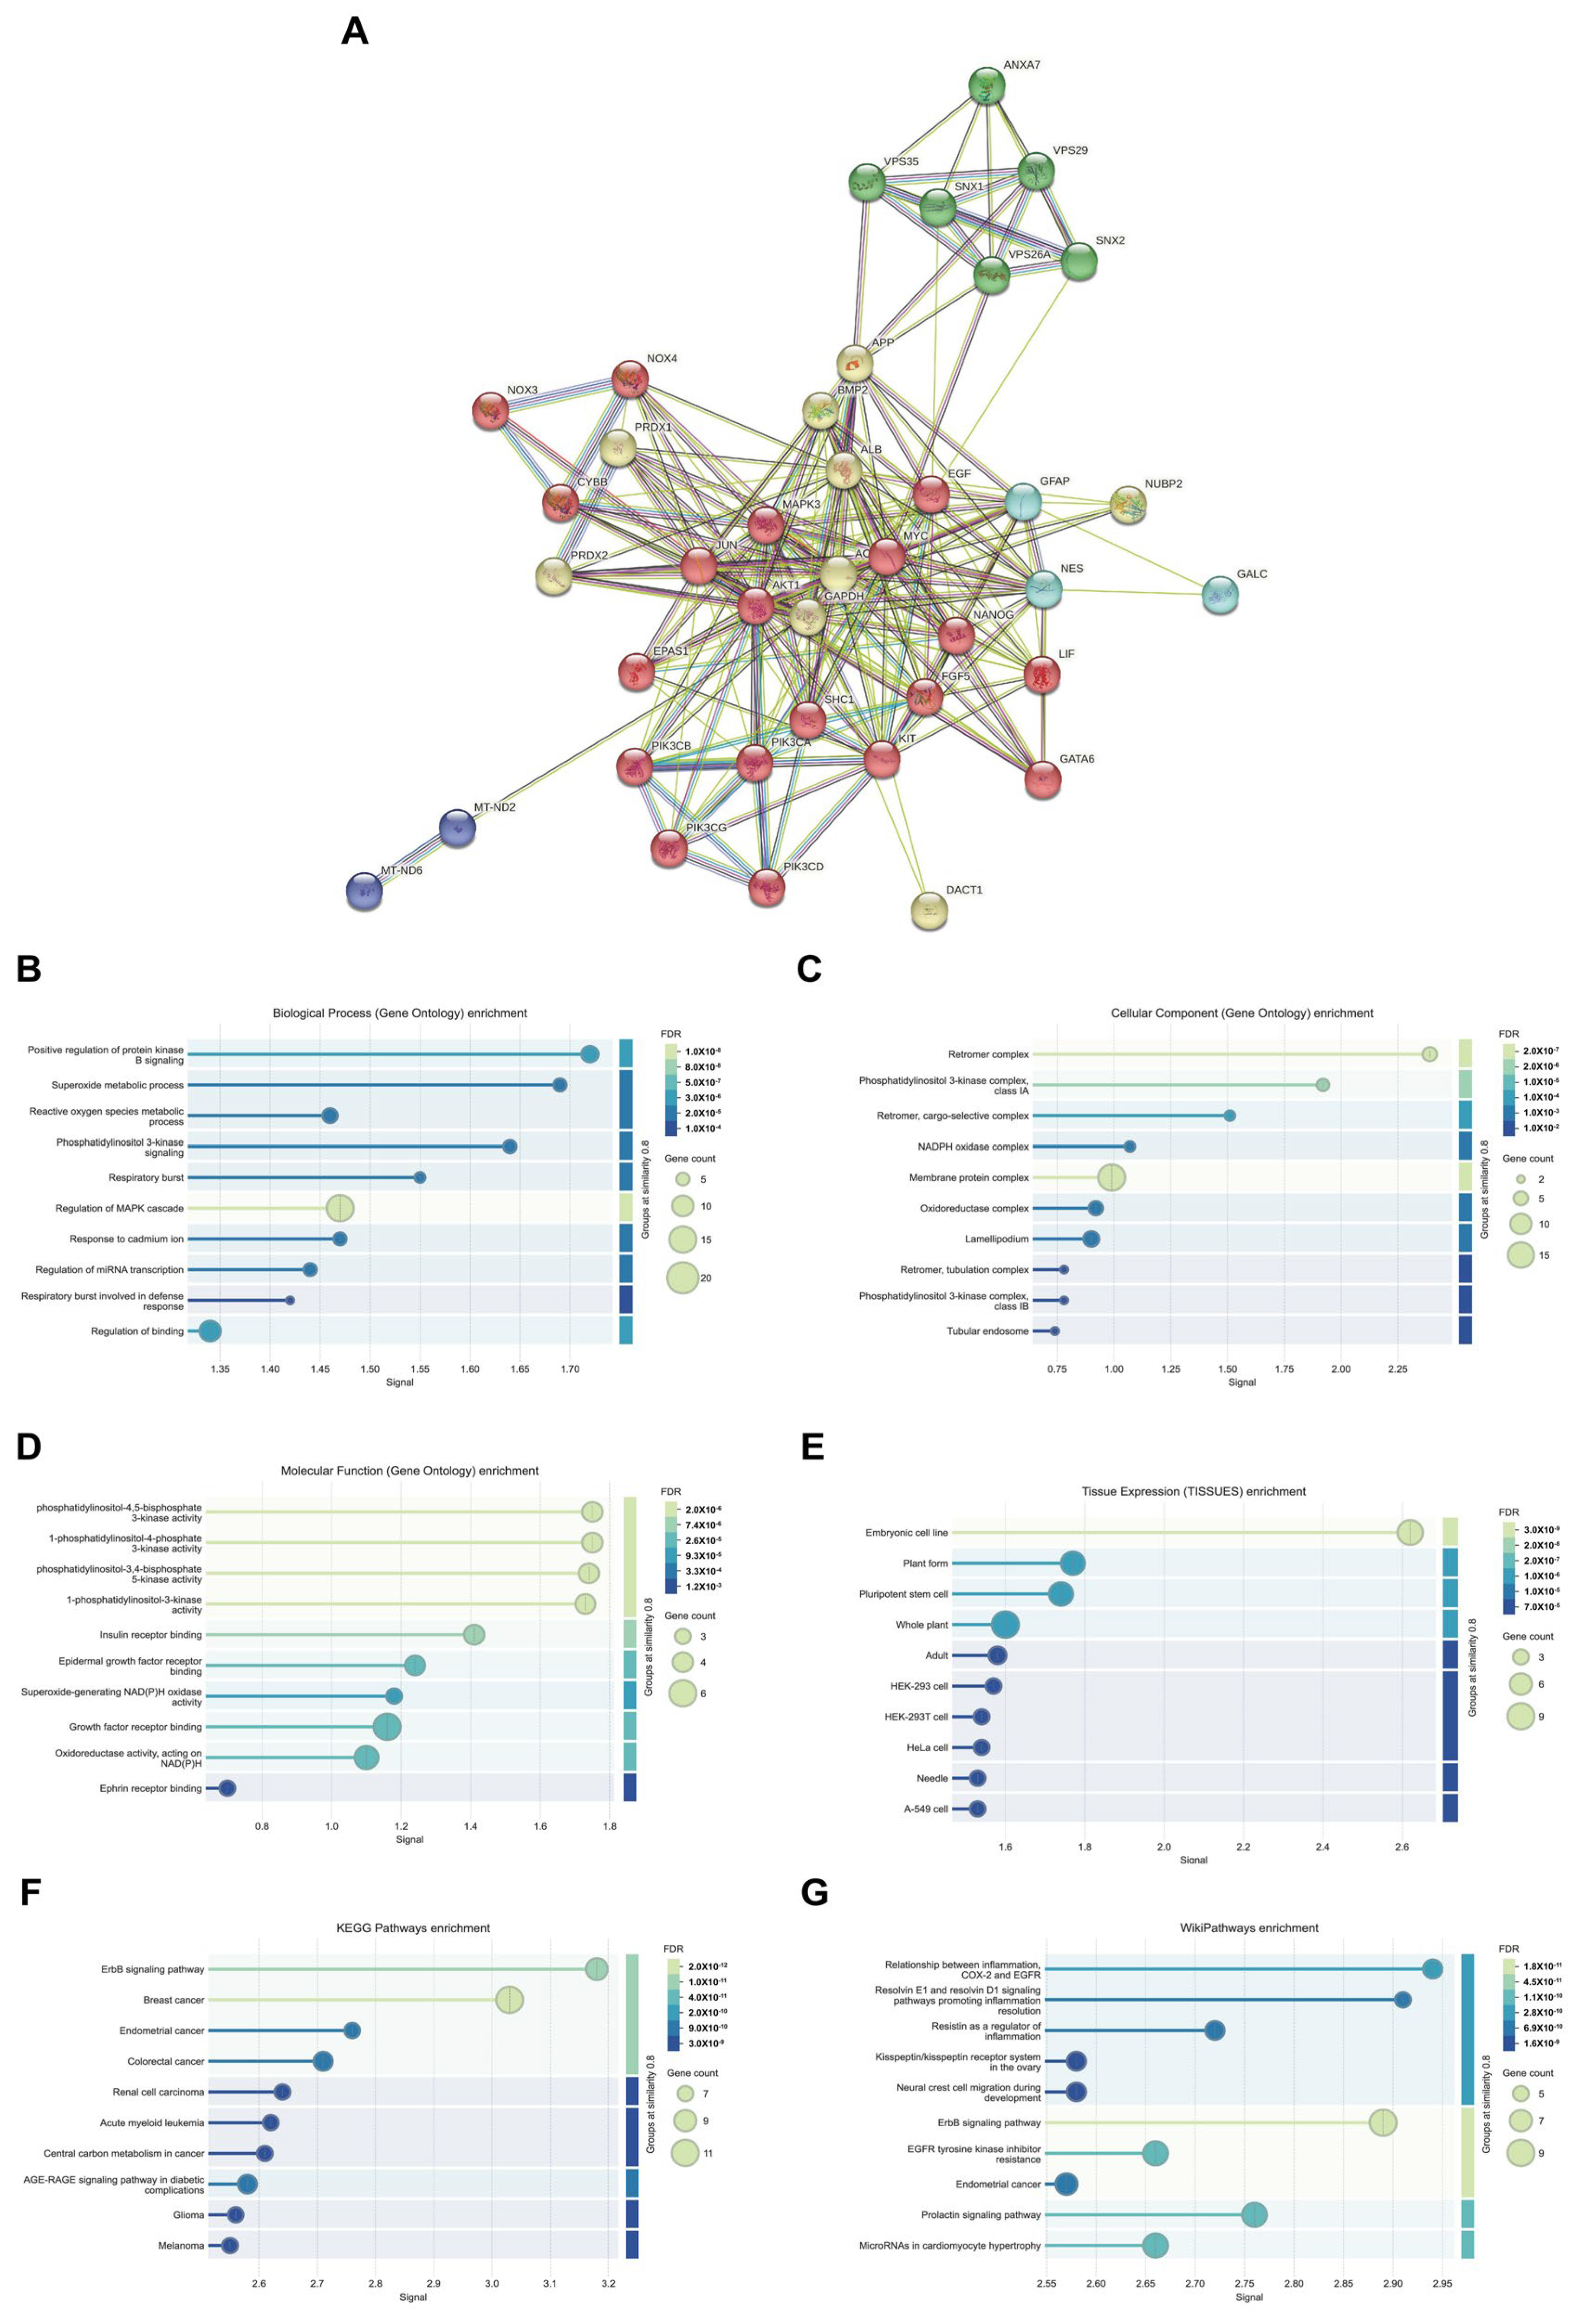
The PPI network of VPS26A consisted of 234 edges and 39 nodes. PPI network analysis identified five distinct functional clusters, including ErbB/PI3K-AKT signaling, neurodegenerative processes, oxidative stress, leukodystrophy, and mitochondrial dysfunction. The analysis of biological processes through GO and pathway enrichment analyses, with a focus on proteins associated with PPI, revealed significant enrichment in several biological processes. These processes include the positive regulation of AKT signaling, superoxide metabolism, phosphatidylinositol 3-kinase signaling, and the regulation of the MAPK cascade. Furthermore, the analysis of cellular components underscores the association of co-expressed proteins with the retromer complex, phosphatidylinositol 3-kinase complex, and various membrane protein complexes. These proteins exhibit various kinase activities, such as phosphatidylinositol-4,5-bisphosphate 3-kinase activity and insulin receptor binding. Tissue expression analysis suggests a potential link between these proteins and embryonic cell lines. KEGG pathways revealed associations with the ErbB signaling pathway and breast cancer, while Wiki pathways highlighted connections with inflammation resolution pathways involving resolvins E1 and D1, as well as inflammation-related pathways involving COX2, EGFR, and the ErbB signaling pathway. Collectively, these findings suggest that VPS26A is an integral component of a complex network of signaling and trafficking proteins critical for cancer progression, inflammation, and cellular metabolism.
In summary, our comprehensive investigation identified VPS26A as a potential biomarker with significant diagnostic, prognostic, and therapeutic implications for LIHC. Elevated expression of the VPS26A mRNA and protein in LIHC correlates with adverse clinicopathological characteristics and poor patient outcomes. Its association with immunosuppressive tumor-infiltrating immune cells and promoter hypomethylation suggests that VPS26A may play a role in fostering an immune-tolerant tumor microenvironment. Furthermore, both hypermethylation and hypomethylation patterns of VPS26A are associated with reduced survival rates, highlighting the importance of epigenetic regulation in its oncogenic role. Drug sensitivity analysis revealed that VPS26A expression correlated with diverse responses to various anticancer agents, thereby establishing it as a potential predictive biomarker for treatment stratification. Additionally, data regarding chemical interactions and co-expression networks suggested that VPS26A functions within a broader regulatory system involved in vesicle trafficking, stress response, and oncogenic signaling. Functional enrichment analyses further supported its involvement in critical biological pathways, including cell division, transcriptional regulation, and the PI3K-AKT/ErbB signaling pathway, thereby implicating VPS26A in LIHC pathogenesis at multiple levels. This study also identified a set of miRNAs and protein–protein interactions associated with VPS26A, many of which correlated with poor prognosis, suggesting their potential as additional targets for prognostic evaluation or therapeutic intervention. However, this study is limited to bioinformatics-based analyses, and experimental validation was not performed. Future in vitro and in vivo studies are warranted to verify the functional roles of VPS26A and assess its clinical applicability.


