
Predicting Fibrosis Stage in MASH: The Role of Total Metabolic Syndrome Score and MMP-1


Abstract
1. Introduction
2. Materials and Methods
2.1. Study Design
2.2. Inclusion and Exclusion Criteria
2.3. Anthropometric Measurements
2.4. Biochemical Tests for Serum Fibrosis Biomarkers
2.5. Histological Evaluation
2.6. Magnetic Resonance Elastography and Proton Density Fat Fraction
2.7. Statistical Analysis
3. Results
4. Discussion
5. Conclusions
Supplementary Materials
Author Contributions
Funding
Institutional Review Board Statement
Informed Consent Statement
Data Availability Statement
Conflicts of Interest
References
- Rinella, M.E.; Lazarus, J.V.; Ratziu, V.; Francque, S.M.; Sanyal, A.J.; Kanwal, F.; Romero, D.; Abdelmalek, M.F.; Anstee, Q.M.; Arab, J.P.; et al. A multisociety Delphi consensus statement on new fatty liver disease nomenclature. J. Hepatol. 2023, 79, 1542–1556. [Google Scholar] [CrossRef] [PubMed]
- Younossi, Z.M.; Paik, J.M.; Stepanova, M.; Ong, J.; Alqahtani, S.; Henry, L. Clinical profiles and mortality rates are similar for metabolic dysfunction-associated steatotic liver disease and non-alcoholic fatty liver disease. J. Hepatol. 2024, 80, 694–701. [Google Scholar] [CrossRef]
- Song, S.J.; Lai, J.C.-T.; Wong, G.L.-H.; Wong, V.W.-S.; Yip, T.C.-F. Can we use old NAFLD data under the new MASLD definition? J. Hepatol. 2024, 80, e54–e56. [Google Scholar] [CrossRef] [PubMed]
- Younossi, Z.M.; Golabi, P.; Paik, J.M.; Henry, A.; Van Dongen, C.; Henry, L. The global epidemiology of nonalcoholic fatty liver disease (NAFLD) and nonalcoholic steatohepatitis (NASH): A systematic review. Hepatology 2023, 77, 1335–1347. [Google Scholar] [CrossRef]
- Jain, P.; Jain, A.; Deshmukh, R.; Samal, P.; Satapathy, T. Ajazuddin Metabolic Dysfunction-Associated Steatotic Liver Disease (MASLD): Exploring Systemic Impacts and Innovative Therapies. Clin. Res. Hepatol. Gastroenterol. 2025, 49, 102584. [Google Scholar] [CrossRef]
- Ekstedt, M.; Hagström, H.; Nasr, P.; Fredrikson, M.; Stål, P.; Kechagias, S.; Hultcrantz, R. Fibrosis stage is the strongest predictor for disease-specific mortality in NAFLD after up to 33 years of follow-up. Hepatology 2015, 61, 1547–1554. [Google Scholar] [CrossRef]
- Angulo, P.; Kleiner, D.E.; Dam-Larsen, S.; Adams, L.A.; Bjornsson, E.S.; Charatcharoenwitthaya, P.; Mills, P.R.; Keach, J.C.; Lafferty, H.D.; Stahler, A.; et al. Liver Fibrosis, but No Other Histologic Features, Is Associated with Long-term Outcomes of Patients with Nonalcoholic Fatty Liver Disease. Gastroenterology 2015, 149, 389–397.e10. [Google Scholar] [CrossRef] [PubMed]
- Younossi, Z.M.; Mangla, K.K.; Berentzen, T.L.; Grau, K.; Kjær, M.S.; Ladelund, S.; Nitze, L.M.; Coolbaugh, C.; Hsu, C.-Y.; Hagström, H. Liver histology is associated with long-term clinical outcomes in patients with metabolic dysfunction–associated steatohepatitis. Hepatol. Commun. 2024, 8, e0423. [Google Scholar] [CrossRef]
- Harrison, S.A.; Bedossa, P.; Guy, C.D.; Schattenberg, J.M.; Loomba, R.; Taub, R.; Labriola, D.; Moussa, S.E.; Neff, G.W.; Rinella, M.E.; et al. A Phase 3, Randomized, Controlled Trial of Resmetirom in NASH with Liver Fibrosis. N. Engl. J. Med. 2024, 390, 497–509. [Google Scholar] [CrossRef]
- Azam, M.M.; Mukhtar, S.; Haris, M.; Laique, F.; Amir, S.; Mohiuddin, M.; Giri, B. FDA’s approval of resmetirom (Rezdiffra): A breakthrough in MASH management. Explor. Drug Sci. 2024, 2, 867–874. [Google Scholar] [CrossRef]
- Noureddin, M.; Muthiah, M.D.; Sanyal, A.J. Drug discovery and treatment paradigms in nonalcoholic steatohepatitis. Endocrinol. Diabetes Metab. 2019, 3, e00105. [Google Scholar] [CrossRef] [PubMed]
- Harrison, S.A.; Dubourg, J. Liver biopsy evaluation in MASH drug development: Think thrice, act wise. J. Hepatol. 2024, 81, 886–894. [Google Scholar] [CrossRef] [PubMed]
- Tacke, F.; Horn, P.; Wai-Sun Wong, V.; Ratziu, V.; Bugianesi, E.; Francque, S.; Zelber-Sagi, S.; Valenti, L.; Roden, M.; Schick, F.; et al. EASL–EASD–EASO Clinical Practice Guidelines on the management of metabolic dysfunction-associated steatotic liver disease (MASLD). J. Hepatol. 2024, 81, 492–542. [Google Scholar] [CrossRef]
- Sterling, R.K.; Lissen, E.; Clumeck, N.; Sola, R.; Correa, M.C.; Montaner, J.; Sulkowski, M.S.; Torriani, F.J.; Dieterich, D.T.; Thomas, D.L.; et al. Development of a simple noninvasive index to predict significant fibrosis in patients with HIV/HCV coinfection. Hepatology 2006, 43, 1317–1325. [Google Scholar] [CrossRef] [PubMed]
- Angulo, P.; Hui, J.M.; Marchesini, G.; Bugianesi, E.; George, J.; Farrell, G.C.; Enders, F.; Saksena, S.; Burt, A.D.; Bida, J.P.; et al. The NAFLD fibrosis score: A noninvasive system that identifies liver fibrosis in patients with NAFLD. Hepatology 2007, 45, 846–854. [Google Scholar] [CrossRef]
- Harrison, S.A.; Oliver, D.; Arnold, H.L.; Gogia, S.; Neuschwander-Tetri, B.A. Development and validation of a simple NAFLD clinical scoring system for identifying patients without advanced disease. Gut 2008, 57, 1441–1447. [Google Scholar] [CrossRef]
- Wai, C.-T.; Greenson, J.K.; Fontana, R.J.; Kalbfleisch, J.D.; Marrero, J.A.; Conjeevaram, H.S.; Lok, A.S.-F. A simple noninvasive index can predict both significant fibrosis and cirrhosis in patients with chronic hepatitis C. Hepatology 2003, 38, 518–526. [Google Scholar] [CrossRef]
- Expert Panel on Detection, Evaluation, and Treatment of High Blood Cholesterol in Adults. Executive Summary of The Third Report of The National Cholesterol Education Program (NCEP) Expert Panel on Detection, Evaluation, And Treatment of High Blood Cholesterol In Adults (Adult Treatment Panel III). JAMA 2001, 285, 2486–2497. [Google Scholar] [CrossRef]
- Kleiner, D.E.; Brunt, E.M.; Van Natta, M.; Behling, C.; Contos, M.J.; Cummings, O.W.; Ferrell, L.D.; Liu, Y.-C.; Torbenson, M.S.; Unalp-Arida, A.; et al. Design and validation of a histological scoring system for nonalcoholic fatty liver disease. Hepatology 2005, 41, 1313–1321. [Google Scholar] [CrossRef]
- Hagström, H.; Nasr, P.; Ekstedt, M.; Hammar, U.; Stål, P.; Hultcrantz, R.; Kechagias, S. Fibrosis stage but not NASH predicts mortality and time to development of severe liver disease in biopsy-proven NAFLD. J. Hepatol. 2017, 67, 1265–1273. [Google Scholar] [CrossRef]
- Adams, L.A.; Chan, W.-K. Noninvasive Tests in the Assessment of NASH and NAFLD Fibrosis: Now and Into the Future. Semin. Liver Dis. 2020, 40, 331–338. [Google Scholar] [CrossRef] [PubMed]
- Sun, Y.; Hu, D.; Yu, M.; Liang, S.-B.; Zheng, Y.; Wang, X.; Tong, G. Diagnostic Accuracy of Non-Invasive Diagnostic Tests for Nonalcoholic Fatty Liver Disease: A Systematic Review and Network Meta-Analysis. Clin. Epidemiol. 2025, 17, 53–71. [Google Scholar] [CrossRef] [PubMed]
- Rinella, M.E.; Neuschwander-Tetri, B.A.; Siddiqui, M.S.; Abdelmalek, M.F.; Caldwell, S.; Barb, D.; Kleiner, D.E.; Loomba, R. AASLD Practice Guidance on the clinical assessment and management of nonalcoholic fatty liver disease. Hepatology 2023, 77, 1797–1835. [Google Scholar] [CrossRef]
- Berzigotti, A.; Tsochatzis, E.; Boursier, J.; Castera, L.; Cazzagon, N.; Friedrich-Rust, M.; Petta, S.; Thiele, M. EASL Clinical Practice Guidelines on non-invasive tests for evaluation of liver disease severity and prognosis—2021 update. J. Hepatol. 2021, 75, 659–689. [Google Scholar] [CrossRef] [PubMed]
- Noureddin, M. Utilization of Noninvasive Tests to Diagnose At-Risk Metabolic Dysfunction-Associated Steatohepatitis. Gastroenterol. Hepatol. 2023, 19, 568–570. [Google Scholar]
- Hong, S.; Sun, L.; Hao, Y.; Li, P.; Zhou, Y.; Liang, X.; Hu, J.; Wei, H. From NAFLD to MASLD: When metabolic comorbidity matters. Ann. Hepatol. 2024, 29, 101281. [Google Scholar] [CrossRef]
- Radu, F.; Potcovaru, C.-G.; Salmen, T.; Filip, P.V.; Pop, C.; Fierbințeanu-Braticievici, C. The Link between NAFLD and Metabolic Syndrome. Diagnostics 2023, 13, 614. [Google Scholar] [CrossRef]
- Friedman, S.L.; Neuschwander-Tetri, B.A.; Rinella, M.; Sanyal, A.J. Mechanisms of NAFLD development and therapeutic strategies. Nat. Med. 2018, 24, 908–922. [Google Scholar] [CrossRef]
- Wu, X.; Zhang, T.; Park, S. Dietary quality, perceived health, and psychological status as key risk factors for newly developed metabolic dysfunction–associated steatotic liver disease in a longitudinal study. Nutrition 2025, 130, 112604. [Google Scholar] [CrossRef]
- DeBoer, M.D.; Lin, B.; Filipp, S.L.; Cusi, K.; Gurka, M.J. Severity of Metabolic Syndrome Is Greater among Non-Alcoholic Adults with Elevated ALT and Advanced Fibrosis. Nutr. Res. 2021, 88, 34–43. [Google Scholar] [CrossRef]
- Xuan, Y.; Wu, D.; Zhang, Q.; Yu, Z.; Yu, J.; Zhou, D. Elevated ALT/AST ratio as a marker for NAFLD risk and severity: Insights from a cross-sectional analysis in the United States. Front. Endocrinol. 2024, 15, 1457598. [Google Scholar] [CrossRef] [PubMed]
- Amernia, B.; Moosavy, S.H.; Banookh, F.; Zoghi, G. FIB-4, APRI, and AST/ALT ratio compared to FibroScan for the assessment of hepatic fibrosis in patients with non-alcoholic fatty liver disease in Bandar Abbas, Iran. BMC Gastroenterol. 2021, 21, 453. [Google Scholar] [CrossRef] [PubMed]
- Fichez, J.; Mouillot, T.; Vonghia, L.; Costentin, C.; Moreau, C.; Roux, M.; Delamarre, A.; Francque, S.; Zheng, M.-H.; Boursier, J. Non-invasive tests for fibrotic MASH for reducing screen failure in therapeutic trials. JHEP Rep. 2025, 7, 101351. [Google Scholar] [CrossRef]
- Sabir, U.; Gu, H.; Zhang, D.-W. Extracellular matrix turnover: Phytochemicals target and modulate the dual role of matrix metalloproteinases (MMPs) in liver fibrosis. Phytother. Res. 2023, 37, 4932–4962. [Google Scholar] [CrossRef] [PubMed]
- Geervliet, E.; Bansal, R. Matrix Metalloproteinases as Potential Biomarkers and Therapeutic Targets in Liver Diseases. Cells 2020, 9, 1212. [Google Scholar] [CrossRef]
- Iimuro, Y.; Nishio, T.; Morimoto, T.; Nitta, T.; Stefanovic, B.; Choi, S.K.; Brenner, D.A.; Yamaoka, Y. Delivery of matrix metalloproteinase-1 attenuates established liver fibrosis in the rat. Gastroenterology 2003, 124, 445–458. [Google Scholar] [CrossRef]
- Roderfeld, M. Matrix metalloproteinase functions in hepatic injury and fibrosis. Matrix Biol. J. Int. Soc. Matrix Biol. 2018, 68–69, 452–462. [Google Scholar] [CrossRef]
- Yokomori, H.; Oda, M.; Ando, W.; Inagaki, Y.; Okazaki, I. Hepatic progenitor cell expansion in early-stage nonalcoholic steatohepatitis: Evidence from immunohistochemistry and immunoelectron microscopy of matrix metalloproteinase-1. Med. Mol. Morphol. 2017, 50, 238–242. [Google Scholar] [CrossRef]
- Yilmaz, Y.; Eren, F. Serum biomarkers of fibrosis and extracellular matrix remodeling in patients with nonalcoholic fatty liver disease: Association with liver histology. Eur. J. Gastroenterol. Hepatol. 2019, 31, 43–46. [Google Scholar] [CrossRef]
- Leroy, V.; Monier, F.; Bottari, S.; Trocme, C.; Sturm, N.; Hilleret, M.-N.; Morel, F.; Zarski, J.-P. Circulating matrix metalloproteinases 1, 2, 9 and their inhibitors TIMP-1 and TIMP-2 as serum markers of liver fibrosis in patients with chronic hepatitis C: Comparison with PIIINP and hyaluronic acid. Am. J. Gastroenterol. 2004, 99, 271–279. [Google Scholar] [CrossRef]
- Noureddin, M.; Truong, E.; Gornbein, J.A.; Saouaf, R.; Guindi, M.; Todo, T.; Noureddin, N.; Yang, J.D.; Harrison, S.A.; Alkhouri, N. MRI-based (MAST) score accurately identifies patients with NASH and significant fibrosis. J. Hepatol. 2022, 76, 781–787. [Google Scholar] [CrossRef] [PubMed]
- Shumbayawonda, E.; French, M.; Carolan, J.E.; Beyer, C.; Lorgelly, P.; Tonev, D.; Banerjee, R.; Miller, M.H.; Byrne, C.D.; Patel, J.; et al. Utility and cost-effectiveness of LiverMultiScan for MASLD diagnosis: A real-world multi-national randomised clinical trial. Commun. Med. 2025, 5, 74. [Google Scholar] [CrossRef] [PubMed]
- Ratziu, V.; Charlotte, F.; Heurtier, A.; Gombert, S.; Giral, P.; Bruckert, E.; Grimaldi, A.; Capron, F.; Poynard, T. Sampling variability of liver biopsy in nonalcoholic fatty liver disease. Gastroenterology 2005, 128, 1898–1906. [Google Scholar] [CrossRef] [PubMed]
- Tang, A.; Dzyubak, B.; Yin, M.; Schlein, A.; Henderson, W.C.; Hooker, J.C.; Delgado, T.I.; Middleton, M.S.; Zheng, L.; Wolfson, T.; et al. MR elastography in nonalcoholic fatty liver disease: Inter-center and inter-analysis-method measurement reproducibility and accuracy at 3T. Eur. Radiol. 2022, 32, 2937–2948. [Google Scholar] [CrossRef]
- Hoodeshenas, S.; Yin, M.; Venkatesh, S.K. Magnetic Resonance Elastography of Liver: Current Update. Top. Magn. Reson. Imaging TMRI 2018, 27, 319–333. [Google Scholar] [CrossRef]
- Liang, J.; Ampuero, J.; Niu, H.; Imajo, K.; Noureddin, M.; Behari, J.; Lee, D.H.; Ehman, R.L.; Rorsman, F.; Vessby, J.; et al. An individual patient data meta-analysis to determine cut-offs for and confounders of NAFLD-fibrosis staging with magnetic resonance elastography. J. Hepatol. 2023, 79, 592–604. [Google Scholar] [CrossRef] [PubMed]
- Tincopa, M.A.; Loomba, R. Noninvasive Tests to Assess Fibrosis and Disease Severity in Metabolic Dysfunction-Associated Steatotic Liver Disease. Semin. Liver Dis. 2024, 44, 287–299. [Google Scholar] [CrossRef]
- Han, S.; Choi, M.; Lee, B.; Lee, H.-W.; Kang, S.H.; Cho, Y.; Ahn, S.B.; Song, D.S.; Jun, D.W.; Lee, J.; et al. Accuracy of Noninvasive Scoring Systems in Assessing Liver Fibrosis in Patients with Nonalcoholic Fatty Liver Disease: A Systematic Review and Meta-Analysis. Gut Liver 2022, 16, 952–963. [Google Scholar] [CrossRef]


| F1 (n = 23) | F2 (n = 19) | F3 (n = 6) | F4 (n = 8) | p Value | |
|---|---|---|---|---|---|
| Demographic Profile | |||||
| Age (year), median (IQR) | 43 (33–53) | 48 (31–54) | 58 (50–62) | 63 (54–69) | 0.001 |
| Female, n (%) | 8 (34.8) | 9 (47.4) | 6 (100.0) | 4 (50.0) | 0.042 |
| BMI (kg/m2), median (IQR) | 30.57 (27.72–32.40) | 33.21 (27.14–35.09) | 32.19 (30.86–41.25) | 31.01 (29.41–36.05) | 0.43 |
| Diabetes mellitus *, n (%) | 10 (43.5) | 12 (63.2) | 5 (83.3) | 6 (75.0) | 0.21 |
| Hypertension *, n (%) | 10 (43.5) | 11 (57.9) | 5 (83.3) | 5 (62.5) | 0.35 |
| Dyslipidemia *, n (%) | 13 (56.5) | 12 (63.2) | 5 (83.3) | 6 (75.0) | 0.59 |
| Metabolic syndrome *, n (%) | 11 (47.8) | 13 (68.4) | 6 (100.0) | 8 (100.0) | 0.011 |
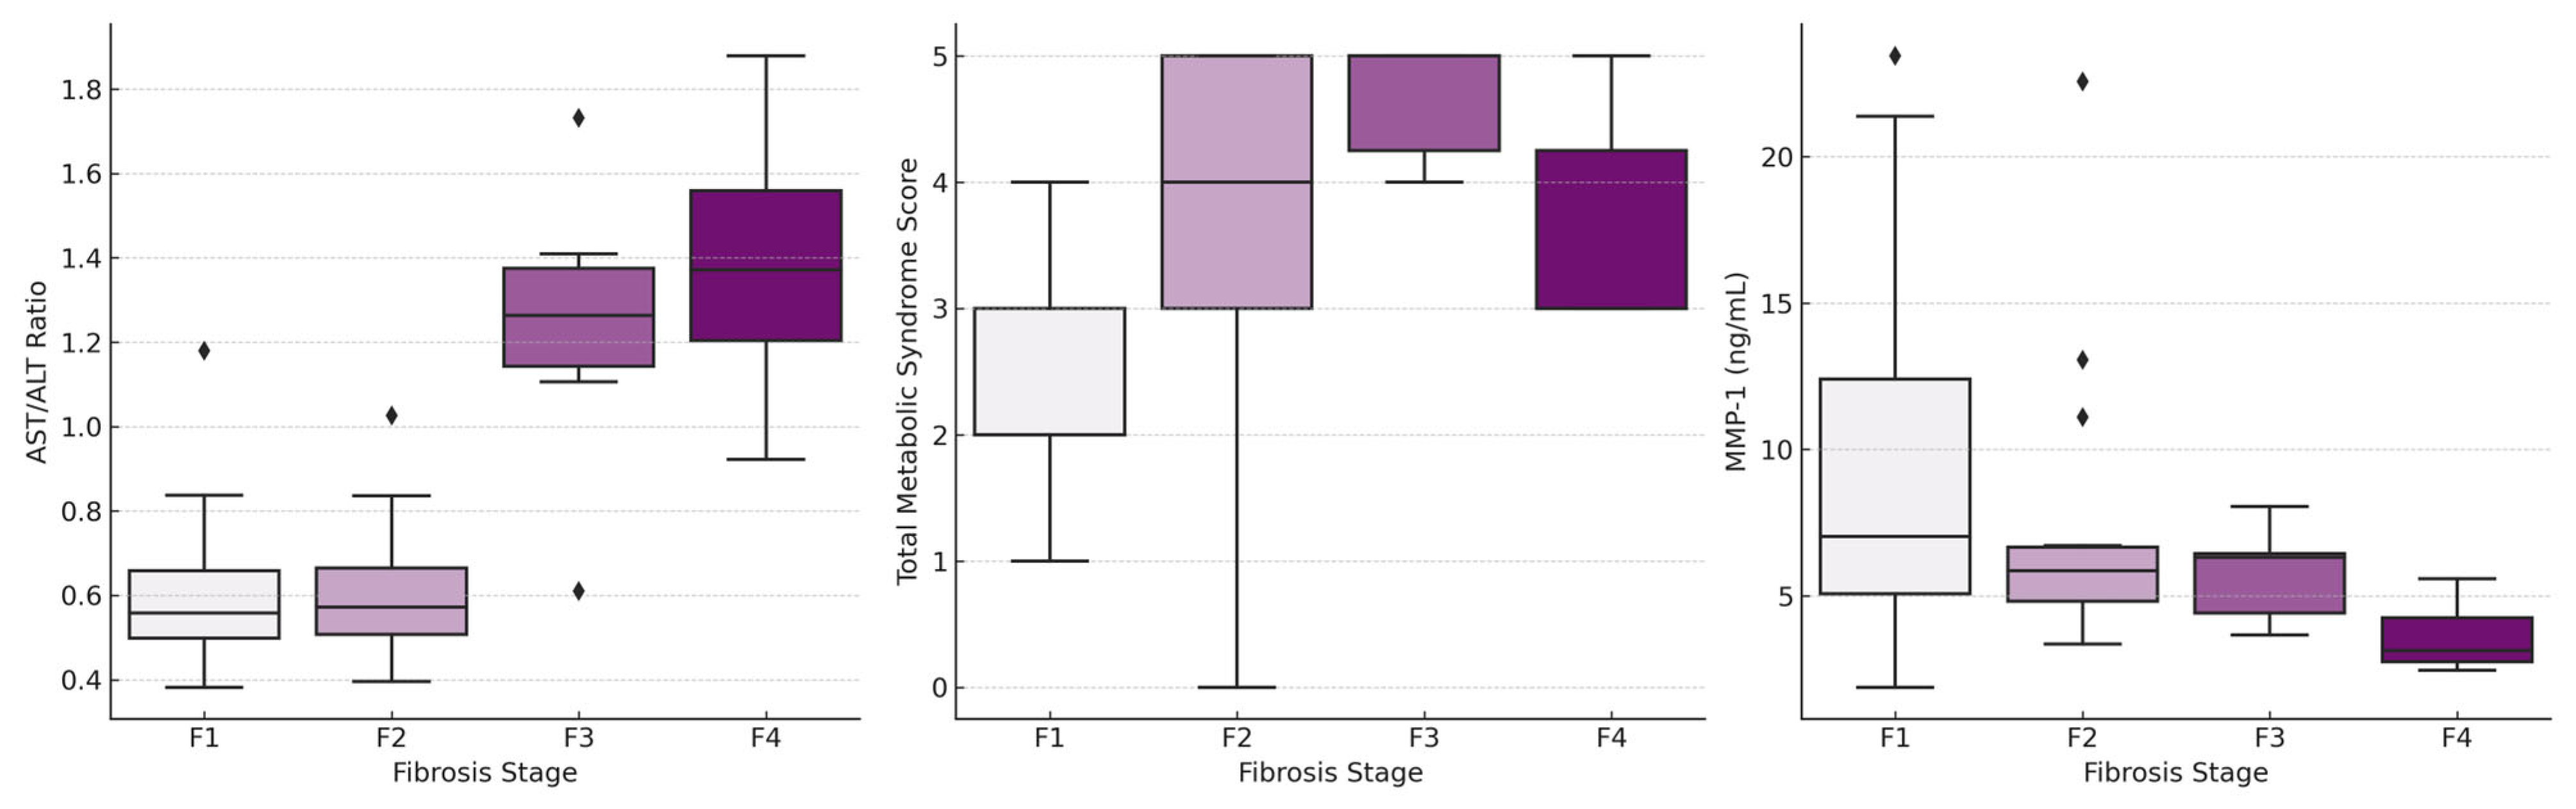
| Total metabolic syndrome score *, median (IQR) | 2 (2–3) | 4 (3–5) | 5 (4–5) | 3 (3–5) | 0.001 |
| Biochemical Data | |||||
| AST (U/L), median (IQR) | 47 (39–68) | 54 (39–79) | 63 (36–71) | 45 (36–52) | 0.51 |
| ALT (U/L), median (IQR) | 91 (59–133) | 109 (68–134) | 48 (41–59) | 34 (26–39) | <0.001 |
| AST/ALT ratio, median (IQR) | 0.56 (0.48–0.68) | 0.57 (0.50–0.67) | 1.26 (1.11–1.41) | 1.37 (1.20–1.58) | <0.001 |
| GGT (U/L), median (IQR) | 59 (43–89) | 79 (48–99) | 56 (39–141) | 130 (68–186) | 0.25 |
| Total bilirubin, (mg/dL), median (IQR) | 0.65 (0.55–0.93) | 0.75 (0.52–0.98) | 0.61 (0.54–0.92) | 0.97 (0.71–1.28) | 0.58 |
| Platelet (×103/mm3), median (IQR) | 248 (220–314) | 257 (232–297) | 177 (140–216) | 91 (86–114) | <0.001 |
| INR, median (IQR) | 0.92 (0.90–0.96) | 0.95 (0.90–0.97) | 1.04 (0.97–1.09) | 1.12 (1.07–1.14) | <0.001 |
| Albumin (g/dL), median (IQR) | 4.70 (4.56–4.83) | 4.72 (4.47–4.80) | 4.36 (4.05–4.68) | 3.91 (3.52–4.11) | <0.001 |
| Blood urea nitrogen (mg/dL), median (IQR) | 13.0 (10.4–14.5) | 12.3 (10.5–14.1) | 11.7 (10.7–12.6) | 16.6 (14.7–20.4) | 0.035 |
| HbA1c (%), median (IQR) | 6.1 (5.6–7.1) | 6.7 (5.8–8.3) | 7.6 (5.4–8.9) | 6.85 (6.1–7.2) | 0.61 |
| Fasting plasma glucose level (mg/dL), median (IQR) | 102 (92–133) | 112 (97–145) | 193 (109–203) | 133 (109–178) | 0.020 |
| LDL (mg/dL), median (IQR) | 151 (132–165) | 136 (127–150) | 138 (122.3–141) | 107.5 (86–141.5) | 0.015 |
| Triglyceride (mg/dL), median (IQR) | 158 (114–201) | 156.5 (133–201) | 183 (153–197) | 114 (91–174.5) | 0.25 |
| Histological Data | |||||
| NAFLD activity score (NAS), median (IQR) | 4 (3–5) | 5 (4–6) | 3.5 (3–5) | 5 (4–5) | 0.036 |
| F1 (n = 23) | F2 (n = 19) | F3 (n = 6) | F4 (n = 8) | p Value | |
|---|---|---|---|---|---|
| Serum Fibrosis Biomarkers | |||||
| α2-macroglobulin (g/L), median (IQR) | 7.80 (6.00–9.01) | 6.80 (6.56–8.57) | 7.12 (5.78–9.21) | 6.73 (6.20–8.46) | 0.83 |
| Apolipoprotein A1 (g/L), median (IQR) | 1.01 (0.94–1.22) | 1.02 (0.93–1.12) | 1.00 (0.88–1.09) | 0.97 (0.93–1.04) | 0.71 |
| Hyaluronic acid (ng/mL), median (IQR) | 797.2 (733.7–1026.3) | 749.4 (710.0–937.0) | 831.2 (786.0–848.6) | 798.2 (756.8–849.9) | 0.46 |
| TIMP-1 (ng/mL), median (IQR) | 909.2 (812.3–1107.5) | 825.1 (718.8–990.5) | 844.4 (792.8–922.0) | 824.9 (690.4–894.4) | 0.18 |
| PIIINP (ng/mL), median (IQR) | 25.52 (22.82–28.59) | 23.26 (19.45–25.72) | 23.43 (22.41–25.18) | 24.94 (21.91–26.52) | 0.46 |
| MMP-1 (ng/mL), median (IQR) | 7.03 (5.05–12.90) | 5.85 (4.68–6.71) | 6.31 (3.82–6.44) | 3.13 (2.72–4.29) | 0.009 |
| MMP-3 (ng/mL), median (IQR) | 17.67 (16.17–20.10) | 17.40 (15.33–19.45) | 16.84 (15.39–17.26) | 17.57 (16.18–18.59) | 0.50 |
| Noninvasive Tests | |||||
| FIB4 score, median (IQR) | 0.79 (0.55–1.15) | 1.00 (0.59–1.46) | 2.16 (1.81–3.78) | 5.34 (4.25–5.70) | <0.001 |
| NAFLD fibrosis score, median (IQR) | −2.77 (−3.72–−1.22) | −2.14 (−2.64–−0.88) | 0.12 (−0.14–2.05) | 2.15 (1.68–2.90) | <0.001 |
| BARD score, median (IQR) | 1 (1–2) | 2 (1–2) | 4 (4–4) | 4 (3–4) | <0.001 |
| APRI score, median (IQR) | 0.58 (0.41–0.73) | 0.68 (0.41–0.90) | 0.90 (0.58–1.11) | 1.35 (1.10–1.64) | 0.005 |
| F1 (n = 21) | F2 (n = 17) | F3 (n = 4) | F4 (n = 7) | pValue | |
| Imaging Data | |||||
| MRE kPA, median (IQR) | 2.50 (2.40–2.90) | 2.70 (2.20–3.50) | 4.75 (2.95–6.50) | 6.00 (4.00–7.00) | <0.001 |
| MRI-PDFF (%), median (IQR) | 18.0 (14.5–25.5) | 20.0 (16.8–25.3) | 11.5 (5.5–18.3) | 3.0 (1.0–5.0) | 0.012 |
| AUROC (%95 CI) | Optimal Cut-Off | Sensitivity (%) | Specificity (%) | PPV (%) | NPV (%) | p Value | |
|---|---|---|---|---|---|---|---|
| Fibrosis stage ≥ 2 | |||||||
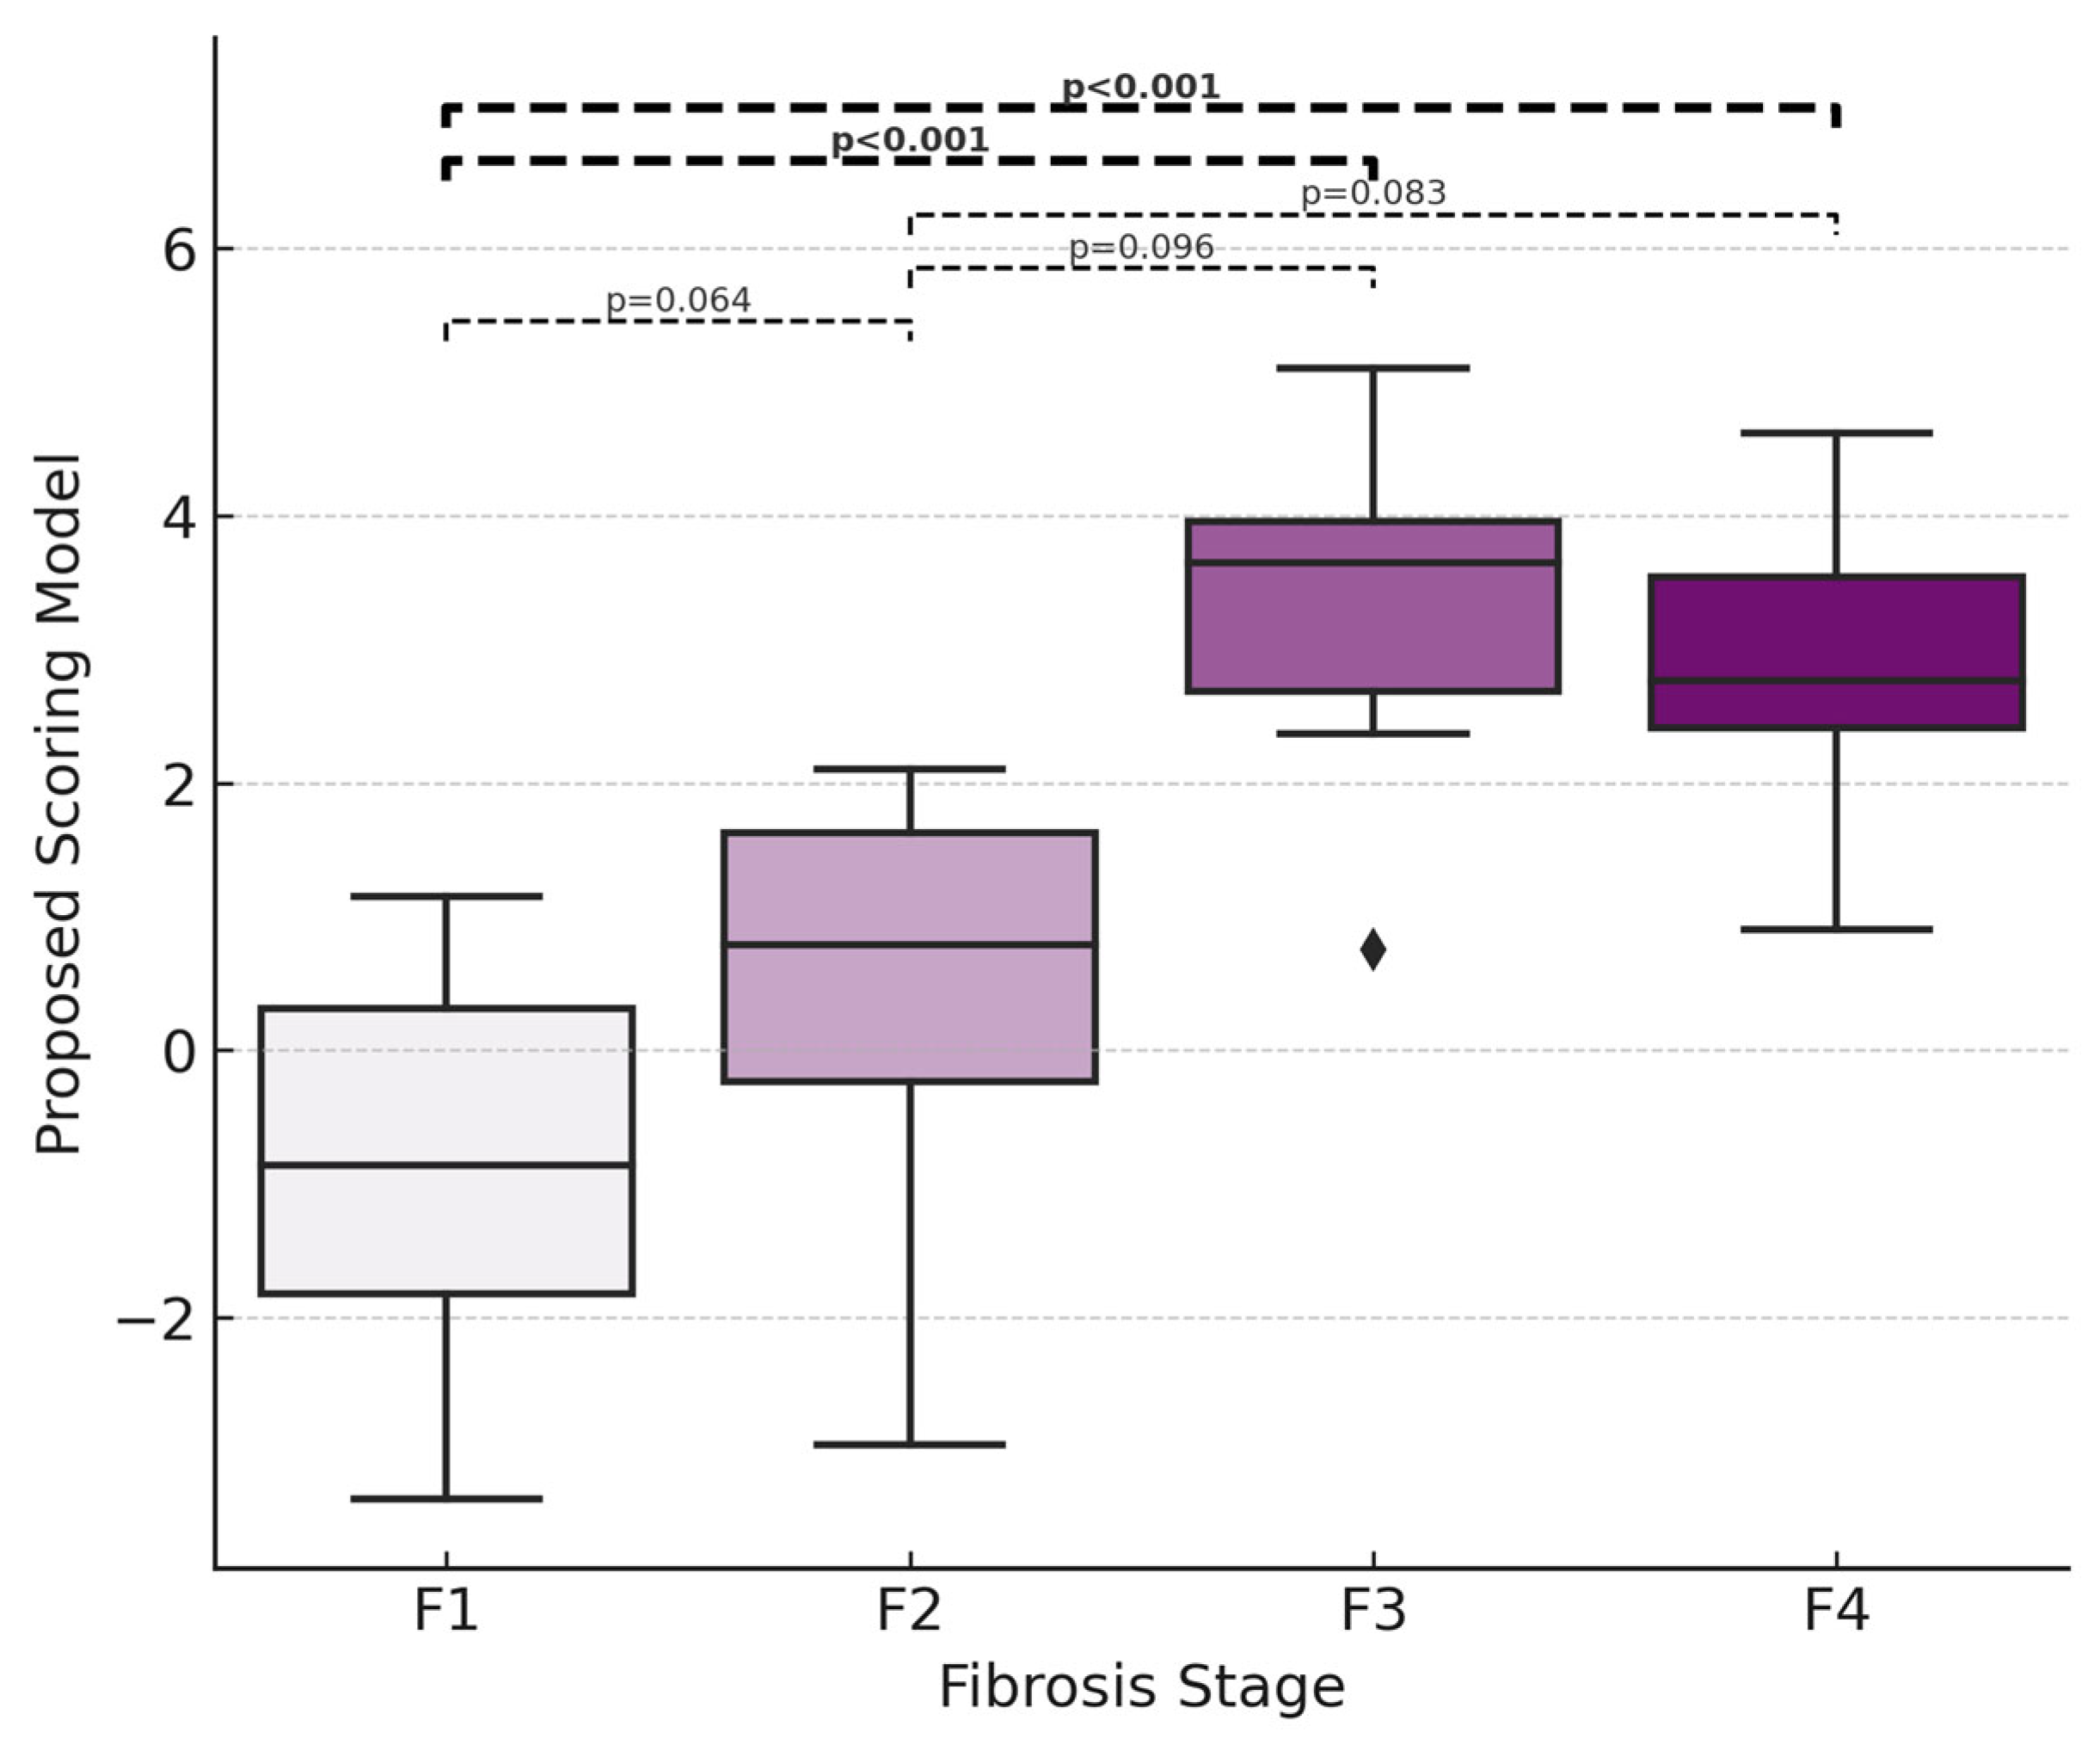
| New score | 0.88 (0.79–0.97) | 0.75 | 77.4 | 90.9 | 92.3 | 74.1 | <0.001 |
| FIB4 score | 0.74 (0.61–0.87) | 1.30 | 60.6 | 87.0 | 87.0 | 60.6 | <0.001 |
| NAFLD fibrosis score | 0.78 (0.66–0.91) | −0.88 | 61.3 | 91.3 | 90.5 | 63.6 | <0.001 |
| BARD score | 0.69 (0.55–0.83) | 3 | 45.2 | 87.0 | 82.4 | 54.1 | 0.008 |
| APRI score | 0.68 (0.54–0.82) | 1.00 | 42.4 | 95.7 | 93.3 | 53.7 | 0.014 |
| MRE kPa | 0.73 (0.59–0.88) | 3.50 | 57.1 | 95.2 | 94.1 | 62.5 | 0.002 |
| Fibrosis stage ≥ 3 | |||||||
| New score | 0.95 (0.90–1.00) | 2.37 | 78.6 | 100.0 | 100.0 | 92.9 | <0.001 |
| FIB4 score | 0.97 (0.94–1.00) | 1.81 | 92.9 | 92.9 | 81.3 | 97.5 | <0.001 |
| NAFLD fibrosis score | 0.99 (0.97–1.00) | −0.46 | 100.0 | 90.0 | 77.8 | 100.0 | <0.001 |
| BARD score | 0.89 (0.76–1.00) | 3 | 92.9 | 90.0 | 76.5 | 97.3 | <0.001 |
| APRI score | 0.79 (0.63–0.96) | 1.00 | 71.4 | 88.1 | 66.7 | 90.2 | <0.001 |
| MRE kPa | 0.90 (0.77–1.00) | 3.50 | 90.7 | 81.6 | 58.8 | 96.9 | <0.001 |
Disclaimer/Publisher’s Note: The statements, opinions and data contained in all publications are solely those of the individual author(s) and contributor(s) and not of MDPI and/or the editor(s). MDPI and/or the editor(s) disclaim responsibility for any injury to people or property resulting from any ideas, methods, instructions or products referred to in the content. |
© 2025 by the authors. Published by MDPI on behalf of the Lithuanian University of Health Sciences. Licensee MDPI, Basel, Switzerland. This article is an open access article distributed under the terms and conditions of the Creative Commons Attribution (CC BY) license (https://creativecommons.org/licenses/by/4.0/).
Share and Cite
Köylü, B.; Sökmensüer, C.; Karçaaltıncaba, M.; Keskin, O. Predicting Fibrosis Stage in MASH: The Role of Total Metabolic Syndrome Score and MMP-1. Medicina 2025, 61, 1102. https://doi.org/10.3390/medicina61061102
Köylü B, Sökmensüer C, Karçaaltıncaba M, Keskin O. Predicting Fibrosis Stage in MASH: The Role of Total Metabolic Syndrome Score and MMP-1. Medicina. 2025; 61(6):1102. https://doi.org/10.3390/medicina61061102
Chicago/Turabian StyleKöylü, Bahadır, Cenk Sökmensüer, Muşturay Karçaaltıncaba, and Onur Keskin. 2025. "Predicting Fibrosis Stage in MASH: The Role of Total Metabolic Syndrome Score and MMP-1" Medicina 61, no. 6: 1102. https://doi.org/10.3390/medicina61061102
APA StyleKöylü, B., Sökmensüer, C., Karçaaltıncaba, M., & Keskin, O. (2025). Predicting Fibrosis Stage in MASH: The Role of Total Metabolic Syndrome Score and MMP-1. Medicina, 61(6), 1102. https://doi.org/10.3390/medicina61061102