
Assessment of the Abnormalities in Chest Computed Tomography and Pulmonary Function Test in Convalescents Six Months After COVID-19

 ,
,  ,
,  , , , , , ,
  , and
, and 
Abstract
1. Introduction
- To assess the results of chest CT in patients six months after infection and compare them with baseline examinations performed during the acute phase during four waves of the pandemic.
- To assess the results of respiratory function tests in patients six months after infection and compare them with the general population during four waves of the pandemic.
- To compare the results of baseline chest CT and respiratory function tests performed six months after COVID-19 in relation to the severity of inflammation during the acute disease stratified by laboratory tests, including interleukin 6, c-reactive protein (CRP), and d-dimer concentration.
- To assess the correlation between abnormalities of baseline chest CT and pulmonary function tests performed six months after COVID-19 with selected laboratory parameters during the acute phase of the disease.
2. Materials and Methods
- Ia: IL-6 > 100 pg/mL (n = 36).
- Ib: IL-6 < 100 pg/mL (n = 111).
- Ic: PLT > 150 × 103/µL (n = 129).
- Id: PLT < 150 × 103/µL (n = 47).
- Ie: d-dimer < 1000 ng/mL (n = 108).
- If: d-dimer > 1000 ng/mL (n = 61).
- Wave 1 (29 February 2020–31 December 2020): Wild-type variants (n = 114).
- Wave 2 (1 January 2021–30 April 2021): Wild-type and Alpha variants (n = 121).
- Wave 3 (1 May 2021–31 December 2021): Delta variant (n = 222).
- Wave 4 (1 January 2022–31 March 2022): Omicron variant (n = 318).
3. Results
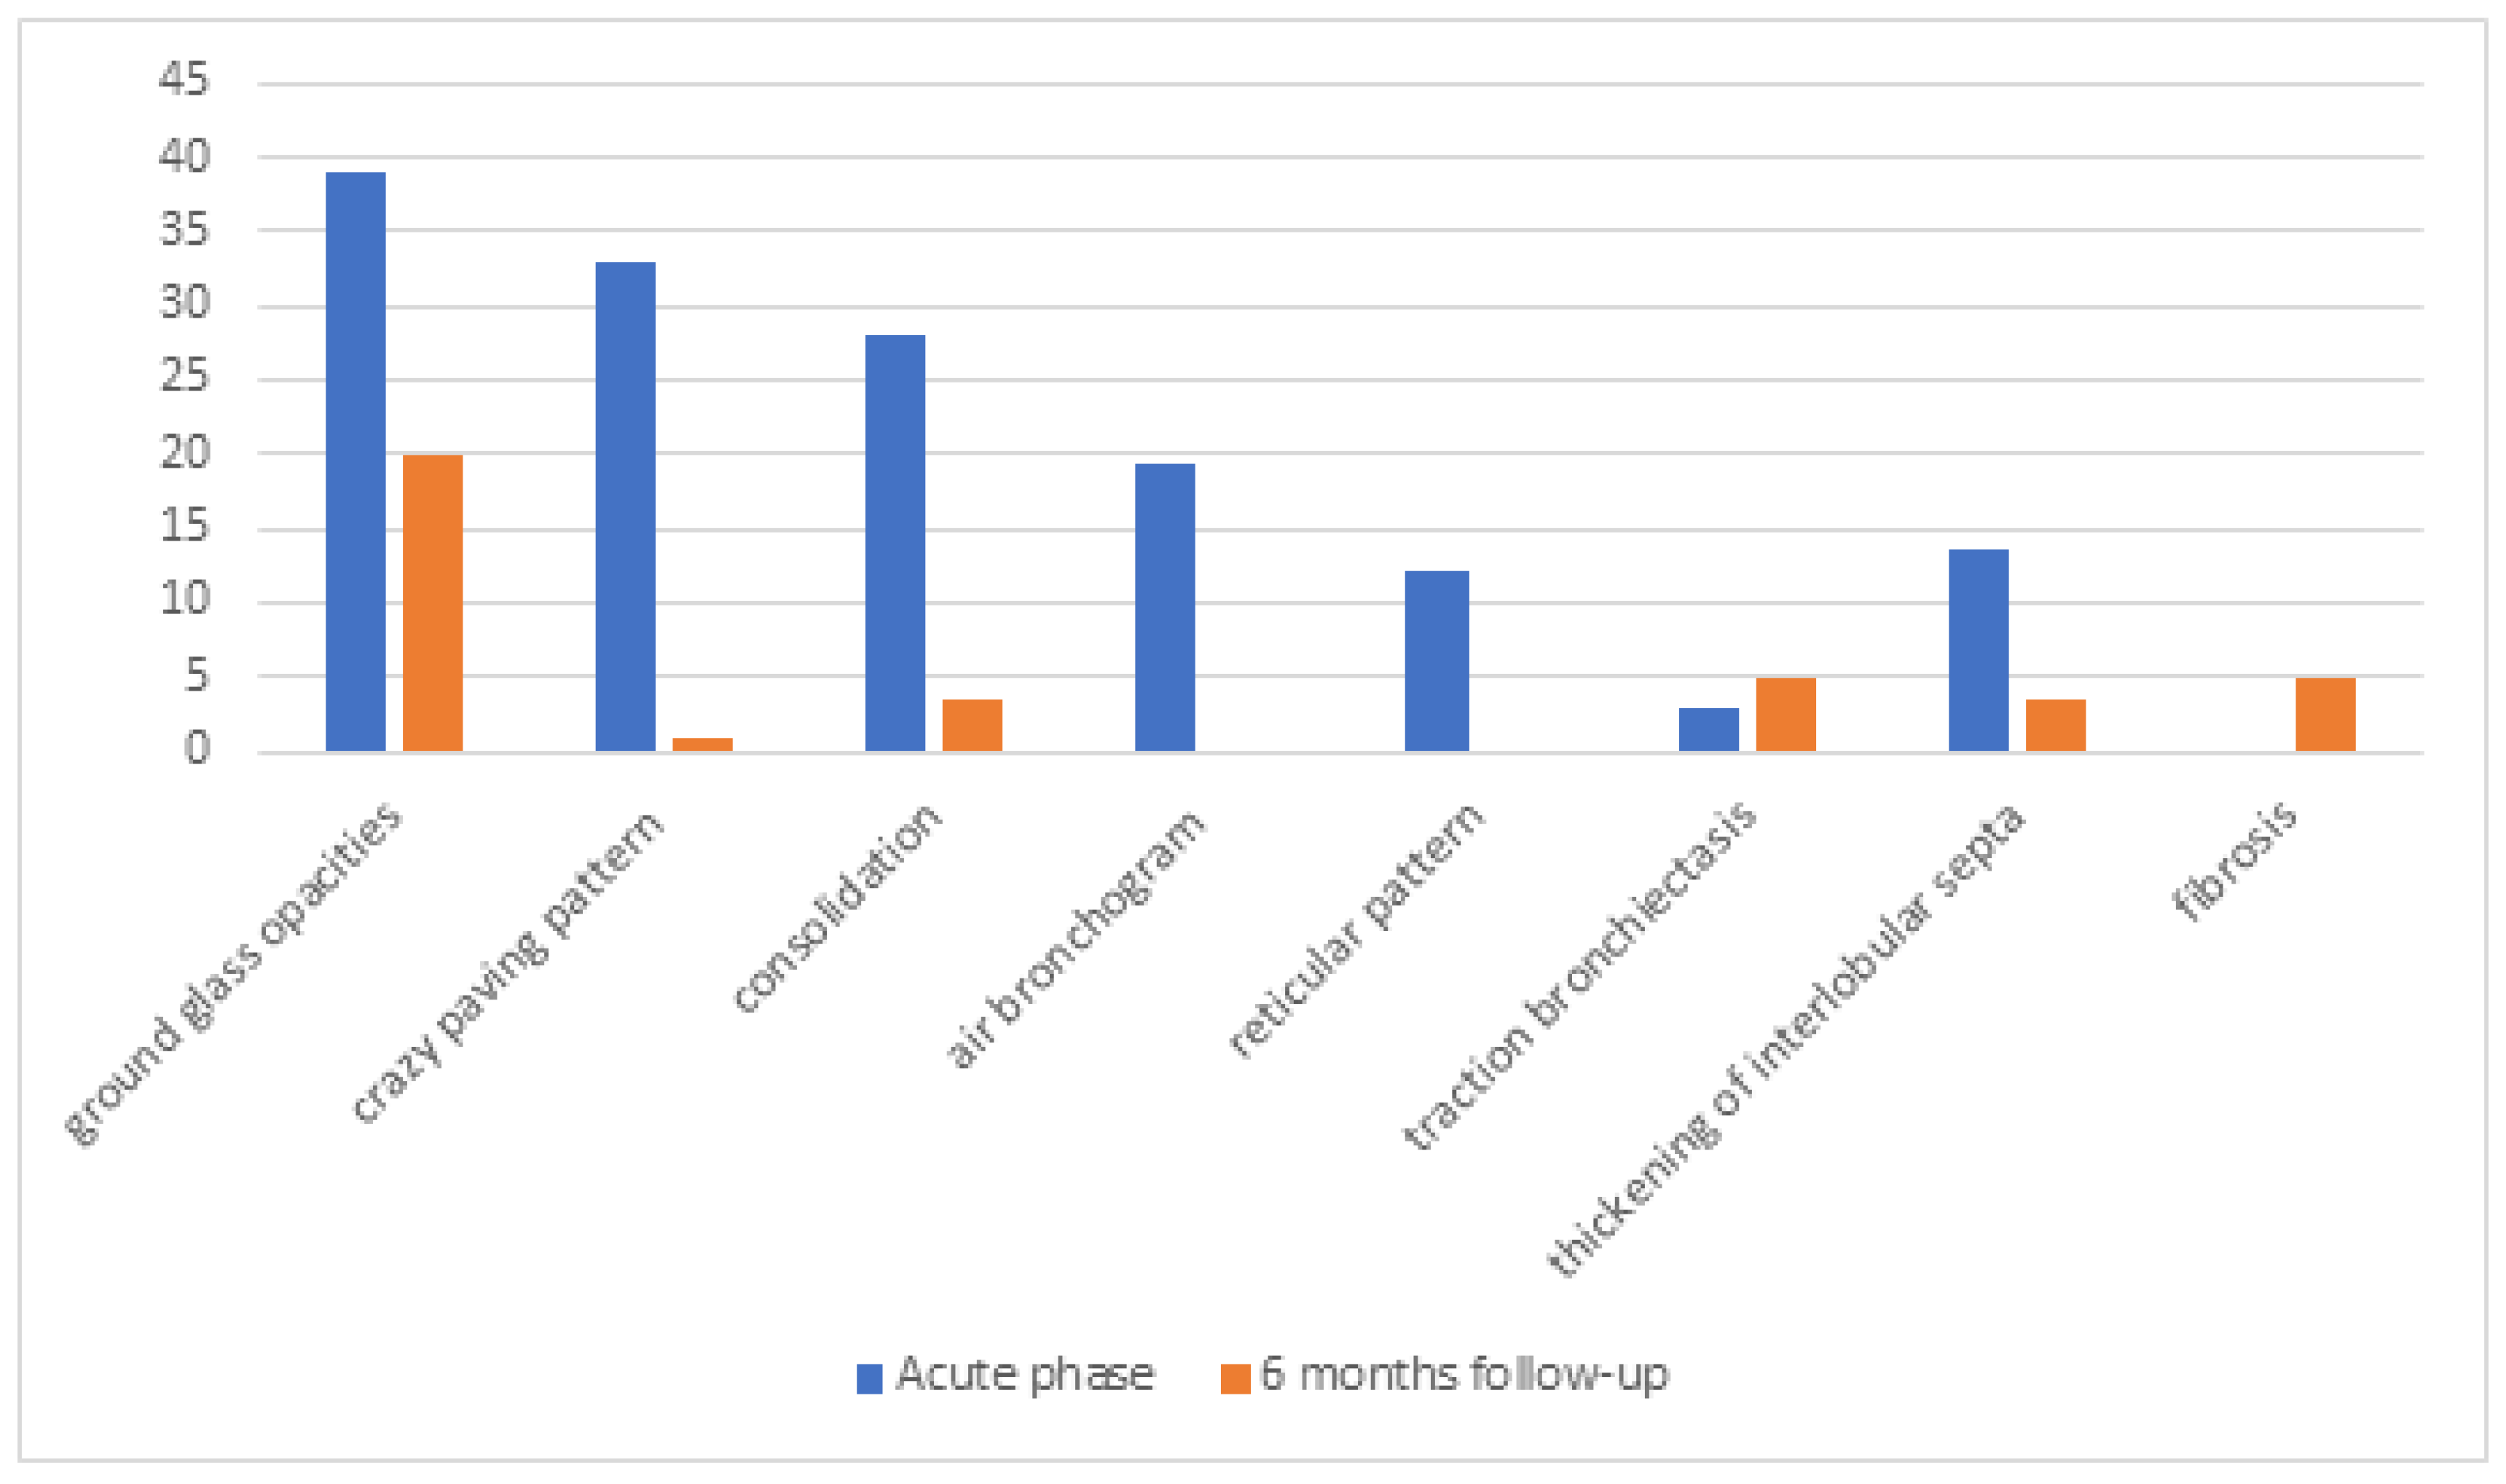
3.1. Comparison of Results of Chest CT Between Symptomatic Patients During the Acute Phase and Six Months After Infection
3.2. Comparison of Results of Pulmonary Function Tests Between Patients Six Months After SARS-CoV-2 Infection and the General Population
3.3. Impact of Laboratory Test Results on Chest CT Findings During the Acute Phase of COVID-19
3.4. Comparison of Results of Pulmonary Function Tests Between Post-COVID-19 Patients and the General Population Regarding the Severity of Inflammation During the Acute Disease
3.5. Assessment of the Associations Between Abnormalities of Chest CT and Respiratory Function Tests with Laboratory Parameters
4. Discussion
5. Conclusions
- Most chest CT abnormalities resolved six months after recovery regardless of the SARS-CoV-2 variants. Routine imaging assessment may result in medically unjustified follow-up chest CT scans.
- Pulmonary function tests in patients recovered from COVID-19 do not differ from the results of the general population.
- Lung parenchyma involvement during the acute phase of infection and results of pulmonary function tests performed six months after recovery do not depend on the concentration of inflammatory parameters.
Author Contributions
Funding
Institutional Review Board Statement
Informed Consent Statement
Data Availability Statement
Acknowledgments
Conflicts of Interest
References
- Torres-Castro, R.; Vasconcello-Castillo, L.; Alsina-Restoy, X.; Solis-Navarro, L.; Burgos, F.; Puppo, H.; Vilaró, J. Respiratory function in patients post-infection by COVID-19: A systematic review and meta-analysis. Pulmonology 2021, 27, 328–337. [Google Scholar] [CrossRef] [PubMed]
- Steinbeis, F.; Thibeault, C.; Doellinger, F.; Ring, R.M.; Mittermaier, M.; Ruwwe-Glösenkamp, C.; Alius, F.; Knape, P.; Meyer, H.-J.; Lippert, L.J.; et al. Severity of respiratory failure and computed chest tomography in acute COVID-19 correlates with pulmonary function and respiratory symptoms after infection with SARS-CoV-2: An observational longitudinal study over 12 months. Respir. Med. 2022, 191, 106709. [Google Scholar] [CrossRef] [PubMed]
- Lee, J.H.; Yim, J.J.; Park, J. Pulmonary function and chest computed tomography abnormalities 6-12 months after recovery from COVID-19: A systematic review and meta-analysis. Respir. Res. 2022, 23, 233. [Google Scholar] [CrossRef]
- Willigen, H.; Wynberg, E.; Verveen, A.; Dijkstra, M.; Verkaik, B.; Figaroa, O.; Nieuwkerk, P.; Boyd, A.; Prins, M.; de Bree, G.; et al. One-fourth of COVID-19 patients have an impaired pulmonary function after 12 months of disease onset. PLoS ONE 2023, 18, e0290893. [Google Scholar] [CrossRef]
- Pan, F.; Yang, L.; Liang, B.; Ye, T.; Li, L.; Li, L.; Liu, D.; Wang, J.; Hesketh, R.L.; Zheng, C. Chest CT Patterns from Diagnosis to 1 Year of Follow-up in Patients with COVID-19. Radiology 2022, 302, 709–719. [Google Scholar] [CrossRef]
- Han, X.; Chen, L.; Fan, Y.; Alwalid, O.; Jia, X.; Zheng, Y.; Liu, J.; Li, Y.; Cao, Y.; Gu, J.; et al. Longitudinal Assessment of Chest CT Findings and Pulmonary Function after COVID-19 Infection. Radiology 2023, 307, e222888. [Google Scholar] [CrossRef]
- Barash, M.; Ramalingam, V. Post-COVID Interstitial Lung Disease and Other Lung Sequelae. Clin. Chest Med. 2023, 44, 263–277. [Google Scholar] [CrossRef]
- Huang, C.; Huang, L.; Wang, Y.; Li, X.; Ren, L.; Gu, X.; Kang, L.; Guo, L.; Liu, M.; Zhou, X.; et al. 6-month consequences of COVID-19 in patients discharged from hospital: A cohort study. Lancet 2023, 401, e21–e33. [Google Scholar] [CrossRef]
- Pietruszka-Wałęka, E.; Rząd, M.; Żabicka, M.; Rożyńska, R.; Miklusz, P.; Zieniuk-Lesiak, E.; Jahnz-Różyk, K. Impact of Symptomatology, Clinical and Radiological Severity of COVID-19 on Pulmonary Function Test Results and Functional Capacity during Follow-Up among Survivors. J. Clin. Med. 2023, 13, 45. [Google Scholar] [CrossRef]
- Sanna, A.; Pellegrino, D.; Messina, E.; Siena, L.M.; Baccolini, V.; D’antoni, L.; Landini, N.; Baiocchi, P.; Villari, P.; Catalano, C.; et al. The Role of Pulmonary Function Testing and Lung Imaging in the Long- Term Follow-Up of Patients with COVID-19 Pneumonia. Respiration 2023, 102, 287–295. [Google Scholar] [CrossRef]
- Lenoir, A.; Christe, A.; Ebner, L.; Beigelman-Aubry, C.; Bridevaux, P.-O.; Brutsche, M.; Clarenbach, C.; Erkosar, B.; Garzoni, C.; Geiser, T.; et al. Pulmonary Recovery 12 Months after Non-Severe and Severe COVID- 19: The Prospective Swiss COVID-19 Lung Study. Respiration 2023, 102, 120–133. [Google Scholar] [CrossRef] [PubMed]
- Björsell, T.; Sundh, J.; Lange, A.; Ahlm, C.; Forsell, M.N.; Tevell, S.; Blomberg, A.; Edin, A.; Normark, J.; Cajander, S. Risk factors for impaired respiratory function post COVID-19: A prospective cohort study of nonhospitalized and hospitalized patients. J. Intern. Med. 2023, 293, 600–614. [Google Scholar] [CrossRef] [PubMed]
- Guziejko, K.; Moniuszko-Malinowska, A.; Czupryna, P.; Dubatówka, M.; Łapińska, M.; Raczkowski, A.; Sowa, P.; Kiszkiel, Ł.; Minarowski, Ł.; Moniuszko, M.; et al. Assessment of Pulmonary Function Tests in COVID-19 Convalescents Six Months after Infection. J. Clin. Med. 2022, 11, 7052. [Google Scholar] [CrossRef]
- Francone, M.; Iafrate, F.; Masci, G.M.; Coco, S.; Cilia, F.; Manganaro, L.; Panebianco, V.; Andreoli, C.; Colaiacomo, M.C.; Zingaropoli, M.A.; et al. Chest CT score in COVID-19 patients: Correlation with disease severity and short-term prognosis. Eur. Radiol. 2020, 30, 6808–6817. [Google Scholar] [CrossRef]
- Chlabicz, M.; Jamiołkowski, J.; Sowa, P.; Zalewska, M.; Kiszkiel, Ł.; Ciołkiewicz, M.; Motkowski, R.; Kowalska, I.; Minarowski, Ł.; Kamiński, K.A. Multimorbidity Patterns in the Urban Population in Poland. J. Clin. Med. 2023, 12, 5860. [Google Scholar] [CrossRef]
- Zieleniewska, N.A.; Szum-Jakubowska, A.; Chlabicz, M.; Jamiołkowski, J.; Kowalska, I.; Kamiński, K.A. The prevalence of diabetes and prediabetes: A population-based study. Pol. Arch. Intern. Med. 2023, 133, 16407. [Google Scholar] [CrossRef]
- Stanojevic, S.; Kaminsky, D.A.; Miller, M.R.; Thompson, B.; Aliverti, A.; Barjaktarevic, I.; Cooper, B.G.; Culver, B.; Derom, E.; Hall, G.L.; et al. ERS/ATS technical standard on interpretive strategies for routine lung function tests. Eur. Respir. J. 2022, 60, 2101499. [Google Scholar] [CrossRef]
- Flisiak, R.; Rzymski, P.; Zarębska-Michaluk, D.; Ciechanowski, P.; Dobrowolska, K.; Rogalska, M.; Jaroszewicz, J.; Szymanek-Pasternak, A.; Rorat, M.; Kozielewicz, D.; et al. Variability in the Clinical Course of COVID-19 in a Retrospective Analysis of a Large Real-World Database. Viruses 2023, 15, 149. [Google Scholar] [CrossRef]
- Charkiewicz, R.; Nikliński, J.; Biecek, P.; Kiśluk, J.; Pancewicz, S.; Moniuszko-Malinowska, A.M.; Flisiak, R.; Krętowski, A.J.; Dzięcioł, J.; Moniuszko, M.; et al. The first SARS-CoV-2 genetic variants of concern (VOC) in Poland: The concept of a comprehensive approach to monitoring and surveillance of emerging variants. Adv. Med. Sci. 2021, 66, 237–245. [Google Scholar] [CrossRef]
- Guziejko, K.; Tałałaj, J.; Czupryna, P.; Moniuszko-Malinowska, A. Long COVID. Przegl. Epidemiol. 2022, 76, 287–295. [Google Scholar] [CrossRef]
- Flisiak, R.; Rzymski, P.; Zarębska-Michaluk, D.; Rogalska, M.; Rorat, M.; Czupryna, P.; Lorenc, B.; Ciechanowski, P.; Kozielewicz, D.; Piekarska, A.; et al. Demographic and Clinical Overview of Hospitalized COVID-19 Patients during the First 17 Months of the Pandemic in Poland. J. Clin. Med. 2021, 11, 117. [Google Scholar] [CrossRef] [PubMed]
- Rzymski, P.; Pazgan-Simon, M.; Kamerys, J.; Moniuszko-Malinowska, A.; Sikorska, K.; Wernik, J.; Zarębska-Michaluk, D.; Supronowicz, Ł.; Sobala-Szczygieł, B.; Skrzat-Klapaczyńska, A.; et al. Severe Breakthrough COVID-19 Cases during Six Months of Delta Variant (B.1.617.2) Domination in Poland. Vaccines 2022, 10, 557. [Google Scholar] [CrossRef] [PubMed]
- Huntley, C.C.; Patel, K.; Bushra, S.-E.B.; Mobeen, F.; Armitage, M.N.; Pye, A.; Knight, C.B.; Mostafa, A.; Kershaw, M.; Mughal, A.Z.; et al. Pulmonary function test and computed tomography features during follow-up after SARS, MERS and COVID-19: A systematic review and meta-analysis. ERJ Open Res. 2022, 8, 00056-2022. [Google Scholar] [CrossRef] [PubMed]
- Lalwani, M.; Taksande, A.B. Pulmonary Function Test as a Diagnostic Tool for Post- COVID-19 Effects. Cureus 2023, 15, e34751. [Google Scholar] [CrossRef]
- Bocchino, M.; Rea, G.; Capitelli, L.; Lieto, R.; Bruzzese, D. Chest CT Lung Abnormalities 1 Year after COVID-19: A Systematic Review and Meta-Analysis. Radiology 2023, 308, e230535. [Google Scholar] [CrossRef]
- Mazzone, P.J.; Gould, M.K.; Arenberg, D.A.; Chen, A.C.; Choi, H.K.; Detterbeck, F.C.; Farjah, F.; Fong, K.M.; Iaccarino, J.M.; Janes, S.M.; et al. Management of Lung Nodules and Lung Cancer Screening During the COVID-19 Pandemic: CHEST Expert Panel Report. Radiol. Imaging Cancer 2020, 2, e204013. [Google Scholar] [CrossRef]
- Lam, S.; Bai, C.; Baldwin, D.R.; Chen, Y.; Connolly, C.; de Koning, H.; Heuvelmans, M.A.; Hu, P.; Kazerooni, E.A.; Lancaster, H.L.; et al. Current and Future Perspectives on Computed Tomography Screening for Lung Cancer: A Roadmap From 2023 to 2027 From the International Association for the Study of Lung Cancer. J. Thorac. Oncol. 2024, 19, 36–51. [Google Scholar] [CrossRef]
- Chen, G.; Wu, D.; Guo, W.; Cao, Y.; Huang, D.; Wang, H.; Wang, T.; Zhang, X.; Chen, H.; Yu, H.; et al. Clinical and immunological features of severe and moderate coronavirus disease 2019. J. Clin. Investig. 2020, 130, 2620–2629. [Google Scholar] [CrossRef]
- Hariyanto, T.I.; Japar, K.V.; Kwenandar, F.; Damay, V.; Siregar, J.I.; Lugito, N.P.H.; Tjiang, M.M.; Kurniawan, A. Inflammatory and hematologic markers as predictors of severe outcomes in COVID-19 infection: A systematic review and meta-analysis. Am. J. Emerg. Med. 2021, 41, 110–119. [Google Scholar] [CrossRef]
- Jiang, S.; Huang, Q.; Xie, W.; Lv, C.; Quan, X. The association between severe COVID-19 and low platelet count: Evidence from 31 observational studies involving 7613 participants. Br. J. Haematol. 2020, 190, e29–e33. [Google Scholar] [CrossRef]
- Marin, B.G.; Aghagoli, G.; Lavine, K.; Yang, L.; Siff, E.J.; Chiang, S.S.; Salazar-Mather, T.P.; Dumenco, L.; Savaria, M.C.; Aung, S.N.; et al. Predictors of COVID-19 severity: A literature review. Rev. Med. Virol. 2021, 31, 1–10. [Google Scholar] [CrossRef] [PubMed]
- Czupryna, P.; Moniuszko-Malinowska, A.; Rogalska, M.; Zarębska-Michaluk, D.; Lorenc, B.; Rorat, M.; Kozielewicz, D.; Tudrujek-Zdunek, M.; Sikorska, K.; Berkan-Kawińska, A.; et al. Inflammatory and thrombotic parameters associated with the COVID-19 course in Poland (SARSTer study). Adv. Med. Sci. 2022, 67, 291–297. [Google Scholar] [CrossRef] [PubMed]
- Tan, C.; Huang, Y.; Shi, F.; Tan, K.; Ma, Q.; Chen, Y.; Jiang, X.; Li, X. C-reactive protein correlates with computed tomographic findings and predicts severe COVID-19 early. J. Med. Virol. 2020, 92, 856–862. [Google Scholar] [CrossRef] [PubMed]
- Calandriello, L.; De Lorenzis, E.; Cicchetti, G.; D’abronzo, R.; Infante, A.; Castaldo, F.; Del Ciello, A.; Farchione, A.; Gremese, E.; Marano, R.; et al. Extension of Lung Damage at Chest Computed Tomography in Severely Ill COVID-19 Patients Treated with Interleukin-6 Receptor Blockers Correlates with Inflammatory Cytokines Production and Prognosis. Tomography 2023, 9, 981–994. [Google Scholar] [CrossRef]

| Age | ||
| Mean | 50 | |
| Min.–Max. | 23–78 | |
| Sex | ||
| Male | 117 | |
| Female | 115 | |
| IL-6 (pg/mL) | ||
| Normal range < 7.0 | ||
| Mean | 75.52 | |
| Min.–Max. | 1.5–624 | |
| CRP (mg/L) | ||
| Normal range: 0.00–5.00 | ||
| Mean | 74 | |
| Min.–Max. | 0.3–446.08 | |
| D-dimer (ng/mL) | ||
| Normal range < 500 | ||
| Mean | 1354 | |
| Min.–Max. | 1–63,564 | |
| WBC (10′3/µL) | ||
| Normal range: 4.00–10.00 | ||
| Mean | 6.9 | |
| Min.–Max. | 1.74–95.33 | |
| PLT (10′3/µL) | ||
| Normal range: 150–300 | ||
| Mean | 205 | |
| Min.–Max. | 31–794 | |
| Therapy (number of patients) | ||
| Remdesivir | 41 | |
| Tocilizumab | 29 | |
| Lopinavir + ritonavir | 6 | |
| FFP | 48 | |
| Dexamethasone | ||
| Number of treated patients | 126 | |
| Median dose (mg daily) | 6 | |
| Median duration (days) | 9 | |
| Antibiotic (number of treated patients) | ||
| Levofloxacin | 122 | |
| Ceftriaxone | 39 | |
| Sulfamethoxazole + trimethoprim | 2 | |
| Macrolides | 9 | |
| Amoxicillin + clavulanic acid | 2 | |
| Chloroquine | 13 | |
| Vaccinated (number of patients) | 113 | |
| Variable | Mean | Median | Min. | Max. | SD | Mean | Median | Min. | Max. | SD | p |
|---|---|---|---|---|---|---|---|---|---|---|---|
| Group I n = 232 | Group II n = 543 | ||||||||||
| FEV1 (L) | 3.37 | 3.32 | 1.24 | 6.28 | 0.94 | 4.20 | 4.11 | 1.40 | 7.25 | 1.119 | 0.638 |
| % p.v. | 102 | 102 | 56 | 134 | 13.83507 | 101 | 102 | 46 | 146 | 13.52042 | 0.169 |
| FVC (L) | 4.22 | 4.22 | 1.62 | 7.82 | 1.18 | 3.33 | 3.28 | 1.14 | 5.87 | 0.91 | 0.908 |
| % p.v. | 101 | 101 | 47 | 135 | 13.51826 | 100 | 101 | 45 | 156 | 14.61207 | 0.996 |
| FEV1/FVC | 80.04 | 79.80 | 63.70 | 96.70 | 5.432 | 79.23 | 79.70 | 42.70 | 99.50 | 6.82036 | 0.159 |
| % p.v. | 100 | 100 | 79 | 124 | 6.92702 | 99 | 99 | 57 | 128 | 7.94838 | 0.004 |
| TLC (L) | 5.99 | 5.86 | 3.53 | 9.54 | 1.30 | 6.05 | 5.97 | 2.88 | 11.23 | 1.32648 | 0.569 |
| % p.v. | 99 | 98 | 65 | 149 | 12.45986 | 101 | 100 | 0.00000 | 160 | 14.70669 | 0.103 |
| DLCO (L) | 4.21 | 4.21 | 2.30 | 6.15 | 0.64 | 4.18 | 4.14 | 0.97 | 13.55 | 0.79251 | 0.395 |
| % p.v. | 72 | 72 | 39 | 102 | 10.82873 | 71 | 70 | 0.00000 | 229 | 13.93773 | 0.181 |
| Group I a (IL-6 > 100 pg/mL) n = 36 | Group I b (IL-6 < 100 pg/mL) n = 111 | ||||||||||
| FEV1 (L) | 3.37 | 3.44 | 1.54 | 5.19 | 0.94468 | 3.38 | 3.29 | 1.24 | 6.28 | 0.93133 | 0.977 |
| % p.v. | 102 | 102 | 59 | 126 | 12.83129 | 101 | 103 | 56 | 134 | 15.39898 | 0.824 |
| FVC (L) | 4.19 | 4.26 | 1.62 | 6.83 | 1.27 | 4.24 | 4.26 | 1.70 | 7.82 | 1.15437 | 0.950 |
| % p.v. | 99 | 102 | 47 | 131 | 14.42535 | 101 | 99 | 60 | 129 | 14.47683 | 0.747 |
| FEV1/FVC | 79.82 | 79.80 | 63.7 | 96.70 | 5.356 | 81.39 | 81.15 | 68.30 | 95.40 | 5.29543 | 0.102 |
| % p.v. | 100 | 100 | 79 | 122 | 6.64381 | 103 | 104 | 86 | 124 | 7.10940 | 0.019 |
| TLC (L) | 6.05 | 5.92 | 3.65 | 9.54 | 1.28 | 6.05 | 5.92 | 3.65 | 9.54 | 1.28066 | 0.744 |
| % p.v. | 98 | 98 | 65 | 143 | 12.51138 | 95 | 96 | 65 | 149 | 14.49745 | 0.158 |
| DLCO (L) | 4.18 | 4.18 | 2.3 | 5.74 | 0.64 | 3.92 | 3.96 | 2.73 | 4.75 | 0.58797 | 0.074 |
| % p.v. | 72 | 72 | 39 | 96 | 11.15244 | 70 | 70 | 49 | 92 | 11.04728 | 0.552 |
| Group I c (PLT > 150 10′3/µL) n = 129 | Group I d (PLT < 150 10′3/µL) n = 47 | ||||||||||
| FEV1 (L) | 3.36 | 3.29 | 1.54 | 6.28 | 0.92470 | 3.29 | 3.47 | 1.24 | 5.08 | 0.88502 | 0.842 |
| % p.v. | 102 | 102 | 59 | 134 | 12.93905 | 98 | 99 | 56 | 124 | 16.76967 | 0.222 |
| FVC (L) | 4.21 | 4.26 | 1.62 | 7.82 | 1.18587 | 4.12 | 4.22 | 1.70 | 6.54 | 1.11369 | 0.755 |
| % p.v. | 101 | 101 | 47 | 131 | 13.24848 | 97 | 98 | 60 | 125 | 15.43371 | 0.153 |
| FEV1/FVC | 80.19 | 80.40 | 63.70 | 96.70 | 5.70905 | 79.86 | 79.50 | 68.40 | 89.70 | 4.76430 | 0.719 |
| % p.v. | 101 | 101 | 79 | 124 | 7.18985 | 100 | 100 | 86 | 115 | 6.52758 | 0.753 |
| TLC (L) | 5.96 | 5.78 | 3.53 | 9.54 | 1.33434 | 5.95 | 5.98 | 3.65 | 8.03 | 1.16695 | 0.898 |
| % p.v. | 98 | 98 | 65 | 143 | 11.93104 | 97 | 95 | 65 | 149 | 13.67889 | 0.353 |
| DLCO (L) | 4.17 | 4.19 | 2.89 | 5.91 | 0.59064 | 4.12 | 4.20 | 2.30 | 5.74 | 0.73724 | 0.854 |
| % p.v. | 72 | 71 | 49 | 99 | 10.56927 | 71 | 72 | 39 | 95 | 11.48615 | 0.974 |
| Group I e (d-dimer < 1000 ng/mL) n = 108 | Group I f (d-dimer > 1000 ng/mL) n = 61 | ||||||||||
| FEV1 (L) | 3.33 | 3.28 | 1.24 | 5.19 | 0.83927 | 3.34 | 3.38 | 1.54 | 6.28 | 1.03635 | 0.861 |
| % p.v. | 102 | 102 | 56 | 134 | 14.18625 | 101 | 102 | 59 | 130 | 14.84052 | 0.967 |
| FVC (L) | 4.18 | 4.29 | 1.70 | 6.83 | 1.07 | 4.15 | 4.10 | 1.62 | 7.82 | 1.33964 | 0.596 |
| % p.v. | 101 | 100 | 60 | 131 | 13.61881 | 99 | 100 | 47 | 126 | 15.13241 | 0.672 |
| FEV1/FVC | 79.82 | 79.85 | 63.70 | 96.70 | 5.44787 | 80.91 | 80.90 | 69.70 | 95.40 | 5.09892 | 0.279 |
| % p.v. | 100 | 100 | 79 | 122 | 6.87570 | 102 | 102 | 86 | 124 | 7.01389 | 0.302 |
| TLC (L) | 5.99 | 5.92 | 4.02 | 8.63 | 1.19067 | 5.88 | 5.63 | 3.53 | 9.54 | 1.48830 | 0.472 |
| % p.v. | 99 | 98 | 75 | 149 | 11.66950 | 96 | 96 | 65 | 133 | 13.74404 | 0.295 |
| DLCO (L) | 4.24 | 4.26 | 2.89 | 5.91 | 0.61545 | 4.03 | 4.04 | 2.30 | 5.74 | 0.62203 | 0.065 |
| % p.v. | 73 | 73 | 48 | 99 | 10.81397 | 70 | 71 | 39 | 95 | 10.08383 | 0.027 |
| Group I n (%) | Group II n (%) | |
|---|---|---|
| Hypertension | 99 (42.7%) | 157 (28.9%) |
| Heart failure | 3 (1.3%) | 12 (2.2%) |
| Diabetes | 19 (8.2%) | 39 (7.2%) |
| Obesity | 102 (44%) | 133 (24.5%) |
| Renal insufficiency | 17 (7.3%) | 30 (5.5%) |
| Cancer | 24 (10.3%) | 31 (5.7%) |
| Chronic obstructive pulmonary disease | 8 (3.4%) | 14 (2.6%) |
| Asthma | 17 (7.3%) | 26 (4.8%) |
| Vaccination | 113 (49%) | 188 (35%) |
| Chest CT | Patient No. 1 | Patient No. 2 | ||
|---|---|---|---|---|
| Baseline | Follow-Up | Baseline | Follow-Up | |
| Ground glass opacity | + | + | - | + |
| Crazy paving pattern | + | - | + | - |
| Consolidation | - | - | + | - |
| Reticular pattern | - | + | - | + |
| Thickening of interlobular septa | + | - | + | - |
| Traction bronchiectasis | - | - | - | - |
| Air bronchogram | + | + | - | - |
| Bilateral distribution | + | + | + | + |
| Peripheral distribution | + | + | + | - |
| Diffuse lesion | + | + | + | + |
| Lung parenchyma involvement | 40% | 1% | 19/25 | 17/25 |
| CT Findings | IL-6 (pg/mL) | PLT (10’3/µL) | d-Dimer (ng/mL) | ||||||
|---|---|---|---|---|---|---|---|---|---|
| >100 | <100 | p | PLT > 150 | PLT < 150 | p | >1000 | <1000 | p | |
| Ground glass opacity | 33/37 (89%) | 7/10 (70%) | 0.406 | 36/47 (77%) | 10/12 (83%) | 0.844 | 37/40 (92%) | 10/16 (62%) | 0.058 |
| Crazy paving pattern | 21/36 (58%) | 9/10 (90%) | 0.068 | 31/46 (67%) | 8/12 (67%) | 0.971 | 25/39 (64%) | 12/16 (75%) | 0.445 |
| Consolidation | 20/36 | 7/10 | 25/46 | 8/12 | 20/39 | 11/16 | |||
| 0.425 | 0.453 | 0.244 | |||||||
| (55%) | (70%) | (54%) | (67%) | (51%) | (69%) | ||||
| Reticular pattern | 9/36 (25%) | 1/10 (10%) | 0.323 | 10/45 (22%) | 4/12 (33%) | 0.438 | 9/39 (25%) | 5/16 (31%) | 0.574 |
| Thickening of interlobular septa | 11/36 (30%) | 3/10 (30%) | 0.986 | 14/46 (30%) | 2/12 (17%) | 0.352 | 13/39 (33%) | 3/16 (19%) | 0.289 |
| Traction bronchiectasis | 0/36 (0%) | 0/10 (0%) | - | 0/46 (0%) | 0/12 (0%) | - | 0/39 (0%) | 0/16 (0%) | - |
| Air bronchogram | 2/36 (5%) | 2/10 (20%) | 0.164 | 5/46 (11%) | 0/12 (0%) | 0.238 | 1/39 (3%) | 3/16 (19%) | 0.042 |
| Bilateral distribution | 23/35 | 2/10 (20%) | 0.754 | 28/45 | 9/12 | 0.420 | 23/39 | 12/16 | 0.271 |
| (64%) | (62%) | (75%) | (59%) | (75%) | |||||
| Peripheral distribution | 3/36 (8%) | 2/10 (20%) | 0.311 | 4/45 (9%) | 2/12 (17%) | 0.450 | 4/39 (10%) | 1/16 (6%) | 0.637 |
| FEV1 (L) | FVC (L) | TLC (L) | DLCO (L) | IL-6 (pg/mL) | PLT (10’3/µL) | d-Dimer (ng/mL) | |
|---|---|---|---|---|---|---|---|
| FEV1 (L) | 1.00 | 0.96 | 0.69 | 0.23 | 0.06 | −0.06 | −0.08 |
| FVC (L) | 0.96 | 1.00 | 0.78 | 0.13 | 0.04 | −0.06 | −0.11 |
| TLC (L) | 0.69 | 0.78 | 1.00 | −0.04 | 0.03 | −0.06 | −0.11 |
| DLCO (L) | 0.23 | 0.13 | −0.04 | 1.00 | −0.07 | −0.03 | −0.15 |
| IL-6 (pg/mL) | 0.06 | 0.04 | 0.03 | −0.07 | 1.00 | −0.03 | 0.31 |
| PLT (10′3/µL) | −0.06 | −0.06 | −0.06 | −0.03 | −0.03 | 1.00 | 0.06 |
| d-dimer (ng/mL) | −0.08 | −0.11 | −0.11 | −0.15 | 0.31 | 0.06 | 1.00 |
Disclaimer/Publisher’s Note: The statements, opinions and data contained in all publications are solely those of the individual author(s) and contributor(s) and not of MDPI and/or the editor(s). MDPI and/or the editor(s) disclaim responsibility for any injury to people or property resulting from any ideas, methods, instructions or products referred to in the content. |
© 2025 by the authors. Published by MDPI on behalf of the Lithuanian University of Health Sciences. Licensee MDPI, Basel, Switzerland. This article is an open access article distributed under the terms and conditions of the Creative Commons Attribution (CC BY) license (https://creativecommons.org/licenses/by/4.0/).
Share and Cite
Guziejko, K.; Moniuszko-Malinowska, A.; Flisiak, R.; Czupryna, P.; Sołomacha, S.; Sowa, P.; Dubatówka, M.; Łapińska, M.; Kiszkiel, Ł.; Szczerbiński, Ł.; et al. Assessment of the Abnormalities in Chest Computed Tomography and Pulmonary Function Test in Convalescents Six Months After COVID-19. Medicina 2025, 61, 823. https://doi.org/10.3390/medicina61050823
Guziejko K, Moniuszko-Malinowska A, Flisiak R, Czupryna P, Sołomacha S, Sowa P, Dubatówka M, Łapińska M, Kiszkiel Ł, Szczerbiński Ł, et al. Assessment of the Abnormalities in Chest Computed Tomography and Pulmonary Function Test in Convalescents Six Months After COVID-19. Medicina. 2025; 61(5):823. https://doi.org/10.3390/medicina61050823
Chicago/Turabian StyleGuziejko, Katarzyna, Anna Moniuszko-Malinowska, Robert Flisiak, Piotr Czupryna, Sebastian Sołomacha, Paweł Sowa, Marlena Dubatówka, Magda Łapińska, Łukasz Kiszkiel, Łukasz Szczerbiński, and et al. 2025. "Assessment of the Abnormalities in Chest Computed Tomography and Pulmonary Function Test in Convalescents Six Months After COVID-19" Medicina 61, no. 5: 823. https://doi.org/10.3390/medicina61050823
APA StyleGuziejko, K., Moniuszko-Malinowska, A., Flisiak, R., Czupryna, P., Sołomacha, S., Sowa, P., Dubatówka, M., Łapińska, M., Kiszkiel, Ł., Szczerbiński, Ł., Laskowski, P. P., Alimowski, M., Trojan, G., & Kamiński, K. A. (2025). Assessment of the Abnormalities in Chest Computed Tomography and Pulmonary Function Test in Convalescents Six Months After COVID-19. Medicina, 61(5), 823. https://doi.org/10.3390/medicina61050823