Article

Type 2 Diabetes Mellitus and Osteoporosis: Site-Specific Bone Mineral Density Variations and Metabolic Correlations in Postmenopausal Saudi Women

by
Nogood Mashahi Alhowiti
1,
Amal M. H. Mackawy
1,2,*,
Wanian Mohammed Al Wanian
1,
Mohammad Alshebremi
1,
Khaled S. Allemailem
1 and
Hajed Obaid Abdullah Alharbi
1,*
1
Department of Medical Laboratories, College of Applied Medical Sciences, Qassim University, Burydah 51452, Saudi Arabia
2
Department of Medical Biochemistry and Molecular Biology, Faculty of Medicine, Zagazig University, Zagazig City 7120730, Egypt
*
Authors to whom correspondence should be addressed.
Medicina 2025, 61(5), 789; https://doi.org/10.3390/medicina61050789
Submission received: 11 March 2025 / Revised: 31 March 2025 / Accepted: 18 April 2025 / Published: 24 April 2025
(This article belongs to the Section Endocrinology)

Abstract

Background and Objectives: Osteoporosis (OP) is a prevalent condition among postmenopausal women, with an estimated 40% of Saudi women affected. Concurrently, type 2 diabetes mellitus (T2DM) is highly prevalent in the Qassim region, affecting 45% of individuals aged 40 and older. Despite conflicting evidence regarding the impact of T2DM on bone health, its role in OP development remains uncertain. Materials and Methods: This study investigates site-specific bone mineral density (BMD) variations and their metabolic correlations in postmenopausal Saudi women with T2DM. A cross-sectional study included 250 postmenopausal Saudi women, 100 without diabetes (Group 1) and 150 with diabetes (Group 2), matched for age, menopausal duration, and body mass index (BMI). BMD at the femoral neck (FN) and lumbar spine (LS) was assessed using dual-energy X-ray absorptiometry (DXA). Biochemical markers, including parathyroid hormone (PTH), alkaline phosphatase (ALP), estrogen, calcium, and HbA1c, were assessed. Statistical analyses, including chi-square tests, t-tests, ANOVA, Pearson correlation, and multivariate regression, evaluated BMD variations and biochemical associations. Results: Patients with diabetes exhibited significantly higher FN T-scores than those without diabetes (p = 0.001), while LS T-scores showed no significant difference. BMD distribution (normal, osteopenia, OP) did not differ between the groups (p > 0.05). FN T-scores correlated positively with parathyroid hormone (PTH) and alkaline phosphatase (ALP) levels, reduced estrogen, and prolonged menopause duration (p < 0.01) but were inversely associated with estrogen levels and menopause duration (p < 0.01). Conclusions: No significant association was found between HbA1c and BMD. Additionally, BMI demonstrated a protective effect on FN BMD. T2DM appears to influence bone metabolism without directly causing OP in postmenopausal women. Aging, menopause duration, metabolic markers (PTH, ALP, estrogen), and BMI play crucial roles in BMD variations, with a protective effect of BMI. These findings underscore the importance of site-specific BMD assessment and metabolic profiling in postmenopausal women with diabetes. Further longitudinal research is needed to elucidate the underlying mechanisms affecting bone health in postmenopausal women with diabetes.

1. Introduction

Osteoporosis (OP) and type 2 diabetes mellitus (T2DM) are two of the most prevalent chronic conditions affecting postmenopausal women worldwide, and both of them pose significant risks for fractures and metabolic complications [1,2]. OP is characterized by reduced bone mineral density (BMD) and deterioration of bone microarchitecture, leading to an increased risk of fractures [3]. T2DM, a metabolic disorder primarily driven by insulin resistance, has been associated with alterations in bone metabolism, with growing evidence suggesting that patients with diabetes have an increased risk of fragility fractures despite normal or higher BMD values [4,5].
In Saudi Arabia, the prevalence of osteoporosis is alarmingly high, affecting approximately 40% of postmenopausal women, with regional variations influenced by genetic, dietary, and lifestyle factors [6]. Simultaneously, the burden of T2DM continues to rise, with estimates indicating that nearly 45% of individuals aged 40 and older in the Qassim region have diabetes [7]. The complex interplay between these two conditions remains a subject of ongoing debate, with conflicting reports regarding the impact of T2DM on bone health. While some studies suggest that hyperinsulinemia may exert anabolic effects on bone mass, others highlight the detrimental impact of chronic hyperglycemia and advanced glycation end-products (AGEs) on bone quality and strength [8,9].
In postmenopausal women, estrogen deficiency plays a critical role in bone resorption, exacerbating the risk of osteoporosis, particularly among individuals with diabetes, who may experience further dysregulation of bone remodeling markers such as parathyroid hormone (PTH) and alkaline phosphatase (ALP) [10]. Despite these known mechanisms, the precise relationship between T2DM, hormonal alterations, and BMD loss remains insufficiently understood, particularly in Middle Eastern populations, where genetic and environmental factors may contribute uniquely to disease progression [11,12].
This study aims to evaluate the association between T2DM and osteoporosis among postmenopausal Saudi women in the Qassim region, with a particular focus on BMD variations at the femoral neck (FN) and lumbar spine (LS). Additionally, we explore the role of key metabolic and hormonal markers, including PTH, ALP, and estrogen, to elucidate their contributions to bone health in postmenopausal women with and without diabetes. Understanding these associations will help develop more targeted prevention and intervention strategies for osteoporosis in high-risk populations.

2. Methodology

2.1. Study Design and Population

This cross-sectional study assessed the association between T2DM and OP in postmenopausal Saudi women residing in the Qassim region, Kingdom of Saudi Arabia. The study population consisted of 250 postmenopausal women, including 150 women diagnosed with T2DM (diabetes group; group I) with a mean age ± S.D of 58.47 ± 6.07 and 100 controls without diabetes with a mean age ± S.D of 57.13 ± 6.77, named group II. Female patients with diabetes were recruited from King Fahd Specialist Hospital (KFSH), Diabetic and Endocrinology Centre, and Buraidah Central Hospital in Buraidah City, Qassim region, Kingdom of Saudi Arabia (KSA). Before enrollment, participants provided informed consent after being thoroughly briefed on this study’s primary objectives and the procedures for sample collection. Participants were selected through a randomization process, ensuring that the inclusion criteria were met.
To control for potential confounding variables, the participants were matched based on age, duration of menopause, and BMI.
-
Inclusion Criteria: This study included postmenopausal Saudi women aged ≥ 45 years with at least 12 months of amenorrhea, indicating the onset of menopause. Women diagnosed with type 2 diabetes mellitus (T2DM) were selected based on the American Diabetes Association (ADA) criteria: HbA1c ≥ 6.5% or fasting plasma glucose ≥ 126 mg/dL. Additionally, women without diabetes with normal fasting glucose levels (i.e., <100 mg/dL) were included. All participants had to provide informed consent and express willingness to partake in this study.
-
Exclusion Criteria: Women with type 1 diabetes mellitus, gestational diabetes, a history of malignancies, thyroid disorders, chronic kidney disease, or primary/secondary hyperparathyroidism were excluded. Also excluded were women on medications that could influence bone metabolism, such as corticosteroids, bisphosphonates, hormone replacement therapy, or thiazolidinediones, as well as those with metabolic bone diseases or autoimmune disorders affecting bone health. By rigorously selecting participants, this study aimed to minimize confounding factors and ensure that the results accurately reflect the effects of T2DM and menopause on bone health in postmenopausal women.

2.2. Informed Consent

This study adhered to the ethical principles outlined in the Declaration of Helsinki and obtained informed consent from all participants before their involvement. Each participant was provided with comprehensive information regarding this study’s objectives, significance, and procedures before completing the questionnaire and participating in the research. Informed consent was obtained through an online consent forms, ensuring that participants understood the full scope of this study. All personal information collected was kept strictly confidential and used solely for this study. Additionally, participants were fully informed of their right to withdraw from this study at any time without any consequences.

2.3. Ethical Considerations

The study protocol adhered to the principles outlined in the Declaration of Helsinki and was approved by the Institutional Review Board (IRB) of Qassim University and the Regional Research Ethics Committee (NO -1442-2136242). Written informed consent was obtained from all participants before data collection.

2.4. Data Collection and Measurements

-
Anthropometric and Clinical Assessments
All participants underwent standardized anthropometric and clinical assessments conducted by trained healthcare professionals. Data on age, menopausal duration, and medical history were collected through structured interviews. BMI was calculated as weight (kg) divided by height squared (m2), while waist and hip circumferences were measured using a flexible measuring tape. Blood pressure (BP) was measured using an automated sphygmomanometer in a seated position after five min of rest.
-
Bone Mineral Density (BMD) Assessment
BMD was evaluated using dual-energy X-ray absorptiometry (DXA) at two anatomical sites: the lumbar spine (LS) and femoral neck (FN). DXA scans were performed using a GE Lunar Prodigy DXA system following standard manufacturer protocols. The DXA was performed on a Densitometer Prodigy Series X-Ray Tube Housing Assembly, Mark 8743 BX-1L, produced by General Electric Company (GE) in 2010, Madison, WI, USA. BMD results were expressed as T-scores and classified according to World Health Organization (WHO) criteria as normal (T-score ≥ −1.0), osteopenia (−2.5 < T-score < −1.0), or osteoporosis (T-score ≤ −2.5) [12].
-
Diagnosis of Type 2 Diabetes Mellitus (T2DM)
T2DM was diagnosed based on the American Diabetes Association (ADA) 2007 criteria: fasting plasma glucose (FPG) ≥ 126 mg/dL, 2 h plasma glucose (PG) ≥ 200 mg/dL, or HbA1c ≥ 6.5%.
-
Blood Sample Collection and Storage
Blood samples were collected after an overnight fast of 8 h. A total of 10 mL of blood was drawn to measure bone biochemical markers and conduct laboratory tests. The samples were aliquoted and stored at –20 °C until analysis. Blood was divided as follows:
  • A total of 2 mL in ethylenediaminetetraacetic acid (EDTA) tubes;
  • A total of 6 mL in serum separator tubes (SST);
  • A total of 2 mL in sodium fluoride tubes for fasting blood glucose measurements.
The SST samples were centrifuged at 3500 rpm for 10 min to analyze the following biochemical markers:
  • Calcitonin Hormone: Measured using a Human Calcitonin (CT) kit, with a normal range of 4.5–40 pg/mL, via the DSX Automated ELISA Processing System.
  • Parathyroid Hormone (PTH): Measured using a diagnostic spectrophotometer kit, with a normal range of 15–68.3 pg/mL, on the Abbott Architect C 8000 analyzer.
  • Vitamin D: Measured using a diagnostic spectrophotometer kit, with a normal range of 20–30 ng/mL.
  • Calcium Levels: Measured using a diagnostic spectrophotometer kit (lot number 44322UN21, Germany), with a normal range of 2.12–2.52 mmol/L.
  • Albumin (ALB): Measured using a diagnostic spectrophotometer kit, with a normal range of 34–50 g/L. ALB-corrected calcium was calculated using the formula
Corrected calcium = measured calcium + {(40 − ALB) × 0.02}.
  • Alkaline Phosphatase: Measured using a diagnostic spectrophotometer kit, with a normal range of 50–140 U/L.
  • Estrogen Hormone: Measured using a diagnostic spectrophotometer kit, with a normal range of 12.5–166 pg/mL.
Additionally, 2 mL of whole blood in EDTA tubes was used for glycated hemoglobin (HbA1c) testing, with a normal range of 4.6–6%. Sodium fluoride samples were used for fasting blood glucose measurements, with a normal range of 90–100 mg/dL (3.89–6.05 mmol/L).
All laboratory analyses were performed at the central laboratory of Qassim University, adhering to internal and external quality control measures to ensure analytical accuracy and precision.

3. Statistical Analysis

Statistical analyses were conducted using IBM SPSS Statistics (Version 26). Data normality was tested using the Kolmogorov–Smirnov test. Continuous variables were expressed as mean ± standard deviation (SD), while categorical variables were reported as frequencies and percentages. Independent t-tests were used to compare mean differences between the diabetes and non-diabetes groups, while chi-square tests assessed categorical variable associations. A one-way ANOVA was conducted to compare BMD variations across subgroups, and Pearson correlation coefficients evaluated associations between BMD and biochemical markers. Multivariate regression analysis was employed to identify independent predictors of osteoporosis in women with and without diabetes. A p-value < 0.05 was considered statistically significant. To ensure scientific rigor, this study adhered to internationally recognized methodologies for assessing osteoporosis and metabolic bone health. Unlike previous studies, our research uniquely focuses on site-specific BMD variations (FN vs. LS), metabolic markers (PTH, ALP, estrogen), and the role of BMI in postmenopausal women with diabetes in the Qassim region. The inclusion of stringent participant selection criteria and advanced statistical modeling enhances the validity of our findings, providing novel insights into the pathophysiology of osteoporosis in T2DM populations.

4. Results

A total of 250 postmenopausal women were included in this study, with 150 participants diagnosed with T2DM and 100 controls without diabetes. Baseline characteristics, including age, menopausal duration, and BMI, were comparable between the groups, ensuring robust comparative analysis (Table 1).

4.1. Comparison of Clinical and Laboratory Characteristics Between the Postmenopausal Group with Diabetes and the Control Group (Table 2)

No statistically significant differences were observed between the postmenopausal group with diabetes and the control group in terms of menopause duration, age, vitamin D levels, calcitonin levels, parathyroid hormone (PTH) levels, albumin, body mass index (BMI), and lumbar spine (LS) T-score (p > 0.05). However, the diabetes group exhibited significantly higher levels of glycated hemoglobin (HbA1c) (8.81 ± 1.64), fasting blood glucose (FBG) (9.05 ± 3.56), and femoral neck (FN) T-score (−0.48 ± 1.07) compared to controls (p = 0.001). Conversely, alkaline phosphatase (ALP) (92.78 ± 20.27), estrogen levels (19.66 ± 17.2), and total calcium levels (2.32 ± 0.12) were significantly higher in the control group than in the diabetes group (p < 0.001), as detailed in Table 2.
Table 2. Comparison of clinical and laboratory characteristics between the postmenopausal group with diabetes and the control group.
Parameter Mean ± SDDiabetes Patients N = 150
(Mean ± SD)
Control N = 100
(Mean ± SD)
p-Value
Duration of menopause (year)8.78 ± 6.667.18 ± 6.01 0.054
Age (year)58.47 ± 6.0757.13 ± 6.77 0.103
HbA1c (%)8.81 ± 1.645.33 ± 0.37 *** 0.000
Fasting blood glucose (mmol/L)9.05 ± 3.565.13 ± 0.47 *** 0.000
Vit- D (ng/mL)28.05 ± 22.4323.56 ± 11.22 0.065
ALP(U/L)85.45 ± 21.9392.78 ± 20.27 ** 0.008
Calcitonin(pg/mL)10.8 ± 108.90 ± 5.161 0.063
PTH (pg/mL)65.77 ± 26.2268.65 ± 14.77 0.320
Estrogen (pg/mL)12.47 ± 8.9719.66 ± 17.2 *** 0.000
ALB (g/L)40.81 ± 5.1841.2 ± 2.62 0.488
BMI (kg/m2)32.97 ± 5.1833.6 ± 24.57 0.762
Total Calcium (mmol/L)2.2 ± 0.182.32 ± 0.12 *** 0.000
T score Lumbar Spine (LS) (g/cm2)−1.46 ± 1.27−1.44 ± 1.04 0.918
T score Femoral Neck (FN) (g/cm2)−0.48 ± 1.07−0.91 ± 0.88 *** 0.001
Data are expressed as mean ± SD.; ** significance level at 0.01; *** significance level at 0.001; Alp: alkaline phosphatase; PTH: parathyroid hormone; Vit- D: vitamin D, ng/mL (using the T-Test).

4.2. Bone Mineral Density (BMD) Differences Between the Diabetes Group and the Control Group (Table 3)

The analysis of BMD (DXA scan) results showed no statistically significant differences in the prevalence of osteoporosis, osteopenia, and normal BMD between the diabetes group and the control group, as determined by a chi-square test (p > 0.05) (Table 3).
Table 3. Differences in BMD (DXA SCAN) between the postmenopausal group with diabetes and the control group (percentage of osteoporosis, osteopenia, and normal) (chi-square test X2 & p-value).
DXA SCANGroups p
Diabetes PatientsControlsChi-Square
DXA Scan Lumbar Spine
NORMAL37.3%40.0% NS
OSTEOPENIA40.7%42.0%0.608
OSTEOPOROSIS22.0%18.0%
DXA Scan Femoral Neck
NORMAL68.7%65.0% NS
OSTEOPENIA29.3%31.0%1.033
OSTEOPOROSIS2.0%4.0%
Data are expressed as percentages; NS indicates no significance as assessed by the chi-square test (X2).

4.3. Clinical and Laboratory Characteristics Based on DXA Scan of FN and LS (Table 4)

Among diabetes patients with osteoporosis (OP) at the femoral neck (FN), there was a significant increase in menopause duration (16.33 ± 20.65 years), age (67.67 ± 8.14 years), ALP (115.67 ± 20.26 U/L), PTH (103.1 ± 79.1 pg/mL), and total calcium (2.27 ± 0.32 mmol/L), along with a significant reduction in estrogen (8.53 ± 6.11 pg/mL), albumin (35.87 ± 1.86 g/L), BMI (30.28 ± 4.97 kg/m2), and LS T-score (−3.57 ± 0.49). In contrast, the control group with OP showed significantly higher PTH levels (76.14 ± 12.4 pg/mL) and significantly lower vitamin D (17.93 ± 10.28 ng/mL), estrogen (15.5 ± 10.75 pg/mL), and LS T-scores (−2.22 ± 0.99).
Regarding osteoporosis at the lumbar spine (LS) in diabetes patients, menopause duration (12.06 ± 8.27 years) and ALP levels (91.82 ± 22.86 U/L) were significantly elevated, whereas estrogen (8.83 ± 5.29 pg/mL), BMI (31.29 ± 5.78 kg/m2), and FN T-scores (−1.49 ± 0.71) were significantly reduced. No other significant differences were noted in this group. In the control group with OP, PTH levels were significantly increased (81.36 ± 7.71 pg/mL), while vitamin D (17.68 ± 7.35 ng/mL) and estrogen (19.7 ± 11 pg/mL) were significantly decreased.
Table 4. The clinical and laboratory characteristics of the postmenopausal group with diabetes and the control group based on DXA of the femoral neck and lumbar spine.
Mean ± SDDXA Scan Femoral Neck (Diabetes Patients)pDXA Scan Femoral Neck (Controls)p
NORMALOST.ENIAOST.SISNORMALOST.ENIAOST.SIS
Menopause Duration (Years)7.2 ± 5.2311.95 ± 6.9716.33 ± 20.65 *** <0.001 7.35 ± 6.676.77 ± 4.137.5 ± 8.5NS
Age (years)57.03 ± 5.4261.23 ± 6.0367.67 ± 8.14 *** <0.001 56.29 ± 6.9358.48 ± 5.160.25 ± 13.43NS
HbA1c (%)8.93 ± 1.668.62 ± 1.67.57 ± 0.63 NS 5.3 ± 0.395.39 ± 0.325.25 ± 0.53NS
FBG (mmol/L)9.1 ± 3.589.02 ± 3.648.01 ± 1.17 NS 5.18 ± 0.495.01 ± 0.435.13 ± 0.52NS
Vit- D(ng/mL)26.9 ± 16.5631.52 ± 32.6216.43 ± 8.6 NS 24.28 ±
11.61
22.76 ± 10.5417.93 ± 10.28** <0.01
ALP(U/L)83.77 ± 21.9187.34 ± 20.83115.67 ± 20.26 * <0.05 94.05 ± 21.4389.0 ± 17.94101.5 ± 16.22NS
Calcitonin
(pg/mL)
10.91 ± 10.4610.95 ± 9.184.77 ± 0.71 NS 8.680 ±
5.32
9.971 ±
5.09
10.325
±2.779
NS
PTH (pg/mL)65.93 ± 26.0262.84 ± 19.47103.1 ± 79.1 * <0.05 64.97 ±
14.39
70.3 ± 18.46976.14 ± 12.4** <0.01
Estrogen (pg/mL)14.05 ± 10.09.05 ± 4.628.53 ± 6.11 ** <0.01 20.22 ±
18.06
19.02 ± 16.2915.5 ± 10.75** <0.01
ALB (g/L)42.52 ± 3.6540.23 ± 5.5835.87 ± 1.86 * <0.05 41.31 ± 2.740.8 ± 2.2842.59 ± 3.84NS
BMI (kg/m2)33.74 ± 5.0831.34 ± 5.0730.28 ± 4.97 * <0.05 35.21 ±
30.27
30.96 ± 4.427.93 ± 3.29NS
Total Calcium (mmol/L)2.22 ± 0.182.14 ± 0.162.27 ± 0.32 * <0.05 2.31 ± 0.122.36 ± 0.122.32 ± 0.03NS
T score LS (g/cm2)−0.99 ± 1.15−2.42 ± 0.8−3.57 ± 0.49 *** <0.001 −1.05 ± 0.76−1.78 ± 1.94−2.22 ± 0.99*** <0.001
DXA Scan Lumbar Spine (diabetes patients)pDXA Scan Lumbar Spine (controls)p
Parameter
mean ± SD
NORMAL OST.ENIA OST.SIS NORMAL OST.ENIA OST.SIS
Menopause duration (year) 6.82 ± 5.69 8.8 ± 5.86 12.06 ± 8.27 ***
<0.001
6.58 ± 6.53 7.95 ± 6.2 6.72 ± 4.2 NS
Age (years) 57.32 ± 5.23 58.67 ± 6.79 60.06 ± 5.76 NS 55.88 ± 6.95 57.69 ± 6.83 58.61 ± 6.04 NS
HbA1c (%) 9.05 ± 1.72 8.73 ± 1.7 8.56 ± 1.35 NS 5.28 ± 0.37 5.42 ± 0.39 5.22 ± 0.28 NS
FBG (mmol/L) 9.15 ± 3.43 8.63 ± 3.63 9.67 ± 3.63 NS 5.16 ± 0.51 5.2 ± 0.48 4.89 ± 0.29 NS
Vit-D (ng/mL) 24.92 ± 15.13 30.39 ± 26.35 29.02 ± 24.87 NS 24.55 ± 13.04 21.13 ± 9.06 17.68 ± 7.35 * <0.05
ALP(U/L) 80.07 ± 21.41 86.95 ± 21.06 91.82 ± 22.86 * <0.05 97.2 ± 18.89 89.12 ± 22.79 91.5 ± 15.52 NS
Calcitonin (pg/mL) 10.94 ± 9.79 9.7 ± 8.95 12.59 ± 12.05 NS 7.732 ± 4.137 9.819 ± 5.663 9.856 ± 5.362 NS
PTH (pg/mL) 65.19 ± 24.72 63.76 ± 21.28 70.45 ± 35.66 NS 57.92 ± 10.66 73.41 ± 13.69 81.36 ± 7.71 *** <0.001
Estrogen (pg/mL) 15.24 ± 10.94 11.82 ± 7.72 8.83 ± 5.29 ** <0.01 25.71 ± 23.83 19.7 ± 11 13.87 ± 7.35 ** <0.01
ALB (g/L) 40.5 ± 5.53 41.36 ± 4.61 40.33 ± 5.61 NS 41.46 ± 3.05 41.2 ± 2.37 40.63 ± 2.17 NS
BMI(kg/m2) 34.54 ± 4.24 32.44 ± 5.3 31.29 ± 5.78 ** <0.01 30.96 ± 4.67 37.37 ± 37.49 30.64 ± 3.9 NS
Total Calcium (mmol/L) 2.22 ± 0.2 2.19 ± 0.17 2.17 ± 0.16 NS 2.31 ± 0.09 2.32 ± 0.14 2.36 ± 0.09 NS
T score FN
(g/cm2 )
0.3 ± 0.94−0.65 ± 0.76−1.49 ± 0.71*** <0.0016.58 ± 6.537.95 ± 6.26.72 ± 4.2NS
Data are expressed as mean ± SD. NS indicates not significant; * significance level at 0.05; ** significance level at 0.01; *** significance level at 0.001. Alp: alkaline phosphatase (using one-way ANOVA test).

4.4. Factors Associated with BMD in DXA Scan of FN and LS (Table 5)

Multivariate analysis identified significant predictors of OP in both groups. In postmenopausal diabetes patients, menopause duration (B = 0.117, p = 0.003) and estrogen levels (B = −0.113, p = 0.006) were significantly associated with OP, while no significant associations were found for osteopenia. In contrast, in the control group, FBG (B = −2.856, p = 0.012) and vitamin D (B = −0.140, p = 0.009) were negatively correlated with OP, whereas calcitonin (B = 1.341, p = 0.002) and PTH (B = 0.185, p < 0.001) showed positive associations. Additionally, osteopenia in the control group was significantly influenced by estrogen (B = −0.139, p = 0.003, negative correlation), calcitonin (B = 1.021, p = 0.006, positive correlation), and PTH (B = 0.108, p < 0.001, positive correlation) (Table 5).
Table 5. Multivariate logistic regression analysis to determine the influence of the independent variables associated with DXA scan of the lumbar spine and FN.
DXA Scan Lumbar Spine. aBSig.Exp(B)95% CI Exp(B)
Lower BoundUpper Bound
Diabetes patientsOSTEOPENIAIntercept0.1520.722
Duration of menopause0.0600.0811.0620.9931.135
Estrogen−0.0390.0640.9610.9221.002
OSTEOPOROSISIntercept−0.3350.564
Duration of menopause0.1170.0031.1241.0421.212
Estrogen−0.1130.0060.8930.8250.968
ControlsOSTEOPENIAIntercept−4.1270.286
FBG−0.3880.5550.6790.1872.461
Vit-D−0.0420.1440.9590.9071.014
Calcitonin1.0210.0062.7751.3475.717
PTH0.1080.0001.1141.0571.174
Estrogen−0.1390.0030.8700.7940.953
OSTEOPOROSISIntercept1.3340.835
FBG−2.8560.0120.0580.0060.529
Vit-D−0.1400.0090.8700.7830.966
Calcitonin1.3410.0023.8231.6209.020
PTH0.1850.0001.2041.1011.316
Estrogen−0.0730.1610.9290.8391.029
DXA Scan Femoral Neck. aBSig.Exp(B)95% CI Exp(B)
Lower
Bound
Upper Bound
Diabetes patientsOSTEOPENIADuration of menopause0.1170.0001.1251.0581.196
Age0.1260.0001.1341.0621.212
Estrogen−0.0980.0030.9070.8500.967
ALB0.1090.0161.1151.0211.218
BMI−0.1000.0110.9050.8370.978
Total calcium−2.8600.0160.0570.0060.583
OSTEOPOROSISDuration of menopause0.1740.0091.1911.0441.358
Age0.2960.0071.3451.0861.665
ALP0.0650.0341.0671.0051.134
PTH0.0290.0391.0291.0011.057
ControlsOSTEOPENIAPTH0.0610.0011.0631.0251.103
OSTEOPOROSISCalcitonin0.9230.0212.5171.1515.505
DXA Scan (NORMAL, OSTEOPENIA, and OSTEOPOROSIS); the reference category is NORMAL (as studied using multivariate logistic regression analysis).
Regarding FN BMD, six variables were significantly associated with OP in the diabetes group: menopause duration (B = 0.117, p < 0.001), age (B = 0.126, p < 0.001), and albumin levels (B = 0.109, p = 0.016) were positively correlated, whereas estrogen levels (B = −0.098, p = 0.003), BMI (B = −0.100, p = 0.011), and total calcium levels (B = −2.86, p = 0.016) showed negative associations. Additionally, OP in the diabetes group was significantly influenced by menopause duration (B = 0.174, p = 0.009), age (B = 0.296, p = 0.007), albumin (B = 0.065, p = 0.034), and PTH (B = 0.029, p = 0.039). In the control group, OP was positively associated with calcitonin (B = 0.923, p = 0.021), while osteopenia correlated positively with PTH (B = 0.061, p = 0.001) (Table 5).

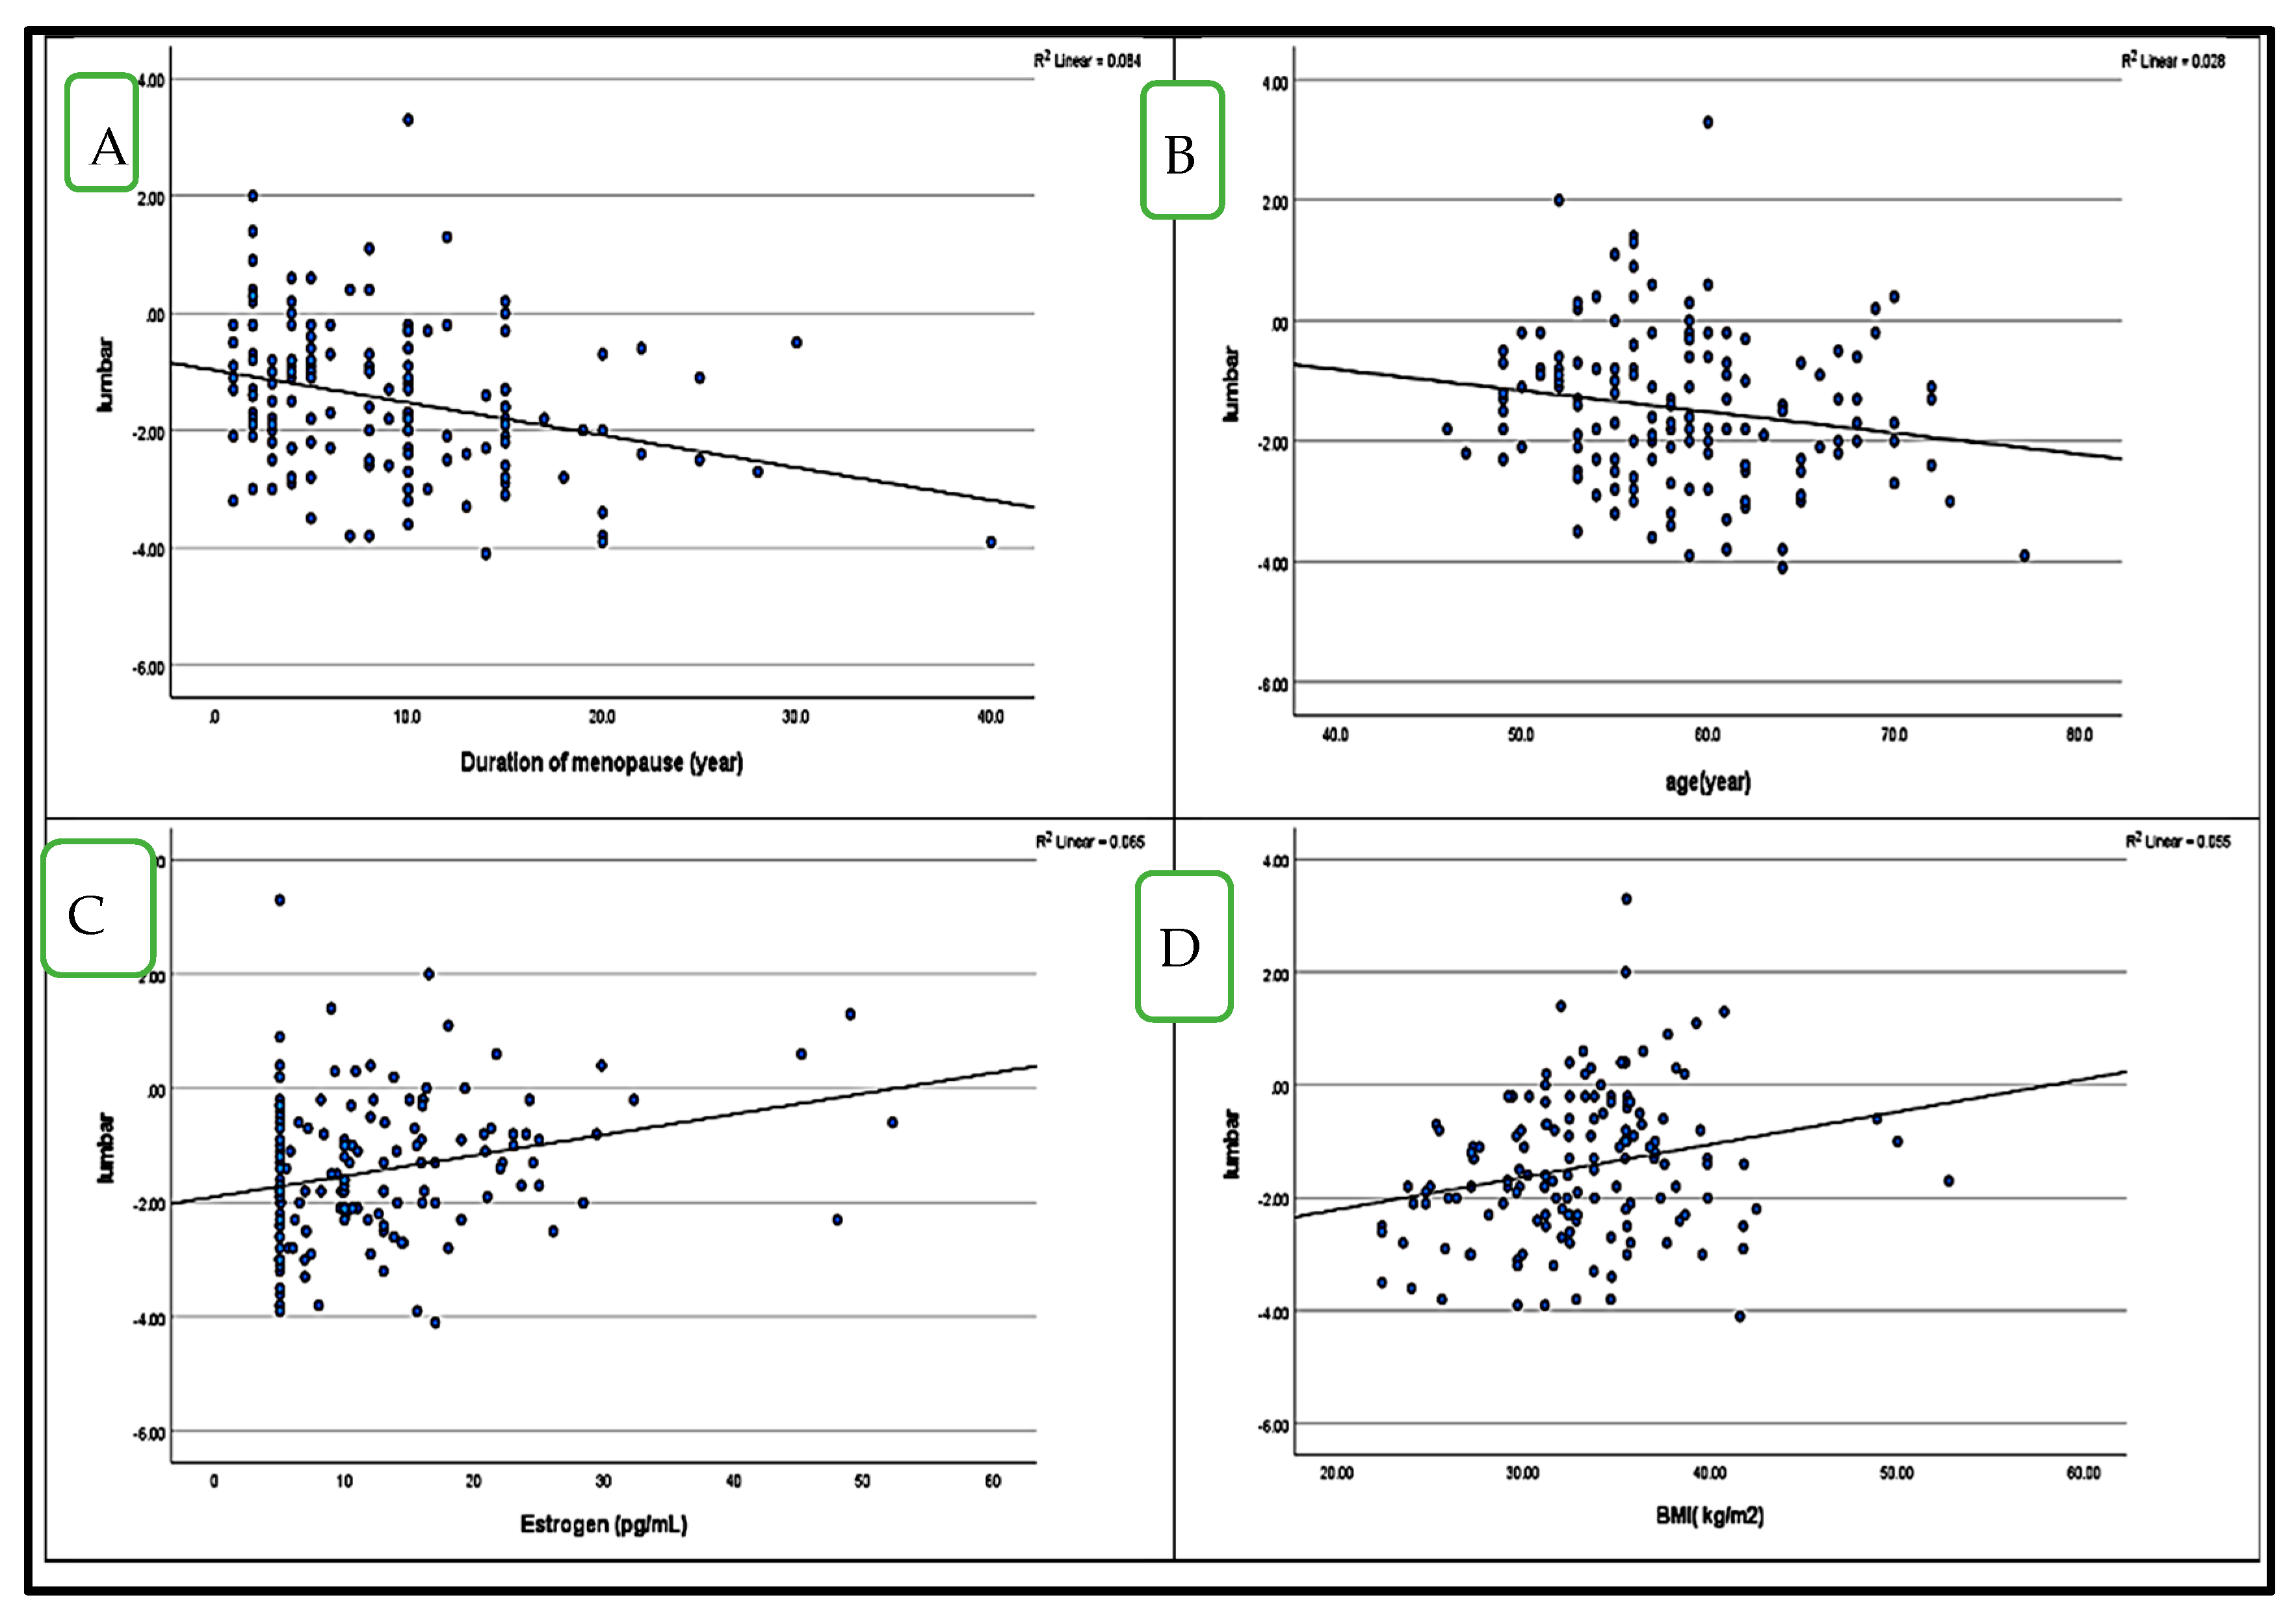
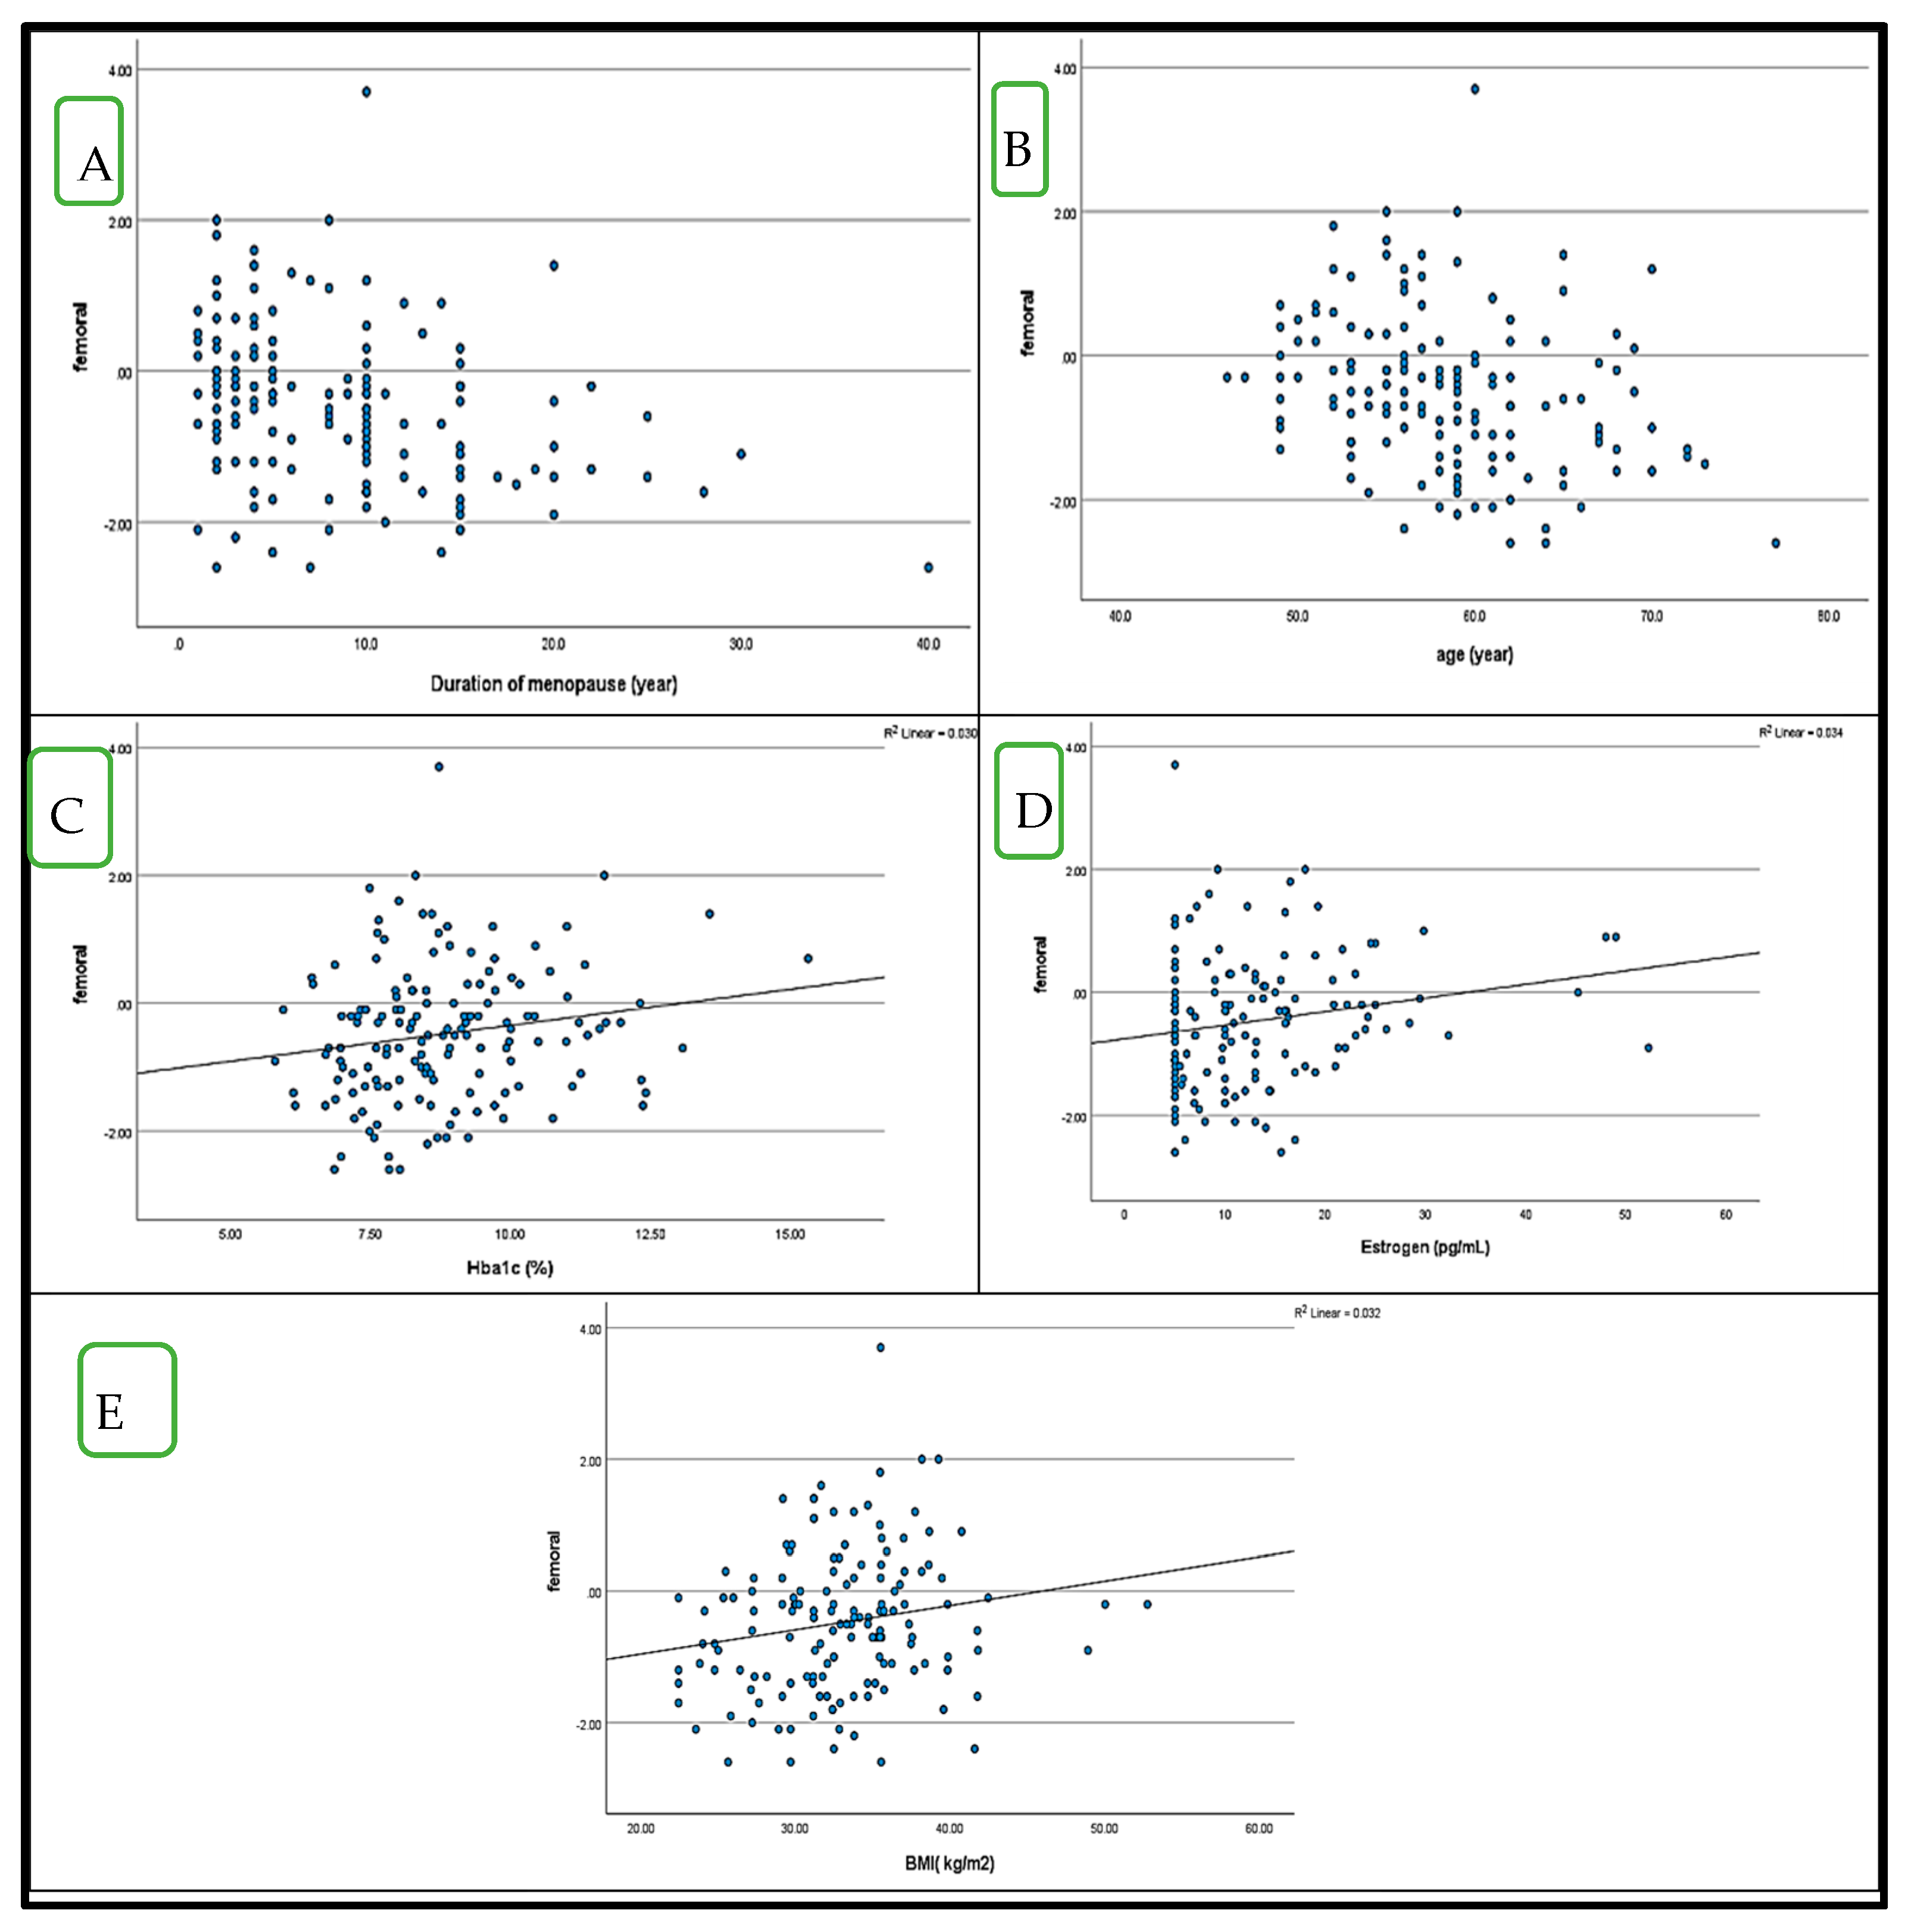
4.5. Correlation Between BMD (LS and FN T-Score) and HbA1c in Postmenopausal Women with and Without Diabetes (Figure 1 and Figure 2)

Pearson’s correlation analysis demonstrated a strong direct correlation between LS T-scores and FN T-scores in the diabetes group (r = 0.726, p = 0.01) and a moderate direct correlation in the control group (r = 0.505, p = 0.01). In the diabetes group, LS T-scores were significantly negatively correlated with menopause duration (r = −0.291, p = 0.01) and age (r = −0.168, p = 0.05), while positive correlations were observed with estrogen levels (r = 0.256, p = 0.01) and BMI (r = 0.236, p = 0.01) (Figure 1).
Figure 1. Significant correlations between LS T score, a dependent variable, and other variables in postmenopausal diabetes patients: (A); menopause duration (r = − 0.291), (B); age (r = − 0.168), (C); estrogen (r = 0.256), (D); BMI (r = 0.236).
Medicina 61 00789 g001
Similarly, FN T-scores showed significant negative correlations with menopause duration (r = −0.322, p = 0.01) and age (r = −0.288, p = 0.01), while positive correlations were noted with estrogen levels (r = 0.185, p = 0.05), HbA1c % (r = 0.173, p = 0.05), and BMI (r = 0.179, p = 0.05). Additionally, HbA1c % had a strong positive correlation with FBG levels (r = 0.668, p = 0.01) and a weak positive correlation with ALP levels (r = 0.247, p = 0.01) (Figure 2). In the control group, LS T-scores were moderately negatively correlated with PTH (r = −0.485, p = 0.01), while FN T-scores had weak inverse correlations with PTH and age (r = −0.219, r = −0.216, p = 0.05, respectively). Furthermore, HbA1c showed a moderate positive correlation with FBG (r = 0.367, p = 0.01).
Figure 2. Correlations between FN T score, a dependent variable, and other variables in postmenopausal diabetes patients.; (A), duration of menopause (r =0.322), (B); age (r = −0.288), (C); HbA1c % (r = 0.173), (D); estrogen (r = 0.185). (E); BMI (r = 0.179).
Medicina 61 00789 g002
These findings suggest that T2DM is associated with site-specific variations in BMD, rather than a universal reduction in bone density. The observed protective effect of BMI on FN BMD aligns with previous reports indicating that mechanical loading contributes to improved bone strength. However, the increased PTH and ALP levels in osteoporotic patients highlight a potential compensatory mechanism in bone turnover, warranting further investigation (Figure 2).
Overall, this study underscores the complexity of the relationship between T2DM and osteoporosis, emphasizing the need for a multidimensional approach when assessing bone health in postmenopausal women with diabetes. Future longitudinal studies are necessary to explore the causative pathways underlying these associations and to develop targeted intervention strategies.

5. Discussion

The relationship between T2DM and osteoporosis remains a topic of ongoing debate, with conflicting findings regarding the impact of diabetes on BMD and fracture risk. While T2DM has been associated with alterations in BMD and increased fracture risk, the exact mechanisms underlying these effects remain unclear. Earlier research has documented varying prevalence rates of OP among postmenopausal Saudi women with T2DM, ranging from 29.4% to 34% [13]. While some studies suggest that T2DM patients exhibit increased or preserved BMD despite an elevated fracture risk [1,4], others indicate a significant reduction in BMD, particularly among postmenopausal women [14,15]. This study aimed to address this discrepancy by evaluating BMD variations in postmenopausal Saudi women with and without T2DM, shedding light on potential mechanisms contributing to bone fragility in this population. A total of 250 postmenopausal women were recruited from the Qassim region, Saudi Arabia, including 150 individuals with T2DM and 100 controls without diabetes. BMD was assessed at the LS and FN using DXA. Based on BMD results, participants were categorized into normal, osteopenia, and OP groups. Statistical analysis revealed no significant differences in LS and FN BMD between the groups with and without diabetes. However, the FN T-score was significantly higher in T2DM patients compared to controls, suggesting a potential protective effect of diabetes on BMD at this site. Our results align with previous studies that have reported increased or preserved BMD in T2DM patients despite their elevated risk of fragility fractures [1,2,13].
In contrast, studies by Al-Maatouq et al. [14], Zeid et al. [15], and Roomi et al. [16] have documented reduced BMD in postmenopausal women with T2DM, underscoring the ongoing controversy regarding the impact of diabetes on bone health. These conflicting results highlight the need for further research to elucidate the mechanisms linking T2DM, bone quality, and fracture susceptibility in postmenopausal women. The present study contributes to this discourse by demonstrating that while T2DM is associated with a significantly higher FN T-score than controls without diabetes, LS BMD remains largely unaffected. These findings reinforce the notion that the effects of diabetes on bone health may be site-specific, rather than generalized, which has important implications for the assessment and management of osteoporosis in postmenopausal women with diabetes [4,5].
Bone metabolism is closely linked to glucose metabolism and HbA1c [17]. Insulin plays a vital role in maintaining bone density and preventing bone loss [18]. Reduced insulin secretion, commonly observed in T2DM, may contribute to OP development [18]. However, conflicting data exist regarding the association between insulin resistance and increased OP risk [17,18,19]. The disruption of bone metabolism due to altered cytokine secretion in T2DM may contribute to bone mass loss [19]. Wang et al. [20] suggested that bone resorption is lower in T2DM patients than in individuals without diabetes, yet the direct effect of insulin on bone cells remains unclear. While increased circulating insulin has been associated with greater FN bone mass, the exact mechanisms underlying this relationship require further investigation [21].
The current study findings suggest that T2DM does not directly cause OP. The influence of glycemic control on bone turnover in T2DM remains uncertain; however, some studies have reported a significant reduction in BMD in patients with poorly controlled diabetes [22]. Given the ongoing debate regarding the reliability of BMD in assessing fracture risk in T2DM, it is imperative to explore additional markers of bone health. Previous research has highlighted a greater reduction in FN BMD than in LS BMD in T2DM patients [23]. In contrast, Majima et al. [23] found no significant differences in FN and LS BMD between individuals with and without diabetes. Furthermore, this research uniquely highlights the lack of association between FBG, HbA1c, and BMD, challenging conventional assumptions about the direct role of hyperglycemia in bone deterioration. While some studies have linked poor glycemic control with lower BMD and increased fracture risk [2,9], our findings suggest that additional mechanisms—such as chronic inflammation, oxidative stress, and advanced glycation end-products (AGEs)—may play a more substantial role in osteoporosis in individuals with diabetes [8,11]. This underscores the need for a paradigm shift in how osteoporosis risk is assessed in diabetes patient populations, advocating for the inclusion of bone turnover markers and advanced imaging techniques to better predict fracture susceptibility.
This paradoxical finding has been attributed to several factors, including the potential anabolic effects of hyperinsulinemia on bone mass and the mechanical loading associated with higher BMI, which is frequently observed in populations with diabetes [3]. Additionally, this study reinforces the protective role of BMI in FN BMD, supporting previous research indicating that mechanical loading from higher body weight may contribute to bone strength. However, it also raises concerns about whether this protective effect is sufficient to offset the detrimental metabolic changes associated with diabetes-related bone loss [9]. However, despite higher BMD, diabetes patients still face an elevated fracture risk due to compromised bone microarchitecture and an increased susceptibility to falls, underscoring the importance of assessing bone quality beyond BMD alone [4].
A strong inverse relationship between age and BMD has been widely reported [12]. Our results indicate that age is a significant predictor of OP and osteopenia. The age-related decline in BMD is likely due to decreased calcium absorption and hormonal alterations associated with aging [24]. The role of estrogen deficiency in postmenopausal osteoporosis is well established, and our findings further emphasize its critical role in maintaining bone homeostasis, particularly in individuals with diabetes [10].
Estrogen plays a crucial role in maintaining trabecular bone mass via estrogen receptor signaling. Following menopause, estrogen depletion disrupts vitamin D receptor (VDR) function, increasing the body’s requirement for vitamin D and calcium [25]. Vitamin D levels demonstrated an inverse correlation with age and HbA1c in postmenopausal women [26,27]. Aging impairs intestinal vitamin D absorption and reduces cutaneous vitamin D synthesis [28]. Furthermore, declining estrogen levels in postmenopausal women impair the activity of 1-alpha hydroxylase, the enzyme responsible for vitamin D activation [26,27,28].
Analysis of independent variables associated with DXA scan FN and LS revealed that menopause duration was positively correlated with OP, making it a significant predictor of progression from osteopenia to OP. These findings corroborate those of Sharifi et al. [29] and Hyassat et al. [30].
By incorporating biochemical markers such as PTH, ALP, and estrogen levels into our analysis, our study also provides a more comprehensive metabolic profile of bone health in postmenopausal women with diabetes. The significant inverse correlation between PTH and femoral neck BMD highlights a potential compensatory mechanism in bone metabolism in diabetes, an area that remains underexplored in the current literature [10]. In contrast, LS BMD did not show a significant association with these metabolic markers, reinforcing the hypothesis that diabetes-related alterations in bone metabolism may affect different skeletal sites in distinct ways [8]. Majima et al. [23] suggested that cortical bone loss in T2DM patients may be attributed to secondary hyperparathyroidism resulting from calcium imbalance. While previous studies have documented that T2DM is associated with either preserved or increased BMD, particularly at weight-bearing sites such as the FN, our study challenges this notion by demonstrating that despite a higher FN T-score in diabetes patients, significant metabolic imbalances—including elevated PTH and ALP levels—may counteract any perceived protective effect of diabetes on bone health [5]. This aligns with global research indicating that T2DM patients remain at an increased risk of fragility fractures due to impaired bone quality, even when BMD appears to be normal or increased [4]. This study adds to the growing body of evidence suggesting that traditional BMD assessments may not be sufficient in evaluating fracture risk in individuals with diabetes 1. Our results support this hypothesis, as individuals with diabetes with FN OP and individuals without diabetes with LS OP exhibited significant PTH levels, consistent with findings from previous studies [27,29,30].
Multivariate regression analysis identified menopause duration, PTH, ALP, and estrogen levels as independent predictors of osteoporosis in women with diabetes, while BMI emerged as a protective factor. These findings highlight the multifaceted nature of osteoporosis in T2DM, suggesting that bone health in postmenopausal women with diabetes is influenced by a combination of hormonal, metabolic, and biomechanical factors. Notably, the absence of a significant predictive role for HbA1c further underscores the complexity of the diabetes–osteoporosis relationship, reinforcing the need for a more comprehensive approach to bone health assessment in diabetes patients [6].
The observed site-specific differences in BMD warrant further exploration to elucidate the underlying pathophysiological mechanisms driving these variations. One possible explanation is that the trabecular-rich structure of the lumbar spine may be more susceptible to diabetes-related changes in bone quality, whereas the predominantly cortical composition of the femoral neck may be less affected [5]. This study provides a novel contribution to the ongoing discourse on the relationship between T2DM and OP by offering a site-specific analysis of BMD variations among postmenopausal women in a Middle Eastern population. Unlike prior studies that have primarily focused on Caucasian or Asian cohorts, our research uniquely examines the interplay between metabolic factors and BMD in Saudi Arabian postmenopausal women, a demographic often under-represented in global OP research [11]. Given the high prevalence of both T2DM and OP in the region, our findings contribute to a deeper understanding of how ethnicity, lifestyle, and genetic predisposition influence bone health in individuals with diabetes.
This study contributes novel insights by demonstrating that the apparent protective effect of T2DM on femoral neck BMD is potentially outweighed by underlying metabolic imbalances, reinforcing the need for a more nuanced approach to osteoporosis assessment in individuals with diabetes. This study underscores the importance of integrating metabolic markers and alternative bone quality assessments to predict fracture risk efficiently, ultimately challenging current clinical guidelines, which rely primarily on BMD measurements. By comparing our findings with global studies and emphasizing regional specificities, this study enhances the understanding of bone health in diabetes patients and calls for a more tailored approach to OP prevention in high-risk populations. Moreover, our study fills a critical gap in Middle Eastern osteoporosis research by providing region-specific data that can be used to guide targeted intervention strategies. Given the distinct dietary habits, vitamin D status, and lifestyle factors in Saudi Arabia, current findings highlight the necessity of localized public health policies aimed at OP screening and management among postmenopausal women with diabetes [6]. Future studies should further explore the role of genetic predisposition and dietary influences on bone health in T2DM patients from diverse ethnic backgrounds.

Limitations and Recommendation

Despite the strengths of this study, its cross-sectional design limits the ability to establish a causal relationship between T2DM and OP. Longitudinal studies are needed to investigate the long-term impact of diabetes on bone health and fracture risk. Although BMD was assessed using dual-energy X-ray absorptiometry, this method does not directly evaluate bone quality, a crucial factor influencing fracture risk in patients with diabetes. Future studies should incorporate advanced imaging techniques such as high-resolution peripheral quantitative computed tomography (HR-pQCT) and Trabecular Bone Score (TBS) to provide a more comprehensive assessment of bone microarchitecture. Additionally, this study did not assess bone remodeling biomarkers such as C-terminal telopeptide of type I collagen (CTX) and procollagen type 1 N-terminal propeptide (P1NP), which are important indicators of bone turnover and should be considered in future research.

6. Conclusions

This study highlights the complex interplay between T2DM and osteoporosis, emphasizing the site-specific nature of BMD alterations and the role of hormonal and metabolic factors in bone health. Our findings suggest that while BMI may exert a protective effect on FN BMD, diabetes-related alterations in bone turnover and estrogen deficiency contribute to osteoporosis risk. The lack of a significant relationship between HbA1c and BMD challenges traditional assumptions about glycemic control and bone health, underscoring the need for further research into alternative mechanisms affecting skeletal integrity in patients with diabetes. Given the limitations of cross-sectional analyses, longitudinal studies are essential to better understand the long-term impact of diabetes on bone health and fracture risk. These insights have important clinical implications for the early identification and management of osteoporosis in postmenopausal women with diabetes, reinforcing the need for tailored screening and intervention strategies beyond conventional BMD assessment.

Author Contributions

N.M.A., A.M.H.M., W.M.A.W., M.A., K.S.A., H.O.A.A., A.M.H.M., and N.M.A.: study design, methodology, data collection; H.O.A.A., W.M.A.W., M.A., and K.S.A.: manuscript validation and revision; A.M.H.M.: formal analysis; N.M.A.: investigation; H.O.A.A. and W.M.A.W.: resources; A.M.H.M. and N.M.A.: data curation, writing—original draft preparation; A.M.H.M., K.S.A., M.A., and H.O.A.A.: writing—review and editing, visualization; A.M.H.M.: supervision; A.M.H.M.: project administration; W.M.A.W., M.A., K.S.A., and H.O.A.A.: funding acquisition. All authors have read and agreed to the published version of the manuscript.

Funding

This research received no external funding.

Institutional Review Board Statement

The study protocol adhered to the principles outlined in the Declaration of Helsinki and was approved by the Institutional Review Board (IRB) of Qassim University and the Regional Research Ethics Committee (NO-1442-2136242; approval date: 11 July 2021).

Informed Consent Statement

Informed consent was obtained from all subjects involved in the study.

Data Availability Statement

Due to participant consent agreements, the data collected and analyzed in this study are not publicly available. However, the corresponding author may access them upon reasonable request.

Acknowledgments

The Researchers would like to thank the Deanship of Graduate Studies and Scientific Research at Qassim University for financial support (QU-APC-2025-9/1). In addition, we acknowledge King Fahd Specialist Hospital (KFSH), Diabetic and Endocrinology Centre, Buraidah Central Hospital, and Mohammed S. Aljaberi (Consultant in Diabetes and Endocrinology Centre, Buraidah, KSA.) for their permits and for facilitating the collection of blood samples. In addition, we also thank Abdulmohsen Alruwetei for his efforts and support in completing my research. We appreciate all the staff in both the BMD DXA Scan Department and the Laboratory Department, especially Adnan Alyahya, Hamed ALhamed, and Abdul-Aziz AlQalfes, for their cooperation.

Conflicts of Interest

No conflicts of interest were claimed by the authors of the current study.

References

  1. Kanis, J.A.; Harvey, N.C.; McCloskey, E.; Bruyère, O.; Veronese, N.; Lorentzon, M.; Cooper, C.; Rizzoli, R.; Adib, G.; Al-Daghri, N.; et al. Advances in the diagnosis and management of osteoporosis. Lancet Diabetes Endocrinol. 2022, 10, 567–583. [Google Scholar]
  2. Ilany, J.; Liu, J.; Welsch, C.; Reznik-Wolf, H.; Levy-Lahad, E.; Auchus, R.J. Osteoporosis management in postmenopausal women: Recent advances. J. Clin. Endocrinol. Metab. 2021, 106, 1234–1250. [Google Scholar] [CrossRef]
  3. Siris, E.S.; Adler, R.; Bilezikian, J.; Bolognese, M.; Dawson-Hughes, B.; Favus, M.J.; Harris, S.T.; Jan de Beur, S.M.; Khosla, S.; Lane, N.E.; et al. The evolving role of bone mineral density in assessing fracture risk. Nat. Rev. Endocrinol. 2022, 18, 327–341. [Google Scholar]
  4. Schwartz, A.V.; Schafer, A.L.; Vittinghoff, E. Diabetes, bone, and fracture risk: Current perspectives. J. Bone Miner. Res. 2023, 38, 45–61. [Google Scholar]
  5. Napoli, N.; Chandran, M.; Pierroz, D.D. Type 2 diabetes and bone fractures: An unresolved puzzle. Endocr. Rev. 2021, 42, 269–289. [Google Scholar]
  6. Mahmoud, M.A.; Alshammari, S.A.; Alswat, K.A. Epidemiology and burden of osteoporosis in Saudi Arabia. Osteoporos. Int. 2023, 34, 789–801. [Google Scholar]
  7. Auler, A.; Maraschin, C.K.; Medeiros, B.M.; Passaglia, L.; Polanczyk, C.; Gossenheimer, A.N.; Cureau, F.V.; Schaan, B.D. The prevalence and risk factors of type 2 diabetes in the Middle East: A Saudi perspective. Diabetes Res. Clin. Pract. 2022, 186, 109247. [Google Scholar] [CrossRef]
  8. Farr, J.N.; Khosla, S.; Almeida, M. Advanced glycation end products and their impact on bone fragility. Bone Rep. 2023, 17, 101641. [Google Scholar]
  9. Janghorbani, M.; Feskanich, D.; Willett, W.C. Impact of hyperglycemia on bone microarchitecture and fracture risk. Curr. Osteoporos. Rep. 2022, 20, 112–126. [Google Scholar]
  10. Sánchez-Rodríguez, D.; García-Martínez, O.; Reyes-Torres, M.D. Estrogen and bone metabolism: A mechanistic review. Trends Endocrinol. Metab. 2023, 34, 212–229. [Google Scholar]
  11. Al-Daghri, N.M.; Mohammed, A.K.; Bukhari, I.; Rikli, M.; Abdi, S.; Ansari, M.G.A.; Sabico, S.; Hussain, S.D.; Alenad, A.; Al-Saleh, Y.; et al. Genetic and environmental influences on osteoporosis risk in Saudi women. Front. Endocrinol. 2022, 13, 889456. [Google Scholar]
  12. Karimifar, M.; Pasha, M.A.P.; Salari, A.; Zamani, A.; Salesi, M.; Motaghi, P. Evaluation of bone loss in diabetic postmenopausal women. J. Res. Med. Sci. 2012, 17, 1033–1038. [Google Scholar] [PubMed] [PubMed Central]
  13. Al-Homood, I.A.; Sheshah, I.; Mohammed, A.G.; Gasim, G.I. The prevalence and risk factors of osteoporosis among a Saudi female diabetic population. Open Access Maced. J. Med. Sci. 2017, 5, 177–181. [Google Scholar] [CrossRef]
  14. Al-Maatouq, M.A.; I El-Desouki, M.; A Othman, S.; Mattar, E.H.; A Babay, Z.; Addar, M. Prevalence of osteoporosis among postmenopausal females with diabetes mellitus. Saudi Med. J. 2004, 25, 1423–1427. [Google Scholar] [PubMed]
  15. Zeid, A.F.; Ahmed, A.S.; Shohdy, M.T.; Asssy, M.M. Evaluation of bone mineral density among type 2 diabetes mellitus patients in Zagazig University Hospitals. Egypt J. Hosp. Med. 2020, 80, 599–607. [Google Scholar] [CrossRef]
  16. Roomi, A.B.; Salih, A.-H.M.; Noori, S.D.; Nori, W.; Tariq, S. Evaluation of bone mineral density, serum osteocalcin, and osteopontin levels in postmenopausal women with type 2 diabetes mellitus, with/without osteoporosis. J. Osteoporos. 2022, 2022, 1437061. [Google Scholar] [CrossRef]
  17. Liu, D.; Bai, J.-J.; Yao, J.-J.; Wang, Y.-B.; Chen, T.; Xing, Q.; Bai, R. Association of insulin glargine treatment with bone mineral density in patients with type 2 diabetes mellitus. Diabetes Metab. Syndr. Obes. 2021, 14, 1909–1916. [Google Scholar] [CrossRef]
  18. Roomi, A.B.; AL-Salih, R.M.; Ali, S.A. Impact of metformin and insulin therapy on parathyroid hormone and 25(OH) vitamin D in diabetic postmenopausal Iraqi women. J. Phys. Conf. Ser. 2019, 1279, 012008. [Google Scholar] [CrossRef]
  19. Roomi, A.B.; Nori, W.; Al-Badry, S.H. The value of serum adiponectin in osteoporotic women: Does weight have an effect? J. Obes. 2021, 2021, 5325813. [Google Scholar] [CrossRef]
  20. Wang, X.; Jiang, L.; Shao, X. Association analysis of insulin resistance and osteoporosis risk in Chinese patients with T2DM. Ther. Clin. Risk Manag. 2021, 17, 909–916. [Google Scholar] [CrossRef]
  21. Paul, J.; Devarapalli, V.; Johnson, J.T.; Cherian, K.E.; Jebasingh, F.K.; Asha, H.S.; Kapoor, N.; Thomas, N.; Paul, T.V. Do proximal hip geometry, trabecular microarchitecture, and prevalent vertebral fractures differ in postmenopausal women with type 2 diabetes mellitus? Osteoporos. Int. 2021, 32, 1585–1593. [Google Scholar] [CrossRef] [PubMed]
  22. Leidig-Bruckner, G.; Grobholz, S.; Bruckner, T.; Scheidt-Nave, C.; Nawroth, P.; Schneider, J.G. Prevalence and determinants of osteoporosis in patients with type 1 and type 2 diabetes mellitus. BMC Endocr. Disord. 2014, 14, 33. [Google Scholar] [CrossRef] [PubMed]
  23. Majima, T.; Komatsu, Y.; Yamada, T.; Koike, Y.; Shigemoto, M.; Takagi, C.; Hatanaka, I.; Nakao, K. Decreased bone mineral density at the distal radius, but not at the lumbar spine or femoral neck, in Japanese type 2 diabetic patients. Osteoporos. Int. 2005, 16, 907–913. [Google Scholar] [CrossRef]
  24. Malheiros-Souza, D.; Gaia, L.F.P.; Sousa, F.F.d.A.; Favaro, P.I.F.; Rodrigues, V.; Rodrigues, D.B.R. Evaluation of hormonal influence in patients with fractures attributed to osteoporosis. Rev. Bras. Ortop. 2022, 56, 804–808. [Google Scholar] [CrossRef]
  25. El-Maksoud, N.M.A.; Abulsoud, A.; Abulsoud, M.; Elshaer, S. Association between vitamin D receptor gene polymorphism and osteoporotic fractures. Azhar Int. J. Pharm. Med. Sci. 2022, 2, 12–19. [Google Scholar] [CrossRef]
  26. Ran, C.; Xiaojuan, X.; Wenxue, G.; Zhaoliang, F.; Hui, S.; Shen, Q. Sexual dimorphism in the relation between sex hormones and osteoporosis in patients with type 2 diabetes mellitus. J. Bone Miner. Metab. 2022, 40, 460–467. [Google Scholar] [CrossRef]
  27. Kotwal, S.D.; Bhat, A.N.; Yograj, S.; Kotwal, S. Evaluation of vitamin D status in premenopausal and postmenopausal type 2 diabetic women and its relation to glycemic control. Int. J. Res. Med. Sci. 2020, 8, 1292. [Google Scholar] [CrossRef]
  28. López-Baena, M.T.; Pérez-Roncero, G.R.; Pérez-López, F.R.; Mezones-Holguín, E.; Chedraui, P. Vitamin D, menopause, and aging: Quo vadis? Climacteric 2020, 23, 123–129. [Google Scholar] [CrossRef]
  29. Sharifi, F.; Ahmadimoghadam, N.; Mousavinasab, N. The relationship between type 2 diabetes mellitus and bone density in postmenopausal women. Int. J. Endocrinol. Metab. 2006, 3, 117–122. [Google Scholar]
  30. Hyassat, D.; Alyan, T.; Jaddou, H.; Ajlouni, K.M. Prevalence and risk factors of osteoporosis among Jordanian postmenopausal women attending the National Center for Diabetes, Endocrinology and Genetics in Jordan. Biores Open Access 2017, 6, 85–93. [Google Scholar] [CrossRef]
Table 1. The general characteristics of the postmenopausal group with diabetes and the control group.
Diabetes Patients
N = 150
Control N = 100p-
Value
1Marital status:
Widower46 (30.67%)21 (21%)
Married100 (66.67%)76 (76%)NS
Divorced4 (2.67%)3 (3%)
2Educational level:
No education88 (58.67%)39 (39%)
Primary41 (27.33%)27 (27%)
Middle education12 (8%)13 (13%)NS
Secondary4 (2.67%)10 (10%)
University and above5 (3.33%)11 (11%)
4Do you have any medical history?
No132 (88%)93 (93%)NS
Yes18 (12%)7 (7%)
5Do you have any smoking history?
No150 (100%)99 (99%)NS
Yes0 (0%)1 (1%)
6Do you practice a physical activity?
No43 (28.67%)24 (24%)NS
Walking sport107 (71.33%)76 (76%)
7Do you consume calcium daily?
No28 (18.67%)14 (14%)NS
Yes122 (81.33%)86 (86%)
8Are you exposed to sunlight?
No52 (34.67%)36 (36%)NS
Yes98 (65.33%)64 (64%)
9Do you drink caffeine?
No4 (2.67%)7 (7%)NS
Yes146 (97.33%)93 (93%)
10Does family history include osteoporosis or fragility fracture?
No137 (91.33%)80 (80%)NS
Yes13 (8.67%)20 (20%)
11Do you have osteoporosis?
No126 (84%)94 (94%)NS
Yes24 (16%)6 (6%)
12Breastfeeding
No6 (4%)5 (5%)NS
Yes144 (96%)95 (95%)
13Diabetes status
Gestational diabetes37 (24.67%)0 (0%)
Diabetes113 (75.33%)0 (0%)NS
Nothing0 (0%)100 (100%)
14Duration of Diabetes status (years)15.06 ± 7.840
15Hypertension status
Hypertension70 (46.67%)18 (18%)
Hypotension0 (0%)1 (1%)NS
Nothing80 (53.33%)81 (81%)
16Use of statin or vitamin D3 supplementation:
Every week32 (21.33%)15 (15%)
Per month3 (2%)2 (2%)NS
Every day10 (6.67%)3 (3%)
Nothing105 (70%)80 (80%)
Data are presented as numbers (percentage) for categorical data and (mean ± standard deviation) for parametrically distributed data; NS indicates not significant (using the chi-square test X2).
Disclaimer/Publisher’s Note: The statements, opinions and data contained in all publications are solely those of the individual author(s) and contributor(s) and not of MDPI and/or the editor(s). MDPI and/or the editor(s) disclaim responsibility for any injury to people or property resulting from any ideas, methods, instructions or products referred to in the content.

