Article

Reduction in Brain Parenchymal Volume Correlates with Depression and Cognitive Decline in HIV-Positive Males

by
Radmila Perić
1,2,*,
Duško Kozić
1,3,
Snežana Brkić
1,4,
Dajana Lendak
1,4,
Jelena Ostojić
1,
Vojislava Bugarski Ignjatović
1,5 and
Jasmina Boban
1,3
1
Faculty of Medicine Novi Sad, University of Novi Sad, Hajduk Veljkova 3, 21000 Novi Sad, Serbia
2
Center for Radiology, University Clinical Center of Vojvodina, Hajduk Veljkova 1, 21000 Novi Sad, Serbia
3
Centre for Diagnostic Imaging, Oncology Institute of Vojvodina, Put dr Goldmana 4, 21204 Sremska Kamenica, Serbia
4
Clinic for Infectious Diseases, University Clinical Center of Vojvodina, Hajduk Veljkova 1, 21000 Novi Sad, Serbia
5
Clinic for Neurology, University Clinical Center of Vojvodina, Hajduk Veljkova 1, 21000 Novi Sad, Serbia
*
Author to whom correspondence should be addressed.
Medicina 2025, 61(4), 632; https://doi.org/10.3390/medicina61040632
Submission received: 4 December 2024 / Revised: 21 February 2025 / Accepted: 27 February 2025 / Published: 30 March 2025
(This article belongs to the Section Neurology)

Abstract

Background and Objectives: Human immunodeficiency virus (HIV) has a profound impact on the central nervous system (CNS), contributing to cognitive impairment and depressive symptoms even in individuals receiving combination antiretroviral therapy (cART). This study aimed to investigate the associations between brain parenchymal volumes and neuropsychological outcomes, specifically focusing on cognitive function and depressive symptoms in HIV-positive males. Materials and Methods: A total of 48 male participants underwent cognitive assessment using the Mini-Mental State Examination (MMSE), while depressive symptoms were evaluated in 35 participants using the Beck Depression Inventory (BDI). Volumetric brain analysis was conducted through automated imaging software, volBrain (Version 1.0, published on 23 November 2021), ensuring high consistency and accuracy. Statistical analyses included Pearson correlation to identify relationships between brain volumes and neuropsychological outcomes, emphasizing key regions like the basal forebrain and cingulate gyrus. Results: Significant trends were observed between basal forebrain volume and MMSE scores, emphasizing the role of this region in cognitive regulation. Additional correlations were found with the anterior and middle cingulate gyri, which are crucial for executive functioning and attentional control. Notably, smaller right basal forebrain volumes were associated with greater depressive symptom severity, suggesting the region’s specific involvement in mood regulation. These findings highlight the dual impact of HIV on cognitive and emotional health, with structural vulnerabilities in key brain regions playing a central role. Conclusions: This study underscores the selective vulnerability of certain brain regions, such as the basal forebrain and cingulate gyrus, to HIV-associated neurodegeneration. The results highlight the importance of integrating neuroimaging and neuropsychological assessments in routine clinical care for HIV-positive individuals. The study emphasizes the importance of early detection and targeted interventions to address neuropsychological challenges in this population, with a call for further research in larger and more diverse cohorts.

1. Introduction

Human immunodeficiency virus (HIV) is a retrovirus that specifically targets and destroys immune cells expressing the CD4+ receptor, primarily helper T lymphocytes, leading to progressive immunosuppression. This immunosuppressive state renders the body vulnerable to opportunistic infections and malignancies [1,2]. According to recent data from 2023, over 39 million individuals globally are living with HIV, with an estimated 1.3 million new infections occurring annually [3]. While the global prevalence of HIV has been declining over the past decade, effective combination antiretroviral therapies (cART) have played a crucial role in suppressing viral levels to undetectable ranges and reducing transmission risk [3,4]. Despite these advances, HIV presents complex interactions with the immune system, both systemically and within the central nervous system (CNS), resulting in unique neuropathological effects that distinguish CNS involvement from systemic manifestations [1,5].
The CNS becomes vulnerable to HIV early in the course of systemic infection, although CNS-related complications often remain asymptomatic or manifest through nonspecific symptoms [6,7]. In rare cases, acute encephalitis may emerge due to immune responses [8].
While cART effectively suppresses viral replication and reduces viremia in peripheral blood, it does not necessarily decrease immune activation in the brain [9]. Moreover, the widespread use of cART has broadened the spectrum of neuropsychological conditions observed in HIV-positive individuals. These conditions can be grouped primarily into two categories: HIV-associated neurocognitive disorder (HAND) [10] and major depressive disorder [11]. HAND is estimated to affect 30–60% of HIV-positive adults [12,13,14,15,16], with cognitive impairments spanning memory, attention, and executive functions. These deficits often have profound effects on daily functioning and quality of life, underscoring the significant impact of HAND on independence and well-being [13,14].
Depression is another pressing concern in HIV-positive populations, with prevalence rates reaching approximately 31% [17,18]. Compared to the general population, individuals living with HIV are disproportionately affected by depression [19]. Undiagnosed or untreated depression can exacerbate cognitive symptoms, hinder treatment adherence, strain social relationships, and diminish overall quality of life. Furthermore, it may accelerate disease progression and reduce life expectancy in HIV-positive individuals [20].
To evaluate these challenges, tools like the Mini-Mental State Examination (MMSE) and the Beck Depression Inventory (BDI) are commonly used to assess global cognitive function and depressive symptoms, respectively [21,22]. These measures are crucial for understanding the neuropsychological impacts of HIV.
Given the significant burden of cognitive impairment and depression among HIV-positive individuals, investigating the underlying neuroanatomical changes becomes imperative. Understanding how brain volume alterations correlate with neuropsychological outcomes can help guide strategies for cognitive preservation and mental health support [23,24]. This study specifically examines the relationship between brain parenchymal volumes and key neuropsychological factors, focusing on cognitive function and depressive symptoms in HIV-positive individuals.
In our study, only male participants were included to ensure consistency and limit variability in brain volume measurements, recognizing the known influence of gender on brain size and structure [25]. This decision was also based on the epidemiological situation in Serbia, where the male-to-female ratio among newly diagnosed HIV cases is approximately 15:1 [26]. Additionally, including only males eliminated potential hormonal influences on volumetric analyses, providing greater reliability in our findings [27].
This study aimed to investigate the association between brain parenchymal volumes and neuropsychological outcomes, specifically focusing on cognitive function and depressive symptoms in HIV-positive male individuals. We hypothesized that reductions in specific brain regions, such as the anterior cingulate gyrus, are significantly associated with more depressive symptoms and lower cognitive scores.

2. Materials and Methods

2.1. Participants

All participants in this study were HIV-positive male patients with a controlled viral load who provided written informed consent. All participants were on stable cART (the same regimen for more than 12 months). Inclusion criteria required a confirmed HIV status via PCR without a specific threshold for CD4+ T-cell count. Exclusion criteria included active opportunistic infections, any active neurological disease, documented substance abuse, hepatitis B or C co-infection, detectable lesions on conventional magnetic resonance imaging (MRI), and MRI contraindications.
A total of 48 patients underwent the MMSE as a screening tool for global neurocognitive impairment. The MMSE includes a series of questions and tasks assessing orientation to time and space, attention, calculation, memory, and language skills. Scores range from 0 to 30, where higher scores indicate better cognitive function. Generally, scores are interpreted as follows: 24–30 suggests normal cognitive function, 18–23 indicates mild cognitive impairment, and 0–17 reflects moderate to severe cognitive impairment.
In addition, a total of 35 patients completed the BDI to assess depressive symptoms. The BDI is a 21-item self-report questionnaire that evaluates various aspects of depression, including sadness, loss of interest in activities, changes in appetite and sleep, fatigue, guilt, and concentration difficulties. Responses are scored based on symptom severity, with higher scores indicating greater severity of depressive symptoms. The maximum score is 40, with scores below 10 considered normal (which means the individual does not suffer from depression but has depressive symptoms), scores between 11 and 16 indicating a state of mood disturbance, scores between 17 and 20 suggesting borderline clinical depression, and scores above 20 reflecting clinical depression.

2.2. Neuroimaging

All participants underwent conventional MRI on a 3 Tesla MRI scanner (Trio Tim, Siemens, Erlangen, Germany), using a head coil. The imaging protocol included T1-weighted sagittal spin-echo images (TR/TE 440 ms/3.8 ms, slice thickness 5 mm, acquisition time 2:00 min), T2-weighted transverse turbo spin-echo images (TR/TE 5150 ms/105 ms, slice thickness 5 mm, acquisition time 2:57 min), FLAIR transverse images (TR/TE 8000 ms/101 ms, slice thickness 5 mm, acquisition time 3:30 min), diffusion-weighted imaging (DWI) (TR/TE 4100 ms/91 ms, slice thickness 5 mm, acquisition time 2:07 min), and 3D T1-weighted MPR sagittal images (TR/TE 1530 ms/2.97 ms, slice thickness 1 mm, acquisition time 5:12 min).
The imaging data were processed using volBrain software [28], an online platform enabling fully automated volumetric analysis of brain parenchyma from 3D T1MPRAGE images. Version 1.0 of the software, released on 23 November 2021, was utilized in this study. Initial DICOM images were converted to NIFTI format using MRIcron software (version 2.1.57-0, released 30 August 2021) and then uploaded to the volBrain platform. The images were aligned with a standard anatomical template, followed by segmentation of regions of interest using a multi-atlas patch-based approach, referencing a library of manually labeled structures. VolBrain was selected for its efficiency and high accuracy, which make it particularly suited for large-scale studies. While manual segmentation remains the ‘gold standard’, it is time-intensive and prone to subjective errors, such as hand tremors and rater bias. In contrast, volBrain provides reliable and reproducible segmentation, making it an optimal choice for this study [28].

2.3. Statistical Analysis

Data analysis was performed using SPSS software (version 23.0). Categorical variables are presented as frequencies and percentages, and continuous variables as medians and interquartile ranges or means and standard deviations, depending on normality. The normality of the distribution was tested using the Kolmogorov–Smirnov test.
For this study, since the primary objective was to assess correlations between brain volumes and cognitive/depression scale scores among HIV-positive patients, Pearson correlation analysis was conducted. A p-value of <0.05 was considered statistically significant. For measures that involved multiple comparisons, Bonferroni correction was applied to adjust the significance threshold.To examine potential confounding factors, we performed Pearson correlation analyses to evaluate the relationships between MMSE scores and age, as well as education, and between BDI scores and age, as well as education, while Spearman’s rho analysis was conducted to assess the correlation between MMSE and BDI scores. To evaluate the impact of potential covariates on brain structures for which statistically significant correlations were previously identified, we conducted a Multiple Regression Analysis. The dependent variables were the volumes of these brain structures, while the independent variables included age and years of education.

3. Results

3.1. Study Population

In this study, a total of 48 HIV-positive male participants were analyzed to investigate the relationship between brain volume changes, cognitive function, and depressive symptoms. The participants had a mean age of 39.26 ± 10.66 years (age range: 25 to 61 years). Cognitive performance was assessed using the MMSE, with an average score of 28.10 ± 1.43 (score range 24–30). Education levels among participants, recorded as the total number of years of formal education, had a mean value of 12.54 ± 2.70 years (range 4–20 years). The average BDI score was 9.24 ± 6.78, indicating that, on average, the group fell within the ‘normal’ range. However, the variability in scores, as reflected by the standard deviation, suggests that while most participants did not suffer from clinical depression, some may have experienced mild depressive symptoms. This highlights the heterogeneity of depressive symptoms within the sample (Table 1).

3.2. Correlations Between Key Variables

The results indicate no significant correlations between MMSE and age (p = 0.18) or MMSE and education level (p = 0.75). Similarly, there were no significant correlations between BDI and age (p = 0.42) or BDI and education level (p = 0.6). Additionally, the Spearman correlation test revealed no significant relationship between MMSE and BDI scores (p = 0.87). Detailed results are provided in the Supplementary File.

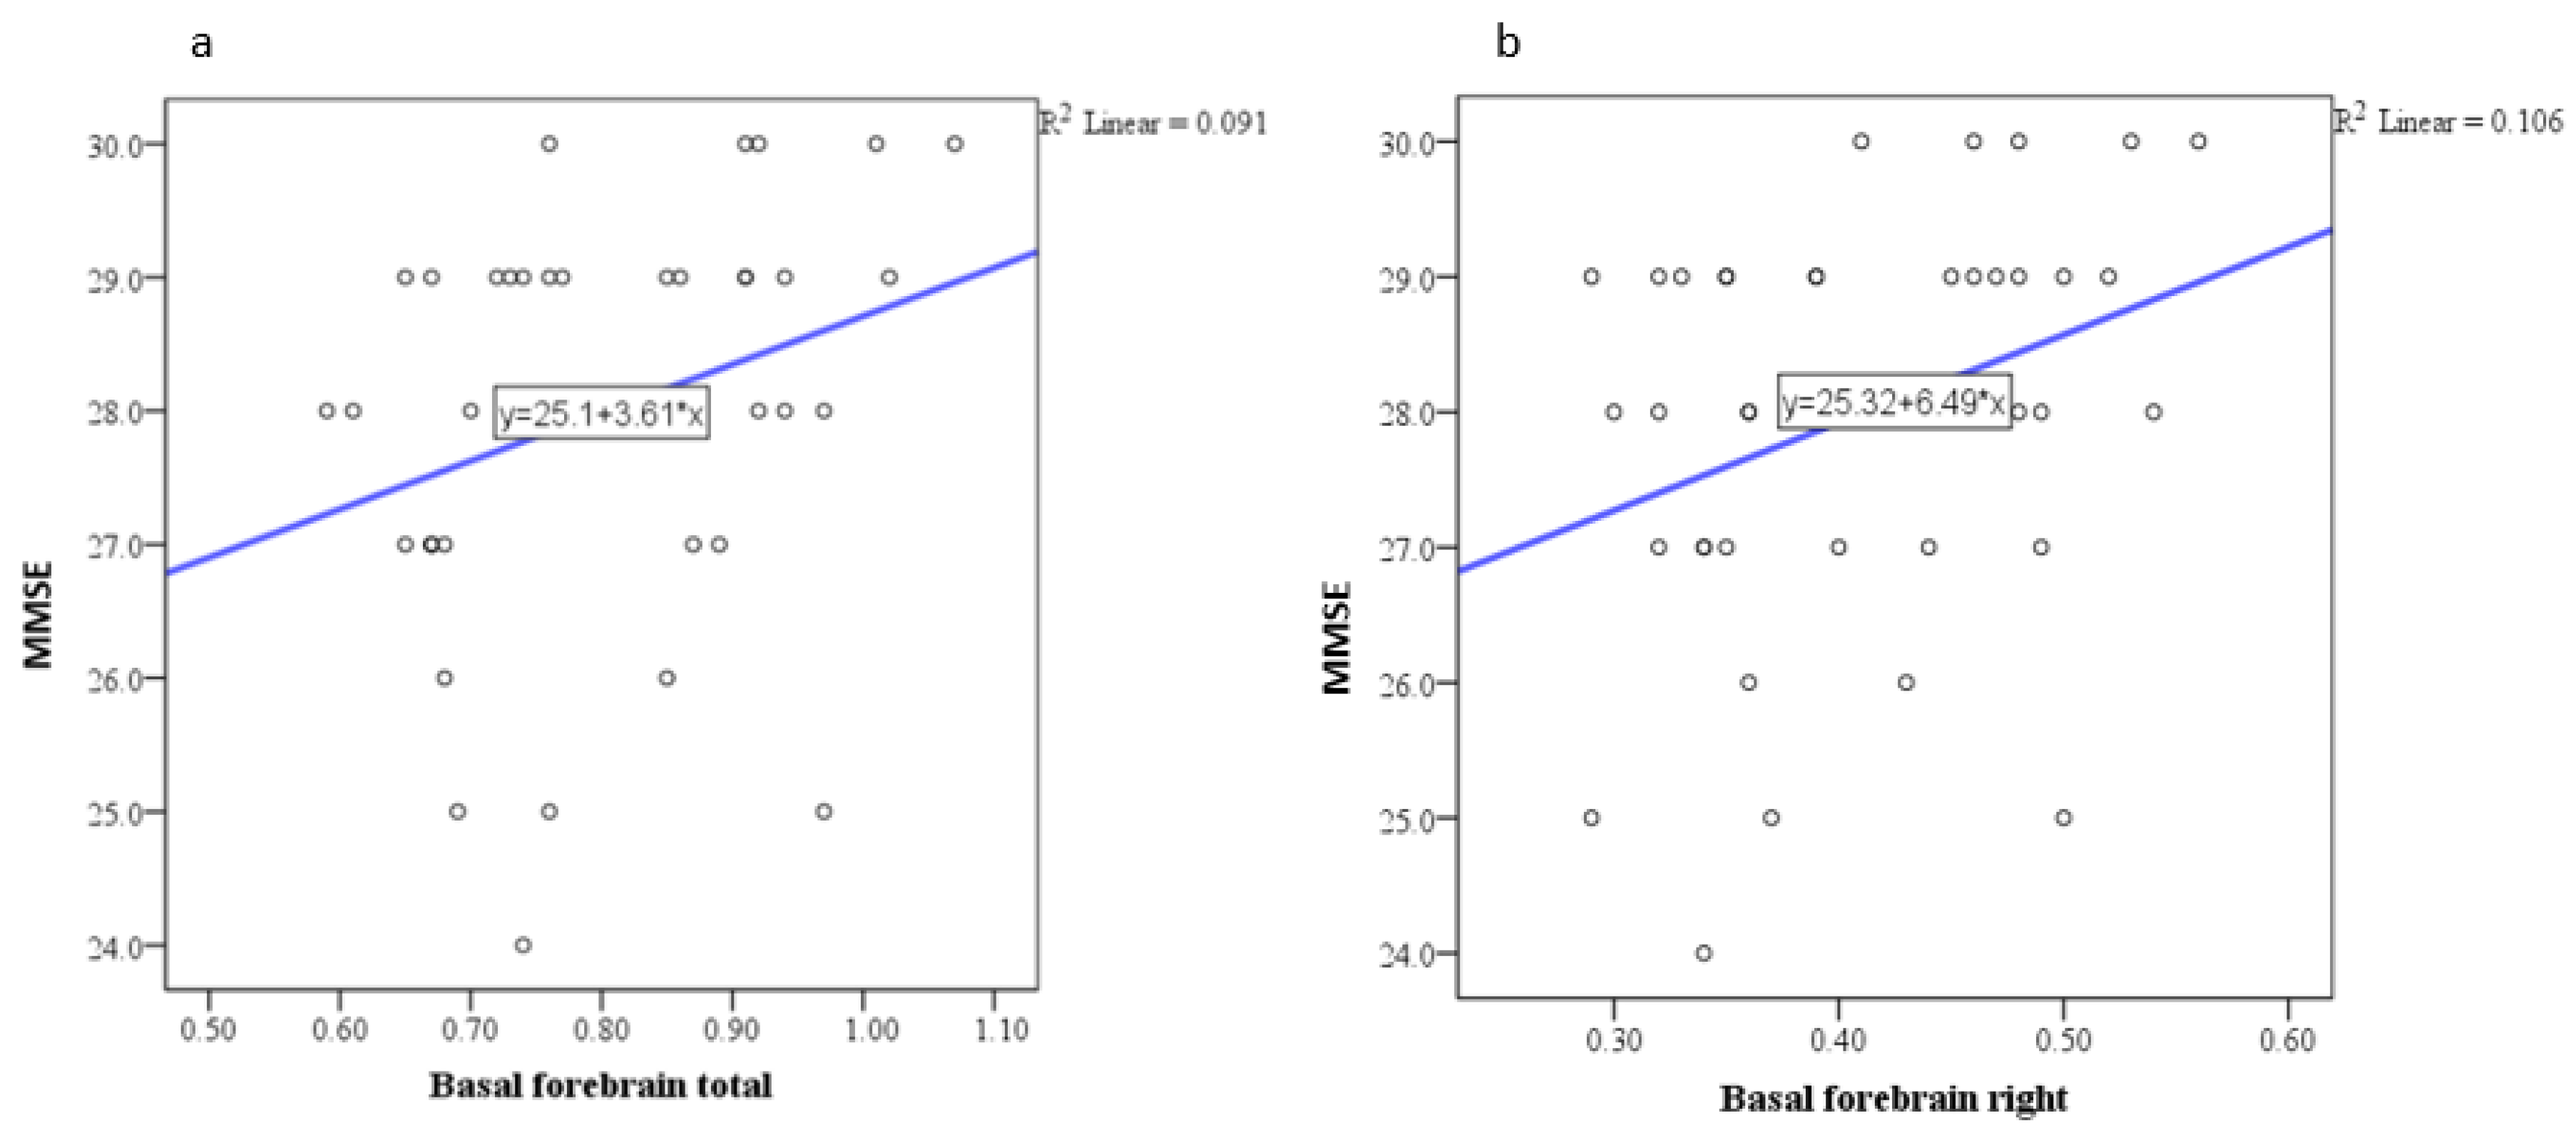
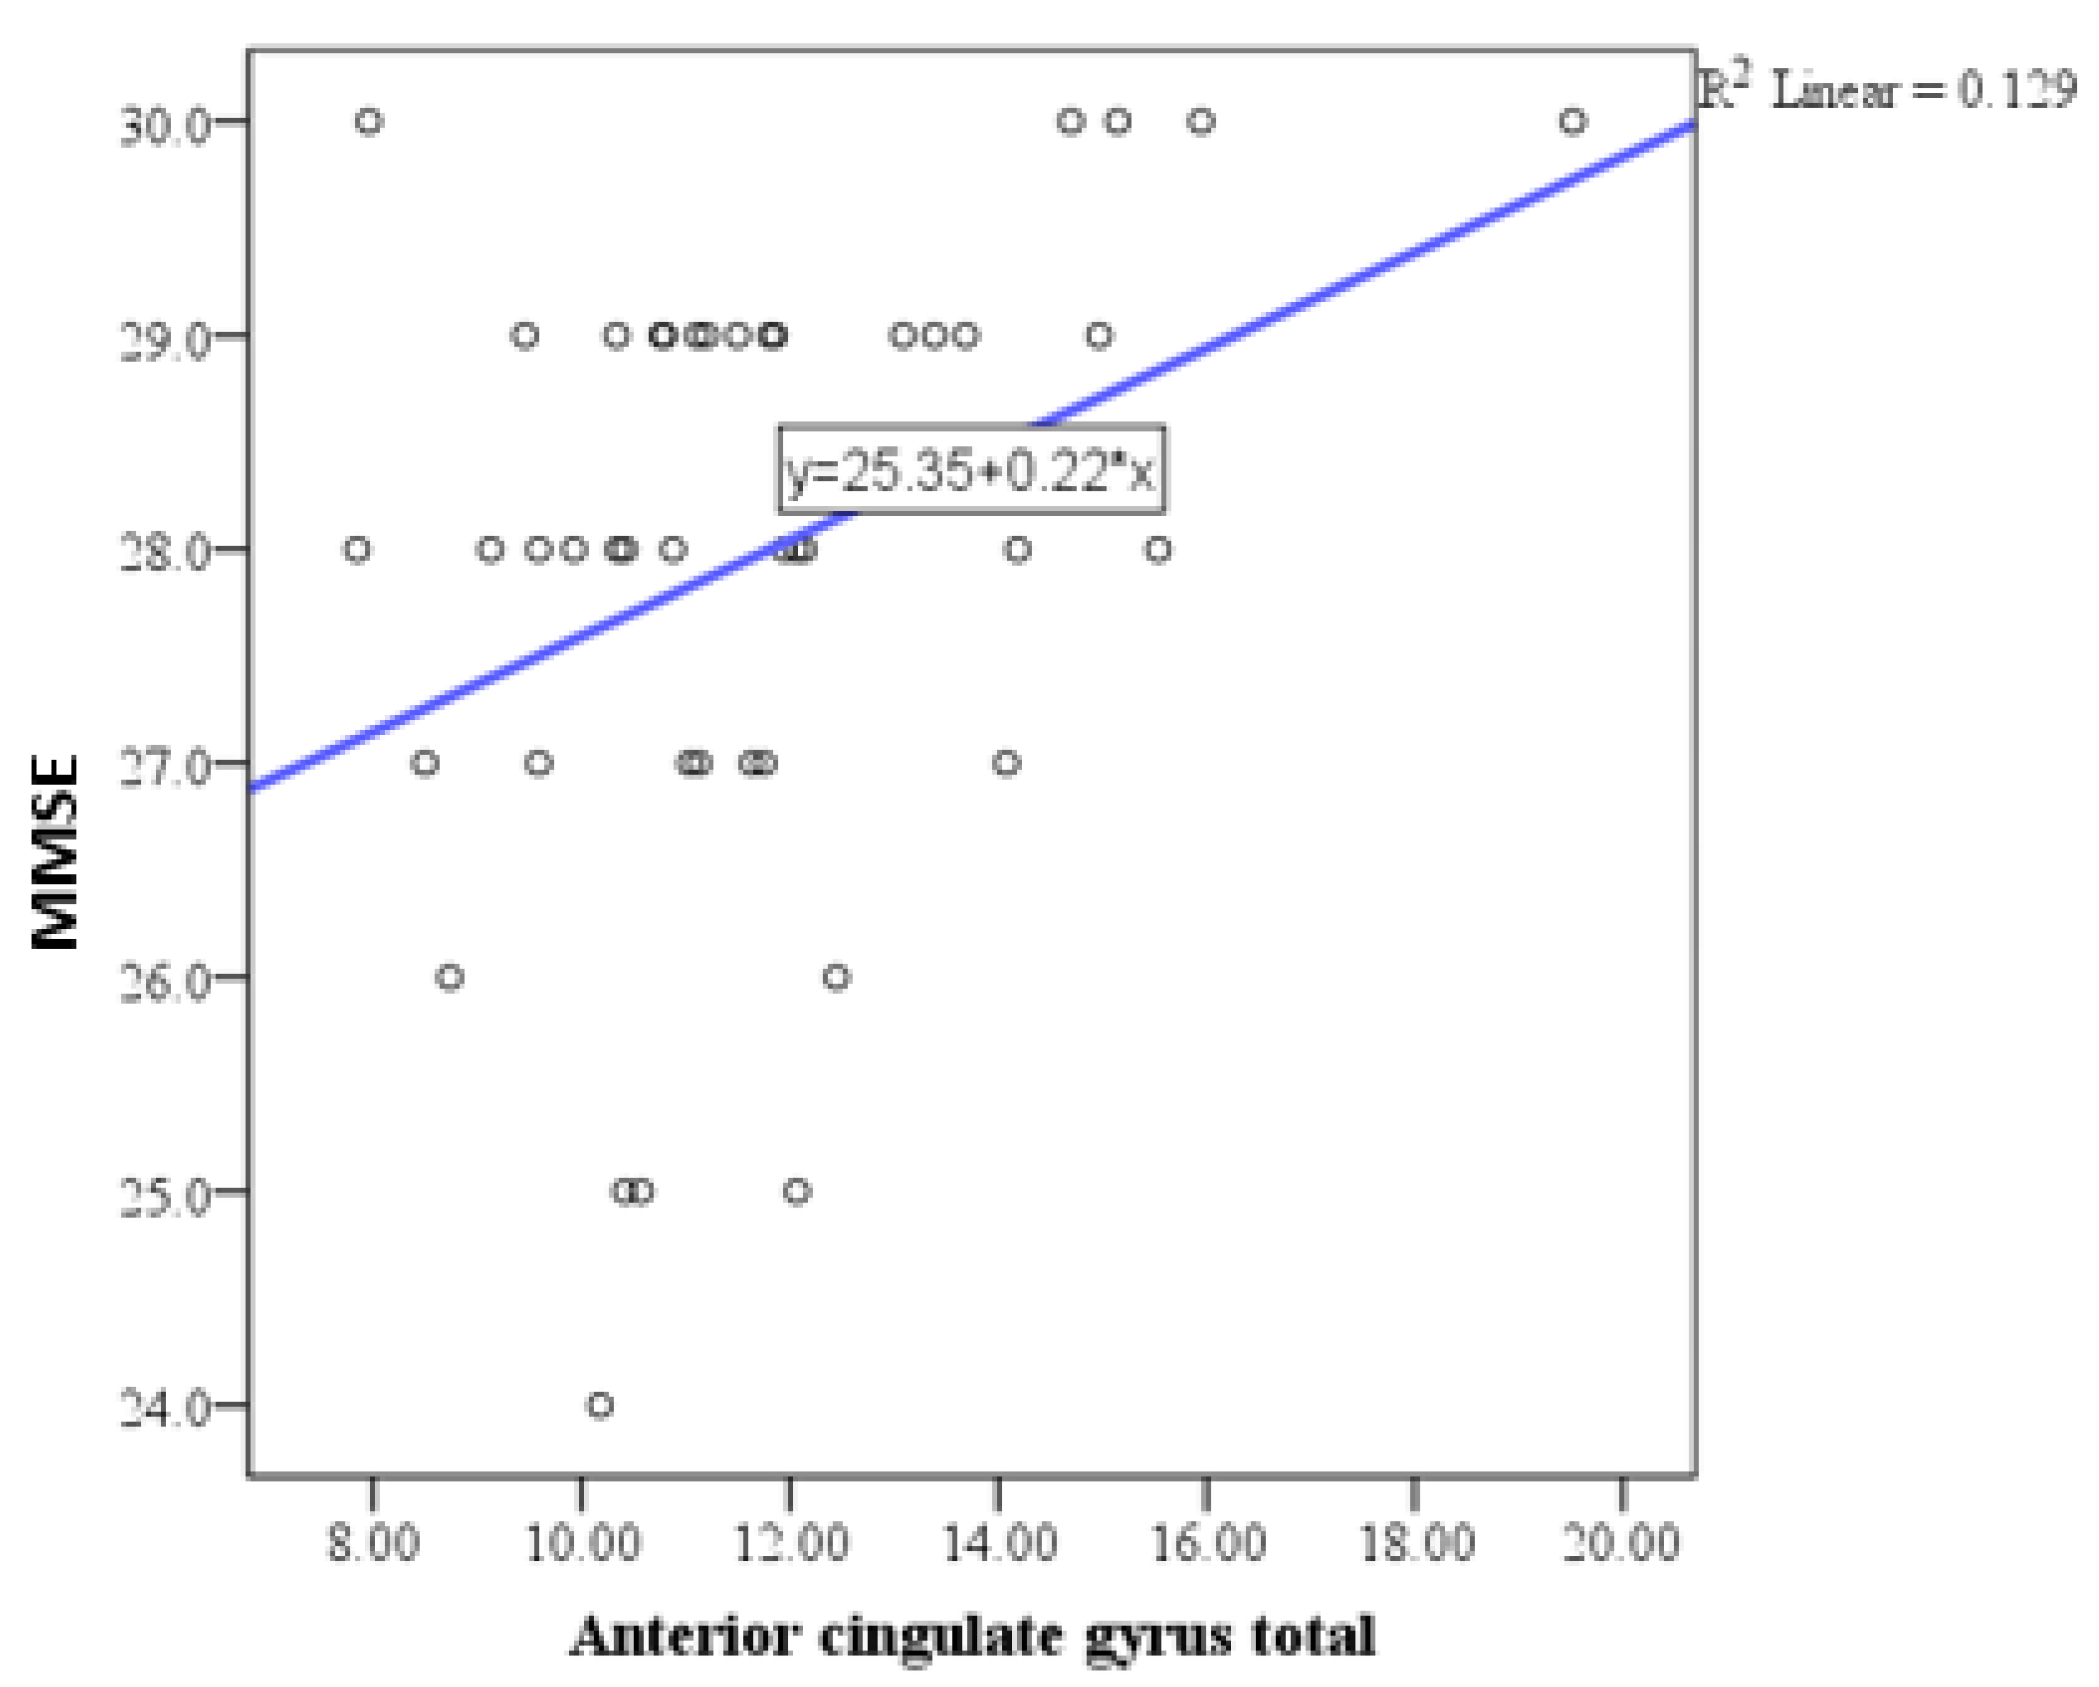
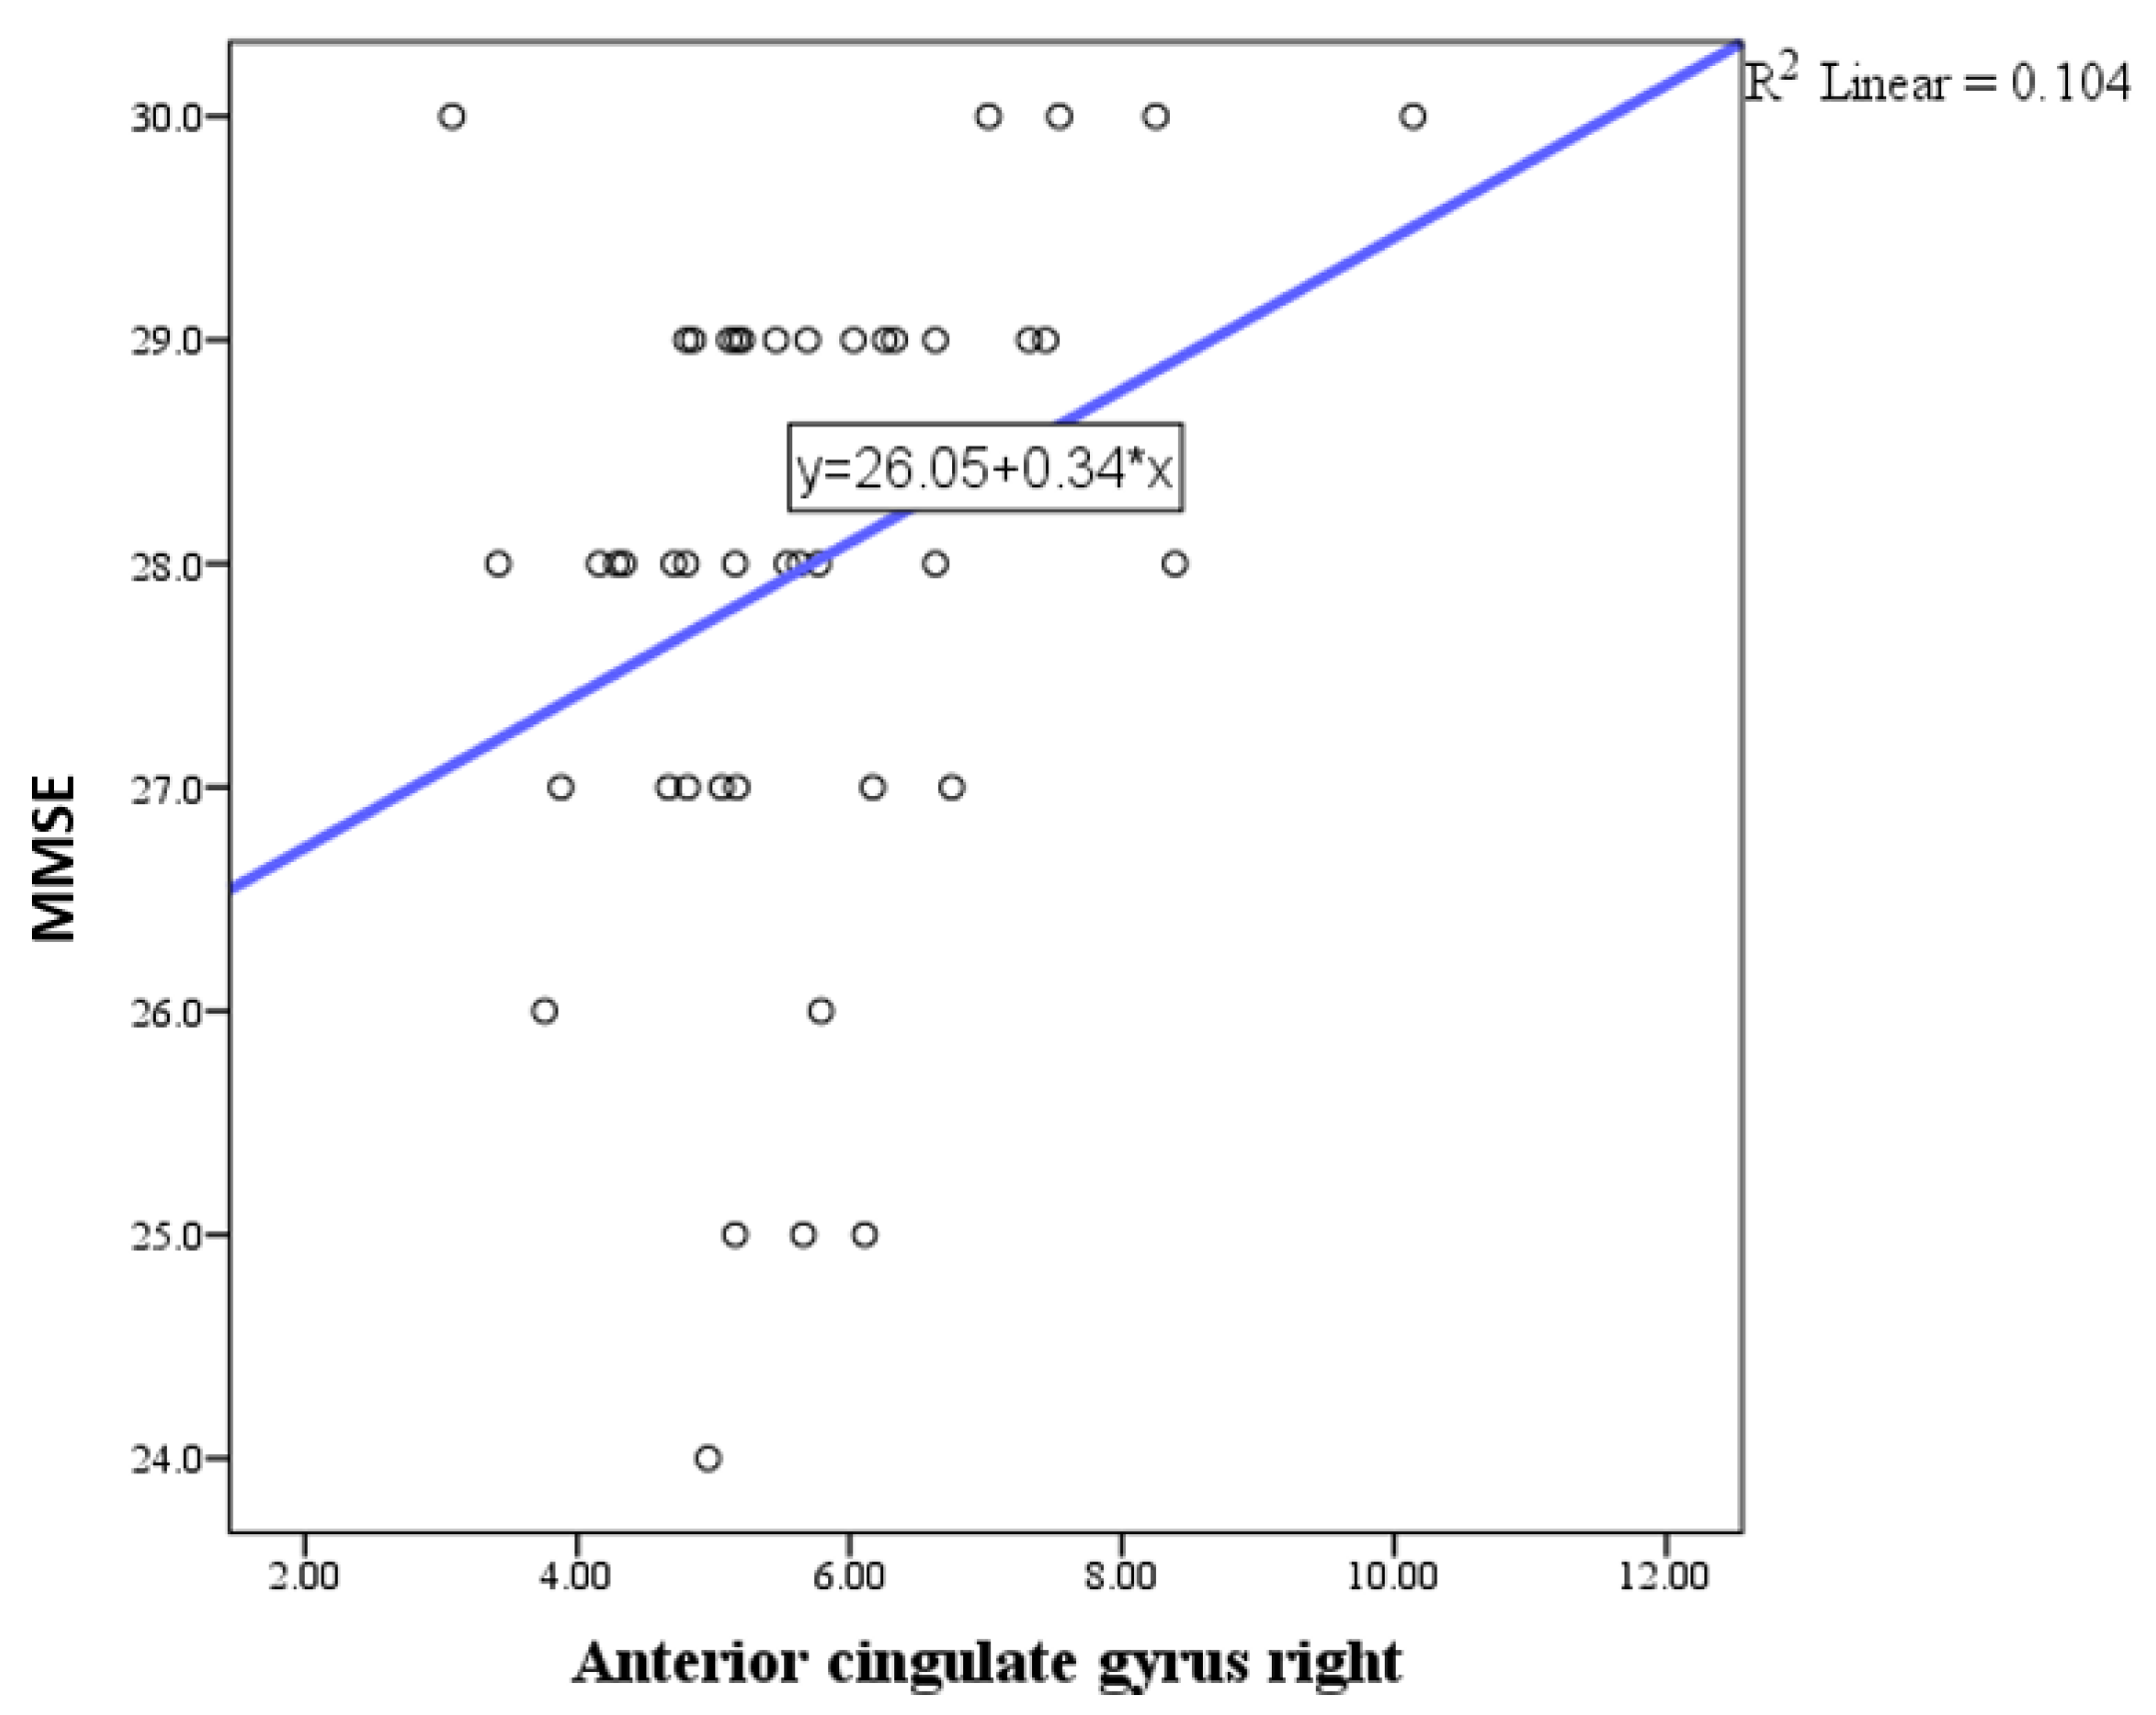
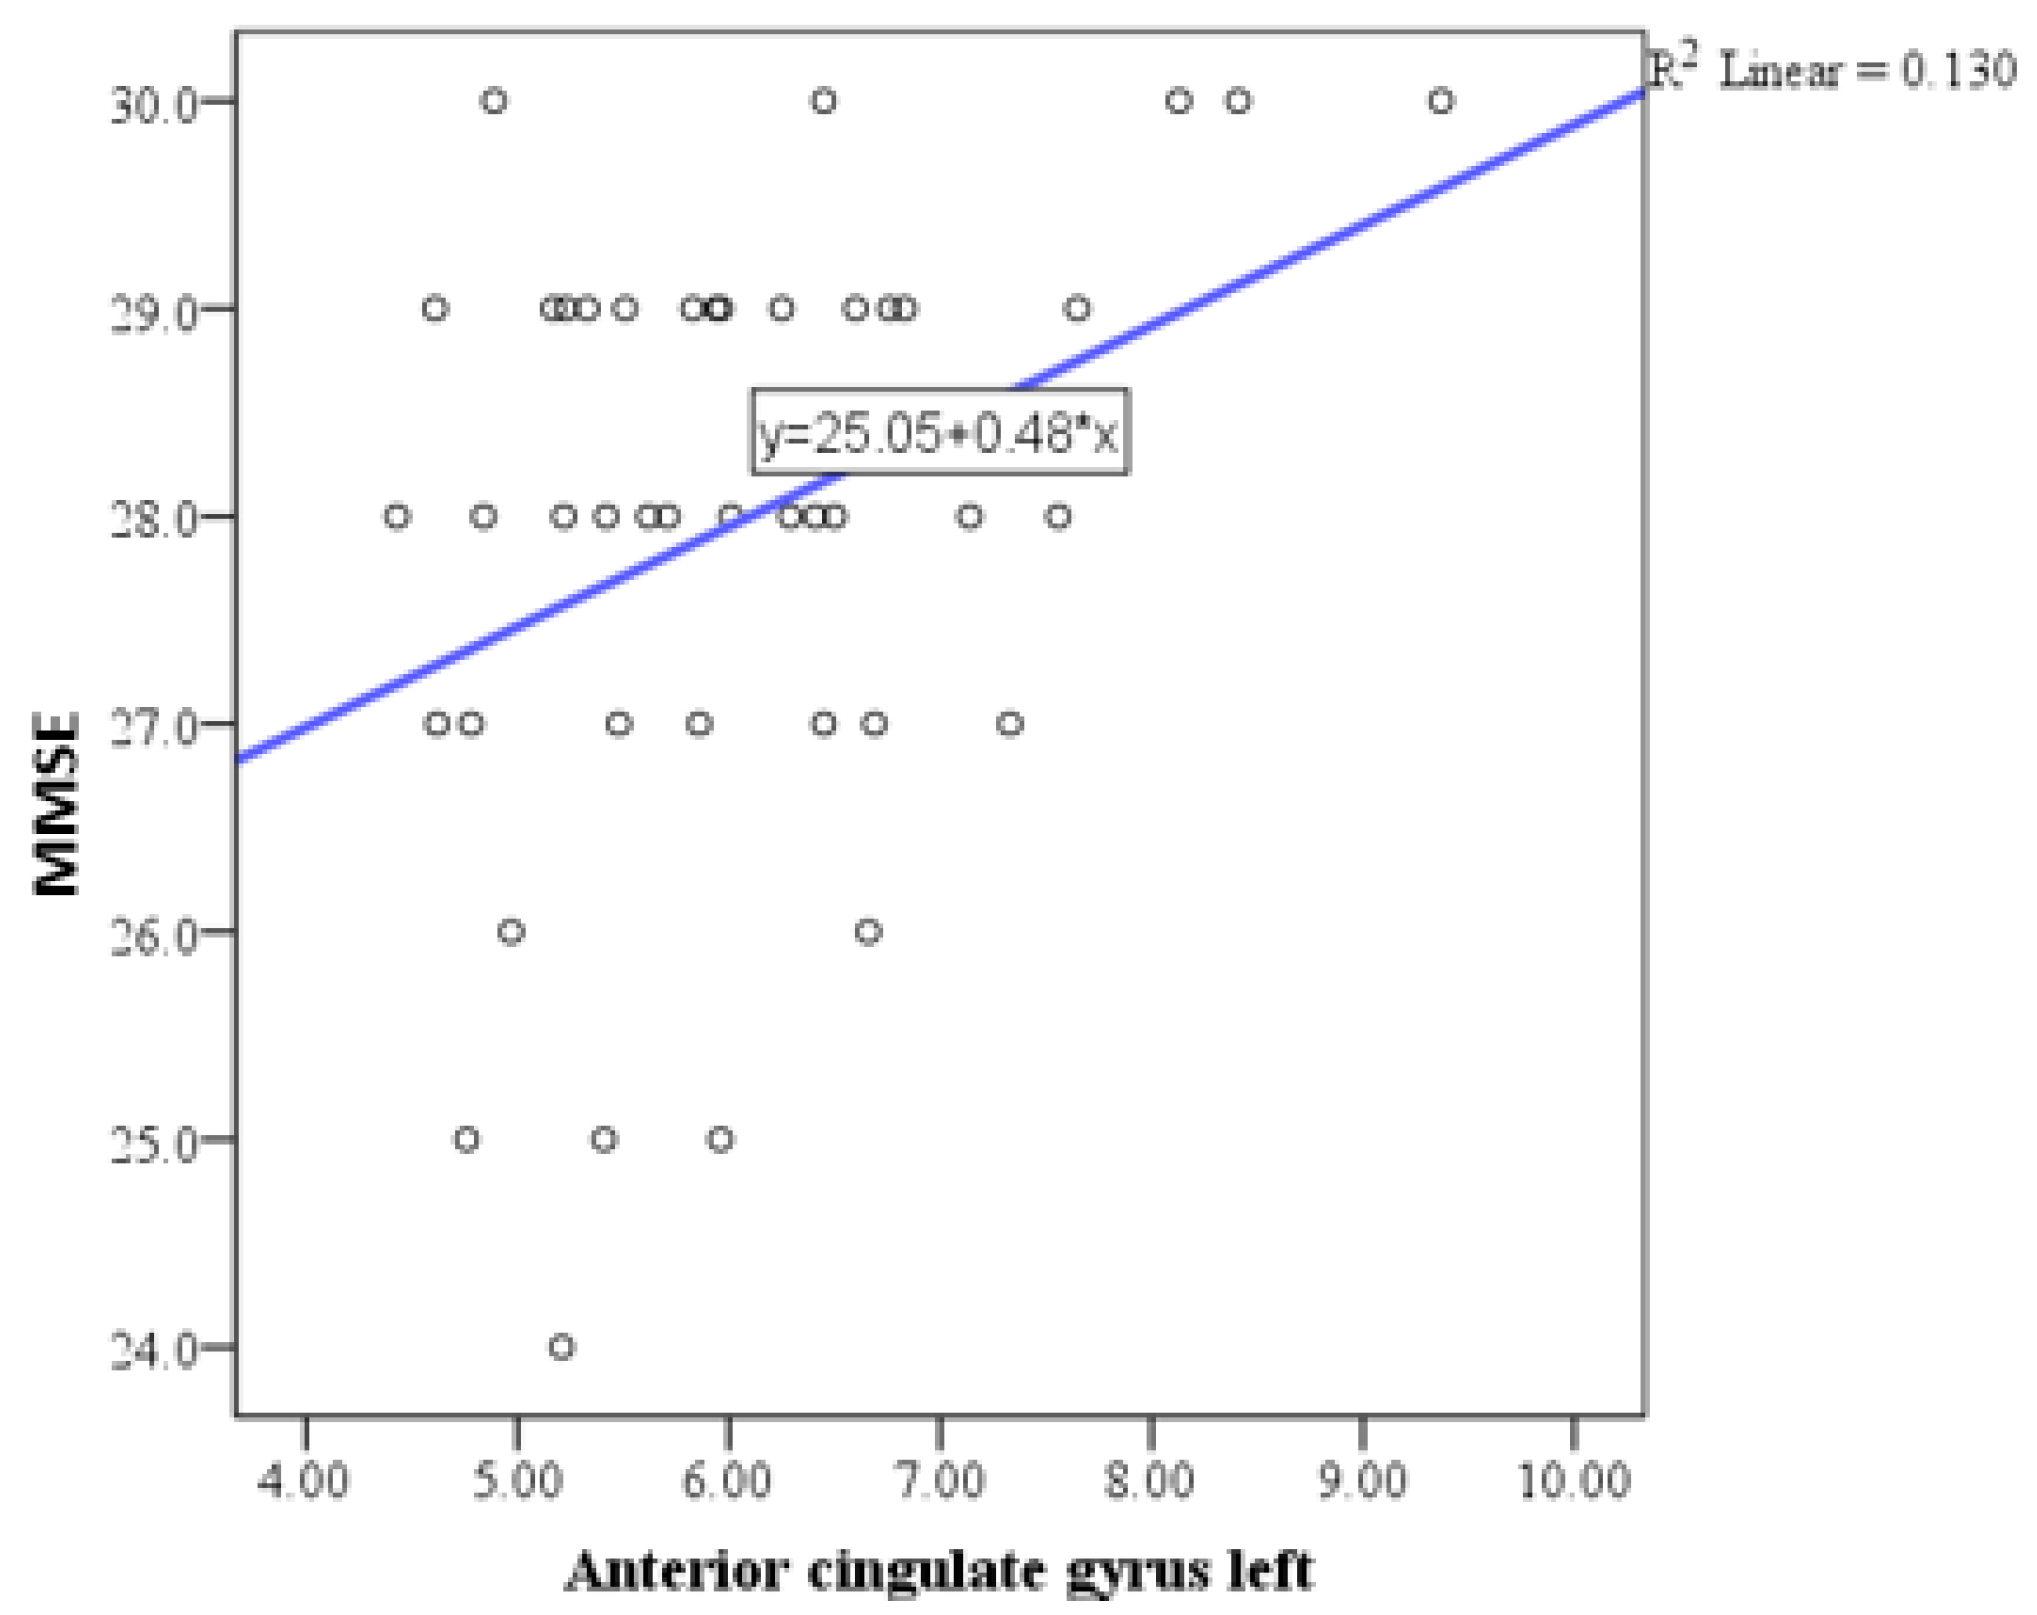
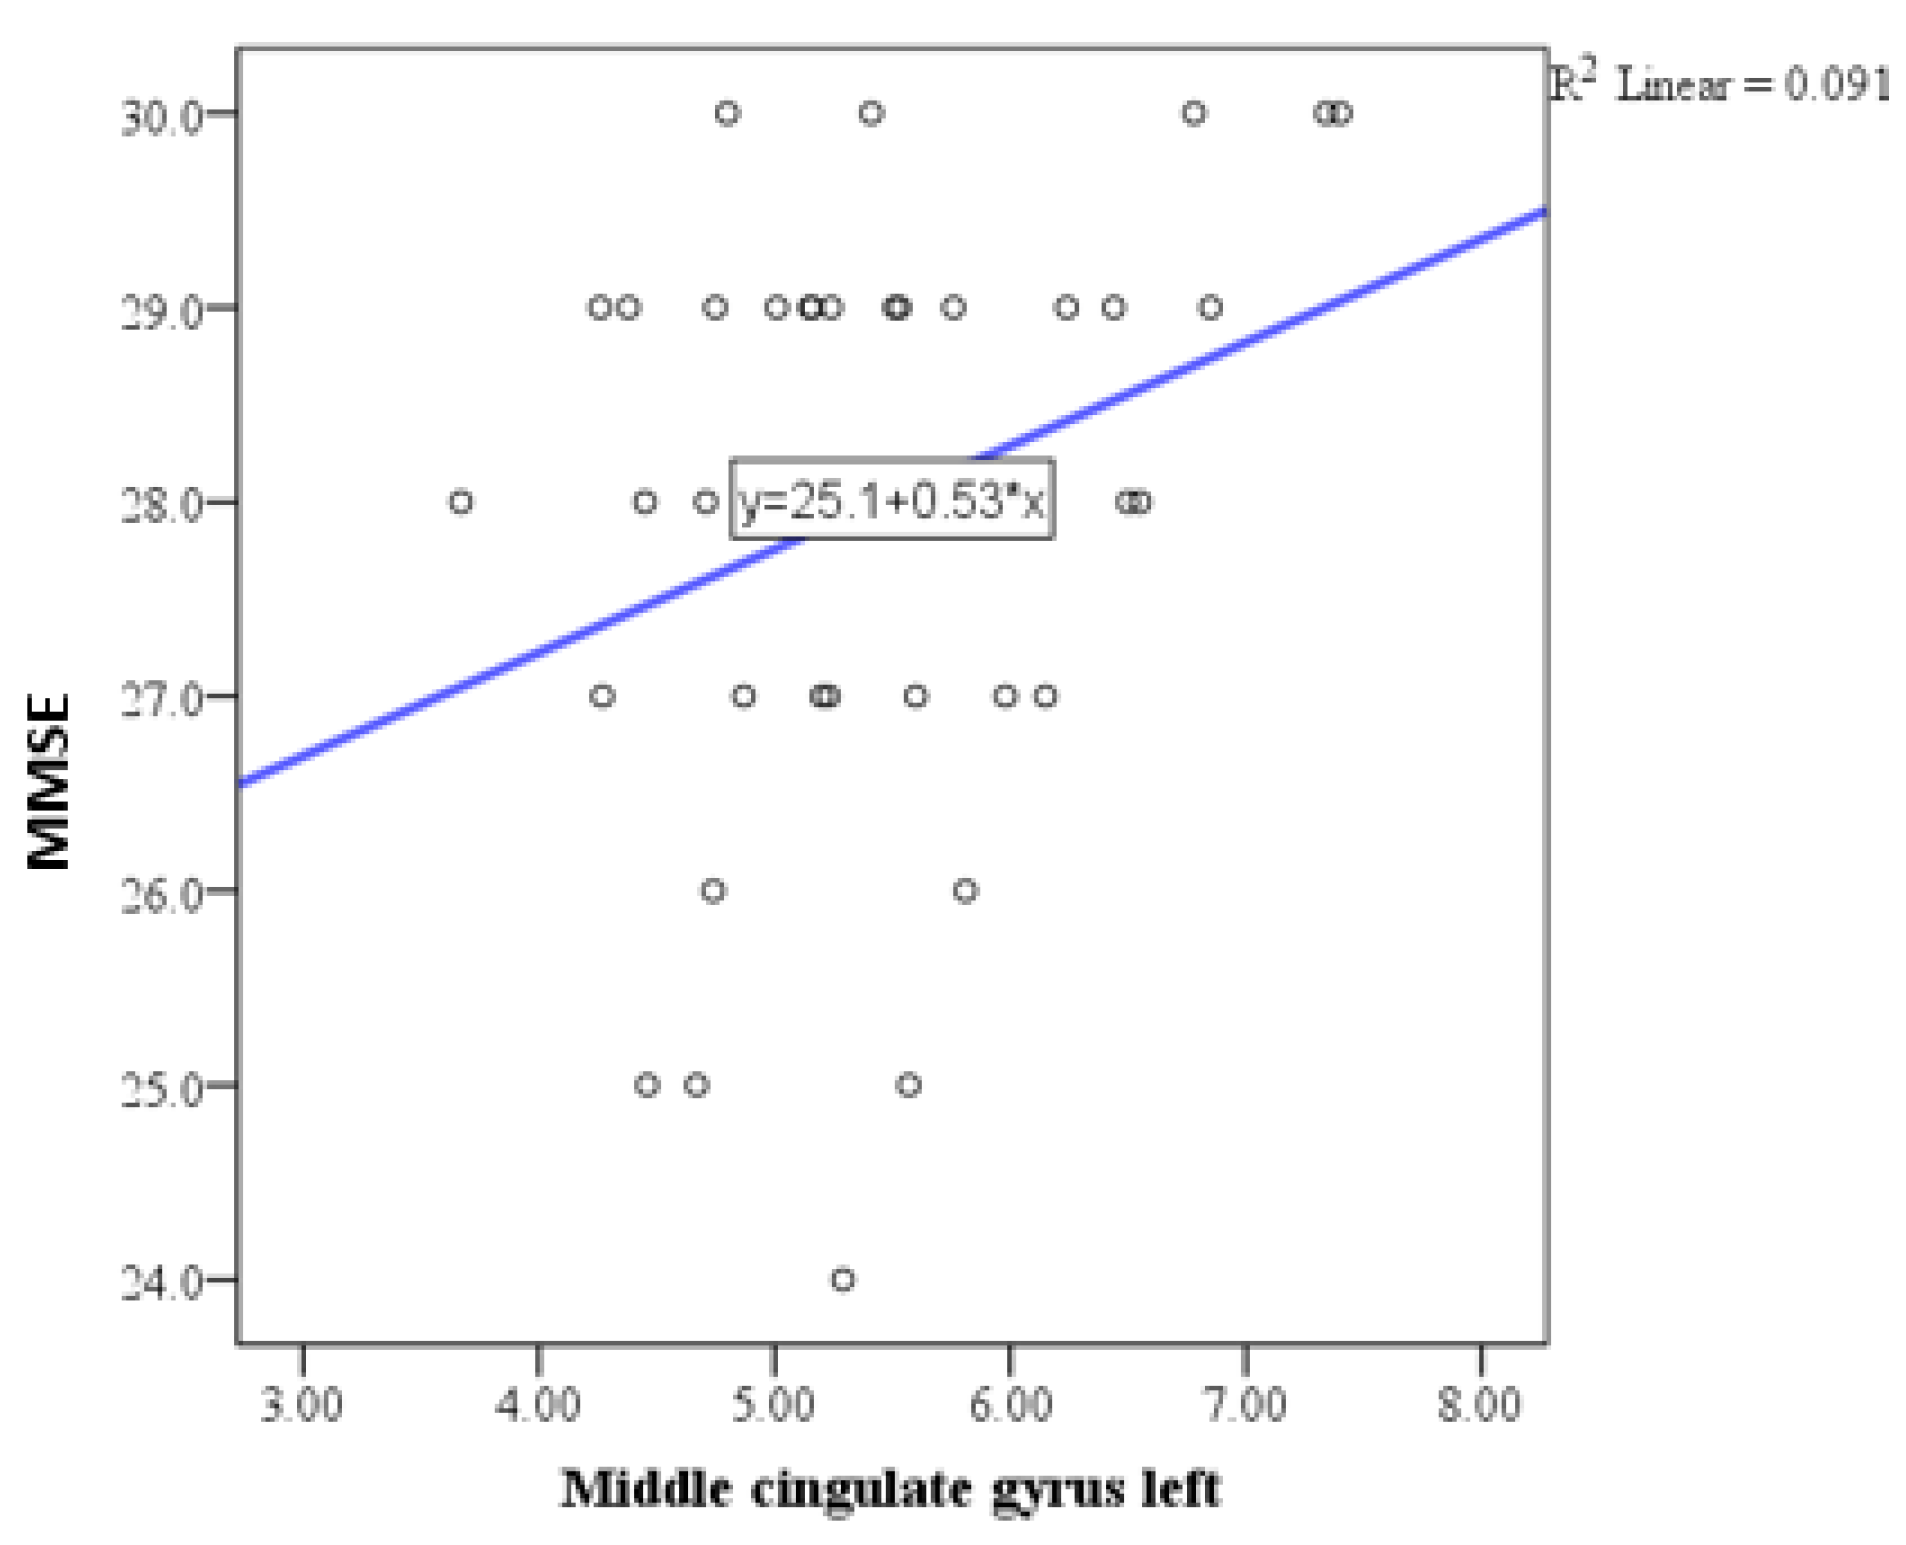
3.3. Correlations Between Volumes and Neurocognitive Tests

Pearson correlation analysis indicated a trend toward statistical significance in the correlation between the MMSE and the basal forebrain, particularly on the right side (Figure 1), with a positive correlation of weak to moderate intensity. Similar correlations were observed with the anterior cingulate gyrus (Figure 2, Figure 3 and Figure 4) and the left side of the middle cingulate gyrus (Figure 5). No significant correlations were found between MMSE scores and volumes in other examined brain structures (Table 2).

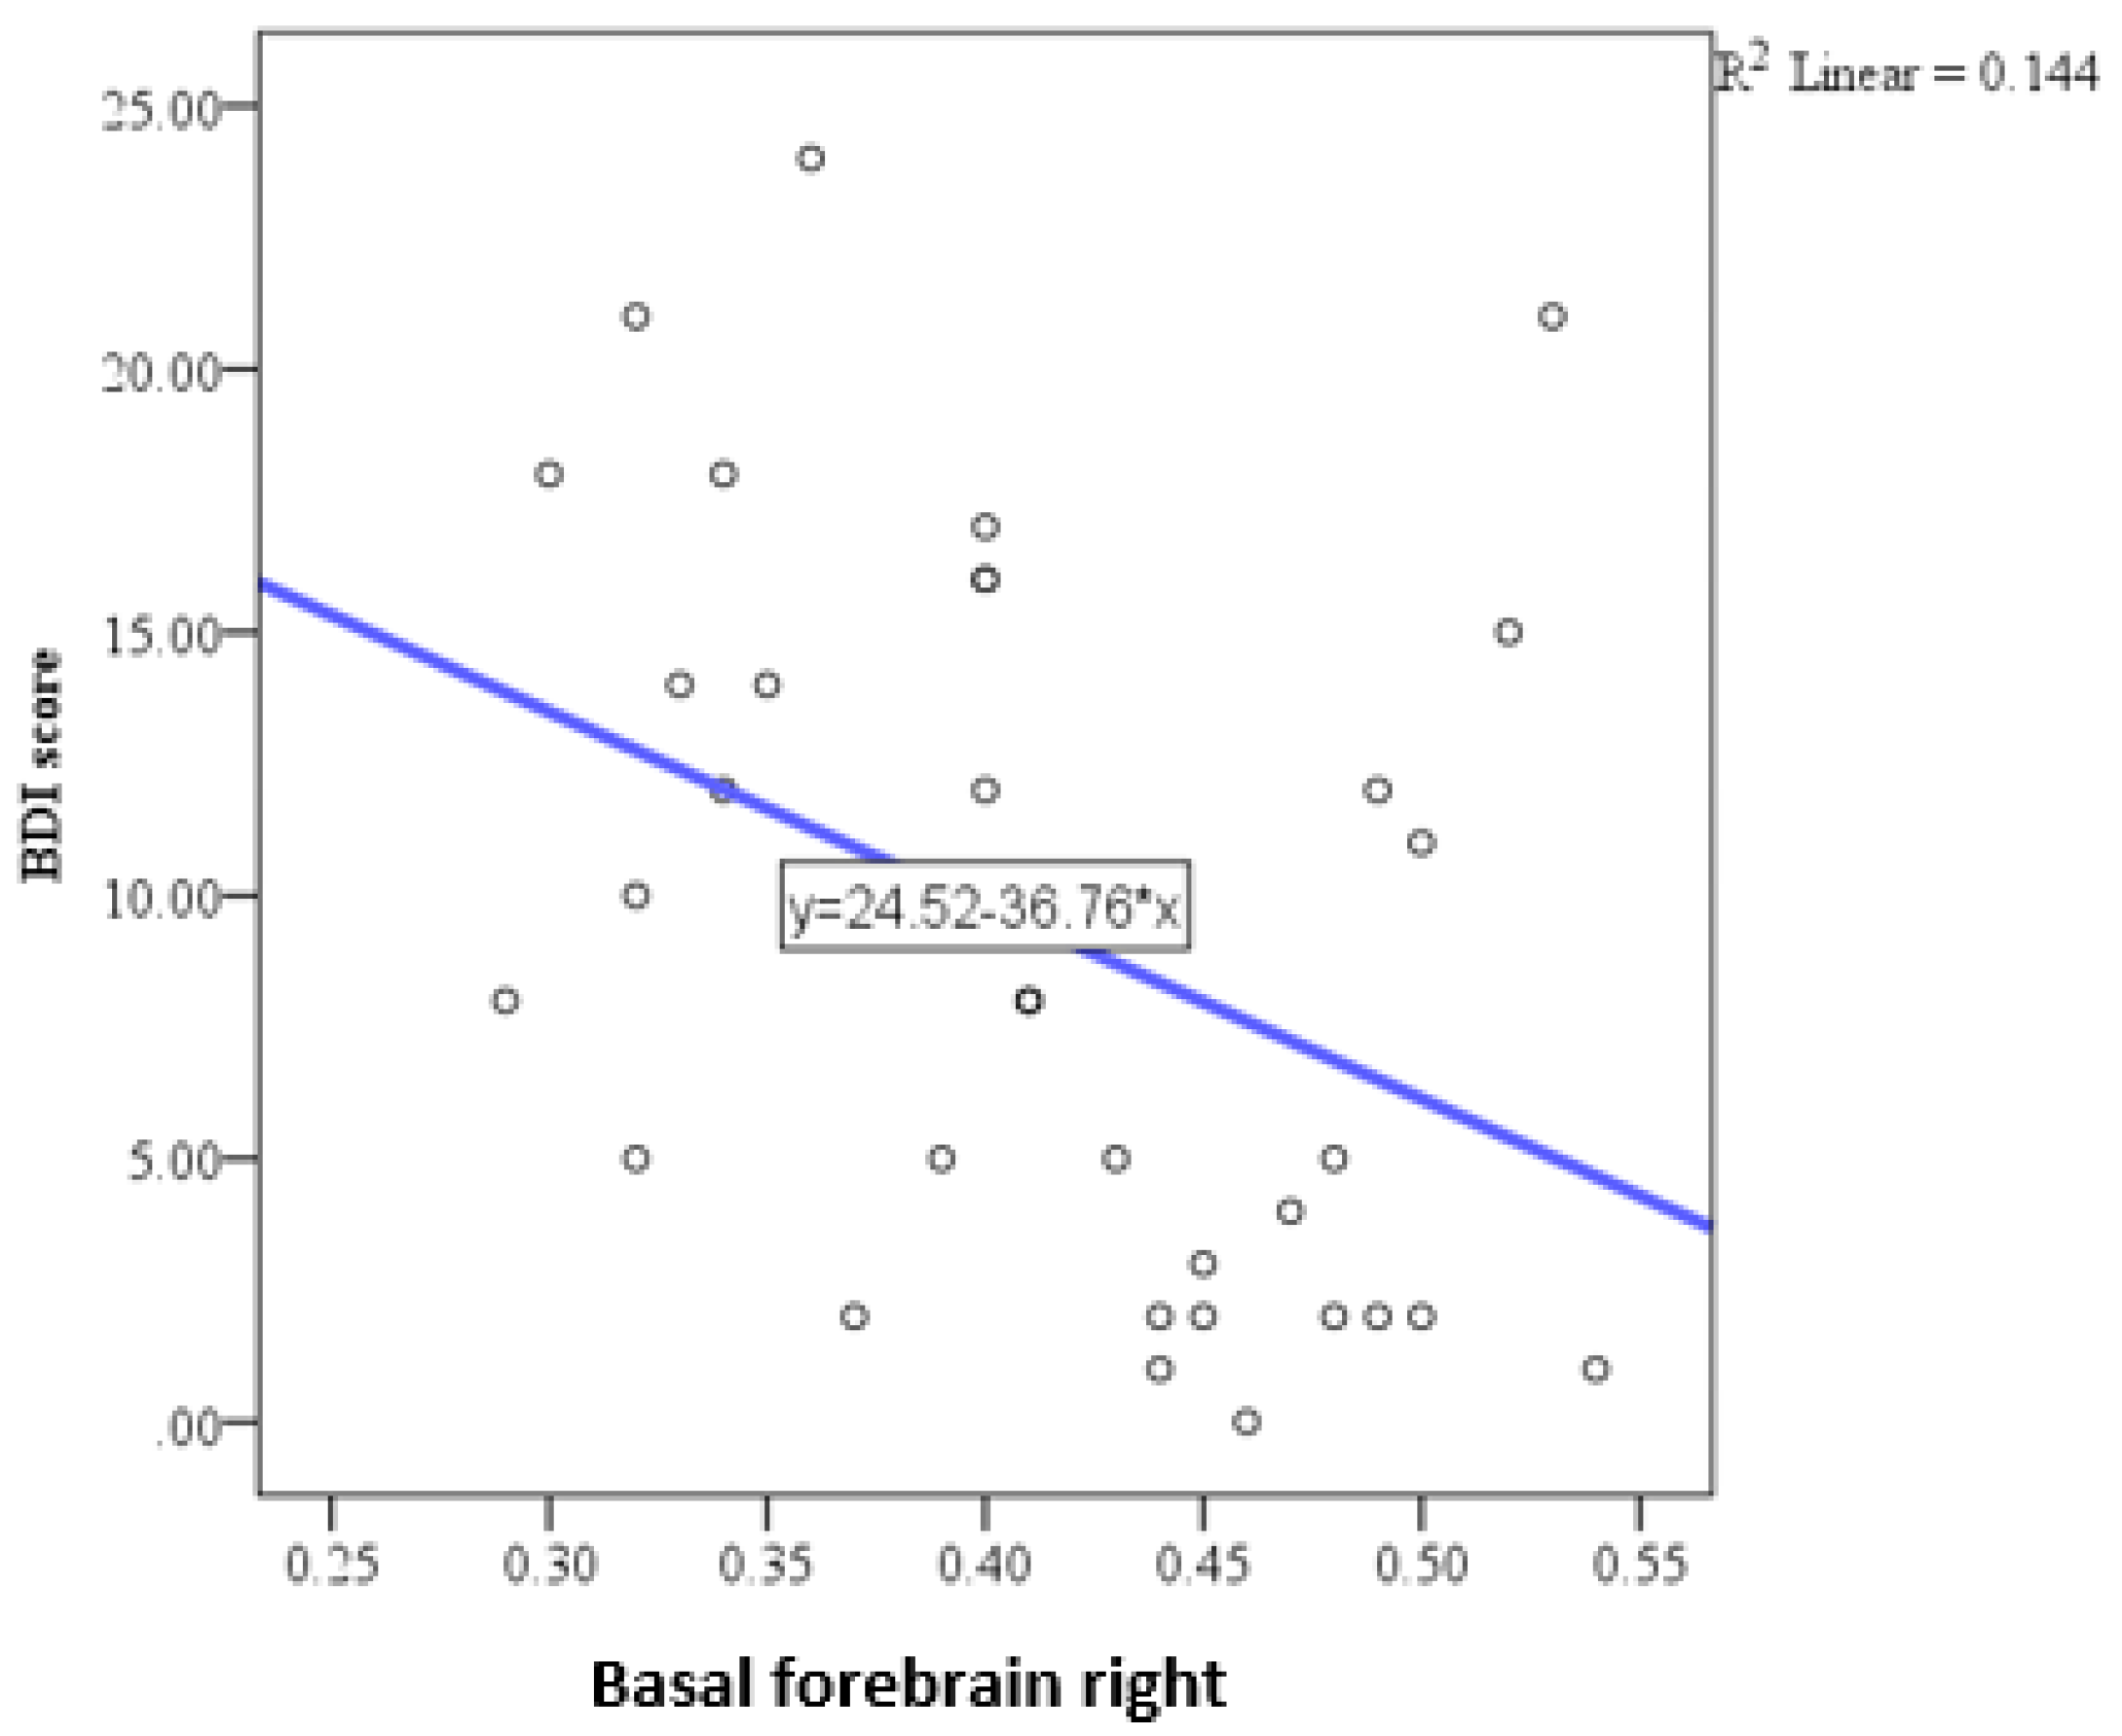
3.4. Correlation of Depression Scale with Volumes

The depression scale showed a trend toward significant correlation only with the right basal forebrain (Figure 6). This correlation was negative (indicating that a larger volume is associated with lower depression scores) and of moderate intensity (Table 3).

3.5. Multiple Regression Analysis Results

The analysis showed that neither age nor years of education significantly predicted the volume of the total basal forebrain (F = 1.132, p = 0.326, R = 0.14), the right basal forebrain (F = 2.01, p = 0.14, R = 0.19), the total anterior cingulate gyrus (F = 2.51, p = 0.09, R = 0.21), the right anterior cingulate gyrus (F = 1.96, p = 0.15, R = 0.18), the left anterior cingulate gyrus (F = 2.27, p = 0.11, R = 0.2), or the left middle cingulate gyrus (F = 2.39, p = 0.09, R = 0.2). Detailed results are provided in the Supplementary File.

4. Discussion

The findings of this study highlight the intricate relationship between brain parenchymal volume changes and neuropsychological outcomes in HIV-positive individuals. In this study, Pearson correlation analysis revealed a trend toward statistical significance between MMSE scores and the basal forebrain volume, particularly on the right side, showing a positive correlation of weak to moderate intensity. Additional correlations were observed between MMSE scores and volumes of the anterior and middle cingulate gyri. No significant correlations were identified between MMSE scores and volumes in other brain structures. Regarding depressive symptoms, the depression scale (BDI) demonstrated a trend toward significant correlation exclusively with the right basal forebrain. As mentioned above, we conducted a correlation analysis between MMSE scores and both age and education, as well as BDI scores and both age and education, which did not reveal any significant relationships. The lack of a significant correlation between MMSE scores and education level in our study may reflect the inherent variability in educational standards, which complicates the interpretation of years of schooling as a proxy for educational attainment. These findings are consistent with the study by Boban et al., conducted in our region, which also reported no significant association between MMSE scores and education level [29]. Similarly, no significant correlation was observed between MMSE and BDI scores. Based on this finding, we concluded that MMSE and BDI scores do not interact significantly in our sample, and thus, their inclusion as covariates in the analysis was unnecessary.
The basal forebrain and the cingulum are integral to cognitive and emotional processing, each contributing through distinct but interconnected mechanisms. The basal forebrain, with its cholinergic neurons, plays a central role in modulating cortical processing, dynamic attentional mechanisms, and emotional regulation. Noncholinergic neurons complement this by regulating cortical functions and interacting with cholinergic systems, ensuring adaptability to cognitive challenges [30]. This region is also implicated in depression, where degeneration of cholinergic nuclei leads to cortical cholinergic denervation, stress response dysregulation, and impaired emotional regulation [31]. The cingulum, as a major white matter tract, connects cortical and subcortical regions involved in memory, executive function, and emotional regulation [32]. Together, these structures form a network that is essential for the integration of cognitive and emotional processes, with dysfunction either contributing to depressive symptoms or cognitive decline.
Previous studies have shown that a decline in CD4 lymphocyte levels is associated with an increased risk of depression in HIV-positive individuals. Low CD4 counts can exacerbate neuroinflammation and reduce neurotrophic support, contributing to structural brain changes commonly linked to mood disturbances and cognitive impairment [33,34]. However, in our study, all participants were on cART, which not only increases CD4 lymphocyte levels but also reduces systemic inflammation. This therapeutic effect likely plays a role in mitigating neuroinflammation and its impact on brain structures.
Antidepressant medication, often used to manage depressive symptoms in HIV-positive individuals [6], might have provided an additional neuroprotective effect in our cohort. These medications target key signaling pathways involved in mood regulation and neurogenesis, with clinical trials demonstrating their ability to increase hippocampal volume. For instance, studies have documented volume increases in both the anterior hippocampus [35] and posterior hippocampus [36] following antidepressant treatment. Our findings, which did not reveal significant reductions in hippocampal or amygdalar volumes, contrast with those from studies involving untreated or less effectively treated HIV-positive populations [37]. This discrepancy may be attributed to the combined effects of combination antiretroviral therapy (cART), which restores immune function and reduces inflammation, and antidepressants, which promote neurogenesis and structural resilience. Together, these therapeutic interventions appear to play a crucial role in preserving brain health and mitigating structural changes commonly associated with both cognitive decline and depression in HIV-positive individuals.
Additionally, reductions in brain volume due to aging and neurodegeneration typically begin to manifest around the age of 35, as shown by Perić et al. [38]. Given that the average age of participants in our study was 39.26 ± 10.66 years, the influence of age-related processes on the observed volume reductions cannot be completely neglected. Instead, these reductions seem to be confined to specific brain structures that are particularly vulnerable to the effects of HIV. Despite the neuroprotective effects of cART and antidepressant therapy, these interventions were insufficient to fully protect these regions from HIV-related volume loss, further underscoring the selective impact of HIV-associated neuroinflammation.
Research in frontotemporal dementia (FTD) has demonstrated that basal forebrain atrophy is a key feature of cognitive decline, particularly in tauopathies [39]. Similarly, significant atrophy of the basal forebrain has also been observed in Alzheimer’s disease (AD), where it serves as a key region affected by neurodegeneration [40]. This aligns with our findings, where basal forebrain volume showed a significant correlation with cognitive performance, as measured by MMSE scores, highlighting its role in cognitive regulation. These observations are consistent with prior research emphasizing the basal forebrain’s role in attention, memory, and learning [41]. Moreover, the association between basal forebrain volume and depressive symptoms in our study suggests that this region is also crucial for emotional regulation. Although the underlying mechanisms differ—tau-mediated neurodegeneration in FTD and AD, versus HIV-associated neuroinflammation in our study—the shared involvement of the basal forebrain underscores its vulnerability in neurodegenerative and neuroinflammatory conditions.
Additional correlations were identified with the anterior cingulate gyrus and the middle cingulate gyrus on the left side, which are crucial regions for executive functioning and attentional control [42]. However, no significant correlations were observed between MMSE scores and volumes of other examined brain structures, indicating a selective vulnerability of certain regions to HIV-related neurodegenerative processes.
Depressive symptoms, assessed using the BDI, exhibited a distinct pattern of association. A negative correlation of moderate intensity was found exclusively with the right basal forebrain, indicating that individuals with smaller volumes in this region tend to exhibit higher levels of depressive symptoms. This aligns with evidence linking the basal forebrain to mood regulation through its role in modulating neurotransmitter systems, including acetylcholine and dopamine [43]. The specific involvement of the right basal forebrain may reflect lateralized neural mechanisms underlying emotional processing [44]. The study of Kallianpur et al. reported tending toward a significant negative correlation between depression and volumes of the caudate and the hippocampus, while in other regions that were analyzed (such as nc. accumbens and other subcortical regions) the correlations were not significant [45]. A more recent study, by Bronshteyn et al. [37], presented the negative correlations between the right hippocampal volume and BDI-II scores in a group of HIV-positive people; however, the mean age in the study population was 56.6 years, which is significantly advanced compared to our group, and the effect of aging on the observed reduction in hippocampal volumes cannot be neglected. A very recent study on brain function abnormalities in people living with HIV in a comparable study group failed to present any correlations with gray matter volumes in people living with HIV (PLWH) with anxiety disorder [46]. Resting-state fMRI showed abnormalities in functional connectivity in the anterior cingulated gyrus and amygdala in people with acute HIV, similar to findings in people with depression and without HIV infection, bringing the spotlight more on depression itself [47].
These findings underline the dual impact of HIV on cognitive and emotional health, with structural brain changes in key regions playing a central role. While the basal forebrain appears to serve as a shared substrate for both cognition and mood regulation, the differential correlation patterns for MMSE and BDI scores suggest distinct underlying mechanisms. These could stem from variations in neuroinflammation, synaptic plasticity, or compensatory processes in the affected brain regions [48].
Overall, this study emphasizes the need for early identification of structural brain changes and the development of targeted interventions to mitigate the combined effects of cognitive decline and mood disturbances in HIV-positive individuals.
This study has several limitations. First, the inclusion of only male participants ensures sample homogeneity but limits the generalizability of findings to female HIV-positive individuals, who may exhibit different neuroanatomical and psychological patterns. Second, the relatively small sample size may have reduced the statistical power to detect significant correlations, particularly for weaker associations. One of the limitations of this study is the discrepancy in the number of participants with available MMSE (N = 48) and BDI scores (N = 35). This arose due to the retrospective nature of the study, where logistical challenges and variations in participant compliance during data collection led to incomplete BDI score availability. Additionally, the cross-sectional design prevents conclusions about causal relationships between brain volume changes and neuropsychological outcomes. Although the volBrain software offers efficient and reliable automated segmentation, the absence of manual segmentation—often regarded as the ‘gold standard’ despite its practical challenges—represents a potential limitation in ensuring the highest level of volumetric precision. Finally, while the MMSE and BDI scales were used to assess cognitive function and depressive symptoms, these tools may not fully capture the complexity of cognitive deficits and mood disturbances in HIV-positive individuals. The MMSE, in particular, is limited in detecting subtle cognitive changes, especially in younger populations where high scores are typical. This could reduce the sensitivity of the study to identify early or mild cognitive impairments, potentially impacting the interpretation of results.
Future research should aim to address these limitations by including more diverse and larger cohorts, adopting longitudinal designs to explore causal relationships, and utilizing more comprehensive neuropsychological assessments tailored to different age groups. Additionally, investigating interventions targeting specific brain regions, such as the basal forebrain, could provide valuable insights into mitigating cognitive decline and depressive symptoms in HIV-positive populations. Such approaches will improve our understanding of the interplay between neuroanatomy, cognition, and mood disturbances in this group.

5. Conclusions

In conclusion, this study highlights the significant impact of HIV-related structural brain changes on cognitive function and depressive symptoms. The observed correlations between brain parenchymal volumes and neuropsychological measures emphasize the vulnerability of specific brain regions, particularly the basal forebrain and cingulate gyrus, to HIV-associated neurodegeneration. These findings underscore the importance of early detection and targeted interventions to address both cognitive decline and mood disturbances in HIV-positive individuals.

Supplementary Materials

The following supporting information can be downloaded at https://www.mdpi.com/article/10.3390/medicina61040632/s1. Table S1: Correlation between MMSE and age, and MMSE and education level; Table S2: Correlation between BDI and age, and BDI and education level; Table S3: Correlation between MMSE and BDI scores; Table S4: Results of Multiple Regression Analysis of each of the independent variables.

Author Contributions

Conceptualization, R.P., D.K. and J.B.; methodology, J.O., D.L. and J.B.; software, R.P.; validation, S.B., R.P. and J.B.; formal analysis, J.B.; investigation, R.P.; resources, J.B. and V.B.I.; data curation, R.P. and J.B.; writing—original draft preparation, R.P.; writing—review and editing, J.B.; visualization, R.P.; supervision, J.B.; project administration, J.B.; funding acquisition, J.B. All authors have read and agreed to the published version of the manuscript.

Funding

This research was fully supported by the Science Fund of the Republic of Serbia (no. 250/2022, Chemobrain: Imaging biomarkers of neuronal injury and brain plasticity-ChemoBRAIN).

Institutional Review Board Statement

This study was conducted following the Declaration of Helsinki and approved by the Ethics Committee of the Oncology Institute of Vojvodina (code 4/19/1-1902/2/9; date 28 June 2019).

Informed Consent Statement

Informed consent was obtained from all subjects involved in the study.

Data Availability Statement

The original contributions presented in this study are included in the article/Supplementary Materials. Further inquiries can be directed to the corresponding author.

Acknowledgments

This research was partially supported by the Provincial Secretariat for Higher Education and Scientific Research, under grant no. 003085335 2024 09418 003 000 000 001/1. The authors extend their gratitude to the Science Fund for covering the publication costs of this research.

Conflicts of Interest

The authors declare no conflicts of interest. The funders had no role in the design of the study; in the collection, analyses, or interpretation of data; in the writing of the manuscript; or in the decision to publish the results.

References

  1. Gisslén, M.; Price, R.W.; Nilsson, S. The definition of HIV-associated neurocognitive disorders: Are we overestimating the real prevalence? BMC Infect. Dis. 2011, 11, 356. [Google Scholar] [CrossRef] [PubMed]
  2. Gisslen, M.; Keating, S.M.; Spudich, S.; Arechiga, V.; Stephenson, S.; Zetterberg, H.; Di Germanio, C.; Blennow, K.; Fuchs, D.; Hagberg, L.; et al. Compartmentalization of cerebrospinal fluid inflammation across the spectrum of untreated HIV-1 infection, central nervous system injury, and viral suppression. PLoS ONE 2021, 16, e0247897. [Google Scholar] [CrossRef] [PubMed]
  3. van Schalkwyk, C.; Mahy, M.; Johnson, L.F.; Imai-Eaton, J.W. Updated data and methods for the 2023 UNAIDS HIV estimates. J. Acquir. Immune Defic. Syndr. 2024, 95, e1–e4. [Google Scholar] [CrossRef] [PubMed]
  4. Deeks, S.G.; Archin, N.; Cannon, P.; Collins, S.; Jones, R.B.; de Jong, M.A.W.P.; Lambotte, O.; Lamplough, R.; Ndung’u, T.; Sugarman, J.; et al. International research priorities for an HIV cure: International AIDS Society Global Scientific Strategy 2021. Nat. Med. 2021, 27, 2085–2098. [Google Scholar] [CrossRef]
  5. Adewumi, O.M.; Dukhovlinova, E.; Shehu, N.Y.; Zhou, S.; Council, O.D.; Akanbi, M.O.; Taiwo, B.; Ogunniyi, A.; Robertson, K.; Kanyama, C.; et al. HIV-1 central nervous system compartmentalization and cytokine interplay in non-subtype B HIV-1 infections in Nigeria and Malawi. AIDS Res. Hum. Retroviruses 2020, 36, 490–500. [Google Scholar] [CrossRef]
  6. Fitri, F.I.; Rambe, A.S.; Fitri, A. Correlation between Lymphocyte CD4 Count, Treatment Duration, Opportunistic Infection and Cognitive Function in Human Immunodeficiency Virus-Acquired Immunodeficiency Syndrome (HIV-AIDS) Patients. Open Access Maced. J. Med. Sci. 2018, 6, 643–647. [Google Scholar] [CrossRef]
  7. Ellis, R.; Langford, D.; Masliah, E. HIV and antiretroviral therapy in the brain: Neuronal injury and repair. Nat. Rev. Neurosci. 2007, 8, 33–44. [Google Scholar] [CrossRef]
  8. Valcour, V.; Chalermchai, T.; Sailasuta, N.; Marovich, M.; Lerdlum, S.; Suttichom, D.; Suwanwela, N.C.; Jagodzinski, L.; Michael, N.; Spudich, S.; et al. Central nervous system viral invasion and inflammation during acute HIV infection. J. Infect. Dis. 2012, 206, 275–282. [Google Scholar] [CrossRef]
  9. Airoldi, M.; Bandera, A.; Trabattoni, D.; Tagliabue, B.; Arosio, B.; Soria, A.; Rainone, V.; Lapadula, G.; Annoni, G.; Clerici, M.; et al. Neurocognitive impairment in HIV-infected naive patients with advanced disease: The role of virus and intrathecal immune activation. Clin. Dev. Immunol. 2012, 2012, 467154. [Google Scholar] [CrossRef]
  10. Grant, I. Neurocognitive and neuropsychiatric complications of HIV infection. In Handbook of Clinical Neurology; Elsevier: Amsterdam, The Netherlands, 2008; pp. 281–300. [Google Scholar]
  11. Bing, E.G.; Burnam, M.A.; Longshore, D.; Fleishman, J.A.; Sherbourne, C.D.; London, A.S.; Turner, B.J.; Eggan, F.; Beckman, R.; Vitiello, B.; et al. Psychiatric disorders and drug use among human immunodeficiency virus-infected adults in the United States. Arch. Gen. Psychiatry 2001, 58, 721–728. [Google Scholar] [CrossRef]
  12. Simioni, S.; Cavassini, M.; Annoni, J.-M.; Abraham, A.R.; Bourquin, I.; Schiffer, V.; Calmy, A.; Chave, J.-P.; Giacobini, E.; Hirschel, B.; et al. Cognitive dysfunction in HIV patients despite long-standing suppression of viremia. AIDS 2010, 24, 1243–1250. [Google Scholar] [CrossRef] [PubMed]
  13. Heaton, R.K.; Franklin, D.R.; Ellis, R.J.; McCutchan, J.A.; Letendre, S.L.; Leblanc, S.; Corkran, S.H.; Duarte, N.A.; Clifford, D.B.; Woods, S.P.; et al. HIV-associated neurocognitive disorders before and during the era of combination antiretroviral therapy: Differences in rates, nature, and predictors. J. Neurovirol. 2011, 17, 3–16. [Google Scholar] [CrossRef] [PubMed]
  14. Chan, P.; Brew, B.J. HIV associated neurocognitive disorders in the modern antiviral treatment era: Prevalence, characteristics, biomarkers, and effects of treatment. Curr. HIV/AIDS Rep. 2014, 11, 317–324. [Google Scholar] [CrossRef] [PubMed]
  15. Ciccarelli, N.; Fabbiani, M.; Colafigli, M.; Trecarichi, E.M.; Silveri, M.C.; Cauda, R.; Murri, R.; De Luca, A.; Di Giambenedetto, S. Revised central nervous system neuro penetration-effectiveness score is associated with cognitive disorders in HIV-infected patients with controlled plasma viremia. Antivir. Ther. 2013, 18, 153–160. [Google Scholar] [CrossRef]
  16. McArthur, J.C. HIV dementia: An evolving disease. J. Neuroimmunol. 2004, 157, 3–10. [Google Scholar] [CrossRef]
  17. Rezaei, S.; Ahmadi, S.; Rahmati, J.; Hosseinifard, H.; Dehnad, A.; Aryankhesal, A.; Shabaninejad, H.; Ghasemyani, S.; Alihosseini, S.; Bragazzi, N.L.; et al. Global prevalence of depression in HIV/AIDS: A systematic review and meta-analysis. BMJ Support. Palliat. Care 2019, 9, 404–412. [Google Scholar] [CrossRef]
  18. Desta, F.; Tasew, A.; Tekalegn, Y.; Zenbaba, D.; Sahiledengle, B.; Assefa, T.; Negash, W.; Tahir, A.; Regasa, T.; Mamo, A.; et al. Prevalence of depression and associated factors among people living with HIV/AIDS in public hospitals of Southeast Ethiopia. BMC Psychiatry 2022, 22, 557. [Google Scholar] [CrossRef]
  19. Mohammed, M.; Mengistie, B.; Dessie, Y.; Godana, W. Prevalence of depression and associated factors among HIV patients seeking treatments in art clinics at Harar town, eastern Ethiopia. J. AIDS Clin. Res. 2015, 6, 1–6. [Google Scholar]
  20. Diminić-Lisica, I.; Francisković, T.; Janović, S.; Popović, B.; Klarić, M.; Nemcić-Moro, I. Comorbid chronic diseases in depressed and non-depressed patients in family practice. Psychiatr. Danub 2010, 22, 236–240. [Google Scholar]
  21. Brucki, S.M.; Nitrini, R.; Caramelli, P.; Bertolucci, P.H.; Okamoto, I.H. Sugestões para o uso do mini-exame do estado mental no Brasil [Suggestions for utilization of the mini-mental state examination in Brazil]. Arq. Neuropsiquiatr. 2003, 61, 777–781. [Google Scholar] [CrossRef]
  22. Savard, J.; Laberge, B.; Gauthier, J.G.; Bergeron, M.G. Screening Clinical Depression in HIV-Seropositive Patients Using the Hospital Anxiety and Depression Scale. AIDS Behav. 1999, 3, 167–175. [Google Scholar] [CrossRef]
  23. Shan, L.; Siliciano, R.F. From reactivation of latent HIV-1 to elimination of the latent reservoir: The presence of multiple barriers to viral eradication. Bioessays 2013, 35, 544–552. [Google Scholar] [CrossRef] [PubMed]
  24. Magaki, S.D.; Vinters, H.V.; Williams, C.K.; Mareninov, S.; Khanlou, N.; Said, J.; Nemanim, N.; Gonzalez, J.; Morales, J.G.; Singer, E.J.; et al. Neuropathologic findings in elderly HIV-positive individuals. J. Neuropathol. Exp. Neurol. 2022, 81, 565–576. [Google Scholar] [CrossRef] [PubMed]
  25. Allen, J.; Damasio, H.; Grabowski, T. Normal neuroanatomical variation in the human brain: An MRI-volumetric study. Am. J. Phys. Anthropol. 2002, 118, 341–358. [Google Scholar] [CrossRef]
  26. Available online: https://www.batut.org.rs/index.php?content=2918 (accessed on 26 February 2025).
  27. Erickson, K.I.; Colcombe, S.J.; Raz, N.; Korol, D.L.; Scalf, P.; Webb, A.; Cohen, N.J.; McAuley, E.; Kramer, A.F. Selective sparing of brain tissue in postmenopausal women receiving hormone replacement therapy. Neurobiol. Aging 2005, 26, 1205–1213. [Google Scholar] [CrossRef]
  28. Manjón, J.V.; Coupé, P. volBrain: An Online MRI Brain Volumetry System. Front. Neuroinformatics 2016, 10, 30. [Google Scholar] [CrossRef]
  29. Boban, J.; Thurnher, M.M.; Boban, N.; Law, M.; Jahanshad, N.; Nir, T.M.; Lendak, D.F.; Kozic, D. Gradient Patterns of Age-Related Diffusivity Changes in Cerebral White Matter. Front. Neurol. 2022, 13, 870909. [Google Scholar] [CrossRef]
  30. Baxter, M.G.; Chiba, A.A. Cognitive functions of the basal forebrain. Curr. Opin. Neurobiol. 1999, 9, 178–183. [Google Scholar] [CrossRef]
  31. Gollan, J.K.; Dong, H.; Bruno, D.; Nierenberg, J.; Nobrega, J.N.; Grothe, M.J.; Pollock, B.G.; Marmar, C.R.; Teipel, S.; Csernansky, J.G.; et al. Basal forebrain mediated increase in brain CRF is associated with increased cholinergic tone and depression. Psychiatry Res. Neuroimaging 2017, 264, 76–81. [Google Scholar] [CrossRef]
  32. Jumah, F.R.; Dossani, R.H. Neuroanatomy, Cingulate Cortex; Updated 6 December 2022; StatPearls Publishing: Treasure Island, FL, USA, 2025. Available online: https://www.ncbi.nlm.nih.gov/books/NBK537077 (accessed on 26 February 2025).
  33. Castrén, E.; Kojima, M. Brain-derived neurotrophic factor in mood disorders and antidepressant treatments. Neurobiol. Dis. 2017, 97, 119–126. [Google Scholar] [CrossRef]
  34. Lima, V.D.; Geller, J.; Bangsberg, D.R.; Patterson, T.L.; Daniel, M.; Kerr, T.; Montaner, J.S.; Hogg, R.S. The effect of adherence on the association between depressive symptoms and mortality among HIV-infected individuals first initiating HAART. AIDS 2007, 21, 1175–1183. [Google Scholar] [CrossRef] [PubMed]
  35. Arnone, D.; Job, D.; Selvaraj, S.; Abe, O.; Amico, F.; Cheng, Y.; Colloby, S.J.; O’Brien, J.T.; Frodl, T.; Gotlib, I.H.; et al. Computational meta-analysis of statistical parametric maps in major depression. Hum. Brain Mapp. 2016, 37, 1393–1404. [Google Scholar] [CrossRef]
  36. Schermuly, I.; Wolf, D.; Lieb, K.; Stoeter, P.; Fellgiebel, A. State-dependent posterior hippocampal volume increases in patients with major depressive disorder. J. Affect. Disord. 2011, 135, 405–409. [Google Scholar] [CrossRef] [PubMed]
  37. Bronshteyn, M.; Yang, F.N.; Shattuck, K.F.; Dawson, M.; Kumar, P.; Moore, D.J.; Ellis, R.J.; Jiang, X. Depression is associated with hippocampal volume loss in adults with HIV. Hum. Brain Mapp. 2021, 42, 3750–3759. [Google Scholar] [CrossRef] [PubMed]
  38. Peric, R.; Romčević, I.; Mastilović, M.; Starčević, I.; Boban, J. Age-related volume decrease in subcortical gray matter is a part of healthy brain aging in men. Ir. J. Med. Sci. 2024, 194, 339–345, Erratum in Ir. J. Med. Sci. 2025, 194, 339–345. [Google Scholar] [CrossRef] [PubMed]
  39. Convery, R.S.; Neason, M.R.; Cash, D.M.; Cardoso, M.J.; Modat, M.; Ourselin, S.; Warren, J.D.; Rohrer, J.D.; Bocchetta, M. Basal forebrain atrophy in frontotemporal dementia. Neuroimage Clin. 2020, 26, 102210. [Google Scholar] [CrossRef]
  40. Kilimann, I.; Grothe, M.; Heinsen, H.; Alho, E.J.; Grinberg, L.; Amaro, E., Jr.; Dos Santos, G.A.; da Silva, R.E.; Mitchell, A.J.; Frisoni, G.B.; et al. Subregional basal forebrain atrophy in Alzheimer’s disease: A multicenter study. J. Alzheimers Dis. 2014, 40, 687–700. [Google Scholar] [CrossRef]
  41. Grothe, M.J.; Heinsen, H.; Amaro, E., Jr.; Grinberg, L.T.; Teipel, S.J. Cognitive Correlates of Basal Forebrain Atrophy and Associated Cortical Hypometabolism in Mild Cognitive Impairment. Cereb. Cortex. 2016, 26, 2411–2426. [Google Scholar] [CrossRef]
  42. Bush, G.; Luu, P.; Posner, M.I. Cognitive and emotional influences in anterior cingulate cortex. Trends Cogn. Sci. 2000, 4, 215–222. [Google Scholar] [CrossRef]
  43. Mesulam, M.M. The cholinergic innervation of the human cerebral cortex. Prog. Brain Res. 2004, 145, 67–78. [Google Scholar] [CrossRef]
  44. Davidson, R.J. Toward a biology of personality and emotion. Ann. N. Y. Acad. Sci. 2002, 935, 191–207. [Google Scholar] [CrossRef] [PubMed]
  45. Kallianpur, K.J.; Jahanshad, N.; Sailasuta, N.; Benjapornpong, K.; Chan, P.; Pothisri, M.; Dumrongpisutikul, N.; Laws, E.; Ndhlovu, L.C.; Clifford, K.M.; et al. Regional brain volumetric changes despite 2 years of treatment initiated during acute HIV infection. AIDS 2020, 34, 415–426. [Google Scholar] [CrossRef] [PubMed]
  46. Shan, Y.; Sun, G.; Ji, J.; Li, Z.; Chen, X.; Zhang, X.; Ma, Y.; Zhang, Y.; Zhang, T.; Zhang, Y. Brain function abnormalities and neuroinflammation in people living with HIV-associated anxiety disorders. Front. Psychiatry 2024, 15, 1336233. [Google Scholar] [CrossRef] [PubMed]
  47. Philippi, C.L.; Reyna, L.; Nedderman, L.; Chan, P.; Samboju, V.; Chang, K.; Phanuphak, N.; Ratnaratorn, N.; Hellmuth, J.; Benjapornpong, K.; et al. Resting-state neural signatures of depressive symptoms in acute HIV. J. Neurovirol. 2020, 26, 226–240. [Google Scholar] [CrossRef]
  48. Anthony, I.C.; Bell, J.E. Neuropathological findings associated with long-term human immunodeficiency virus infection. Curr. Opin. Neurol. 2008, 21, 695–700. [Google Scholar]
Figure 1. Scatter plot showing the positive correlation between MMSE scores and total (a) and right (b) basal forebrain volume.
Medicina 61 00632 g001
Figure 2. Scatter plot showing the positive correlation between MMSE scores and total anterior cingulate gyrus volumes.
Medicina 61 00632 g002
Figure 3. Scatter plot showing the positive correlation between MMSE scores and right anterior cingulate gyrus volumes.
Medicina 61 00632 g003
Figure 4. Scatter plot showing the positive correlation between MMSE scores and left anterior cingulate gyrus volumes.
Medicina 61 00632 g004
Figure 5. Scatter plot showing the positive correlation between MMSE scores and left middle cingulate gyrus volume.
Medicina 61 00632 g005
Figure 6. Scatter plot showing the negative correlation between depression scores and right basal forebrain volume.
Medicina 61 00632 g006
Table 1. Study population summary.
CharacteristicsNumber of ParticipantsSexAge (Years)MMSE ScoreEducation Level (Years)BDI ScorecART
Mean ± SD48Males39.26 ± 10.6628.10 ± 1.4312.54 ± 2.709.24 ± 6.78All participants
Table 2. Correlation between MMSE scores and brain structure volumes.
StructuresMMSE
Accumbens totalPearson correlation coefficient (r)0.090
P0.566
N48
Accumbens rightPearson correlation coefficient (r)0.014
P0.928
N48
Accumbens leftPearson correlation coefficient (r)0.165
P0.289
N48
Corpus amygdaloideum totalPearson correlation coefficient (r)0.119
P0.443
N48
Corpus amygdaloideum rightPearson correlation coefficient (r)0.060
P0.703
N48
Corpus amygdaloideum leftPearson correlation coefficient (r)0.175
P0.262
N48
Basal forebrainPearson correlation coefficient (r)0.304
P0.047
N48
Basal forebrain rightPearson correlation coefficient (r)0.326
P0.033
N48
Basal forebrain leftPearson correlation coefficient (r)0.214
P0.169
N48
Nucleus caudatus totalPearson correlation coefficient (r)0.186
P0.233
N48
Nucleus caudatus rightPearson correlation coefficient (r)0.230
P0.138
N48
Nucleus caudatus leftPearson correlation coefficient (r)0.142
P0.365
N48
Hippocampus totalPearson correlation coefficient (r)0.173
P0.266
N48
Hippocampus rightPearson correlation coefficient (r)0.138
P0.379
N48
Hippocampus leftPearson correlation coefficient (r)0.202
P0.194
N48
Globus pallidus totalPearson correlation coefficient (r)0.023
P0.883
N48
Globus pallidus rightPearson correlation coefficient (r)0.015
P0.923
N48
Globus pallidus leftPearson correlation coefficient (r)0.027
P0.864
N48
Putamen totalPearson correlation coefficient (r)0.227
P0.144
N48
Putamen rightPearson correlation coefficient (r)0.200
P0.199
N48
Putamen leftPearson correlation coefficient (r)0.251
P0.104
N48
Thalamus totalPearson correlation coefficient (r)0.198
P0.209
N42
Thalamus rightPearson correlation coefficient (r)0.193
P0.215
N48
Thalamus leftPearson correlation coefficient (r)0.203
P0.191
N48
Ventral diencephalon totalPearson correlation coefficient (r)0.174
P0.265
N48
Ventral diencephalon rightPearson correlation coefficient (r)0.179
P0.251
N48
Ventral diencephalon leftPearson correlation coefficient (r)0.155
P0.322
N48
Anterior cingulate gyrus totalPearson correlation coefficient (r)0.359
P0.018
N48
Anterior cingulate gyrus rightPearson correlation coefficient (r)0.323
P0.035
N48
Anterior cingulate gyrus leftPearson correlation coefficient (r)0.361
P0.017
N48
Middle cingulate gyrus totalPearson correlation coefficient (r)0.287
P0.063
N48
Middle cingulate gyrus rightPearson correlation coefficient (r)0.206
P0.184
N48
Middle cingulate gyrus leftPearson correlation coefficient (r)0.301
P0.050
N48
Posterior cingulate gyrus totalPearson correlation coefficient (r)0.264
P0.087
N48
Posterior cingulate gyrus rightPearson correlation coefficient (r)0.218
P0.159
N48
Posterior cingulate gyrus leftPearson correlation coefficient (r)0.275
P0.075
N48
Table 3. Correlation between depression scores and brain structure volumes.
StructuresBDI Depression Scale
Nucleus accumbens totalPearson correlation coefficient (r)0.019
P0.915
N35
Nucleus accumbens rightPearson correlation coefficient (r)−0.028
P0.875
N35
Nucleus accumbens leftPearson correlation coefficient (r)0.064
P0.714
N35
Corpus amygdaloideum totalPearson correlation coefficient (r)−0.020
P0.909
N35
Corpus amygdaloideum rightPearson correlation coefficient (r)0.039
P0.824
N35
Corpus amygdaloideum leftPearson correlation coefficient (r)−0.093
P0.596
N35
Basal forebrain totalPearson correlation coefficient (r)−0.323
P0.059
N35
Basal forebrain rightPearson correlation coefficient (r)−0.379
P0.025
N35
Basal forebrain leftPearson correlation coefficient (r)−0.204
P0.241
N35
Nucleus caudatus totalPearson correlation coefficient (r)0.042
P0.809
N35
Nucleus caudatus rightPearson correlation coefficient (r)0.037
P0.833
N35
Nucleus caudatus leftPearson correlation coefficient (r)0.047
P0.790
N35
Hippocampus totalPearson correlation coefficient (r)−0.213
P0.219
N35
Hippocampus rightPearson correlation coefficient (r)−0.182
P0.294
N35
Hippocampus leftPearson correlation coefficient (r)−0.245
P0.156
N35
Globus pallidus totalPearson correlation coefficient (r)0.037
P0.833
N35
Globus pallidus rightPearson correlation coefficient (r)0.018
P0.917
N35
Globus pallidus leftPearson correlation coefficient (r)0.048
P0.783
N35
Putamen totalPearson correlation coefficient (r)−0.122
P0.487
N35
Putamen rightPearson correlation coefficient (r)−0.113
P0.516
N35
Putamen leftPearson correlation coefficient (r)−0.126
P0.471
N35
Thalamus totalPearson correlation coefficient (r)0.012
P0.947
N35
Thalamus rightPearson correlation coefficient (r)0.023
P0.897
N35
Thalamus leftPearson correlation coefficient (r)−0.003
P0.985
N35
Ventral DC totalPearson correlation coefficient (r)−0.085
P0.626
N35
Ventral DC rightPearson correlation coefficient (r)−0.064
P0.713
N35
Ventral DC leftPearson correlation coefficient (r)−0.111
P0.526
N35
Anterior cingulate gyrus totalPearson correlation coefficient (r)0.003
P0.985
N35
Anterior cingulate gyrus rightPearson correlation coefficient (r)−0.080
P0.648
N35
Anterior cingulate gyrus leftPearson correlation coefficient (r)0.106
P0.548
N35
Middle cingulate gyrustotalPearson correlation coefficient (r)−0.024
P0.889
N35
Middle cingulate gyrus rightPearson correlation coefficient (r)−0.013
P0.941
N35
Middle cingulate gyrus leftPearson correlation coefficient (r)−0.030
P0.864
N35
Posterior cingulate gyrustotalPearson correlation coefficient (r)0.075
P0.669
N35
Posterior cingulate gyrus rightPearson correlation coefficient (r)0.087
P0.620
N35
Posterior cingulate gyrus leftPearson correlation coefficient (r)0.046
P0.794
N35
Disclaimer/Publisher’s Note: The statements, opinions and data contained in all publications are solely those of the individual author(s) and contributor(s) and not of MDPI and/or the editor(s). MDPI and/or the editor(s) disclaim responsibility for any injury to people or property resulting from any ideas, methods, instructions or products referred to in the content.

