
Evaluating Right Ventricular Function Using Longitudinal Displacement
Abstract
1. Introduction
2. Materials and Methods
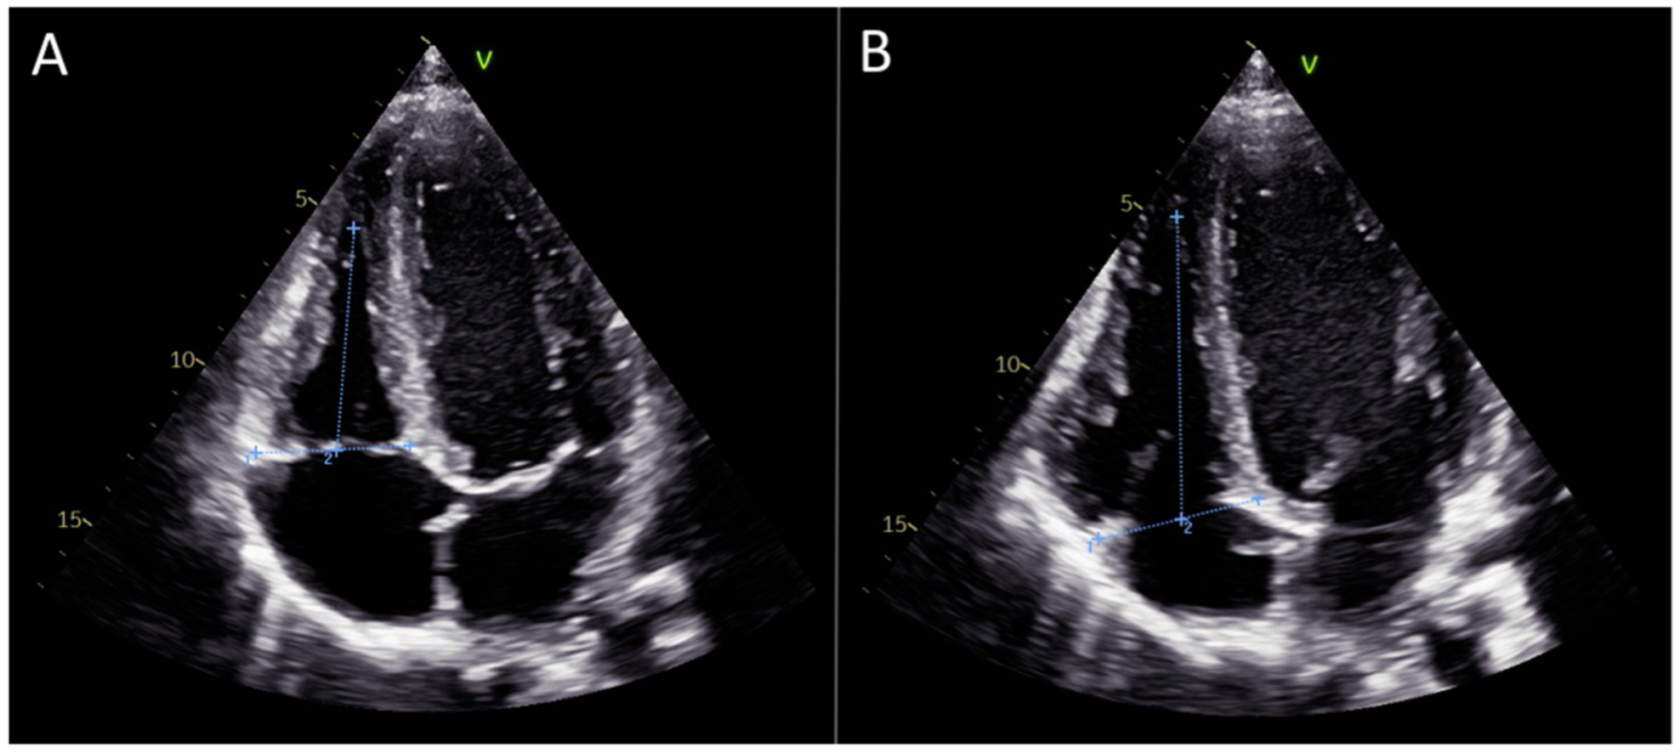
2.1. Echocardiographic Assessment
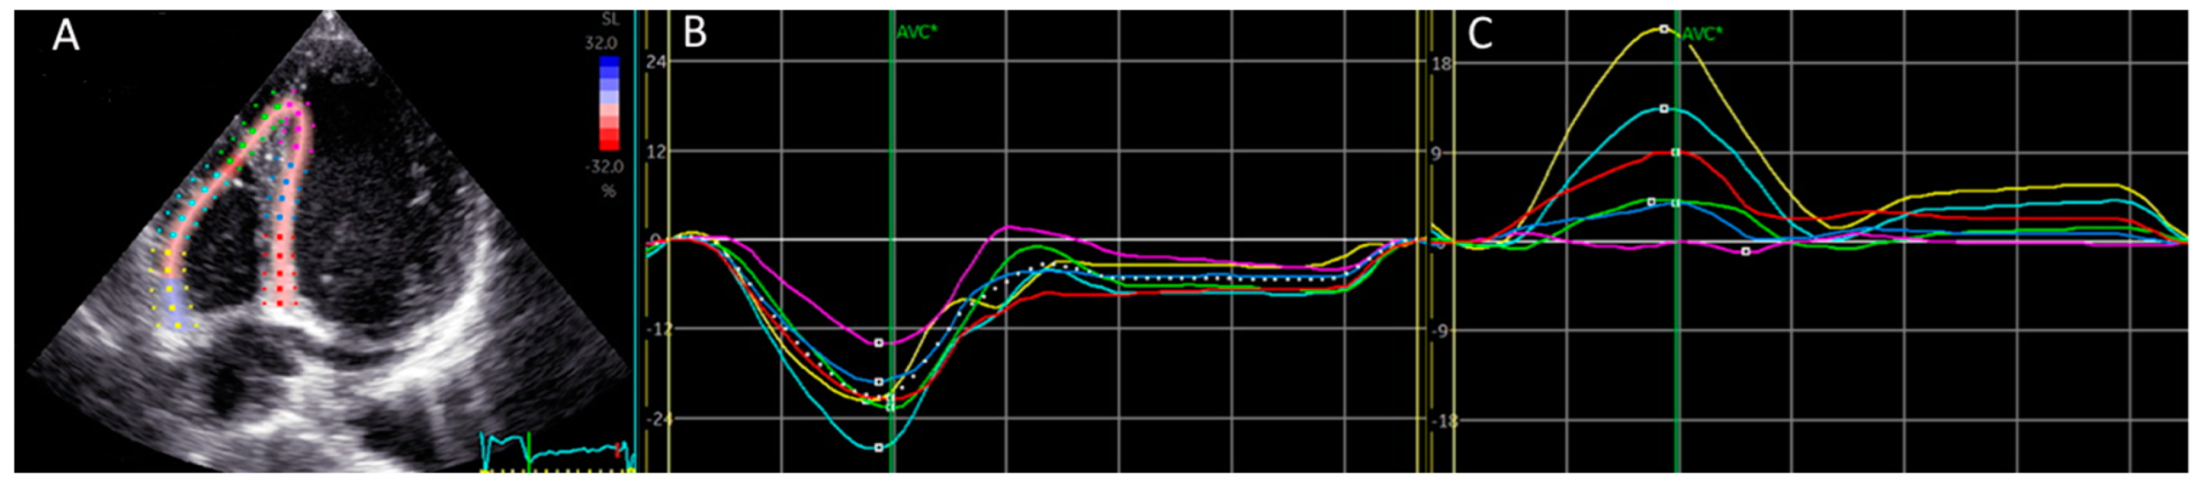
2.2. Specification Regarding Longitudinal Deformation Parameters of the Right Ventricle: Strain and Displacement, Figure 1
2.3. Manual Calculation of Global Right Ventricular Strain
2.4. Statistical Methods
2.5. Ethical Approval
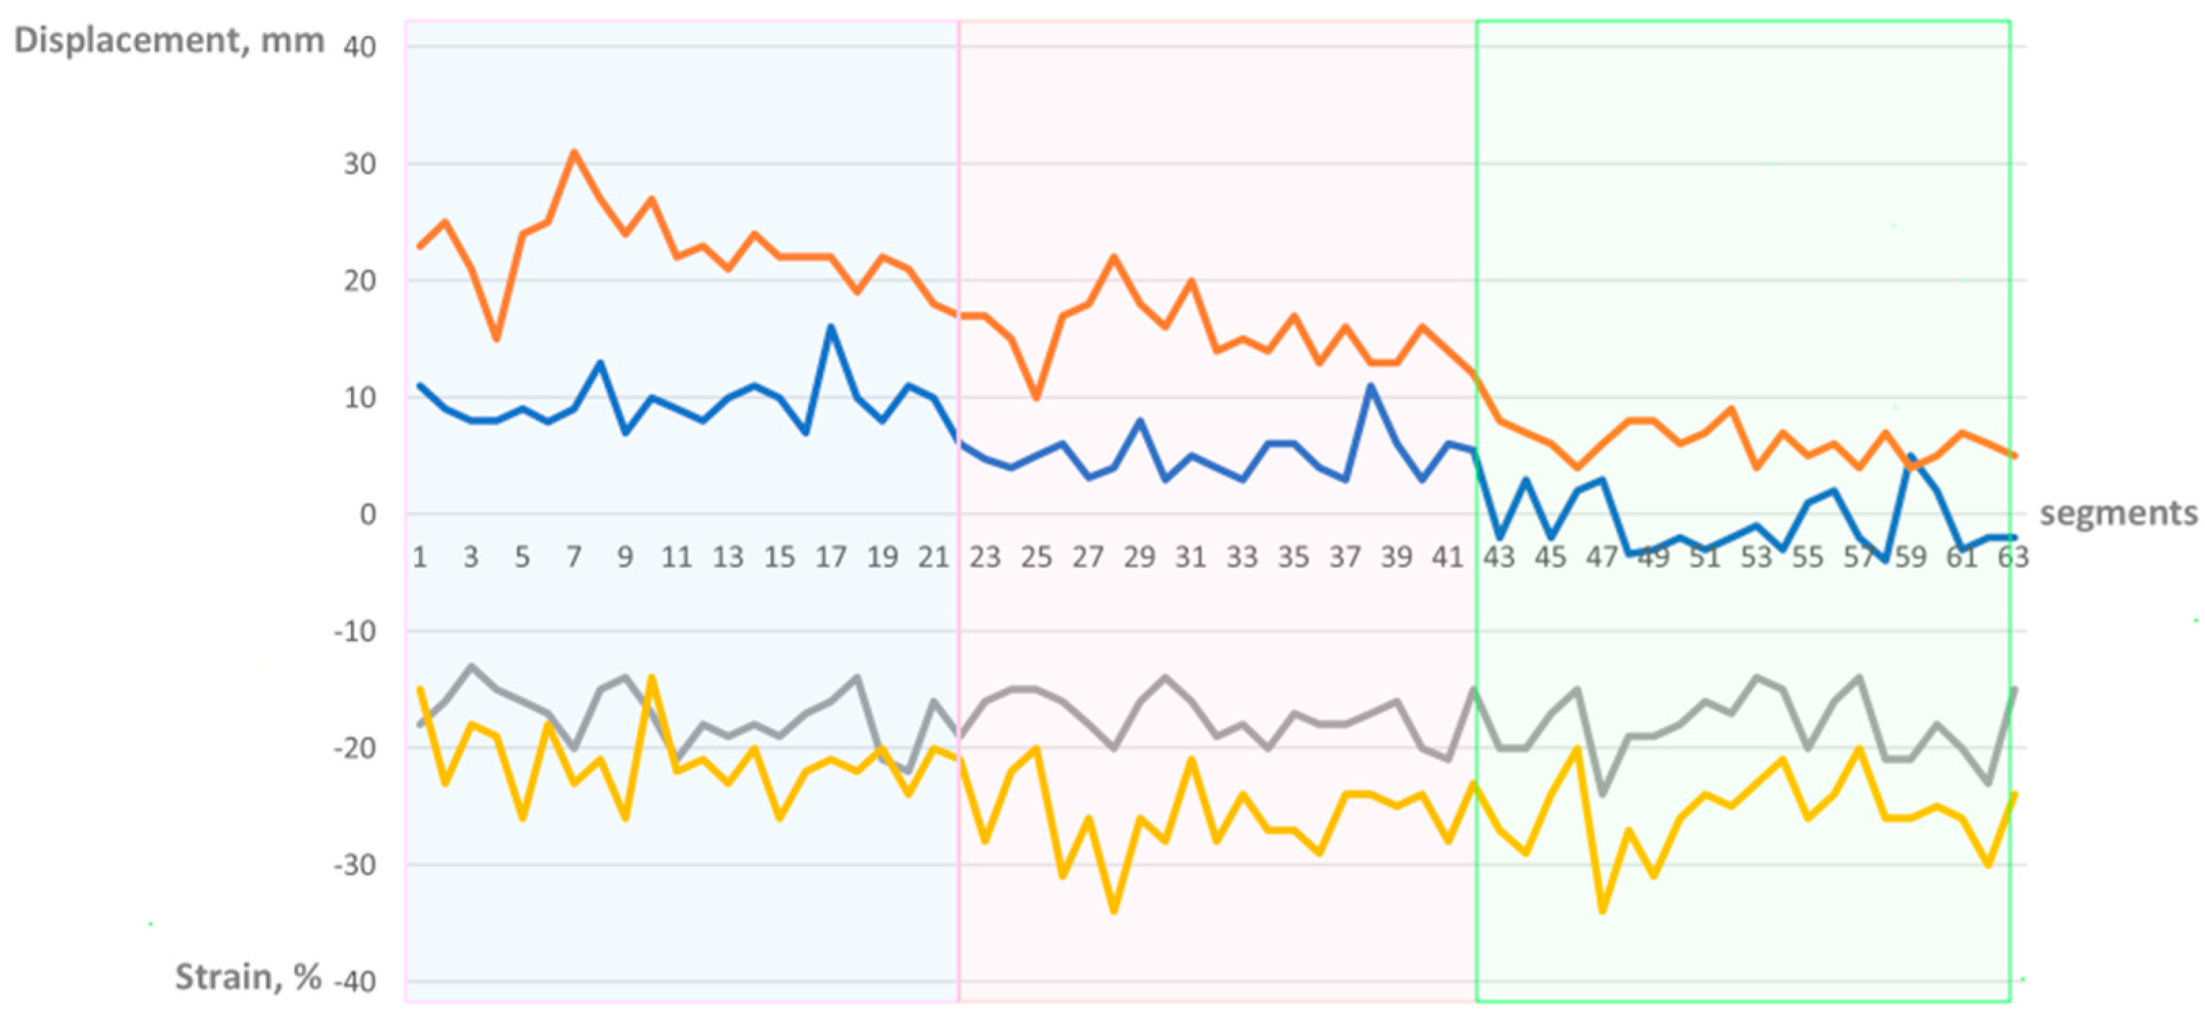
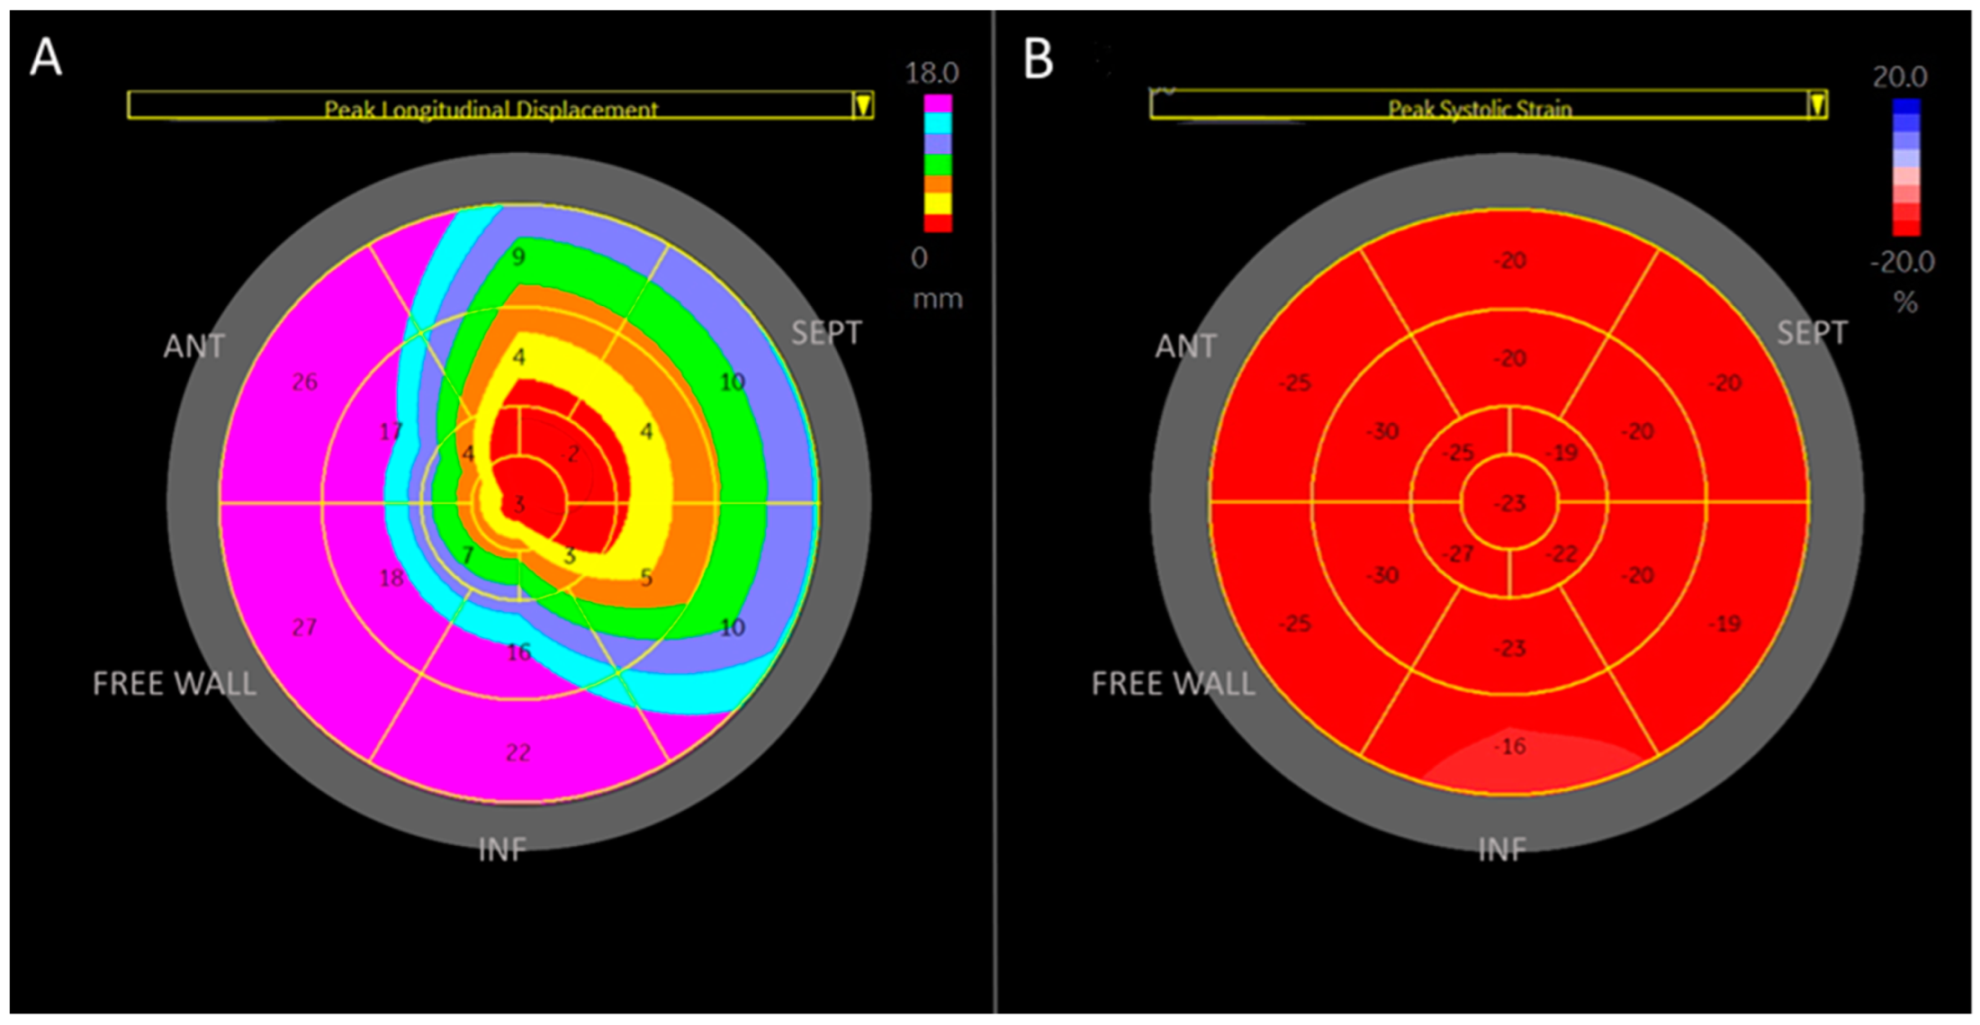
3. Results
4. Discussion
Limitations
5. Conclusions
Author Contributions
Funding
Institutional Review Board Statement
Informed Consent Statement
Data Availability Statement
Conflicts of Interest
References
- Rudski, L.G.; Lai, W.W.; Afilalo, J.; Hua, L.; Handschumacher, M.D.; Chandrasekaran, K.; Solomon, S.D.; Louie, E.K.; Schiller, N.B. Guidelines for the echocardiographic assessment of the right heart in adults: A report from the American Society of Echocardiography endorsed by the European Association of Echocardiography, a registered branch of the European Society of Cardiology, and the Canadian Society of Echocardiography. J. Am. Soc. Echocardiogr. 2010, 23, 685–713, quiz 786–788. [Google Scholar] [CrossRef] [PubMed]
- Karas, M.G.; Kizer, J.R. Echocardiographic assessment of the right ventricle and associated hemodynamics. Prog. Cardiovasc. Dis. 2012, 55, 144–160. [Google Scholar] [CrossRef] [PubMed]
- Sanz, J.; Sánchez-Quintana, D.; Bossone, E.; Bogaard, H.J.; Naeije, R. Anatomy, Function, and Dysfunction of the Right Ventricle: JACC State-of-the-Art Review. J. Am. Coll. Cardiol. 2019, 73, 1463–1482. [Google Scholar] [CrossRef]
- Naeije, R.; Badagliacca, R. The overloaded right heart and ventricular interdependence. Cardiovasc. Res. 2017, 113, 1474–1485. [Google Scholar] [CrossRef] [PubMed]
- Ashley, L.M. A determination of the diameters of ventricular myocardial fibers in man and other mammals. Am. J. Anat. 1945, 77, 325–363. [Google Scholar] [CrossRef] [PubMed]
- Kawel-Boehm, N.; Maceira, A.; Valsangiacomo-Buechel, E.R.; Vogel-Claussen, J.; Turkbey, E.B.; Williams, R.; Plein, S.; Tee, M.; Eng, J.; Bluemke, D.A. Normal values for cardiovascular magnetic resonance in adults and children. J. Cardiovasc. Magn. Reson. 2015, 17, 29. [Google Scholar] [CrossRef] [PubMed] [PubMed Central]
- Dell’Italia, L.J. The right ventricle: Anatomy, physiology, and clinical importance. Curr. Probl. Cardiol. 1991, 16, 653–720. [Google Scholar] [CrossRef] [PubMed]
- Zong, P.; Tune, J.D.; Downey, H.F. Mechanisms of oxygen demand/supply balance in the right ventricle. Exp. Biol. Med. 2005, 230, 507–519. [Google Scholar] [CrossRef] [PubMed]
- Hayek, S.; Sims, D.B.; Markham, D.W.; Butler, J.; Kalogeropoulos, A.P. Assessment of right ventricular function in left ventricular assist device candidates. Circ. Cardiovasc. Imaging 2014, 7, 379–389. [Google Scholar] [CrossRef]
- Medvedofsky, D.; Addetia, K.; Patel, A.R.; Sedlmeier, A.; Baumann, R.; Mor-Avi, V.; Lang, R.M. Novel Approach to Three-Dimensional Echocardiographic Quantification of Right Ventricular Volumes and Function from Focused Views. J. Am. Soc. Echocardiogr. 2015, 28, 1222–1231. [Google Scholar] [CrossRef]
- Wu, V.C.; Takeuchi, M. Echocardiographic assessment of right ventricular systolic function. Cardiovasc. Diagn. Ther. 2018, 8, 70–79. [Google Scholar] [CrossRef]
- Lahm, T.; Douglas, I.S.; Archer, S.L.; Bogaard, H.J.; Chesler, N.C.; Haddad, F.; Hemnes, A.R.; Kawut, S.M.; Kline, J.A.; Kolb, T.M.; et al. Assessment of Right Ventricular Function in the Research Setting: Knowledge Gaps and Pathways Forward. An Official American Thoracic Society Research Statement. Am. J. Respir. Crit. Care Med. 2018, 198, e15–e43. [Google Scholar] [CrossRef] [PubMed]
- Badano, L.P.; Kolias, T.J.; Muraru, D.; Abraham, T.P.; Aurigemma, G.; Edvardsen, T.; D’Hooge, J.; Donal, E.; Fraser, A.G.; Marwick, T.; et al. Standardization of left atrial, right ventricular, and right atrial deformation imaging using two-dimensional speckle tracking echocardiography: A consensus document of the EACVI/ASE/industry task force to standardize deformation imaging. Eur. Heart J. Cardiovasc. Imaging 2018, 19, 591–600. [Google Scholar] [CrossRef] [PubMed]
- Nonaka, H.; Rätsep, I.; Obonyo, N.G.; Suen, J.Y.; Fraser, J.F.; Chan, J. Current trends and latest developments in echocardiographic assessment of right ventricular function: Load dependency perspective. Front. Cardiovasc. Med. 2024, 11, 1365798. [Google Scholar] [CrossRef]
- Levy, P.T.; Sanchez Mejia, A.A.; Machefsky, A.; Fowler, S.; Holland, M.R.; Singh, G.K. Normal ranges of right ventricular systolic and diastolic strain measures in children: A systematic review and meta-analysis. J. Am. Soc. Echocardiogr. 2014, 27, 549–560.e3. [Google Scholar] [CrossRef] [PubMed]
- Lang, R.M.; Badano, L.P.; Mor-Avi, V.; Afilalo, J.; Armstrong, A.; Ernande, L.; Flachskampf, F.A.; Foster, E.; Goldstein, S.A.; Kuznetsova, T.; et al. Recommendations for cardiac chamber quantification by echocardiography in adults: An update from the American Society of Echocardiography and the European Association of Cardiovascular Imaging. Eur. Heart J. Cardiovasc. Imaging 2015, 16, 233–270. [Google Scholar] [CrossRef]
- Nagueh, S.F.; Smiseth, O.A.; Appleton, C.P.; Byrd, B.F., 3rd; Dokainish, H.; Edvardsen, T.; Flachskampf, F.A.; Gillebert, T.C.; Klein, A.L.; Lancellotti, P.; et al. Recommendations for the Evaluation of Left Ventricular Diastolic Function by Echocardiography: An Update from the American Society of Echocardiography and the European Association of Cardiovascular Imaging. Eur. Heart J. Cardiovasc. Imaging 2016, 17, 1321–1360. [Google Scholar] [CrossRef]
- Badano, L.P.; Muraru, D.; Parati, G.; Haugaa, K.; Voigt, J.-U. How to do right ventricular strain. Eur. Heart J.-Cardiovasc. Imaging 2020, 21, 825–827. [Google Scholar] [CrossRef]
- Leitman, M.; Lysyansky, P.; Sidenko, S.; Shir, V.; Peleg, E.; Binenbaum, M.; Kaluski, E.; Krakover, R.; Vered, Z. Two-dimensional strain-a novel software for real-time quantitative echocardiographic assessment of myocardial function. J. Am. Soc. Echocardiogr. 2004, 17, 1021–1029. [Google Scholar] [CrossRef]
- Leitman, M.; Lysiansky, M.; Lysyansky, P.; Friedman, Z.; Tyomkin, V.; Fuchs, T.; Adam, D.; Krakover, R.; Vered, Z. Circumferential and longitudinal strain in 3 myocardial layers in normal subjects and in patients with regional left ventricular dysfunction. J. Am. Soc. Echocardiogr. 2010, 23, 64–70. [Google Scholar] [CrossRef]
- Muraru, D.; Haugaa, K.; Donal, E.; Stankovic, I.; Voigt, J.U.; Petersen, S.E.; Popescu, B.A.; Marwick, T. Right ventricular longitudinal strain in the clinical routine: A state-of-the-art review. Eur. Heart J. Cardiovasc. Imaging 2022, 23, 898–912. [Google Scholar] [CrossRef] [PubMed]
- Fine, N.M.; Shah, A.A.; Han, I.Y.; Yu, Y.; Hsiao, J.F.; Koshino, Y.; Saleh, H.K.; Miller, F.A., Jr.; Oh, J.K.; Pellikka, P.A.; et al. Left and right ventricular strain and strain rate measurement in normal adults using velocity vector imaging: An assessment of reference values and intersystem agreement. Int. J. Cardiovasc. Imaging 2013, 29, 571–580. [Google Scholar] [CrossRef] [PubMed]
- Meris, A.; Faletra, F.; Conca, C.; Klersy, C.; Regoli, F.; Klimusina, J.; Penco, M.; Pasotti, E.; Pedrazzini, G.B.; Moccetti, T.; et al. Timing and magnitude of regional right ventricular function: A speckle tracking-derived strain study of normal subjects and patients with right ventricular dysfunction. J. Am. Soc. Echocardiogr. 2010, 23, 823–831. [Google Scholar] [CrossRef]
- Sanz-de la Garza, M.; Giraldeau, G.; Marin, J.; Imre Sarvari, S.; Guasch, E.; Gabrielli, L.; Brambila, C.; Bijnens, B.; Sitges, M. Should the septum be included in the assessment of right ventricular longitudinal strain? An ultrasound two-dimensional speckle-tracking stress study. Int. J. Cardiovasc. Imaging 2019, 35, 1853–1860. [Google Scholar] [CrossRef]
- Chia, E.M.; Hsieh, C.H.; Boyd, A.; Pham, P.; Vidaic, J.; Leung, D.; Thomas, L. Effects of age and gender on right ventricular systolic and diastolic function using two-dimensional speckle-tracking strain. J. Am. Soc. Echocardiogr. 2014, 27, 1079–1086.e1. [Google Scholar] [CrossRef]
- Muraru, D.; Onciul, S.; Peluso, D.; Soriani, N.; Cucchini, U.; Aruta, P.; Romeo, G.; Cavalli, G.; Iliceto, S.; Badano, L.P. Sex- and Method-Specific Reference Values for Right Ventricular Strain by 2-Dimensional Speckle-Tracking Echocardiography. Circ. Cardiovasc. Imaging 2016, 9, e003866. [Google Scholar] [CrossRef] [PubMed]
- Andersen, H.R.; Falk, E.; Nielsen, D. Right ventricular infarction: Frequency, size and topography in coronary heart disease: A prospective study comprising 107 consecutive autopsies from a coronary care unit. J. Am. Coll. Cardiol. 1987, 10, 1223–1232. [Google Scholar] [CrossRef] [PubMed]
- Aquaro, G.D.; Negri, F.; De Luca, A.; Todiere, G.; Bianco, F.; Barison, A.; Camastra, G.; Monti, L.; Dellegrottaglie, S.; Moro, C.; et al. Role of right ventricular involvement in acute myocarditis, assessed by cardiac magnetic resonance. Int. J. Cardiol. 2018, 271, 359–365. [Google Scholar] [CrossRef] [PubMed]
- Leone, O.; Longhi, S.; Quarta, C.C.; Ragazzini, T.; De Giorgi, L.B.; Pasquale, F.; Potena, L.; Lovato, L.; Milandri, A.; Arpesella, G.; et al. New pathological insights into cardiac amyloidosis: Implications for non-invasive diagnosis. Amyloid 2012, 19, 99–105. [Google Scholar] [CrossRef] [PubMed]
- Garcia-Pavia, P.; Bengel, F.; Brito, D.; Damy, T.; Duca, F.; Dorbala, S.; Nativi-Nicolau, J.; Obici, L.; Rapezzi, C.; Sekijima, Y.; et al. Expert consensus on the monitoring of transthyretin amyloid cardiomyopathy. Eur. J. Heart Fail. 2021, 23, 895–905. [Google Scholar] [CrossRef] [PubMed] [PubMed Central]
- te Riele, A.S.; James, C.A.; Rastegar, N.; Bhonsale, A.; Murray, B.; Tichnell, C.; Judge, D.P.; Bluemke, D.A.; Zimmerman, S.L.; Kamel, I.R.; et al. Yield of serial evaluation in at-risk family members of patients with ARVD/C. J. Am. Coll. Cardiol. 2014, 64, 293–301. [Google Scholar] [CrossRef] [PubMed] [PubMed Central]
- Heidbüchel, H.; Hoogsteen, J.; Fagard, R.; Vanhees, L.; Ector, H.; Willems, R.; Van Lierde, J. High prevalence of right ventricular involvement in endurance athletes with ventricular arrhythmias. Role of an electrophysiologic study in risk stratification. Eur. Heart J. 2003, 24, 1473–1480. [Google Scholar] [CrossRef] [PubMed]
- Mascia, G.; Arbelo, E.; Porto, I.; Brugada, R.; Brugada, J. The arrhythmogenic right ventricular cardiomyopathy in comparison to the athletic heart. J. Cardiovasc. Electrophysiol. 2020, 31, 1836–1843. [Google Scholar] [CrossRef] [PubMed]
- Trivax, J.E.; McCullough, P.A. Phidippides cardiomyopathy: A review and case illustration. Clin. Cardiol. 2012, 35, 69–73. [Google Scholar] [CrossRef] [PubMed] [PubMed Central]

| Number | 21 |
| Age, years | 24.8 ± 5.0 |
| Height, cm | 182.7 ± 6.2 |
| Weight, kg | 76.5 ± 6.1 |
| BSA m2 | 1.98 ± 0.1 |
| LAVi, mL/m2 | 35.3 ± 8.2 |
| LVEDD, cm | 5.1 ± 0.4 |
| LVESD, cm | 3.2 ± 0.4 |
| IVS, cm | 0.9 ± 0.1 |
| PW, cm | 0.9 ± 0.1 |
| LVMi g/m2 | 85.8 ± 17.1 |
| EF, % | 58.8 ± 3.1 |
| E/A | 1.9 ± 0.5 |
| E dec, msec | 173.4 ± 48.2 |
| E/E’ ratio | 4.7 ± 0.6 |
| Variable | Displacement, mm | p-Value | p-Value | |
|---|---|---|---|---|
| Free wall basal | 22.8 ± 3.3 | NA | 21.2 ± 3.2 | NA |
| Free wall mid | 15.6 ± 2.7 | <10(−8) | 25.7 ± 3.4 | <10(−4) |
| Free wall apical | 6.1 ± 1.5 | <10(−16) | 25.6 ± 3.4 | 0.9 |
| Septal basal | 9.6 ± 2.0 | NA | 18.2 ± 2.8 | NA |
| Septal mid | 5.1 ± 1.9 | <10(−9) | 17.3 ± 1.9 | 0.27 |
| Septal apical | (−)0.8 ± 2.5 | <10(−9) | 17.2 ± 2.4 | 0.89 |
| Global value | 9.9 ± 1.3 | NA | 20.9 ± 2 | NA |
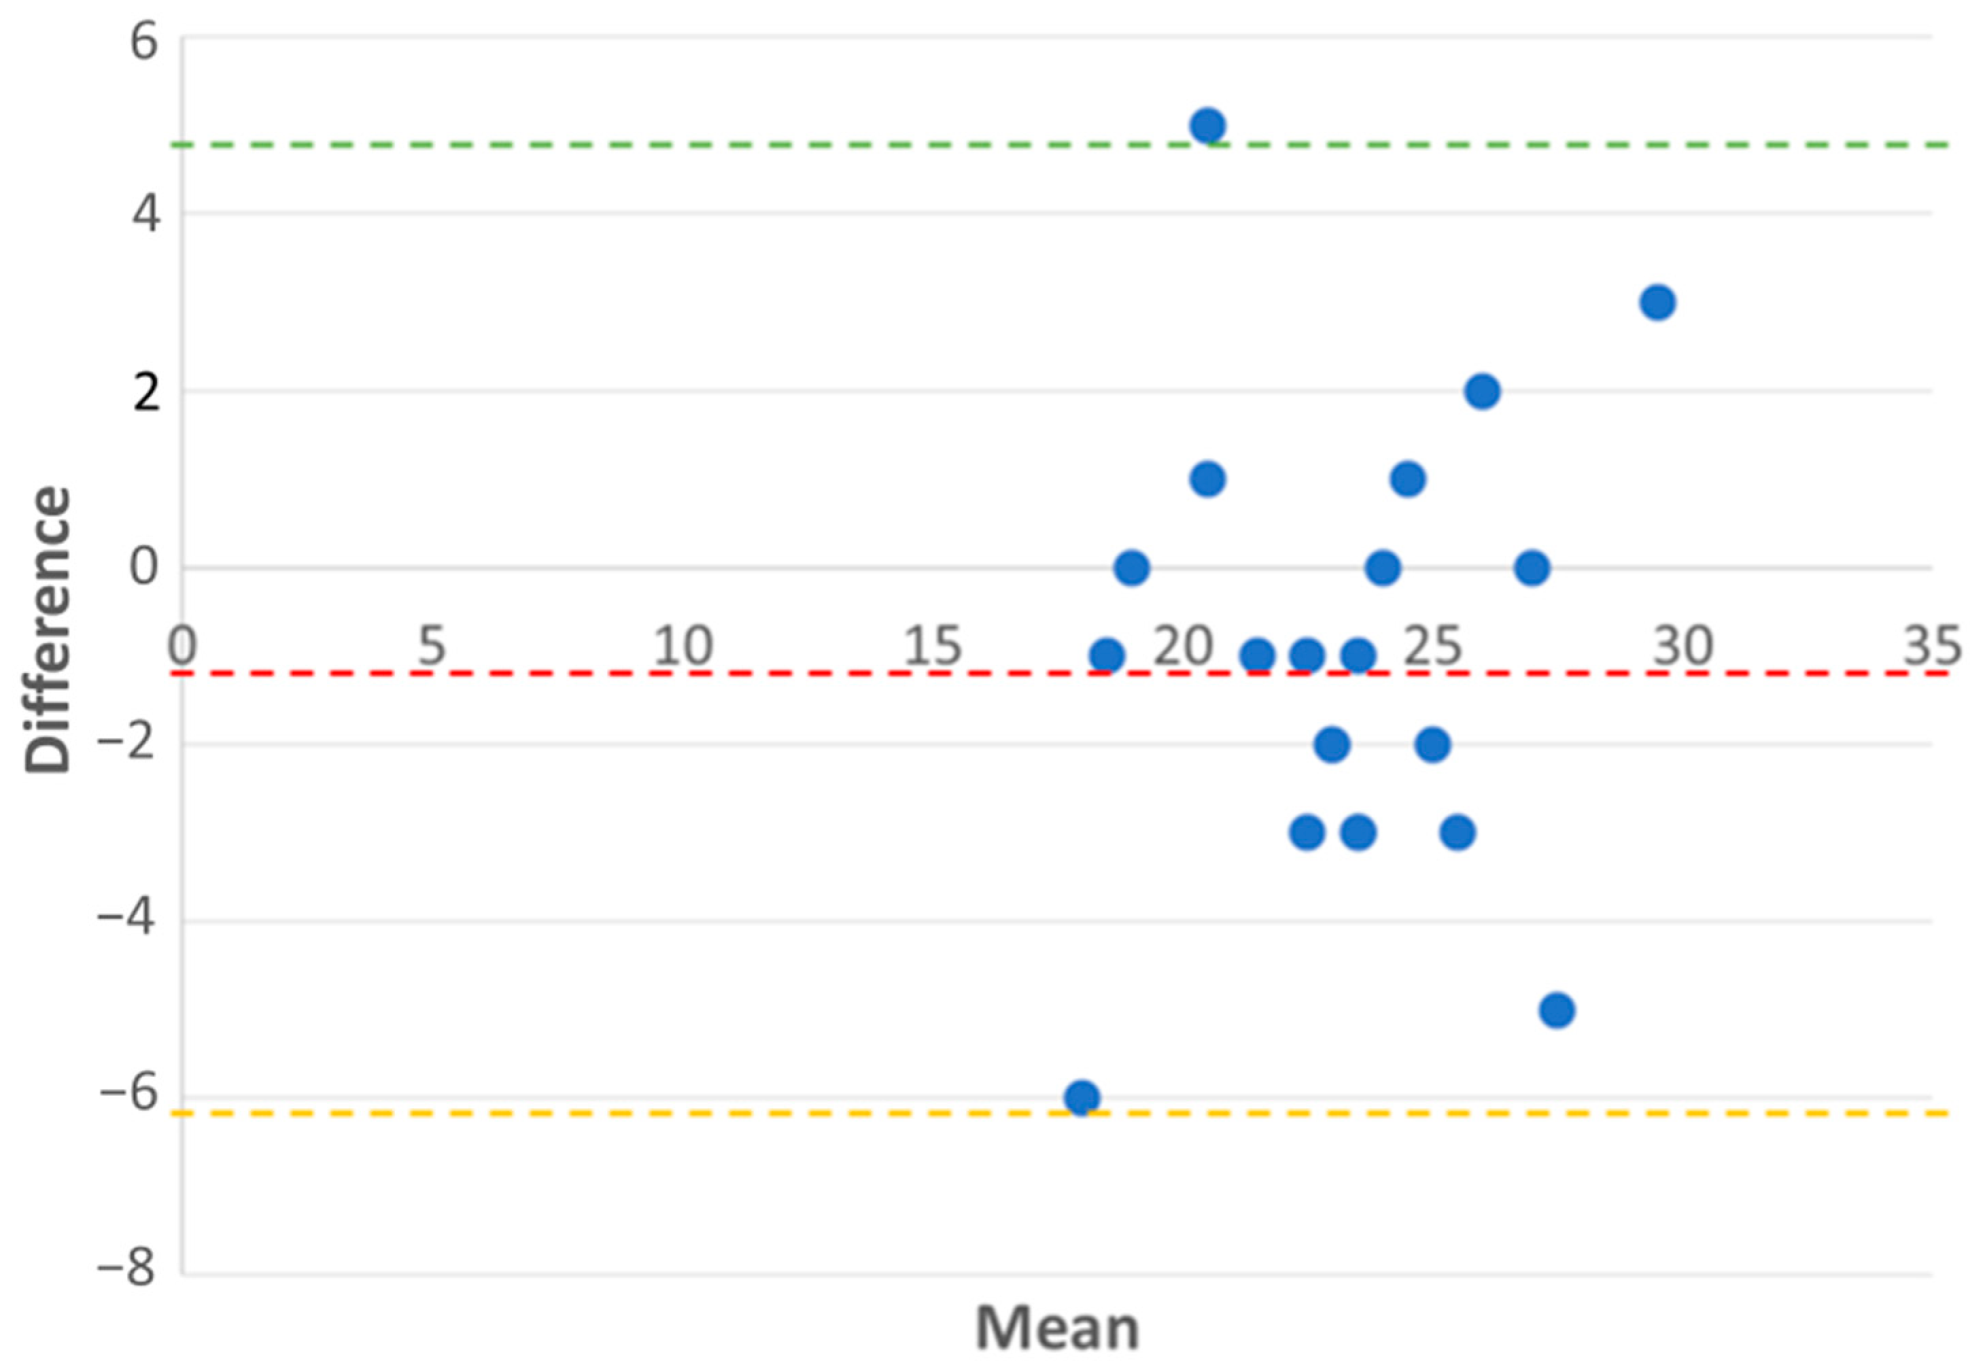
| Measurement | Displacement of the Basal RV Segment | TAPSE |
|---|---|---|
| Mean ± SD, mm | 22.76 ± 3.29 | 23.76 ± 3.02 |
| Outliers | 2 (9.5%) | 1 (4.8%) |
| Inliers | 19 (90.5%) | 20 (95.2%) |
| Bias | 1 (TAPSE overestimates by 1 mm) | NA |
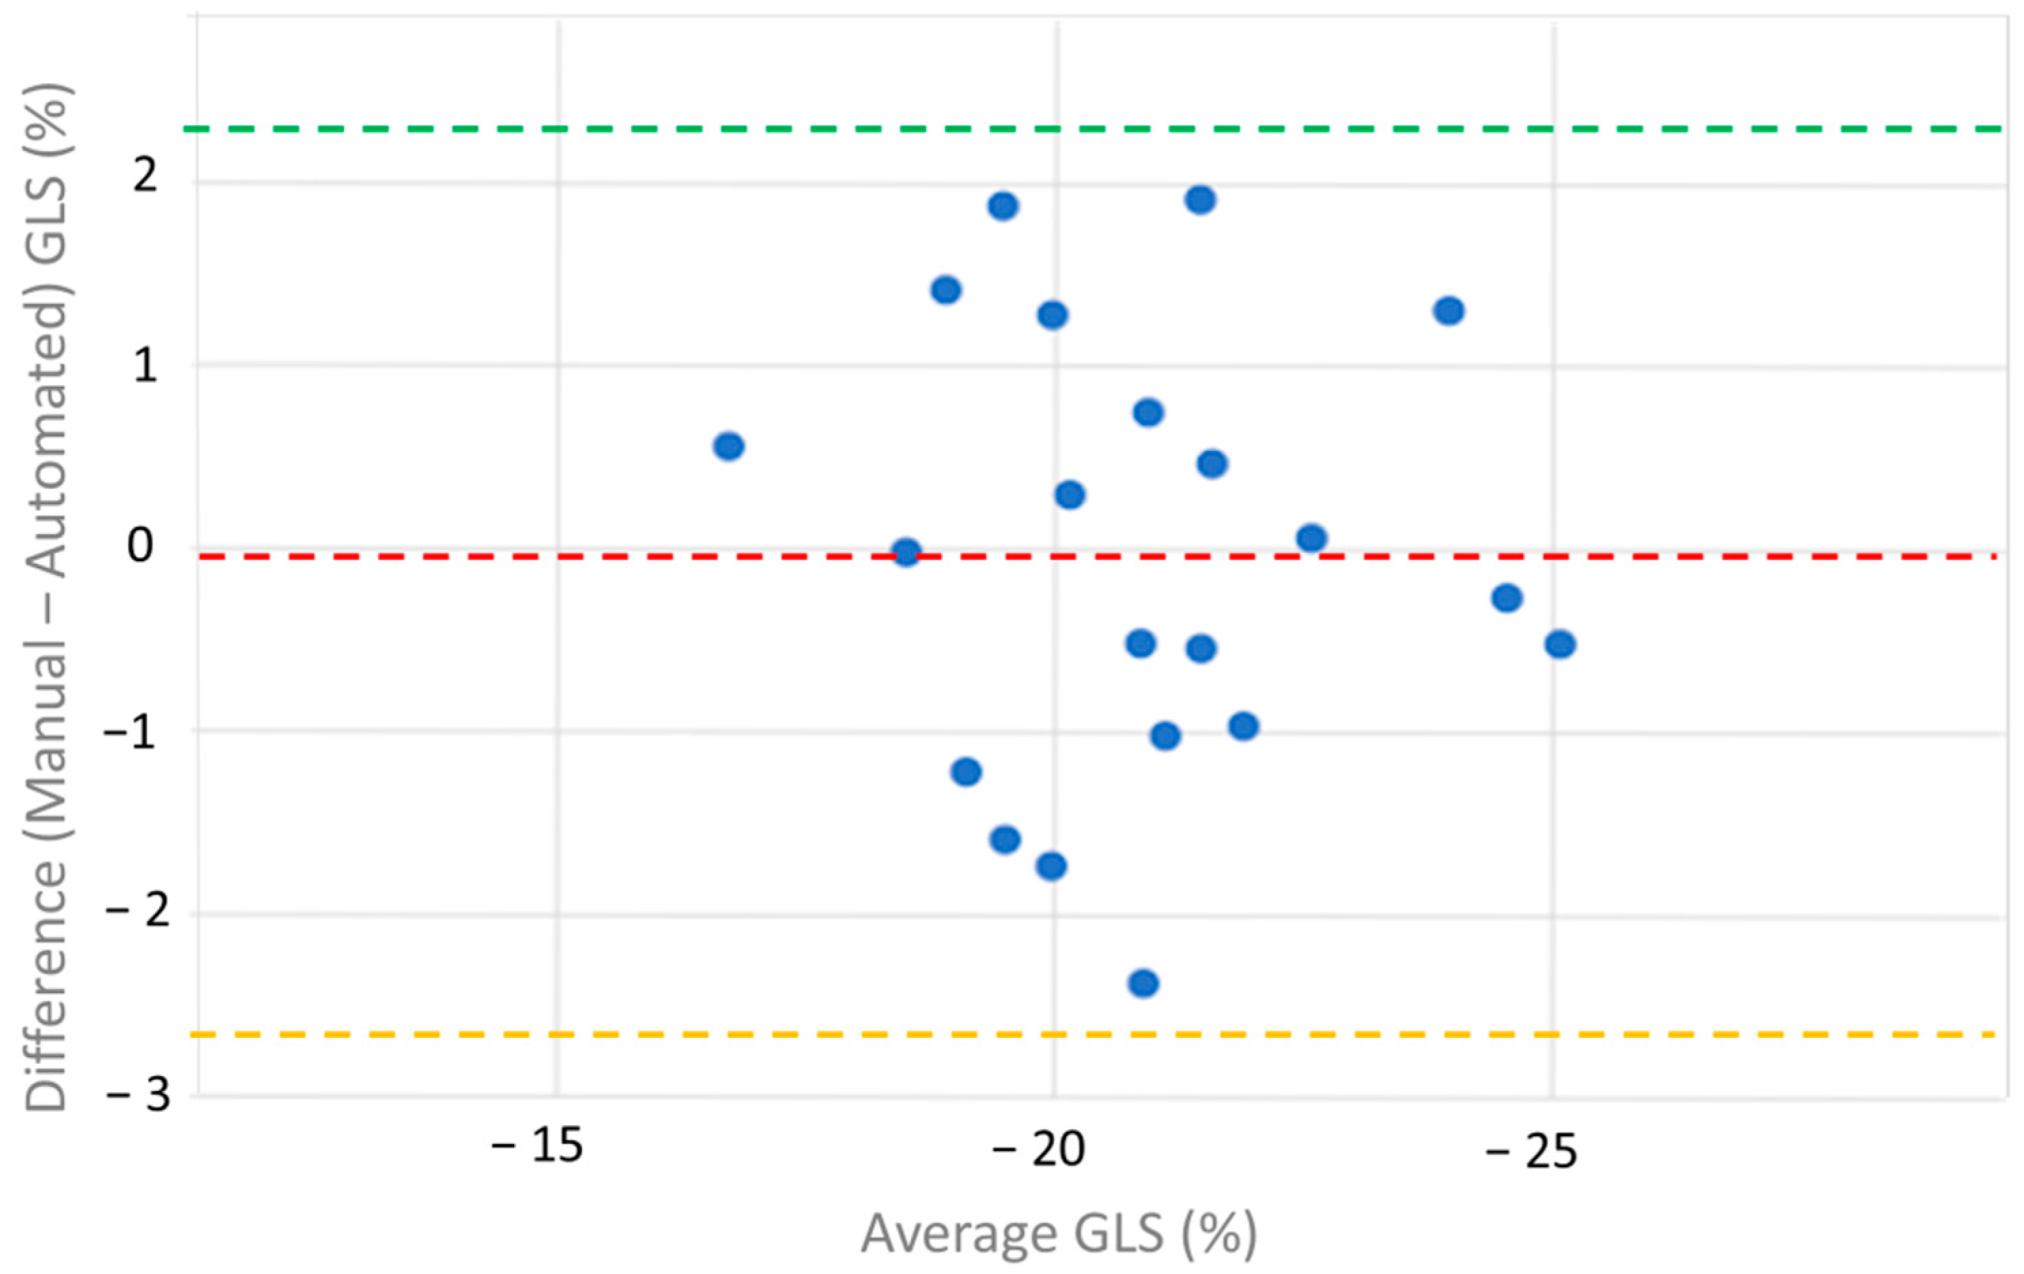
| Measurement | Manual RV Strain | Automatic RV Strain |
|---|---|---|
| Mean ± SD, % | −20.90 ± 2.08 | −20.08 ± 2.03 |
| Outliers | 2 (9.5%) | 0 (0%) |
| Inliers | 19 (90.5%) | 21(100%) |
| Bias | −0.04 | NA |
Disclaimer/Publisher’s Note: The statements, opinions and data contained in all publications are solely those of the individual author(s) and contributor(s) and not of MDPI and/or the editor(s). MDPI and/or the editor(s) disclaim responsibility for any injury to people or property resulting from any ideas, methods, instructions or products referred to in the content. |
© 2025 by the authors. Published by MDPI on behalf of the Lithuanian University of Health Sciences. Licensee MDPI, Basel, Switzerland. This article is an open access article distributed under the terms and conditions of the Creative Commons Attribution (CC BY) license (https://creativecommons.org/licenses/by/4.0/).
Share and Cite
Leitman, M.; Tyomkin, V. Evaluating Right Ventricular Function Using Longitudinal Displacement. Medicina 2025, 61, 446. https://doi.org/10.3390/medicina61030446
Leitman M, Tyomkin V. Evaluating Right Ventricular Function Using Longitudinal Displacement. Medicina. 2025; 61(3):446. https://doi.org/10.3390/medicina61030446
Chicago/Turabian StyleLeitman, Marina, and Vladimir Tyomkin. 2025. "Evaluating Right Ventricular Function Using Longitudinal Displacement" Medicina 61, no. 3: 446. https://doi.org/10.3390/medicina61030446
APA StyleLeitman, M., & Tyomkin, V. (2025). Evaluating Right Ventricular Function Using Longitudinal Displacement. Medicina, 61(3), 446. https://doi.org/10.3390/medicina61030446