
Therapeutic Impact of Aerobic Exercise on Adolescents with Obesity and Its Association with Expression of miRNAs and Cytokines: A Clinical Approach

Abstract

1. Introduction
2. Methodology
2.1. Ethical Approval and Informed Consent
2.2. Anthropometric Measurements
2.3. Blood Pressure Measurement
2.4. Pulse Rate
2.5. Sample Collection and RNA and DNA Extraction
2.6. Gene Expression Analysis
2.7. Aerobic Exercise Programme
2.8. Statistical Analysis
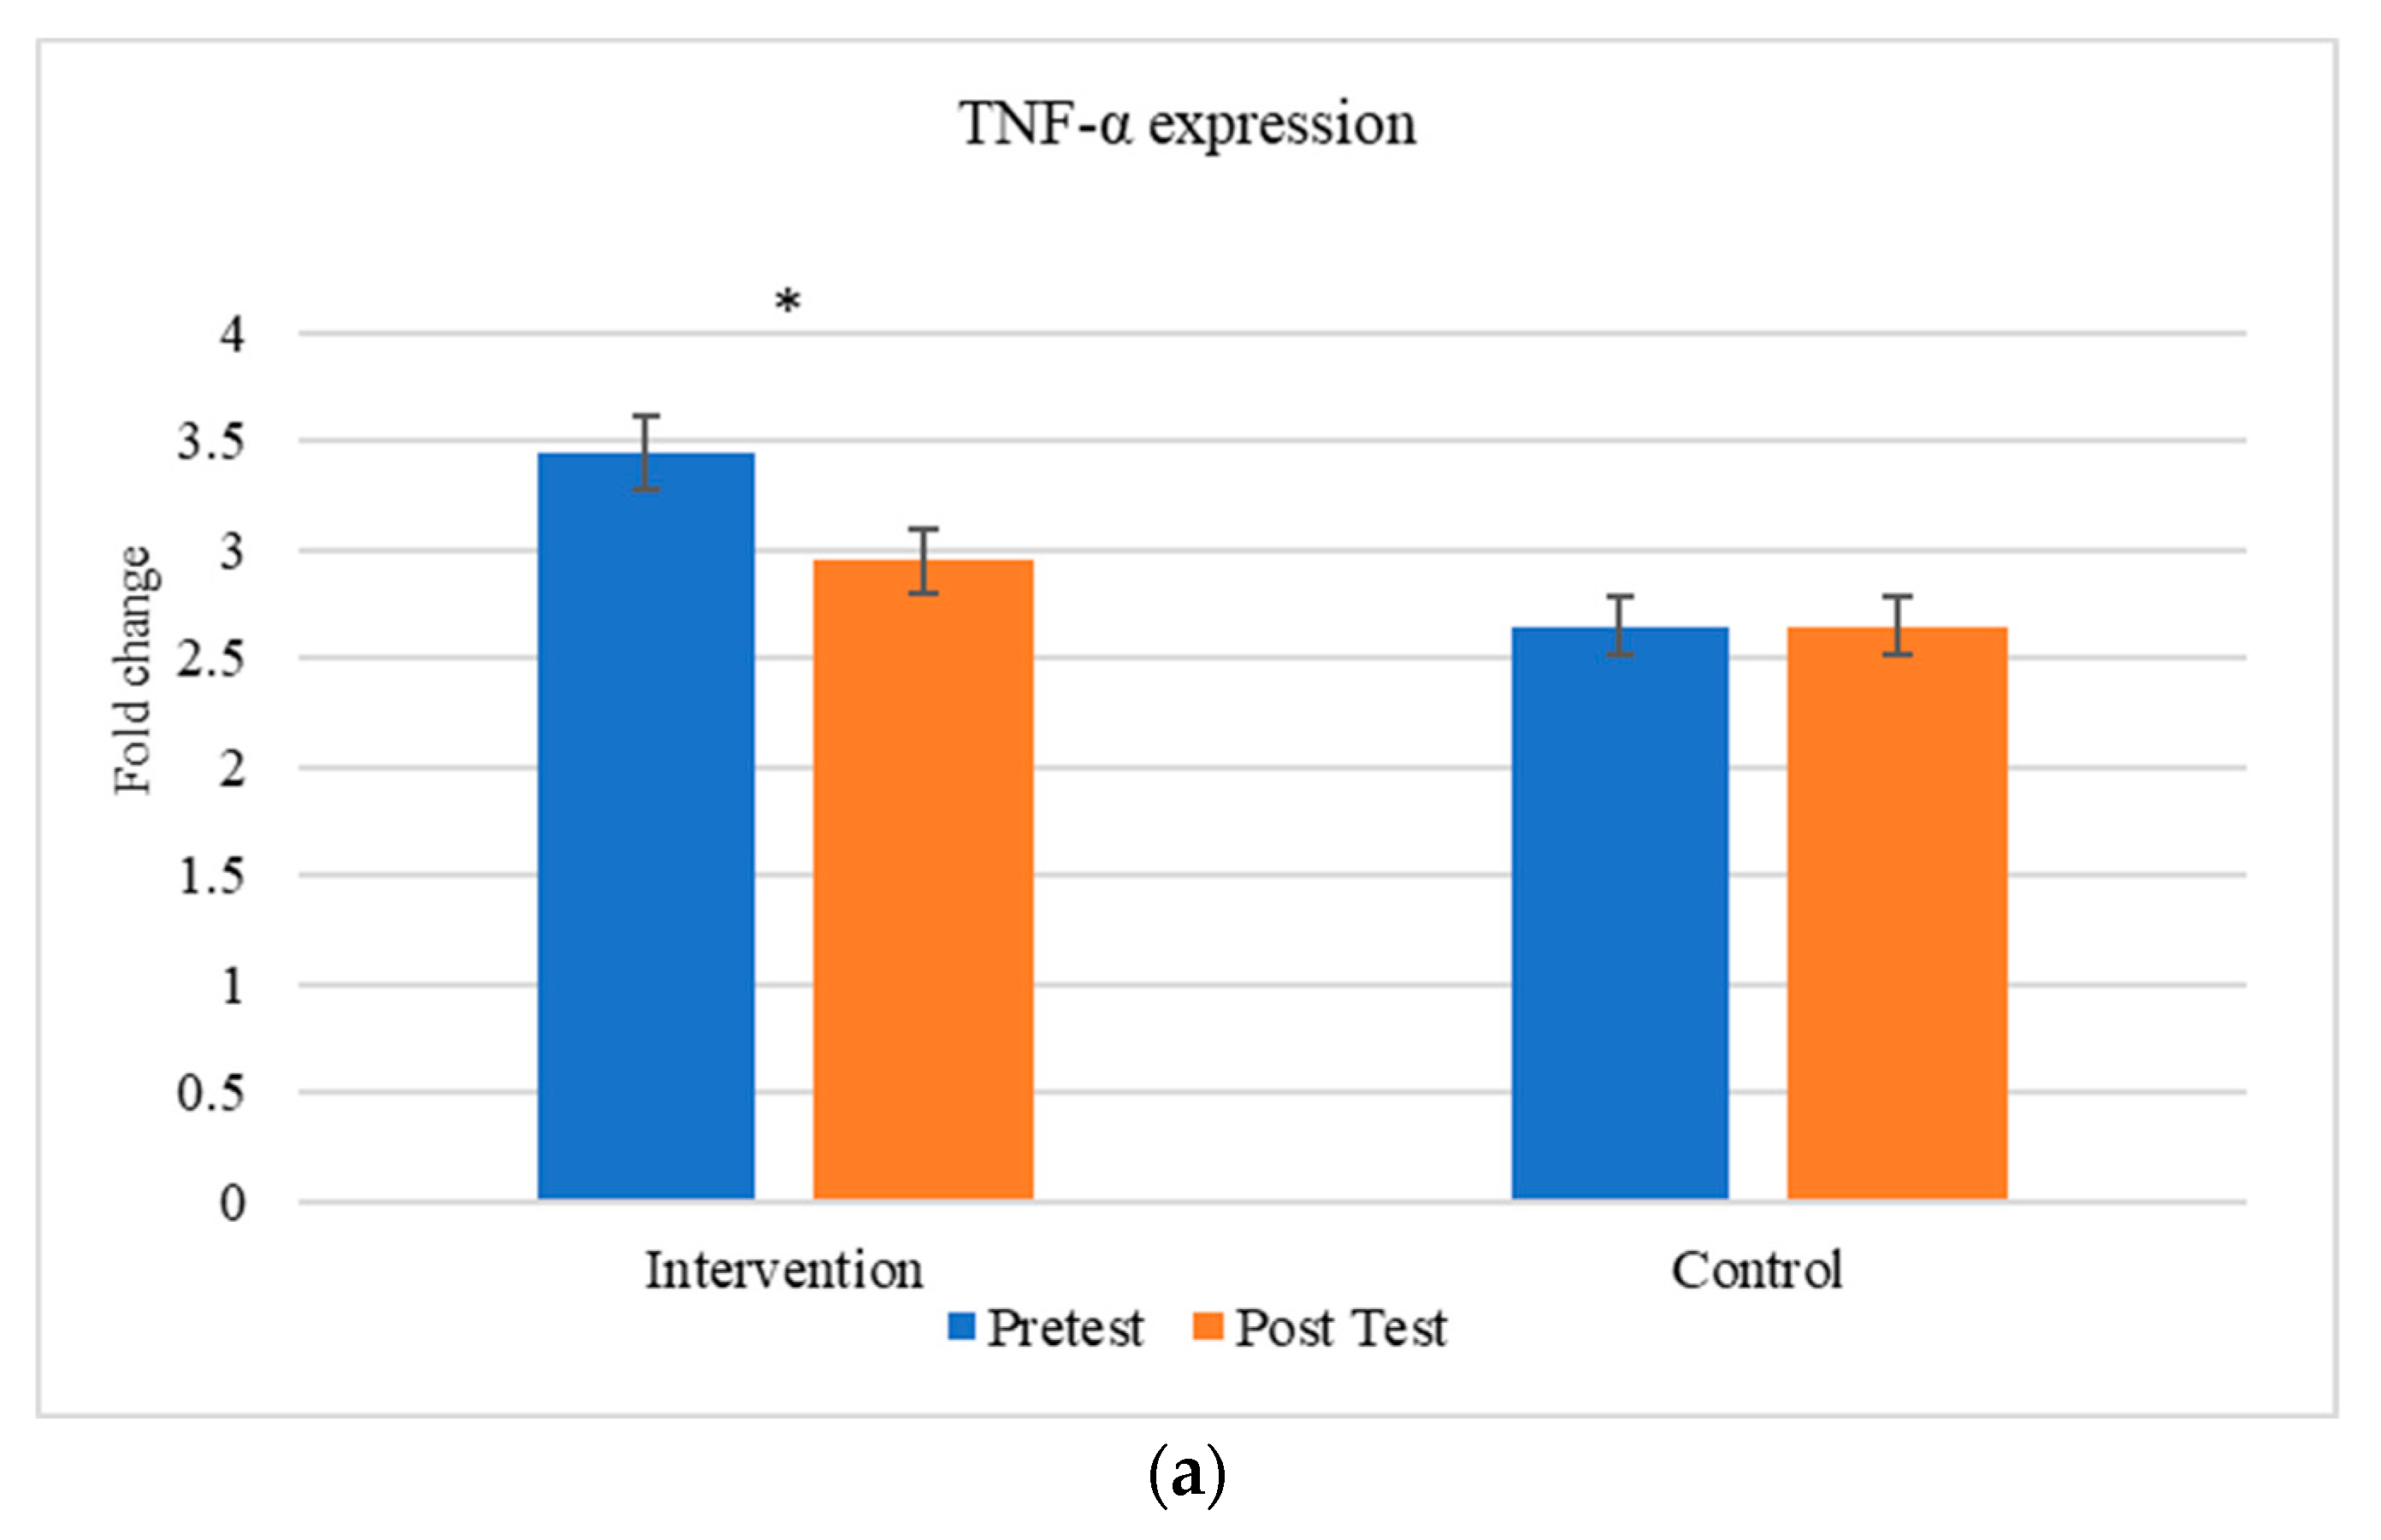
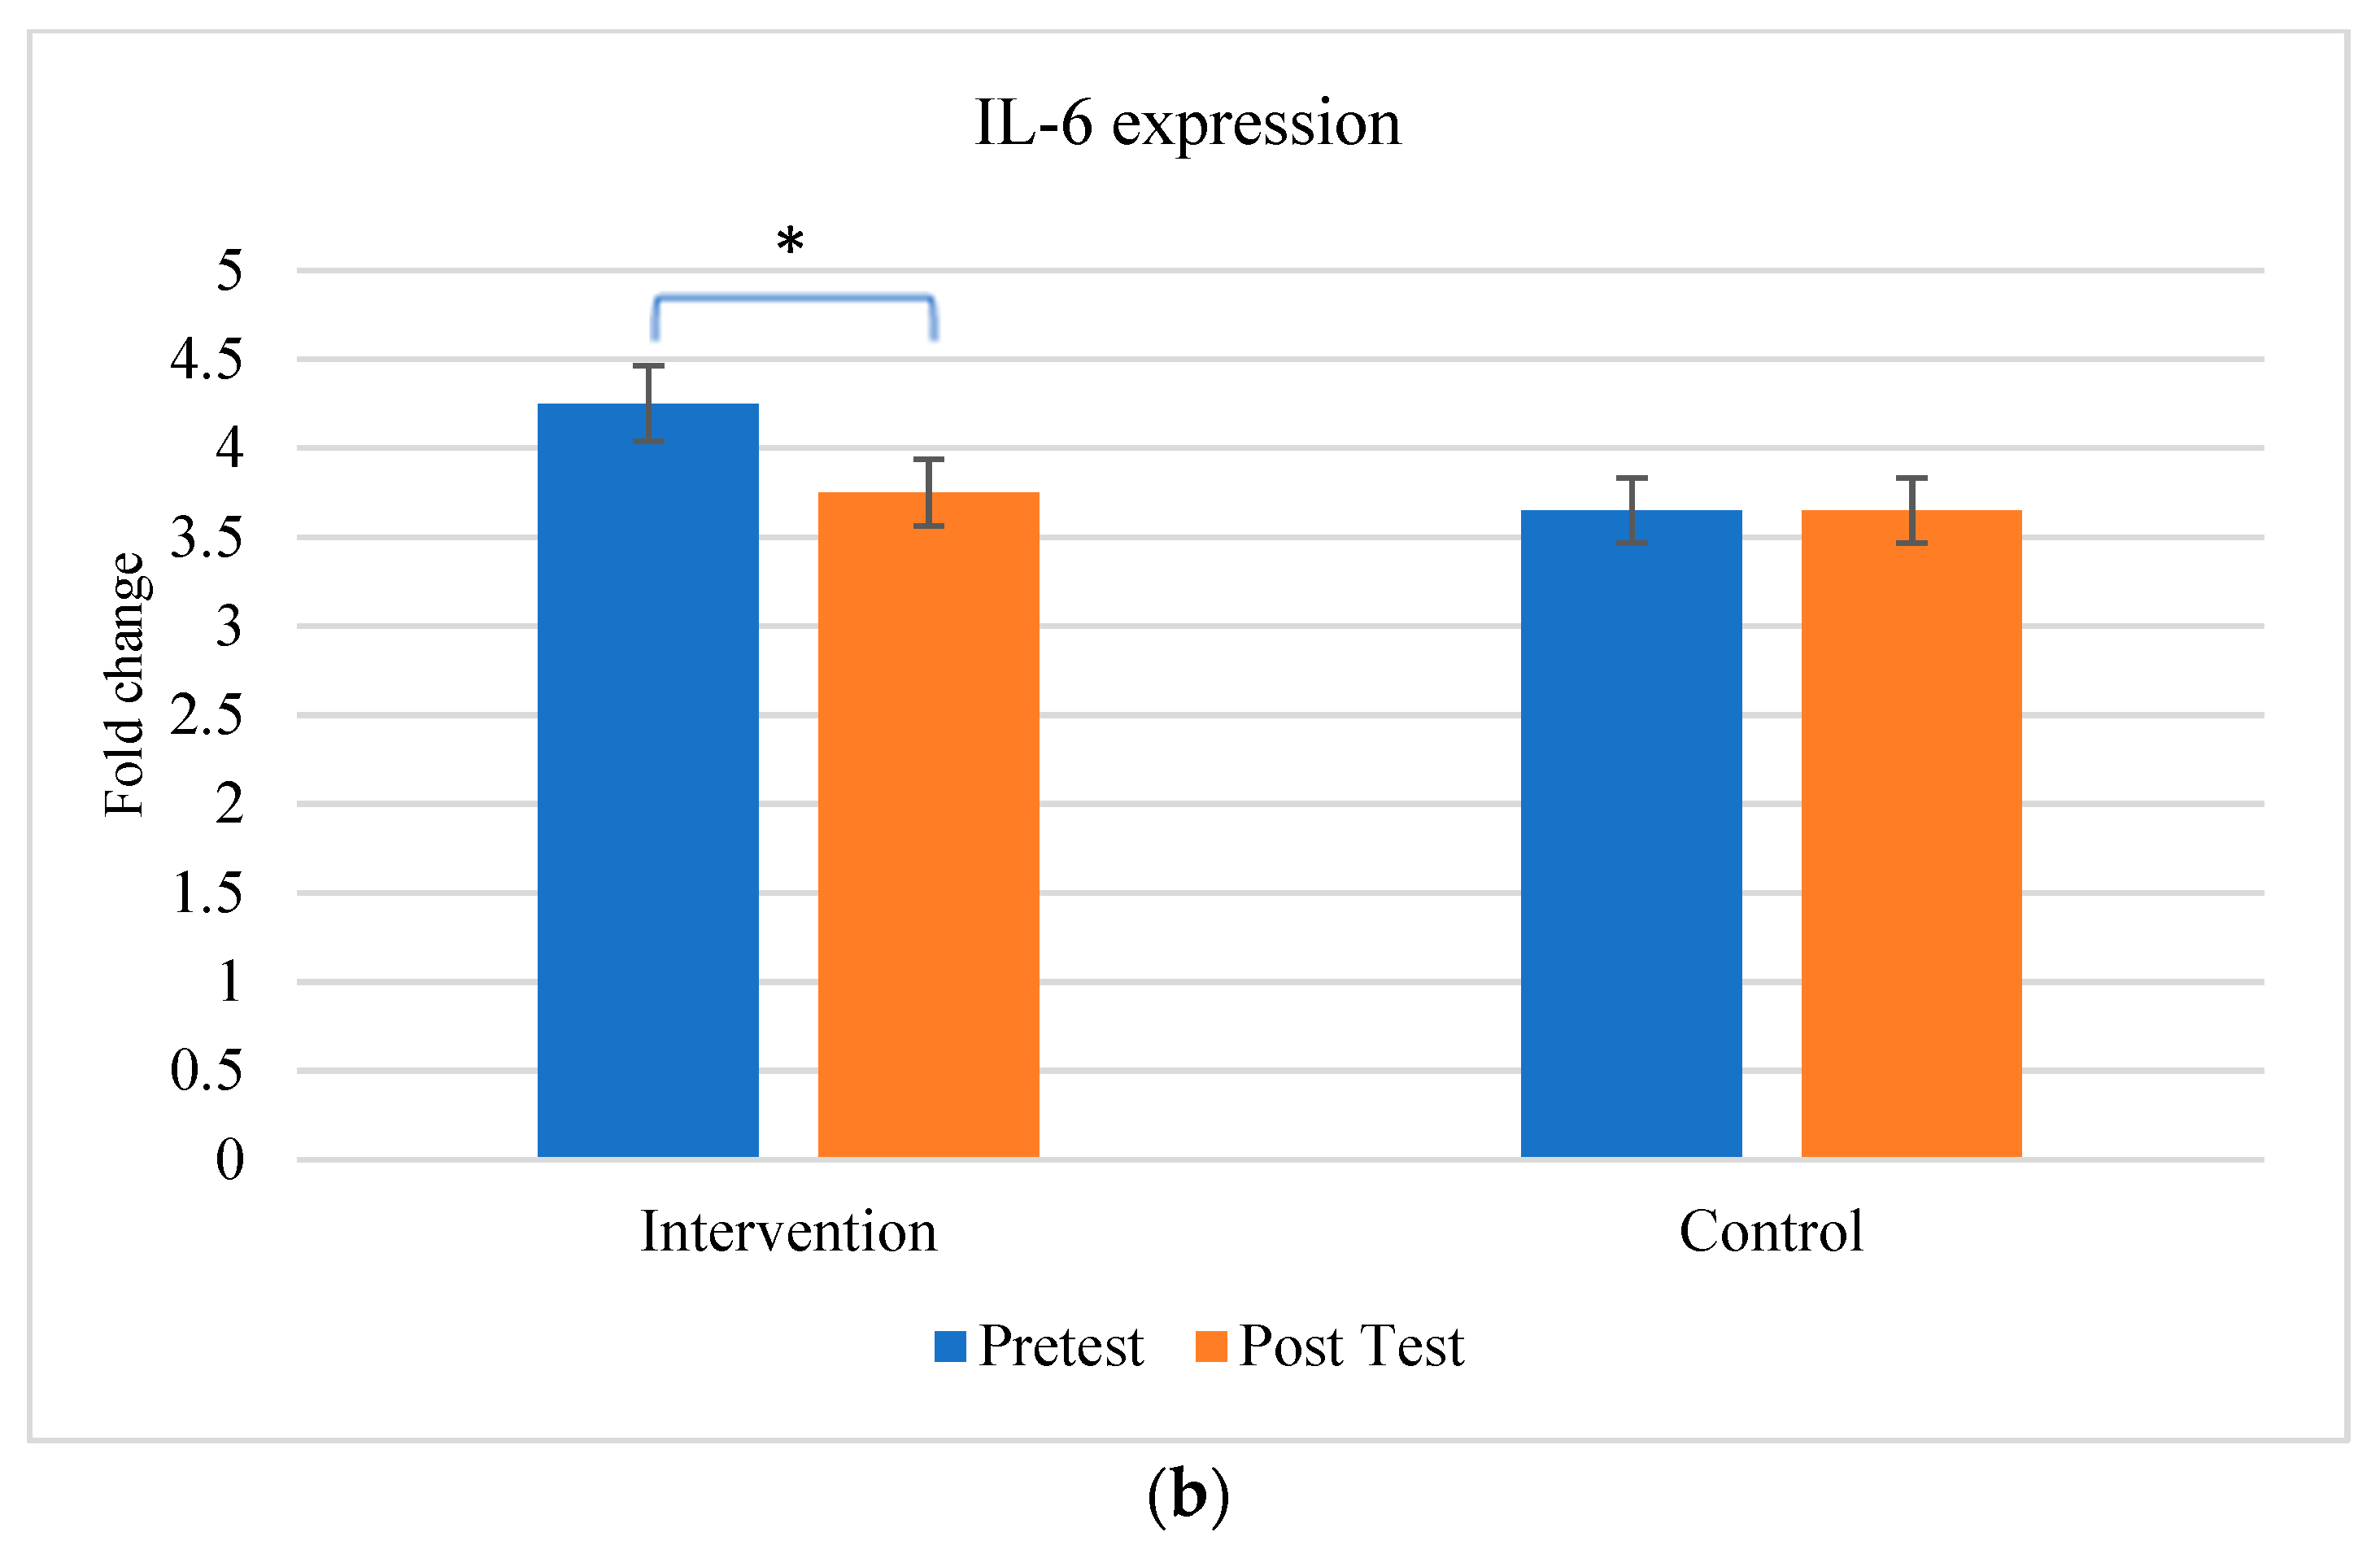
3. Results
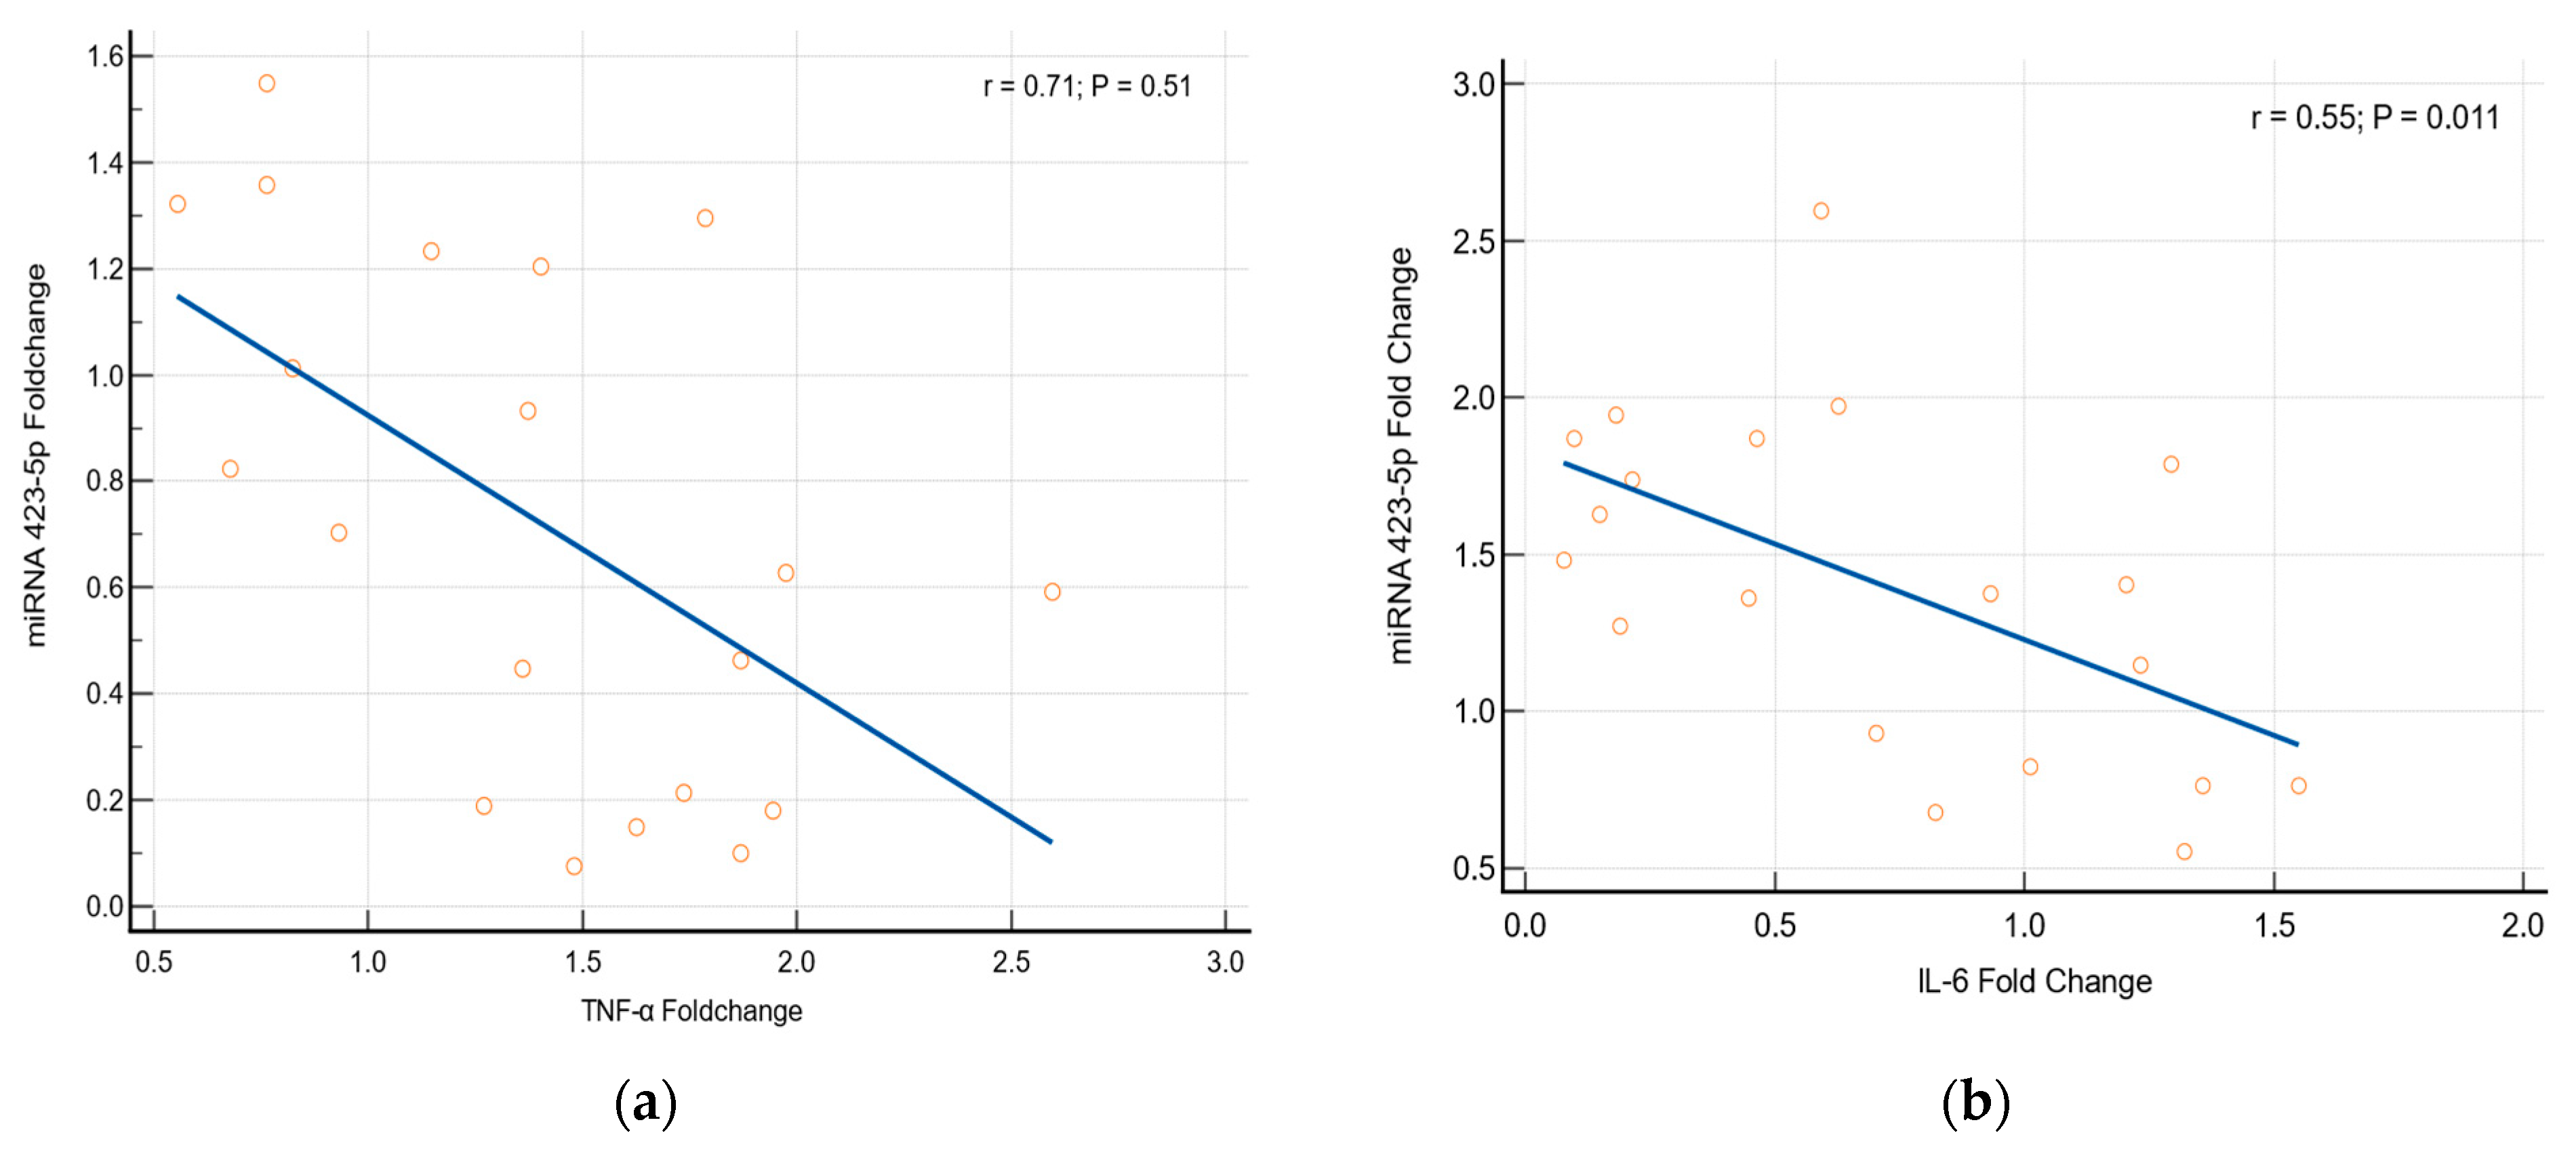
Association between the Expression of Cytokines and miRNA Genes
4. Discussion
5. Conclusions and Future Prospects
Author Contributions
Funding
Institutional Review Board Statement
Informed Consent Statement
Data Availability Statement
Acknowledgments
Conflicts of Interest
References
- Venkatrao, M.; Nagarathna, R.; Majumdar, V.; Patil, S.S.; Rathi, S.; Nagendra, H. Prevalence of Obesity in India and its neurological complications: A Multifactor analysis of a Nationwide cross-sectional study. Ann. Neurosci. 2020, 27, 153–161. [Google Scholar] [CrossRef]
- Deiuliis, J.A. MicroRNAs as regulators of Metabolic disease: Pathophysiologic significance and emerging role as biomarkers and therapeutics. Int. J. Obes. 2015, 40, 88–101. [Google Scholar] [CrossRef] [PubMed]
- International Institute for Population Sciences (IIPS) and ICF. National Family Health Survey (NFHS-5), 2019–21: India. National Family Health Survey; International Institute for Population Sciences (IIPS) and ICF: Mumbai, India, 2021. [Google Scholar]
- Karthik, R.C.; Gopalakrishnan, S. Evaluation of obesity and its risk factors among rural adults in Tamilnadu. Int. J. Community Med. Public Health 2018, 5, 3611–3617. [Google Scholar]
- Hainer, V.; Toplak, H.; Mitrakou, A. What fits whom? Diabetes Care 2008, 31 (Suppl. S2), S269–S277. [Google Scholar] [CrossRef] [PubMed]
- Kinlen, D.; Cody, D.; O’Shea, D. Complications of obesity. QJM Int. J. Med. 2018, 111, 437–443. [Google Scholar] [CrossRef]
- Serra-Majem, L.; Bautista-Castaño, I. Etiology of obesity: Two “key issues” and other emerging factors. Nutr. Hosp. 2013, 28 (Suppl. S5), 32–43. [Google Scholar]
- Suman, C. Aerobic exercise programme and reduction in body weight and body mass index (BMI). Galore Int. J. Health Sci. Res. 2016, 1, 41–44. [Google Scholar]
- Pescador, N.; Pérez-Barba, M.; Ibarra, J.M.; Corbatón, A.; Martínez-Larrad, M.T.; Serrano-Ríos, M. Serum circulating MicroRNA profiling for identification of potential type 2 diabetes and obesity biomarkers. PLoS ONE 2013, 8, e77251. [Google Scholar] [CrossRef]
- Sapp, R.M.; Shill, D.D.; Roth, S.M.; Hagberg, J.M. Circulating MicroRNAs in acute and chronic exercise: More than mere biomarkers. J. Appl. Physiol. 2017, 122, 702–717. [Google Scholar] [CrossRef]
- Sohel, M.H. Extracellular/circulating MicroRNAs: Release mechanisms, functions and challenges. Achiev. Life Sci. 2016, 10, 175–186. [Google Scholar] [CrossRef]
- Ortega, F.J.; Mercader, J.M.; Moreno-Navarrete, J.M.; Rovira, O.; Guerra, E.; Esteve, E.; Xifra, G.; Martínez, C.; Ricart, W.; Rieusset, J.; et al. Profiling of circulating MicroRNAs reveals common MicroRNAS linked to type 2 diabetes that change with insulin sensitization. Diabetes Care 2014, 37, 1375–1383. [Google Scholar] [CrossRef]
- O’Brien, J.; Hayder, H.; Zayed, Y.; Peng, C. Overview of MicroRNA biogenesis, mechanisms of actions, and circulation. Front. Endocrinol. 2018, 9, 402. [Google Scholar] [CrossRef]
- Cui, M.; Wang, H.; Yao, X.; Zhang, D.; Xie, Y.; Cui, R.; Zhang, X. Circulating MicroRNAs in Cancer: Potential and Challenge. Front. Genet. 2019, 10, 626. [Google Scholar] [CrossRef]
- Al-Rawaf, H.A. Circuating MicroRNAs and adipokines as markers of metabolic syndrome in adolescents with obesity. Clin. Nutr. 2019, 38, 2231–2238. [Google Scholar] [CrossRef]
- Ortega, F.J.; Mercader, J.M.; Catalán, V.; Moreno-Navarrete, J.M.; Pueyo, N.; Sabater, M.; Gomez-Ambrosi, J.; Anglada, R.; Fernandez-Formoso, J.A.; Ricart, W.; et al. Targeting the circulating MicroRNA signature of obesity. Clin. Chem. 2013, 59, 781–792. [Google Scholar] [CrossRef]
- Heianza, Y.; Xue, Q.; Rood, J.; Bray, G.; Sacks, F.; Qi, L. Circulating MicroRNA-128-1 and changes in energy metabolism and insulin sensitivity in response to weight loss diet interventions: The pounds lost trail. Circulation 2022, 145, AMP30. [Google Scholar] [CrossRef]
- Dimassi, S.; Karkeni, E.; Laurant, P.; Tabka, Z.; Landrier, J.F.; Riva, C. Microparticle miRNAs as biomarkers of vascular function and inflammation response to aerobic exercise in obesity? Obes. Biol. Intergrated Physiol. 2018, 26, 1584–1593. [Google Scholar] [CrossRef] [PubMed]
- Iacomino, G.; Siani, A. Role of microRNAs in obesity and obesity-related diseases. Genes Nutr. 2017, 12, 23. [Google Scholar] [CrossRef] [PubMed]
- Landrier, J.F.; Derghal, A.; Mounien, L. MicroRNAs in Obesity and Related Metabolic Disorders. Cells 2019, 8, 859. [Google Scholar] [CrossRef] [PubMed]
- Choi, W.H.; Ahn, J.; Um, M.Y.; Jung, C.H.; Jung, S.E.; Ha, T.Y. Circulating MicroRNA expression profiling in young obese Korean women. Nutr. Res. Pract. 2020, 14, 412–422. [Google Scholar] [CrossRef] [PubMed]
- Park, K. Textbook of Preventive and Social Medicine, 23rd ed.; Bhandi: Mumbai, India, 2015; pp. 399–400. [Google Scholar]
- Williams, J.S.; Brown, S.M.; Conlin, P.R. Blood-Pressure Measurement. N. Engl. J. Med. 2009, 360, e6. [Google Scholar] [CrossRef] [PubMed]
- Karmakar, N.; Banerjee, S.; Das, A.; Dasgupta, A.; Mukhopadhyay, M. A study on hypertension and comparability between one reading and average of three readings of blood pressure by mercury sphygmomanometer among adults in a slum of Kolkata. J. Res. Med. Dent. Sci. 2016, 4, 45–50. [Google Scholar] [CrossRef]
- Pal, G.K. Textbook of Practical Physiology, 3rd ed.; Universities Press: Hydereabad, India, 2012; p. 175. [Google Scholar]
- World Health Organization. Physical Activity. February 2018. Available online: https://www.who.int/news-room/fact-sheets/detail/physical-activity (accessed on 2 February 2022).
- Castres, I.; Tourny, C.; Lemaitre, F.; Coquart, J. Impact of a walking program of 10,000 steps per day and dietary counseling on health-related quality of life, energy expenditure and anthropometric parameters in obese subjects. J. Endocrinol. Investig. 2016, 40, 135–141. [Google Scholar] [CrossRef]
- Pescatello, L.S. ACSM’s Guidelines for Exercise Testing and Prescription, 8th ed.; Lippincott Williams & Wilkins: Philadelphia, PA, USA, 2009; pp. 152–165. [Google Scholar]
- Prats-Puig, A.; Ortega, F.J.; Mercader, J.M.; Moreno-Navarrete, J.M.; Moreno, M.; Bonet, N.; Ricart, W.; López-Bermejo, A.; Fernández-Real, J.M. Changes in Circulating MicroRNAs Are Associated with Childhood Obesity. J. Clin. Endocrinol. Metab. 2013, 98, E1655–E1660. [Google Scholar] [CrossRef] [PubMed]
- Heianza, Y.; Xue, Q.; Rood, J.; Bray, G.A.; Sacks, F.M.; Qi, L. Circulating thrifty microRNA is related to insulin sensitivity, adiposity, and energy metabolism in adults with overweight and obesity: The POUNDS Lost trial. Am. J. Clin. Nutr. 2023, 117, 121–129. [Google Scholar] [CrossRef]
- Aryal, B.; Singh, A.K.; Rotllan, N.; Price, N.; Fernández-Hernando, C. MicroRNAs and lipid metabolism. Curr. Opin. Infect. Dis. 2017, 28, 273–280. [Google Scholar] [CrossRef]
- Agbu, P.; Carthew, R.W. MicroRNA-mediated regulation of glucose and lipid metabolism. Nat. Rev. Mol. Cell Biol. 2021, 22, 425–438. [Google Scholar] [CrossRef]
- Heneghan, H.M.; Miller, N.; Kerin, M.J. Role of microRNAs in obesity and the metabolic syndrome. Obes. Rev. 2010, 11, 354–361. [Google Scholar] [CrossRef]
- Gauthier, B.R.; Wollheim, C.B. MicroRNAs: ‘Ribo-regulators’ of glucose homeostasis. Nat. Med. 2006, 12, 36–38. [Google Scholar] [CrossRef]
- He, A.; Zhu, L.; Gupta, N.; Chang, Y.; Fang, F. Overexpression of micro ribonucleic acid 29, highly up-regulated in diabetic rats, leads to insulin resistance in 3T3-L1 adipocytes. Mol. Endocrinol. 2007, 21, 2785–2794. [Google Scholar] [CrossRef]
- Poy, M.N.; Spranger, M.; Stoffel, M. microRNAs and the regulation of glucose and lipid metabolism. Diabetes Obes. Metab. 2007, 9, 67–73. [Google Scholar] [CrossRef]
- Zhang, M.; Han, W.; Xu, Y.; Li, D.; Xue, Q. Serum miR-128 serves as a potential diagnostic biomarker for Alzheimer’s disease. Neuropsychiatr. Dis. Treat. 2021, 17, 269–275. [Google Scholar] [CrossRef]
- Arcidiacono, B.; Chiefari, E.; Foryst-Ludwig, A.; Curro, G.; Navarra, G.; Brunetti, F.S.; Mirabelli, M.; Corigliano, D.M.; Kintscher, U.; Britti, D.; et al. Obesity-related hypoxia via miR-128 decreases insulin-receptor expression in human and mouse adipose tissue promoting systemic insulin resistance. EBioMedicine 2020, 59, 102912. [Google Scholar] [CrossRef] [PubMed]
- Yang, J.; Xing, N.; Dong, L. Effect of MiR-423-5p expression on the severity of lipopolysaccharide-induced acute liver injury, inflammatory response and immune function in mice. Trop. J. Pharm. Res. 2022, 21, 761–767. [Google Scholar] [CrossRef]
- Ibarra, P.E.; García-Solís, P.; Solís-Sáinz, J.C.; Cruz-Hernández, A. Expression of miRNA in obesity and insulin resistance: A review. Endokrynol. Polska 2021, 72, 73–80. [Google Scholar] [CrossRef] [PubMed]


| Gene | Forward Primer (5′ to 3′) | Reverse Primer (3′ to 5′) |
|---|---|---|
| GAPDH (House Keeping) | ATGGGGAAGGTGAAGGTCG | TAAAAGCAGCCCTGGTGACC |
| miRNA 423-5p | GCTATCAAGCTCCATCCGCAT | TAAGACGAAGCACCGGA |
| miRNA 128-1 | CCGCCGGGATCCGCAGAAAGTCAAC | CGCCGAAGCTTATCC |
| TNF-α | TGTTCTGGAGGTACTCTAGG | TGTTCTGGAGGTACTCTAGG |
| IL-6 | ATCATTCTCTAGTGTCTGGTTGG | TGTTCTGGAGGTACTCTAGG |
| Group | ANOVA p Value | |||
|---|---|---|---|---|
| Controls (n = 32) | Pretest Obesity (n = 32) | Posttest Obesity (n = 32) | ||
| Age (years) | 18.8 (±1) | 18.4 (±0.7) | ||
| Height (cm) | 166.8 (±9.5) | 165.7 (±11.1) | ||
| Weight (kg) | 61.9 (±9.2) | 78.7 (±16.3) | 74.3 (±16.1) | 0.001 |
| BMI (kg/m2) | 22.1 (±1.7) | 28.4 (±3.1) | 26.7 (±3.3) | 0.001 |
| Waist Circumference (cm) | 75.5 (±10.4) | 90.7 (±11.4) | 88.4 (±12.7) | 0.001 |
| Hip Circumference (cm) | 96.8 (±5.9) | 106.9 (±9.6) | 104.6 (±7.8) | 0.001 |
| Waist/Hip Ratio | 0.7 (±0.1) | 0.85 (±0.07) | 0.84 (±0.1) | 0.001 |
| SBP (mmHg) | 108.3 (±10.5) | 119.7 (±13.9) | 116.6 (±14.5) | 0.002 |
| DBP (mmHg) | 75.6 (±14) | 75.3 (±9.4) | 73.1 (±9.5) | 0.658 |
| Heart Rate (bpm) | 80.9 (±6.2) | 84.8 (±9.3) | 83.7 (±9.6) | 0.179 |
| Fasting Blood Sugar (mg/dL) | 75.1 (±8.2) | 81.8 (±44.6) | 78.4 (±35.4) | 0.72 |
| Post Prandial Blood Sugar (md/dL) | 123 (±6.2) | 176 (±18.3) | 164 (±21.5) | 0.048 |
| HbA1c | 5.54 (±0.2) | 6.52 (±1.3) | 6.36 (±2.3) | 0.05 |
| Total Cholesterol (mg/dL) | 121.9 (±23.2) | 146.3 (±18.5) | 141.1 (±20.5) | 0.001 |
| Triglycerides (mg/dL) | 81.5 (±21.5) | 75.8 (±17.8) | 64.8 (±15.4) | 0.812 |
| HDL-Cholesterol (mg/dL) | 50.8 (±9.9) | 43.1 (±7.8) | 49.1 (±6.6) | 0.002 |
| LDL-Cholesterol (mg/dL) | 88.3 (±12.9) | 88 (±15.2) | 85.8 (±17.1) | 0.765 |
| VLDL-Cholesterol (mg/dL) | 15.4 (±4.5) | 15.1 (±8.1) | 12.9 (±4.7) | 0.194 |
| CRP (mg/L) | 0.8 (±0.7) | 3.6 (±4.6) | 3.2 (±3.4) | 0.002 |
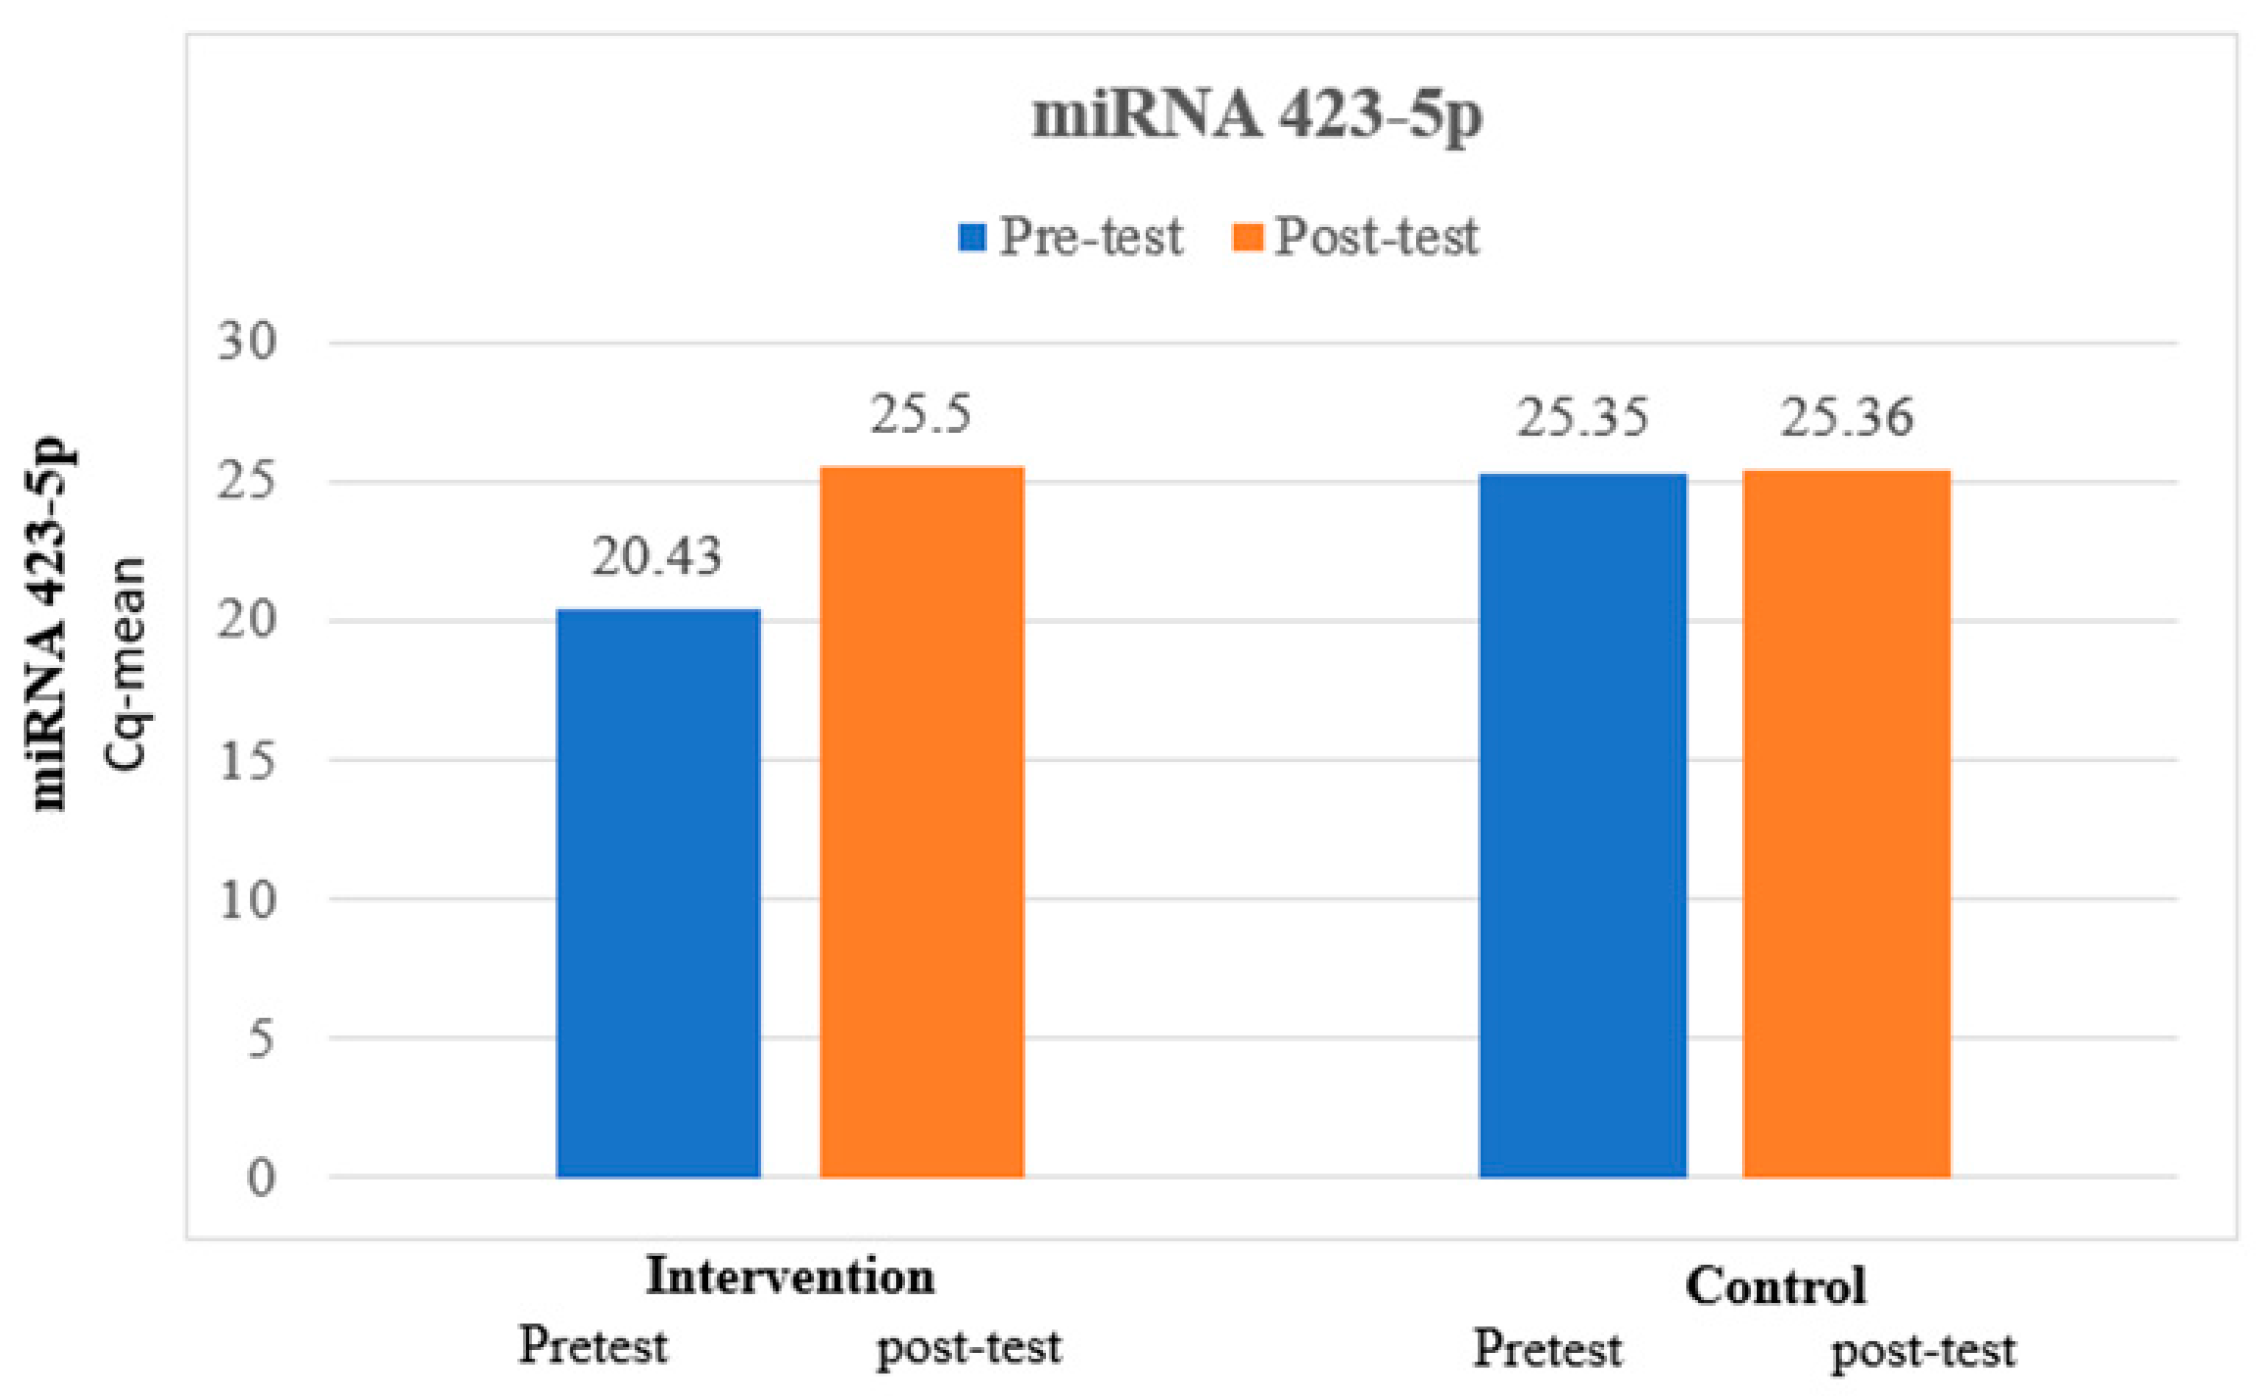
| Group | miRNA 423-5p | Mean Diff. | Paired ‘t’ Test p Value | |
|---|---|---|---|---|
| Pretest | Posttest | |||
| Intervention | 20.43 (±1.4) | 25.5 (±1.66) | 5.06 | 0.001 |
| Control | 25.35 (±1.6) | 25.36 (±1.78) | 0.015 | 0.917 |
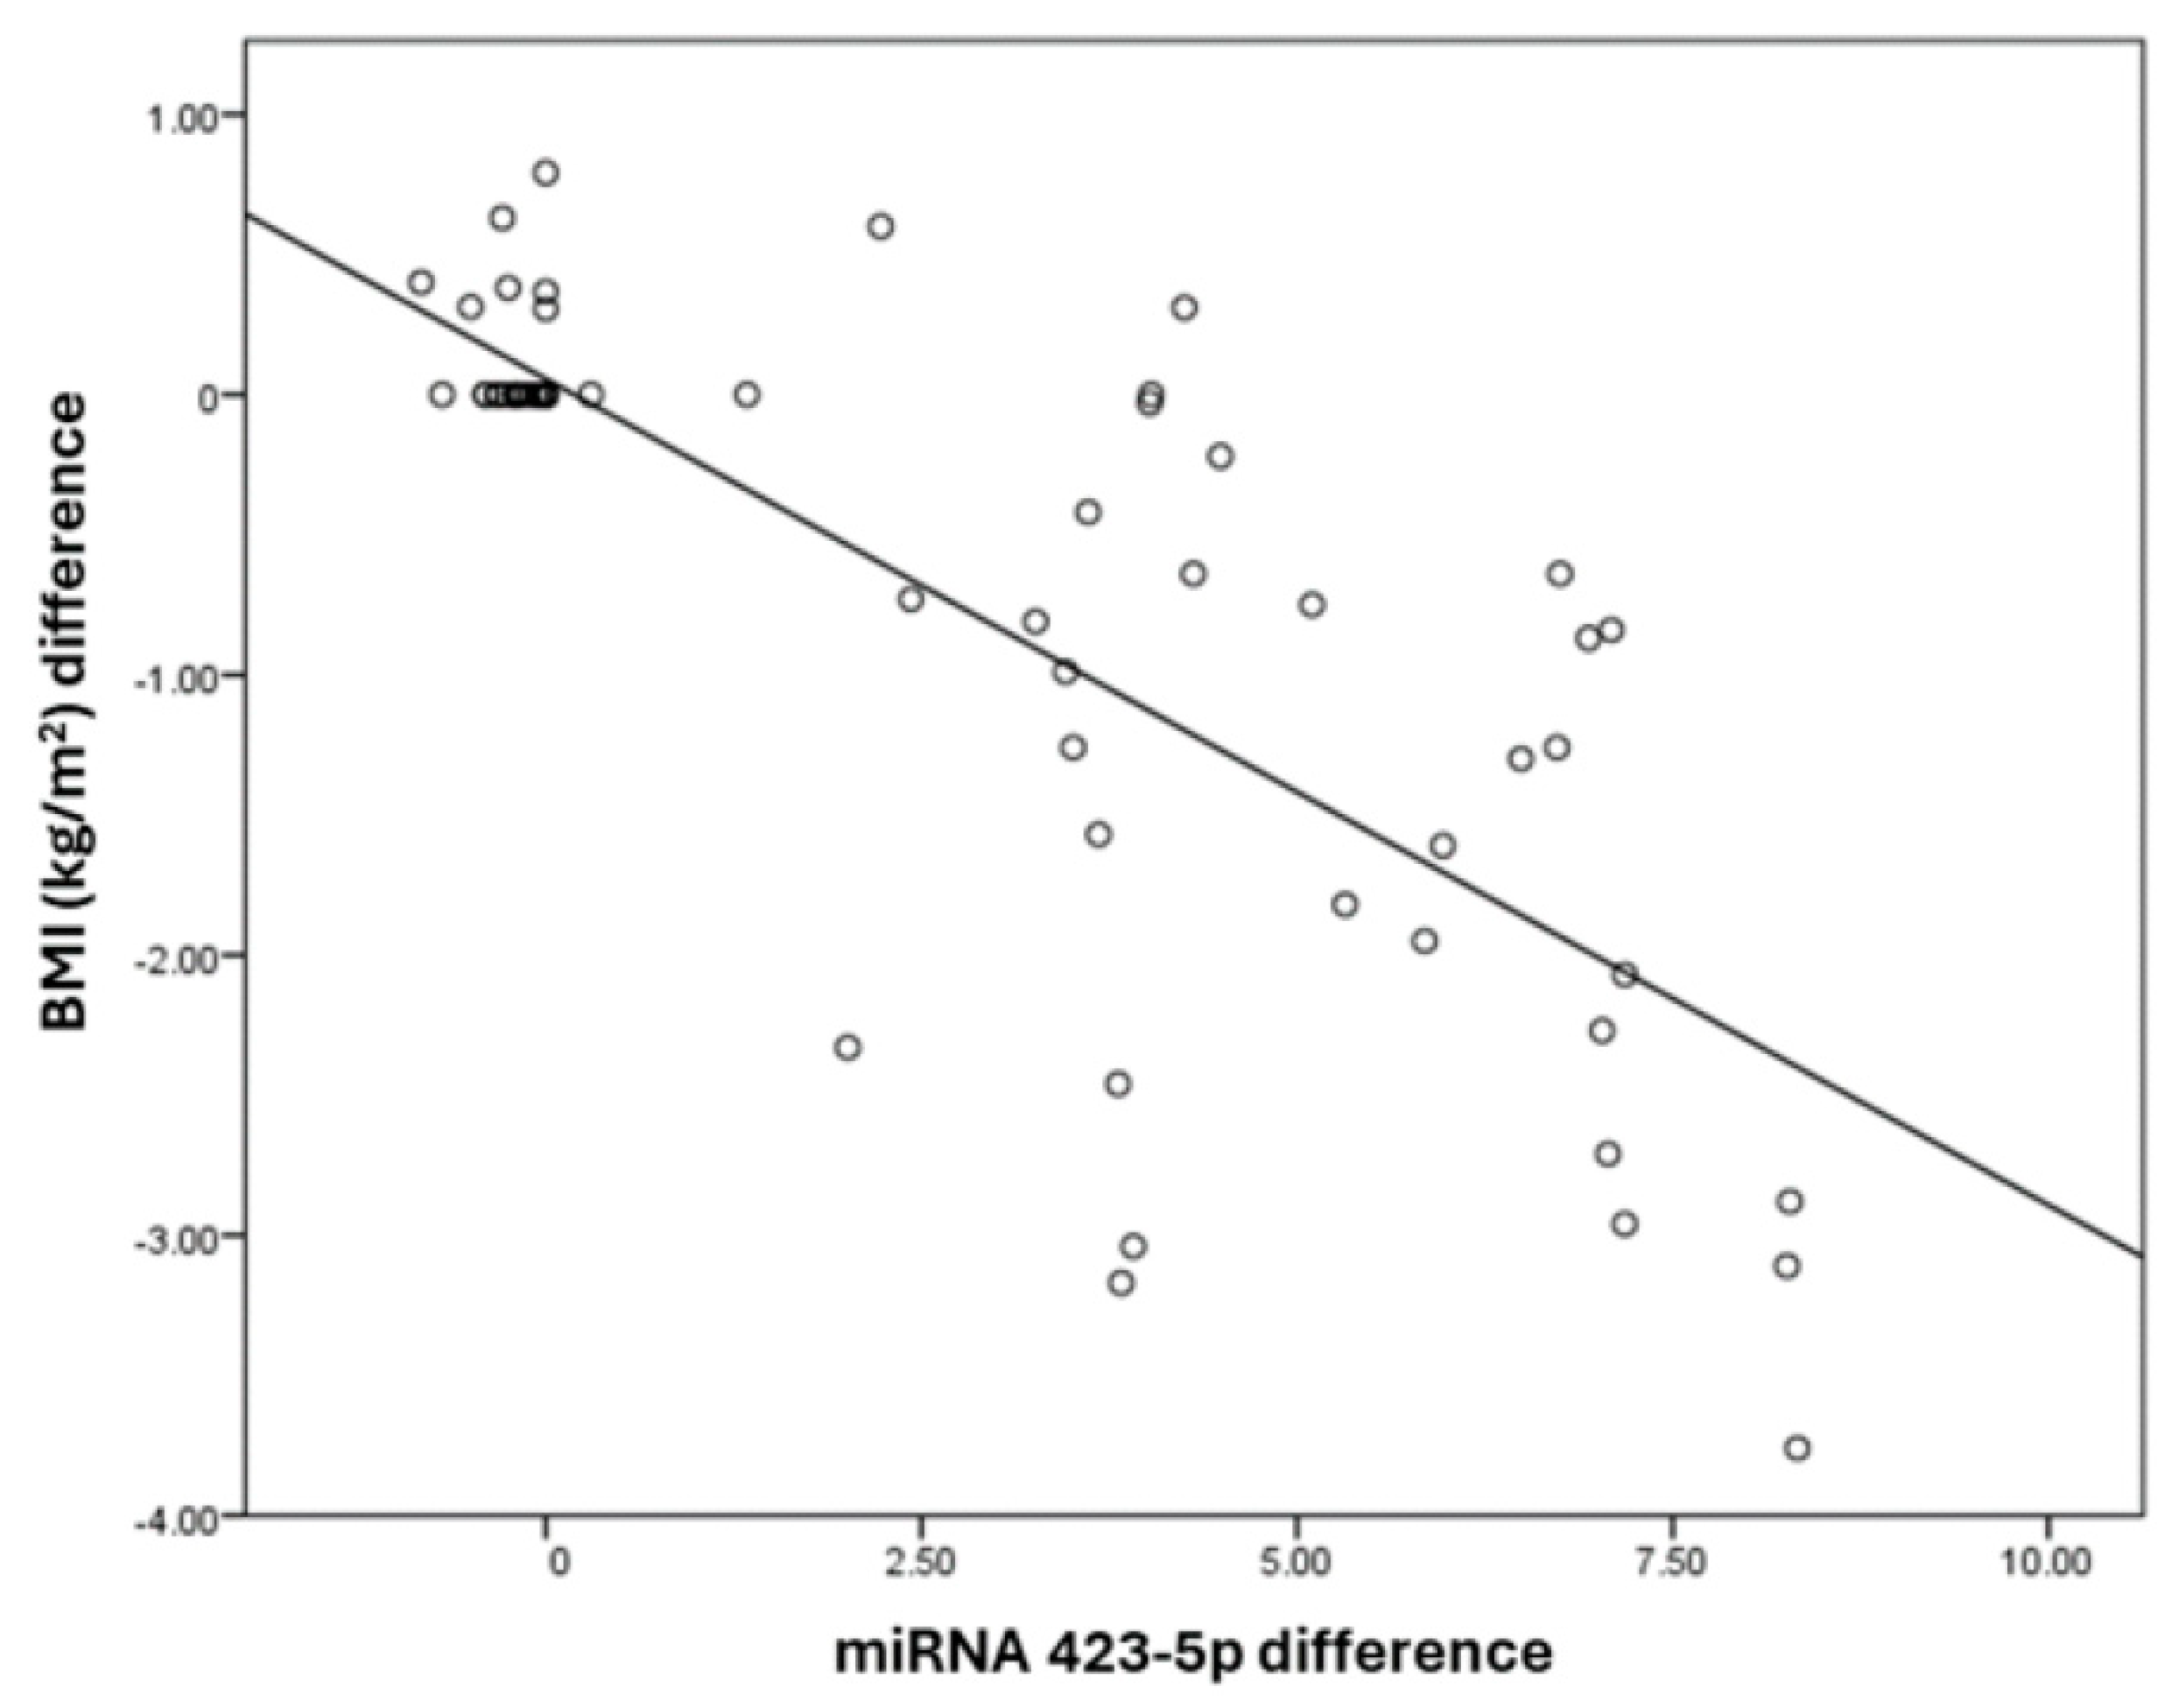
| Predictor for BMI (kg/m2) Difference | Correlation Coefficient “r” | B (95% C.I.) | p Value |
|---|---|---|---|
| miRNA 423-5p difference | −0.538 | −0.3 (−0.48–−0.12) | 0.002 |
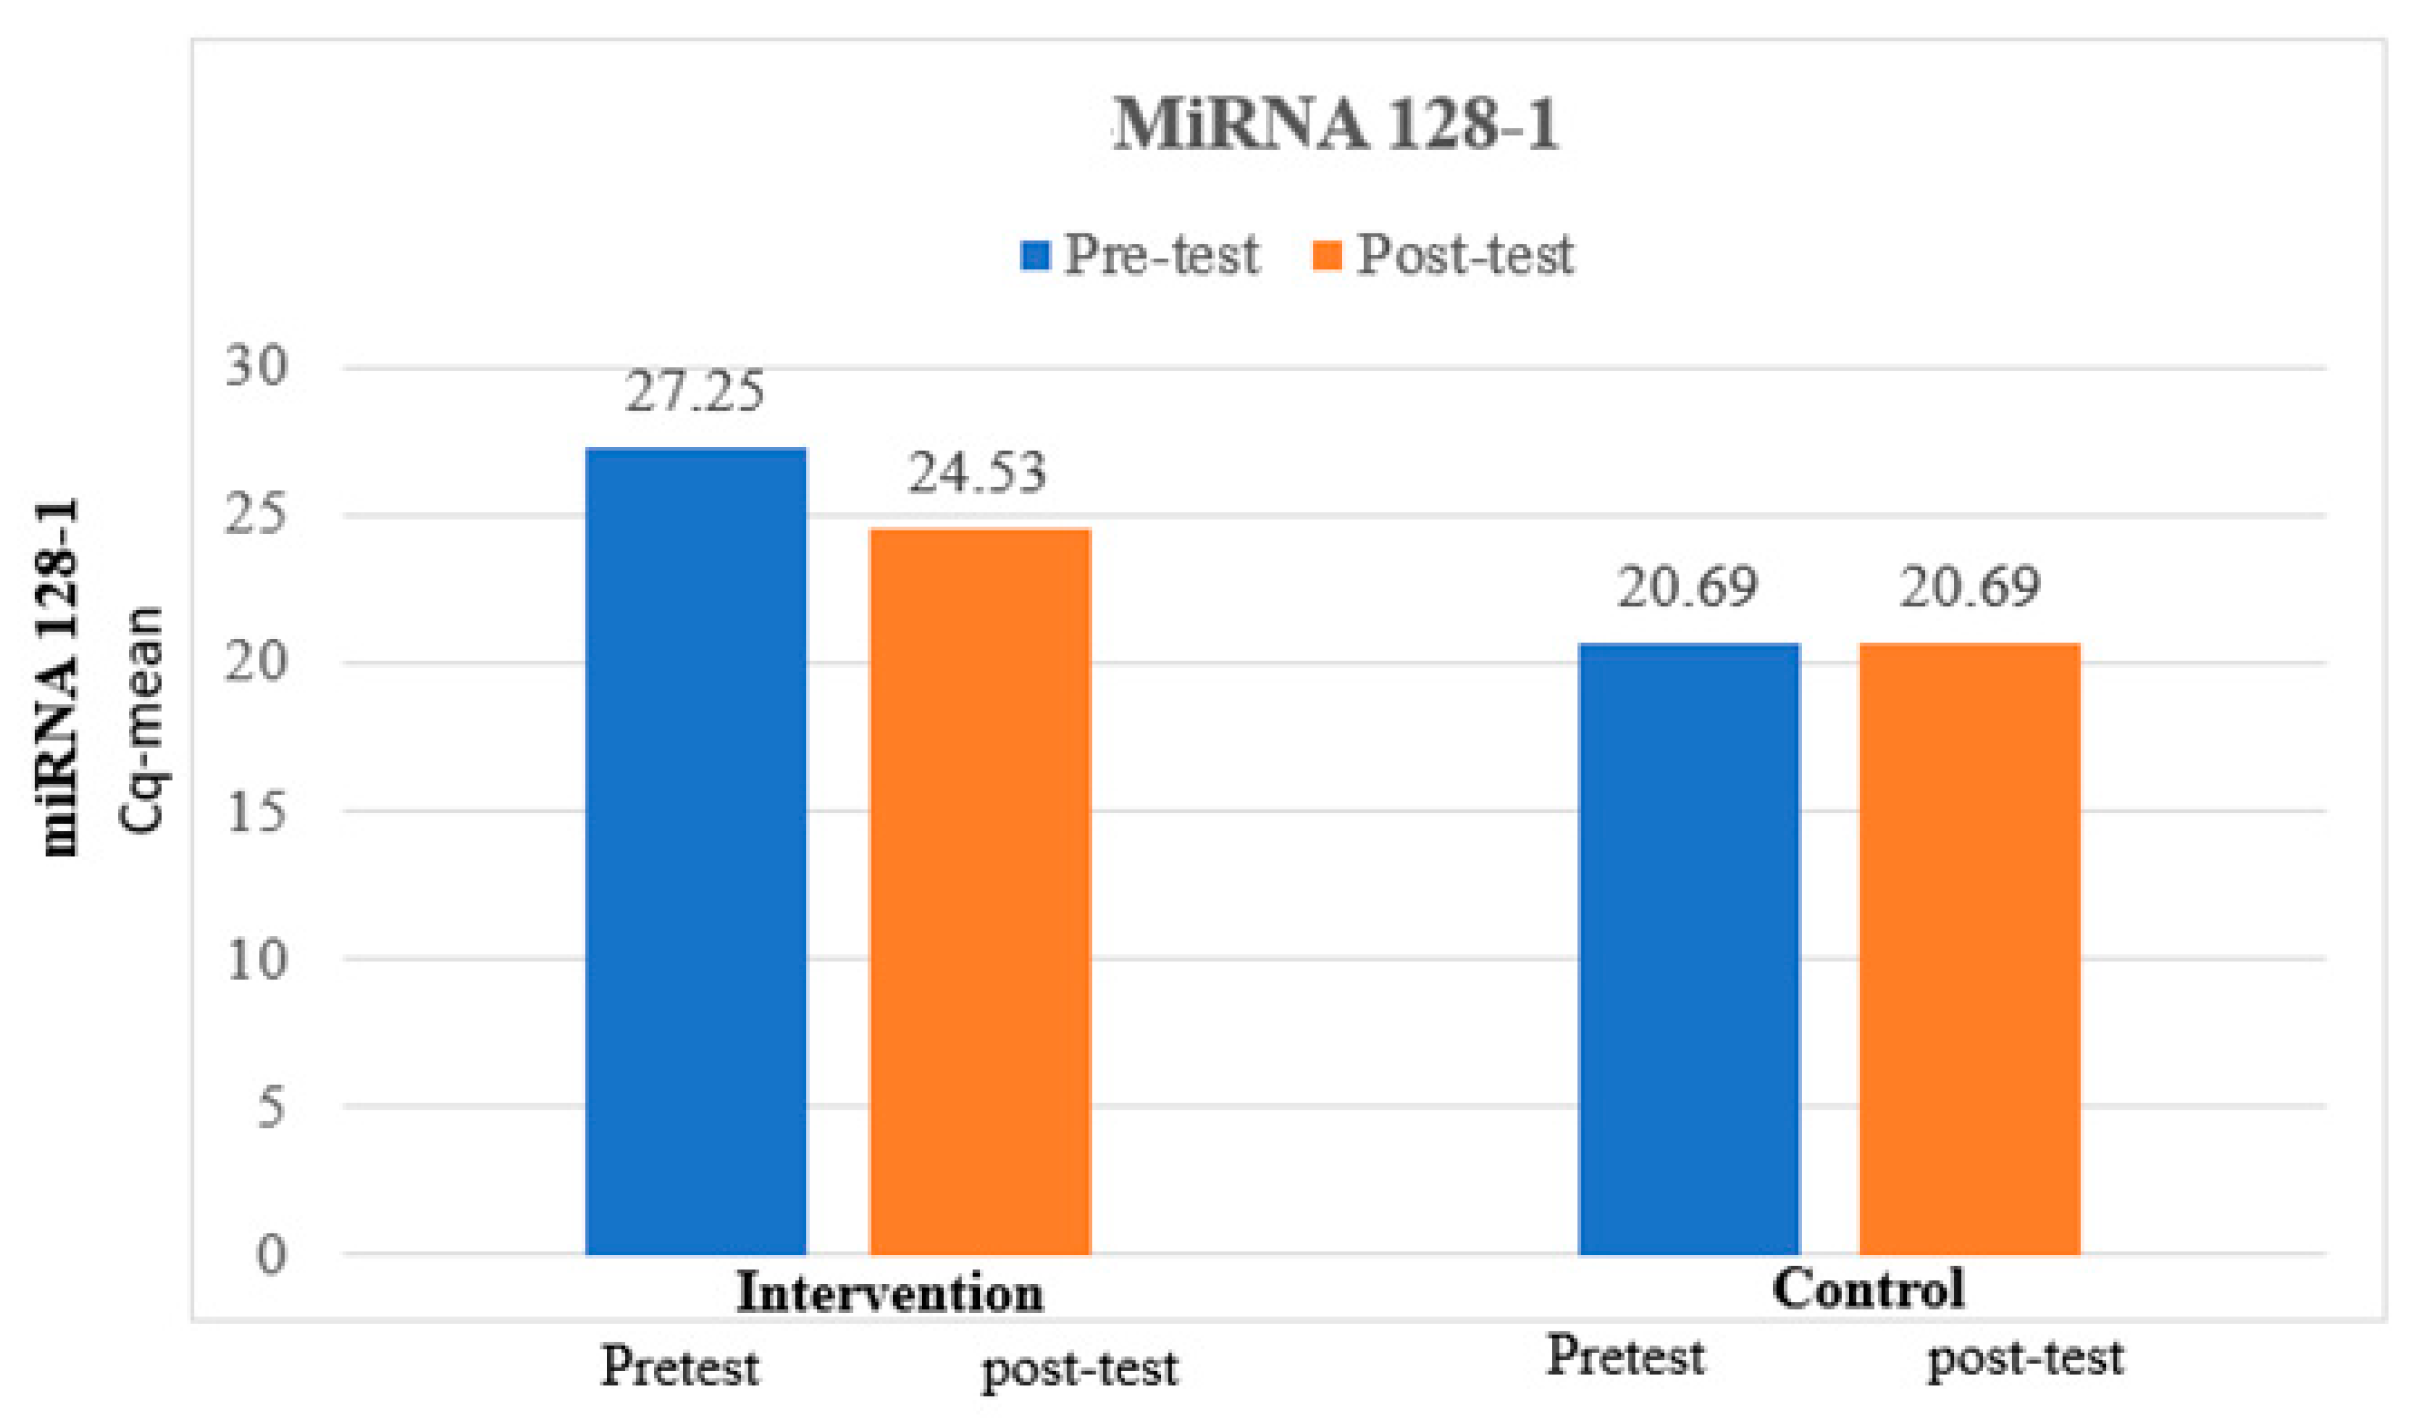
| Group | miRNA 128-1 | Mean Diff. | Paired ‘t’ Test p Value | |
|---|---|---|---|---|
| Pretest | Posttest | |||
| Intervention | 27.25 (±2.53) | 24.53 (±2.53) | 2.72 | 0.001 |
| Control | 20.69 (±1.43) | 20.69 (±1.43) | 0.005 | 0.989 |
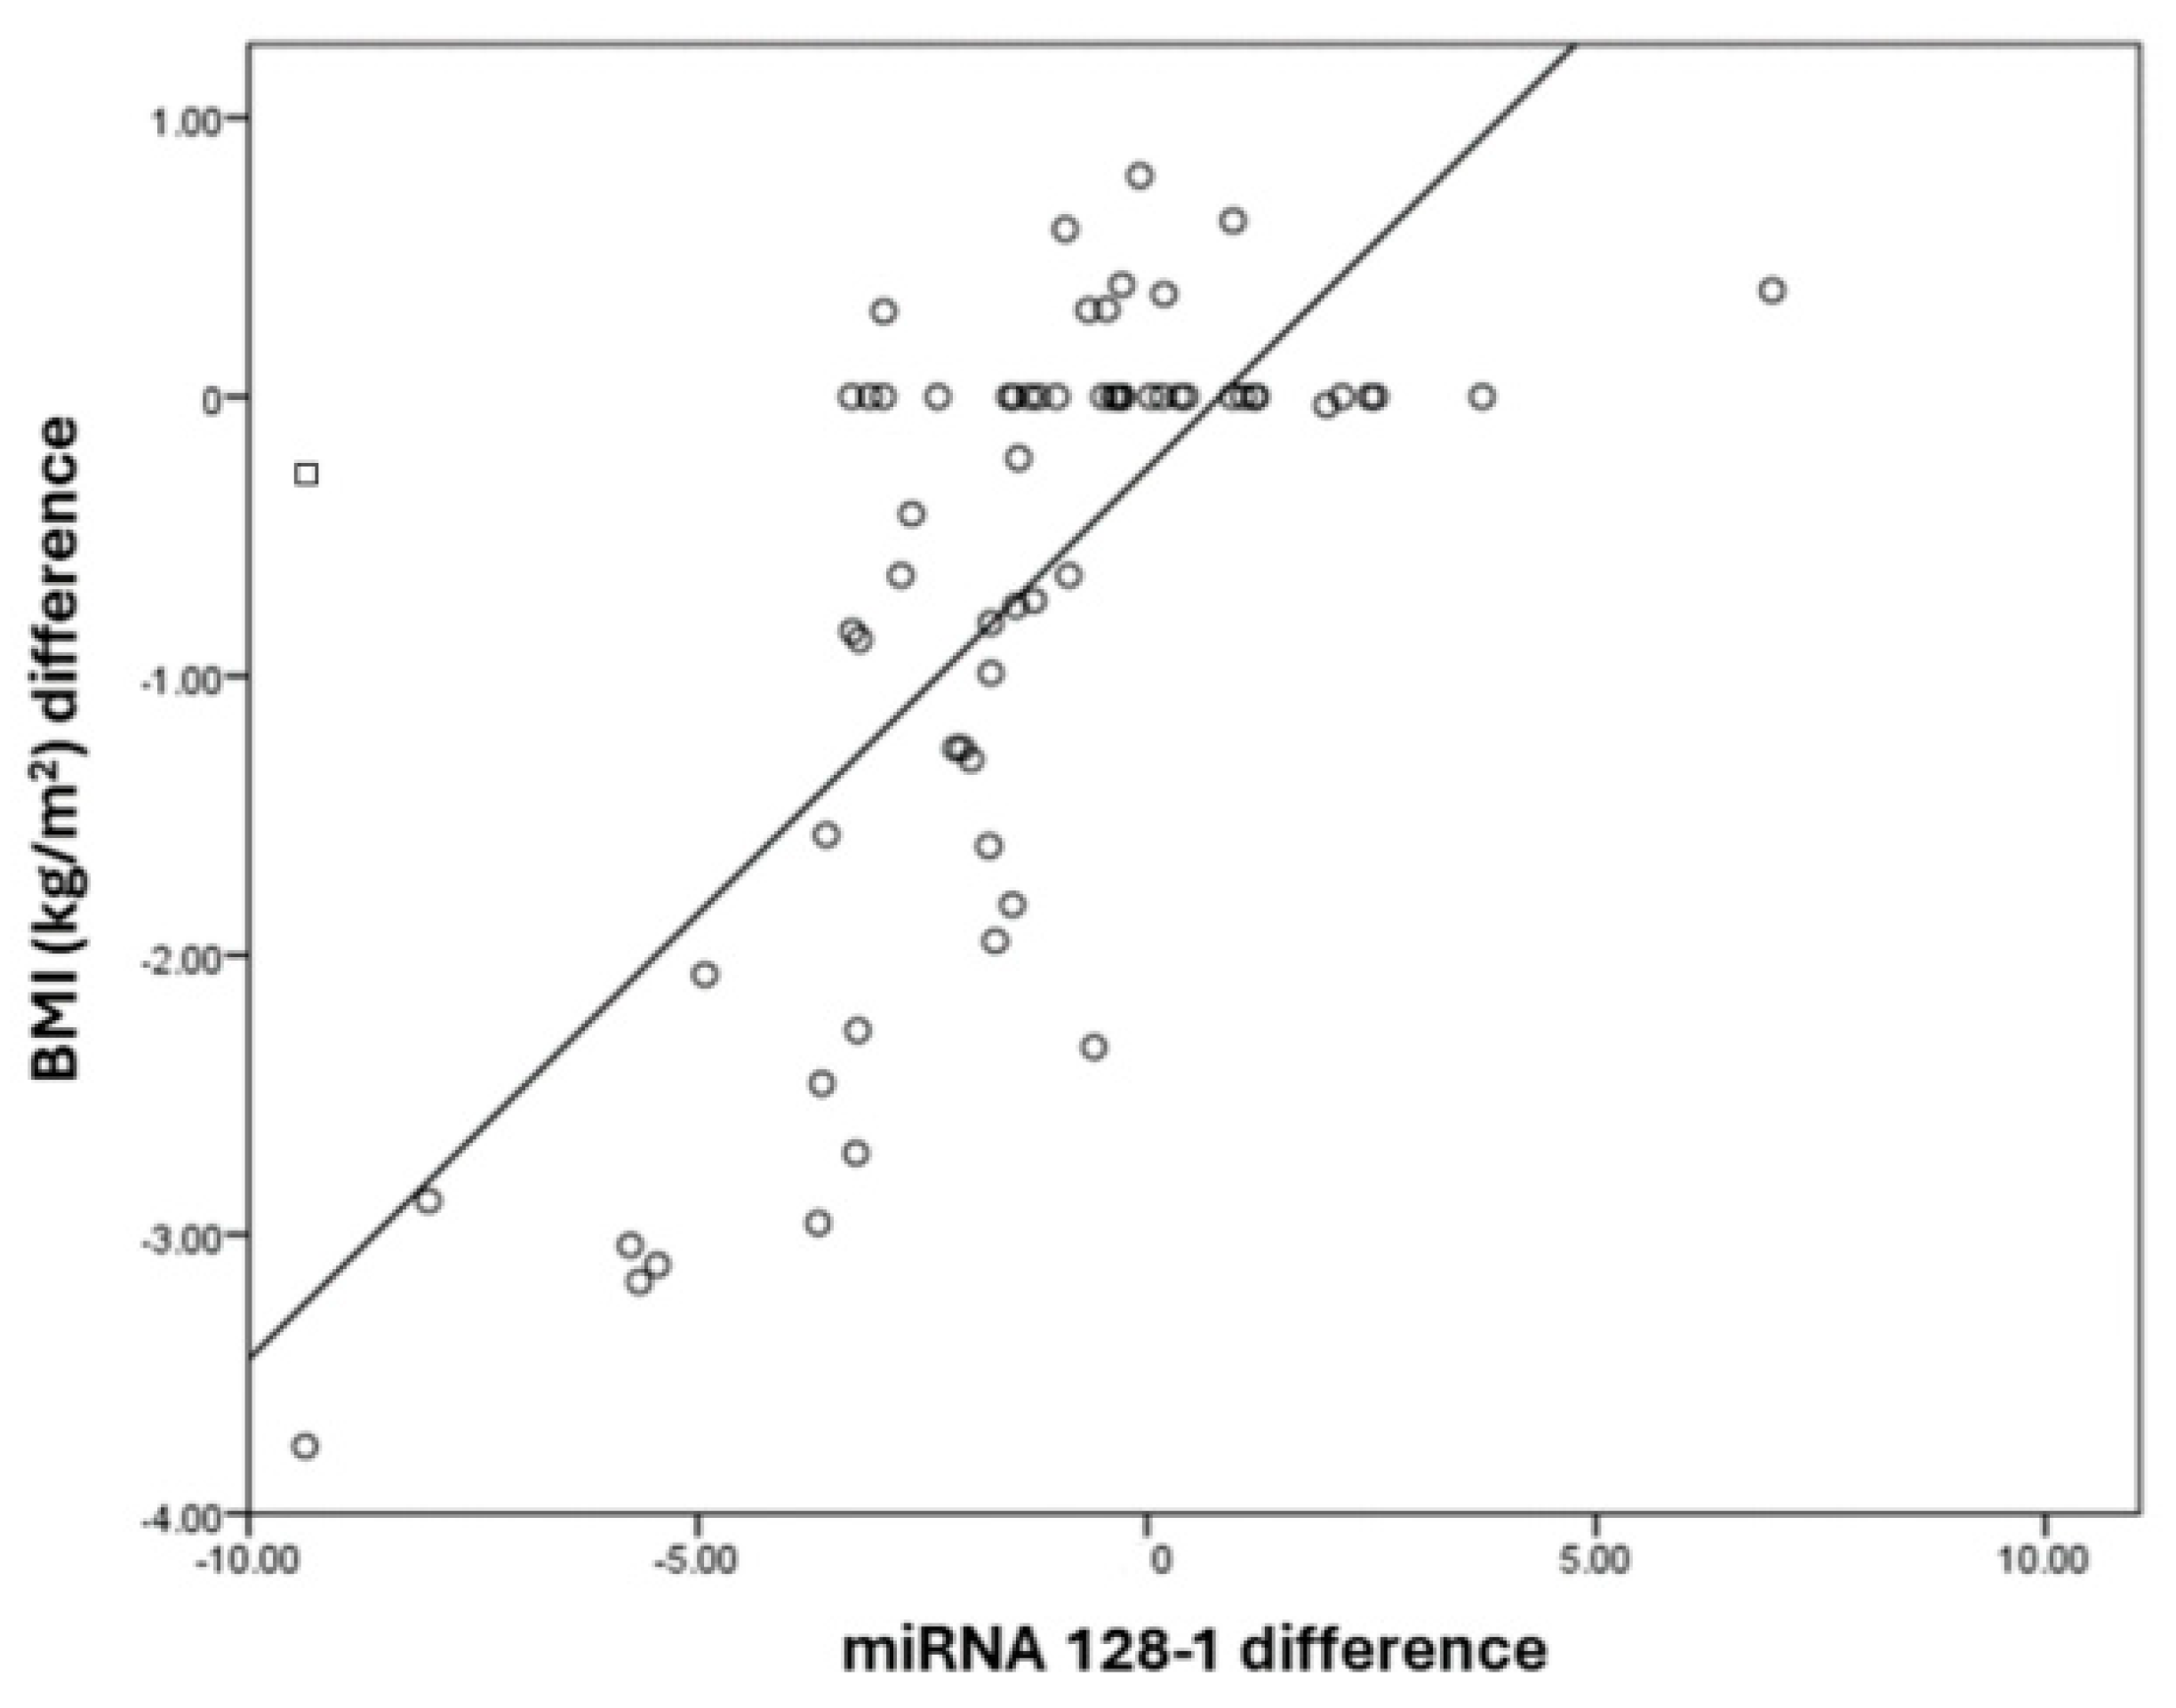
| Predictor for BMI (kg/m2) Difference | Correlation Coefficient “r” | B (95% C.I.) | p Value |
|---|---|---|---|
| miRNA128-1 difference | 0.786 | 0.395 (0.28–0.51) | 0.000 |
Disclaimer/Publisher’s Note: The statements, opinions and data contained in all publications are solely those of the individual author(s) and contributor(s) and not of MDPI and/or the editor(s). MDPI and/or the editor(s) disclaim responsibility for any injury to people or property resulting from any ideas, methods, instructions or products referred to in the content. |
© 2024 by the authors. Licensee MDPI, Basel, Switzerland. This article is an open access article distributed under the terms and conditions of the Creative Commons Attribution (CC BY) license (https://creativecommons.org/licenses/by/4.0/).
Share and Cite
Hillari Raj, P.; Subramanian, P.; Nehru, M.; Ayyavoo, S.; Annamalai, N.; Prabhu, V. Therapeutic Impact of Aerobic Exercise on Adolescents with Obesity and Its Association with Expression of miRNAs and Cytokines: A Clinical Approach. Medicina 2024, 60, 459. https://doi.org/10.3390/medicina60030459
Hillari Raj P, Subramanian P, Nehru M, Ayyavoo S, Annamalai N, Prabhu V. Therapeutic Impact of Aerobic Exercise on Adolescents with Obesity and Its Association with Expression of miRNAs and Cytokines: A Clinical Approach. Medicina. 2024; 60(3):459. https://doi.org/10.3390/medicina60030459
Chicago/Turabian StyleHillari Raj, Petricia, Prasanth Subramanian, Mohanraj Nehru, Saravanan Ayyavoo, Nachal Annamalai, and Venkataraman Prabhu. 2024. "Therapeutic Impact of Aerobic Exercise on Adolescents with Obesity and Its Association with Expression of miRNAs and Cytokines: A Clinical Approach" Medicina 60, no. 3: 459. https://doi.org/10.3390/medicina60030459
APA StyleHillari Raj, P., Subramanian, P., Nehru, M., Ayyavoo, S., Annamalai, N., & Prabhu, V. (2024). Therapeutic Impact of Aerobic Exercise on Adolescents with Obesity and Its Association with Expression of miRNAs and Cytokines: A Clinical Approach. Medicina, 60(3), 459. https://doi.org/10.3390/medicina60030459