
Assessing the Tibial Tubercle–Posterior Intercondylar Eminence Distance as a Superior Indicator for Patellar Instability and Surgical Planning in Tibial Tubercle Osteotomy
 ,
,
Abstract
1. Introduction
2. Materials and Methods
2.1. Study Participants
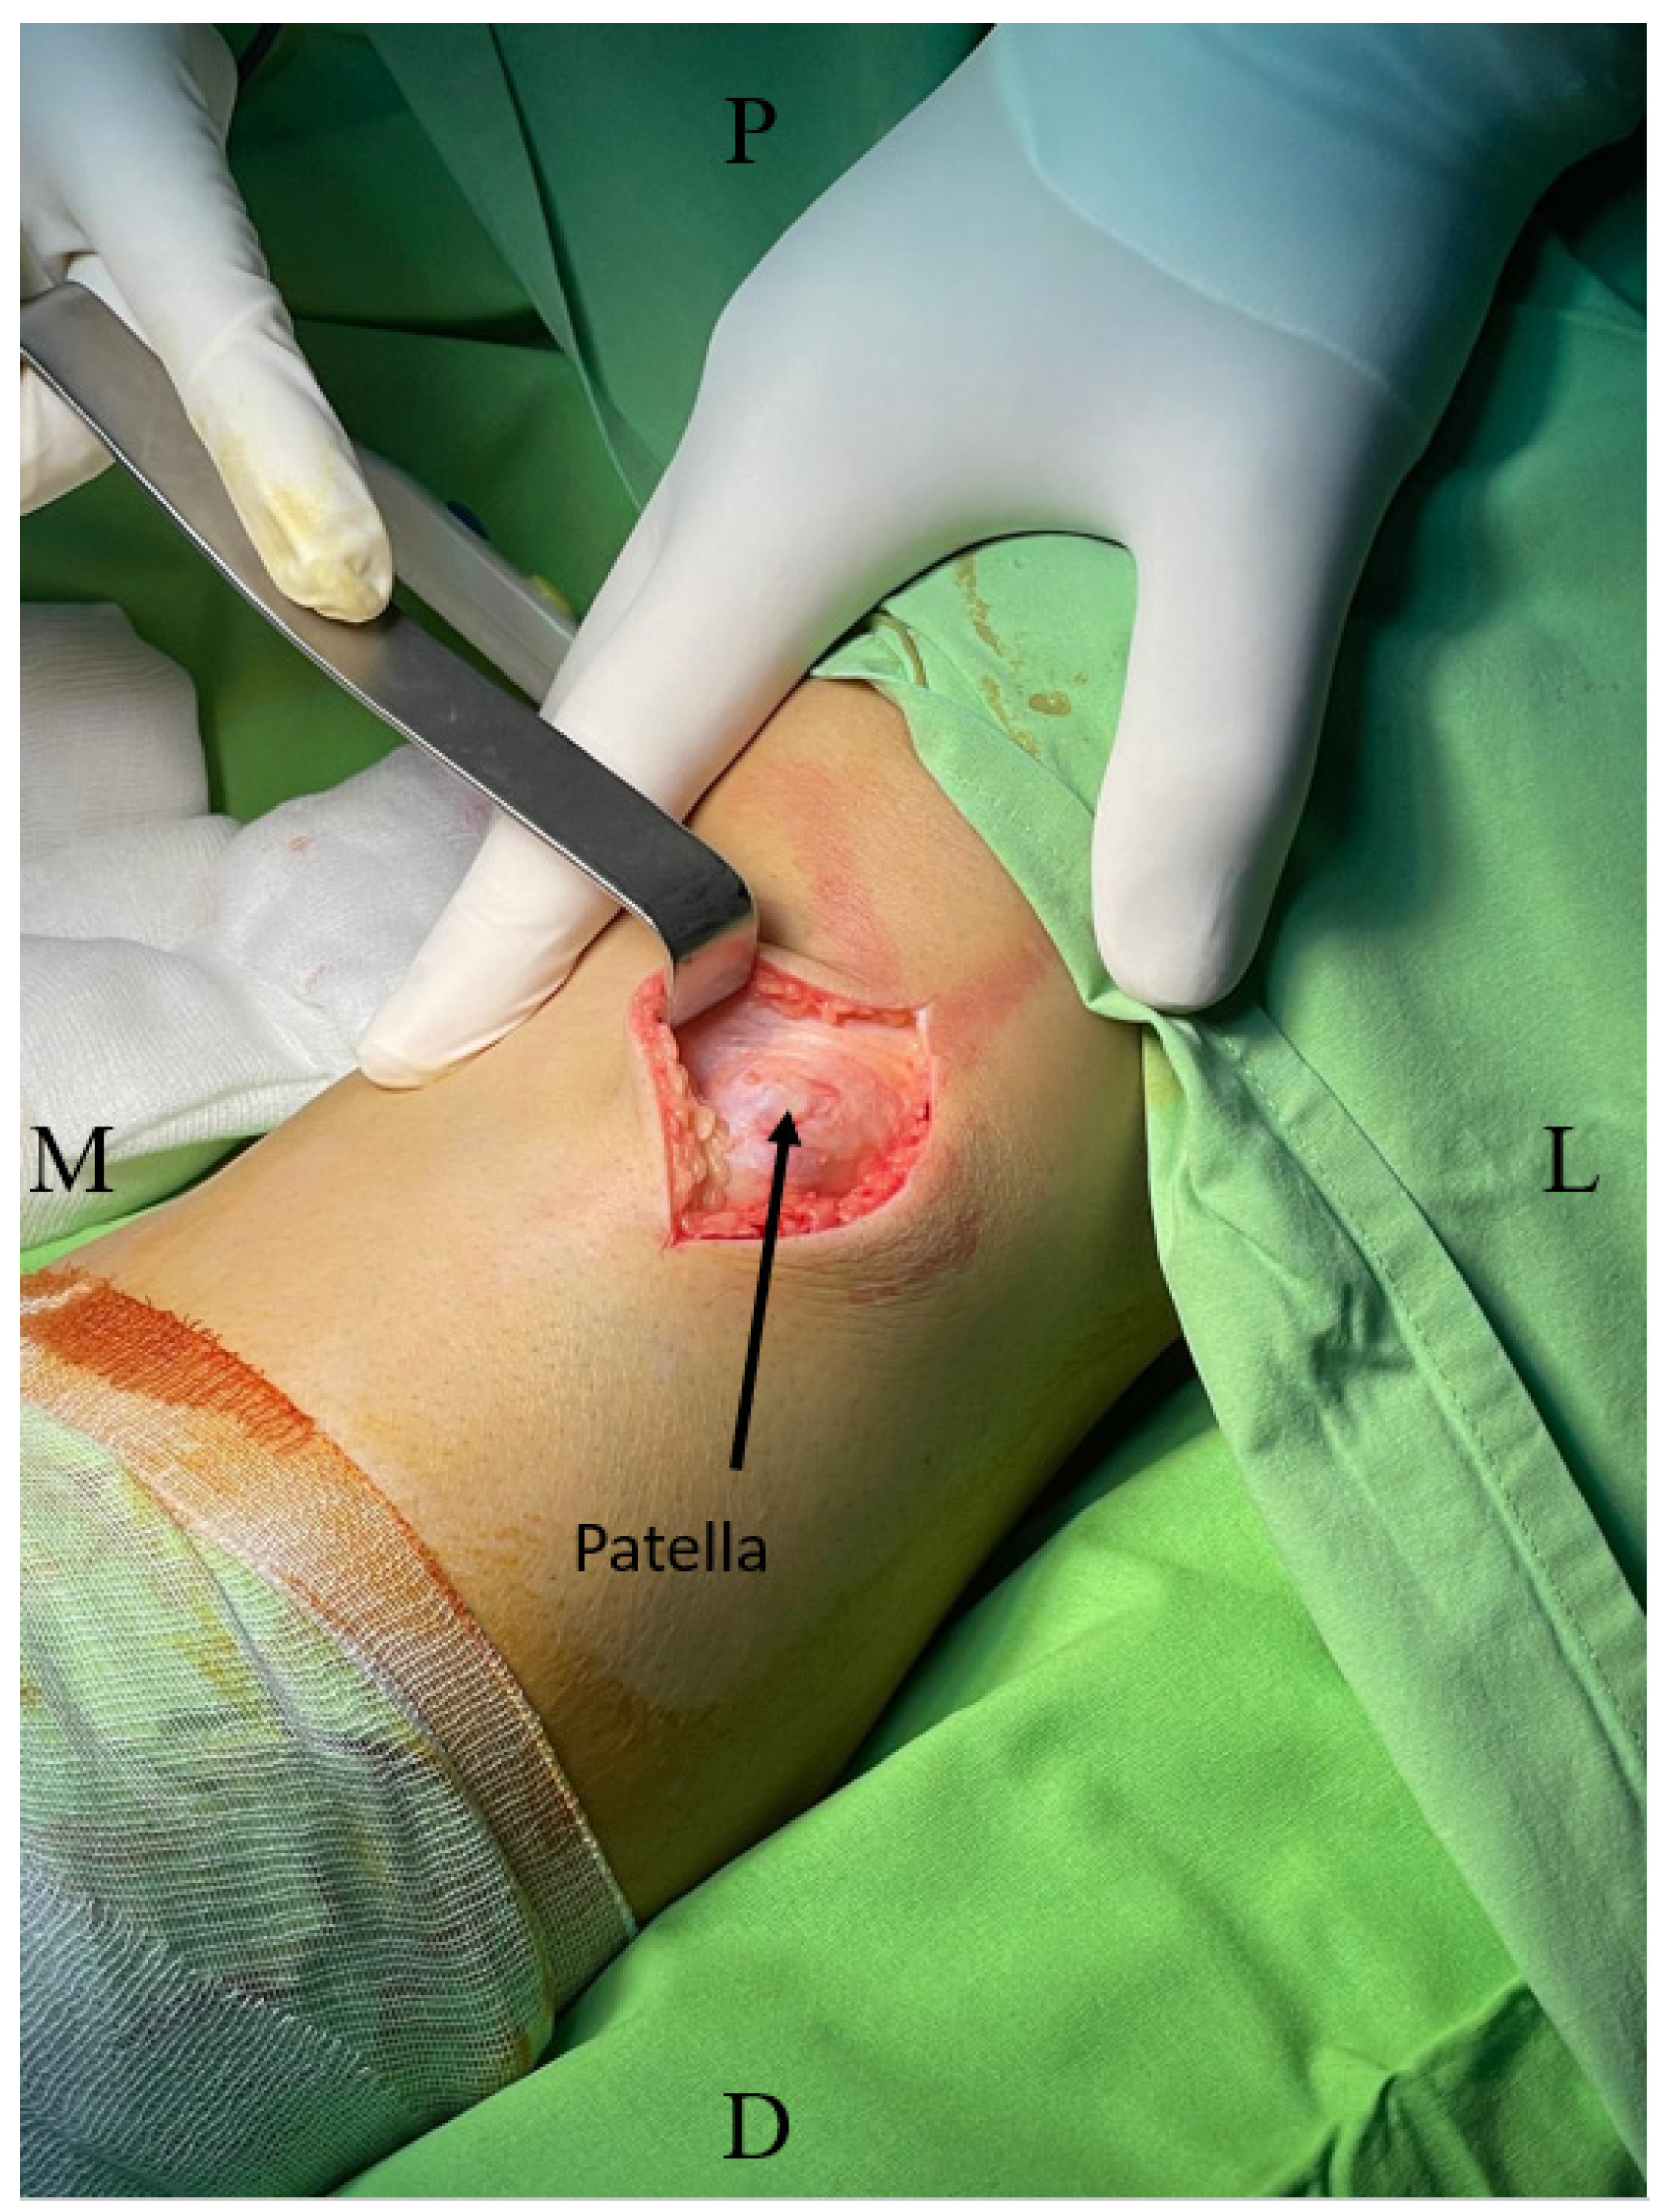
2.2. Surgical Procedure
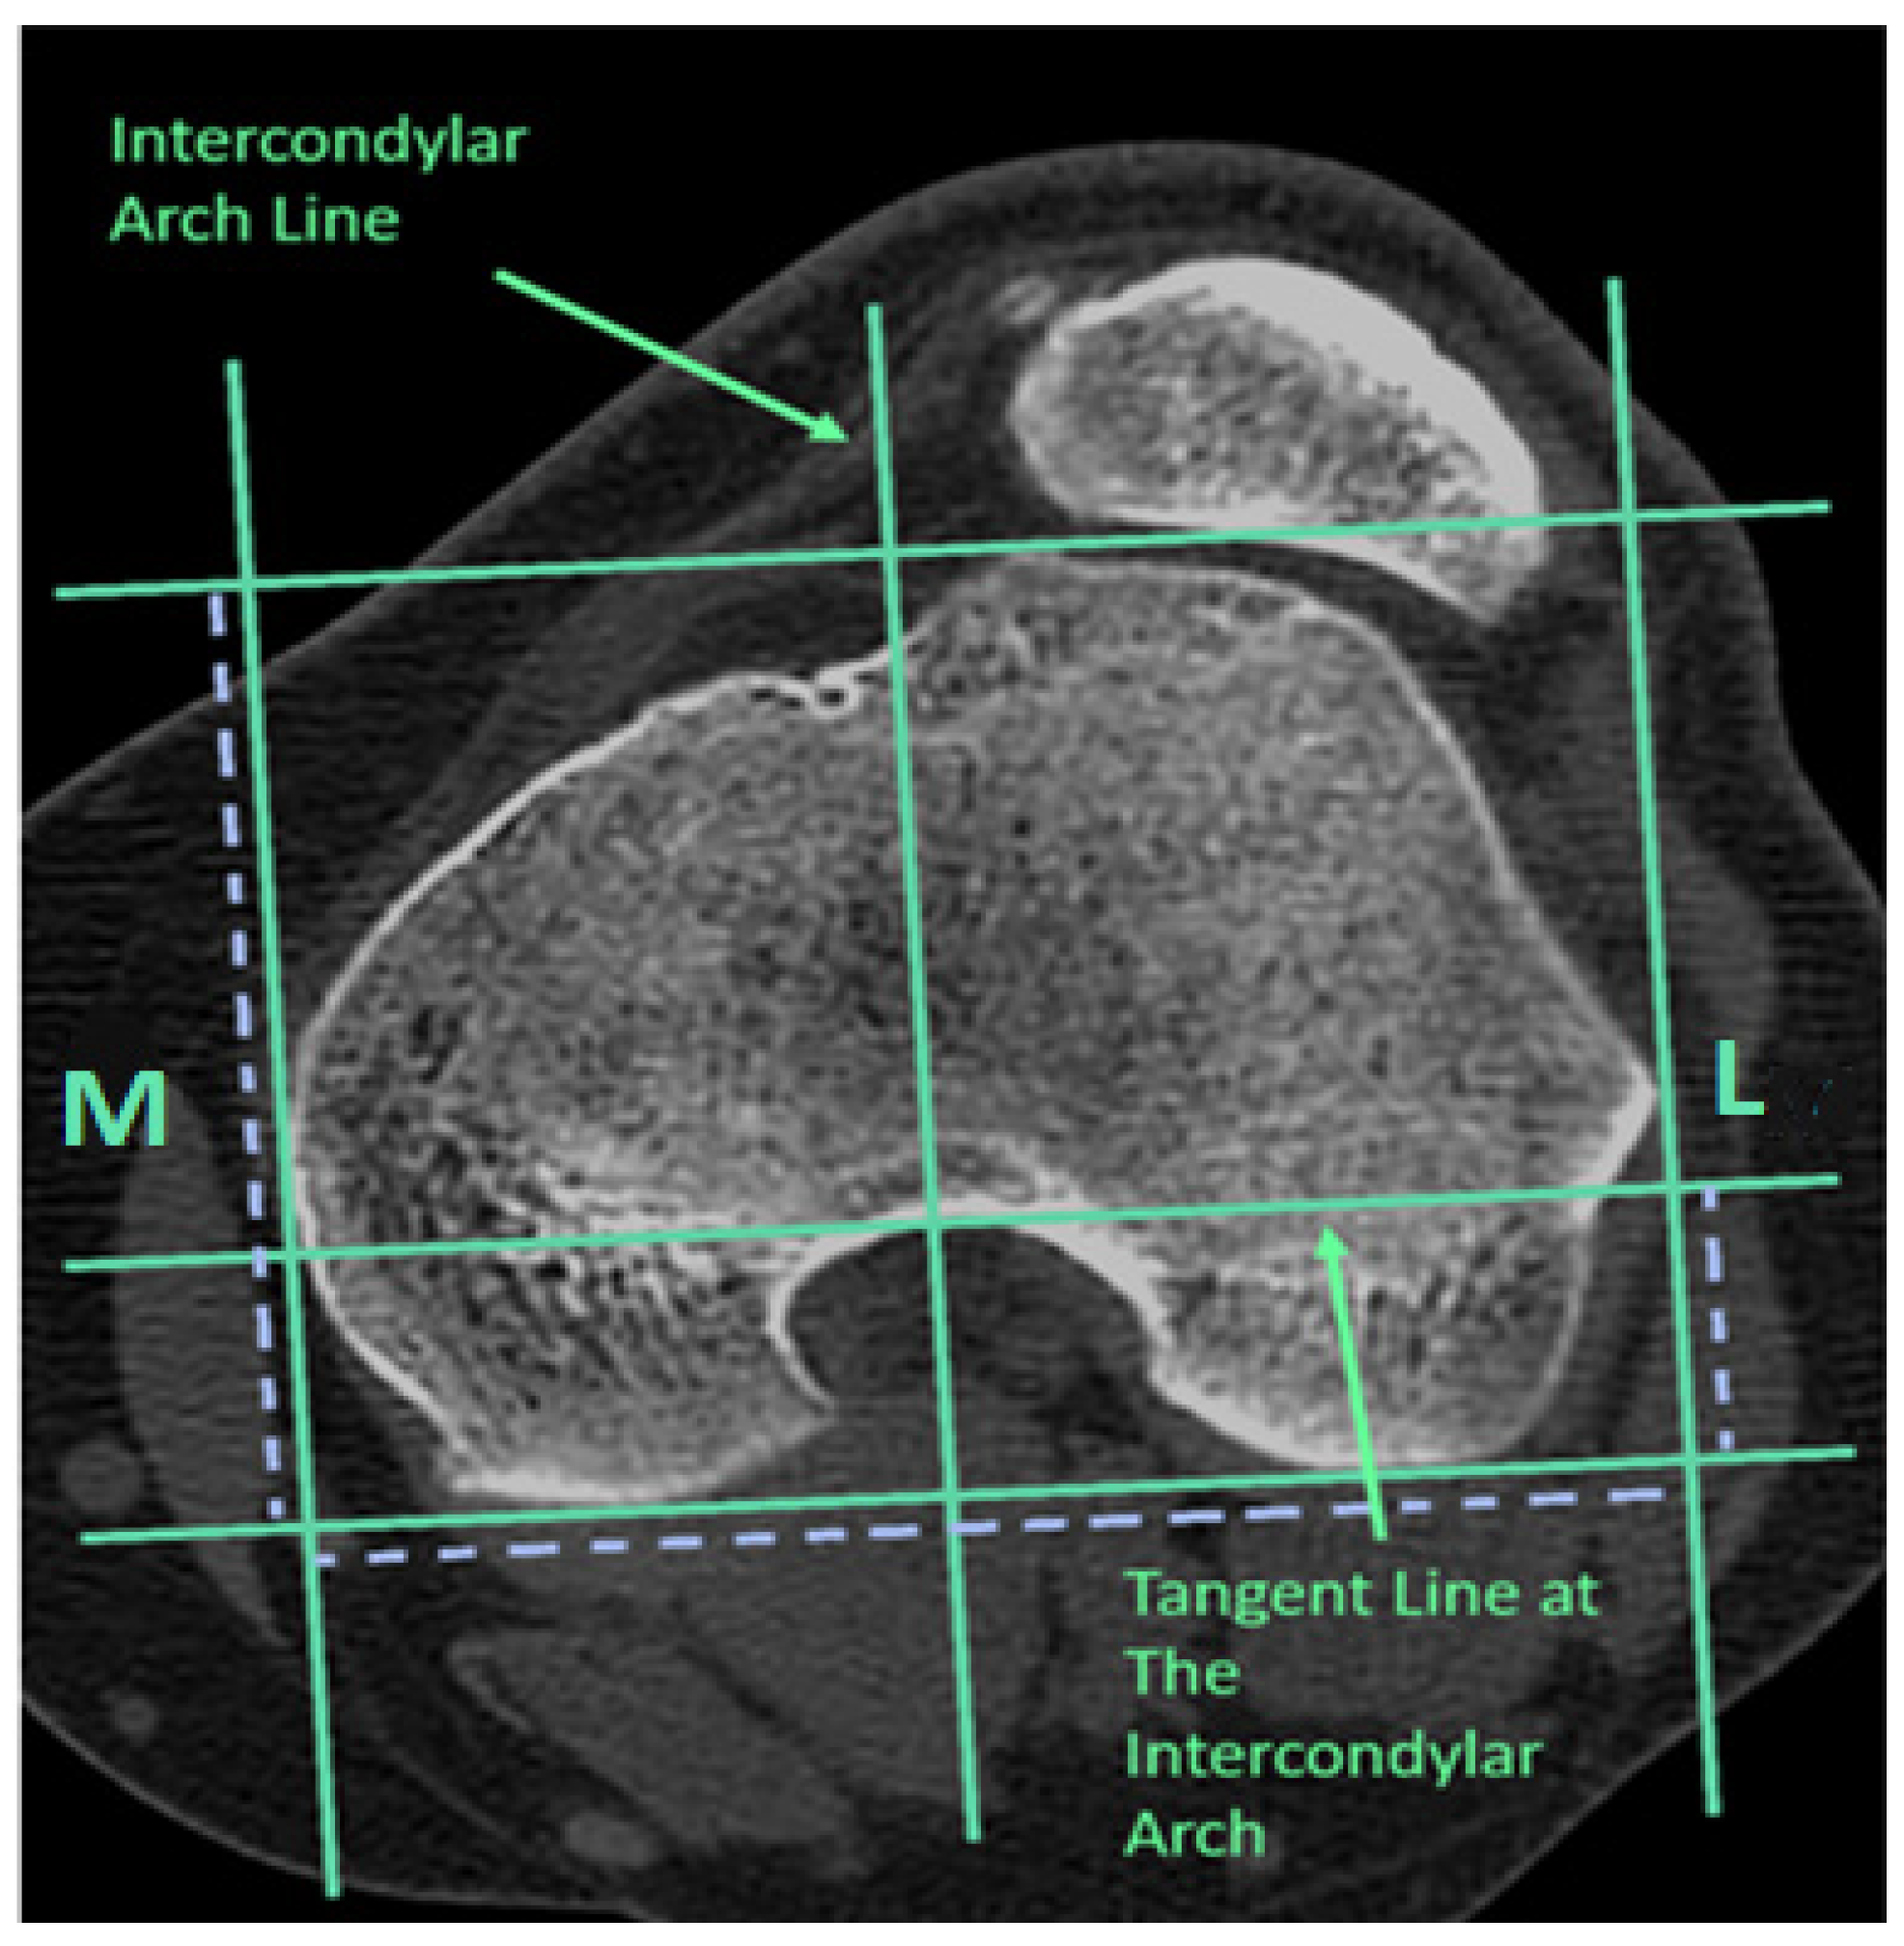
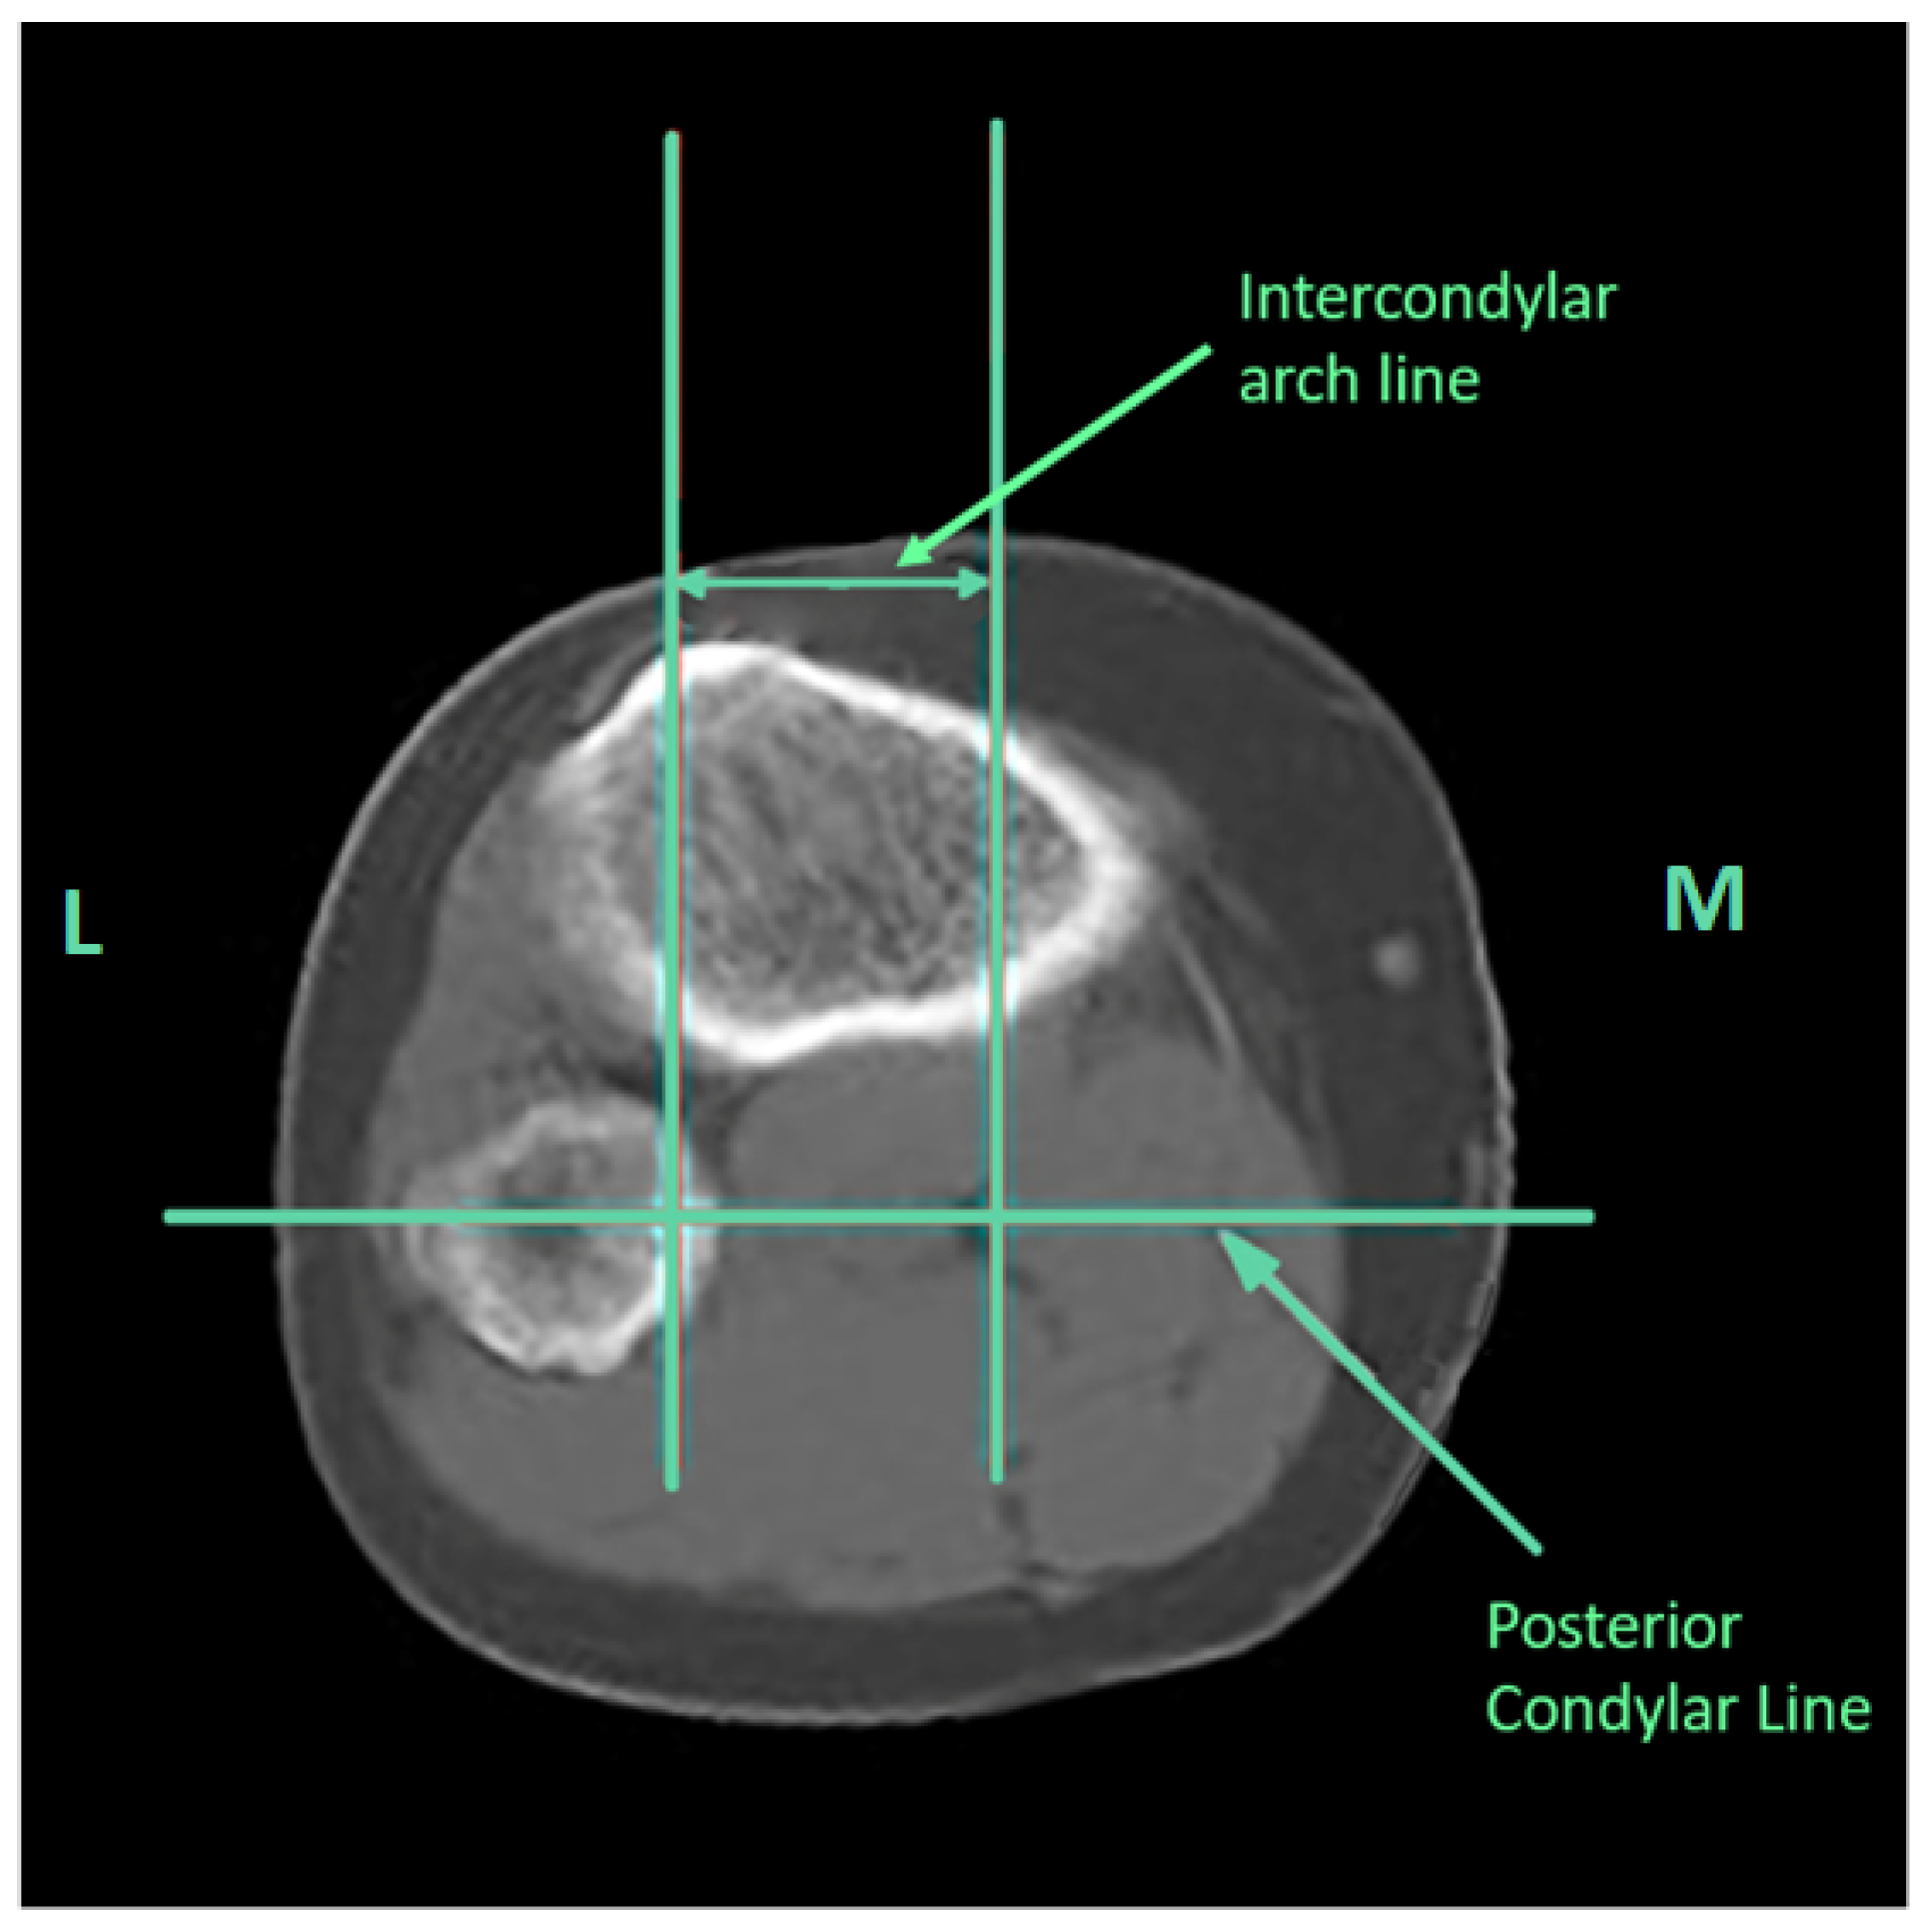
2.3. Diagnostic Assessments and Measurement Techniques
2.4. Statistical Analysis
3. Results
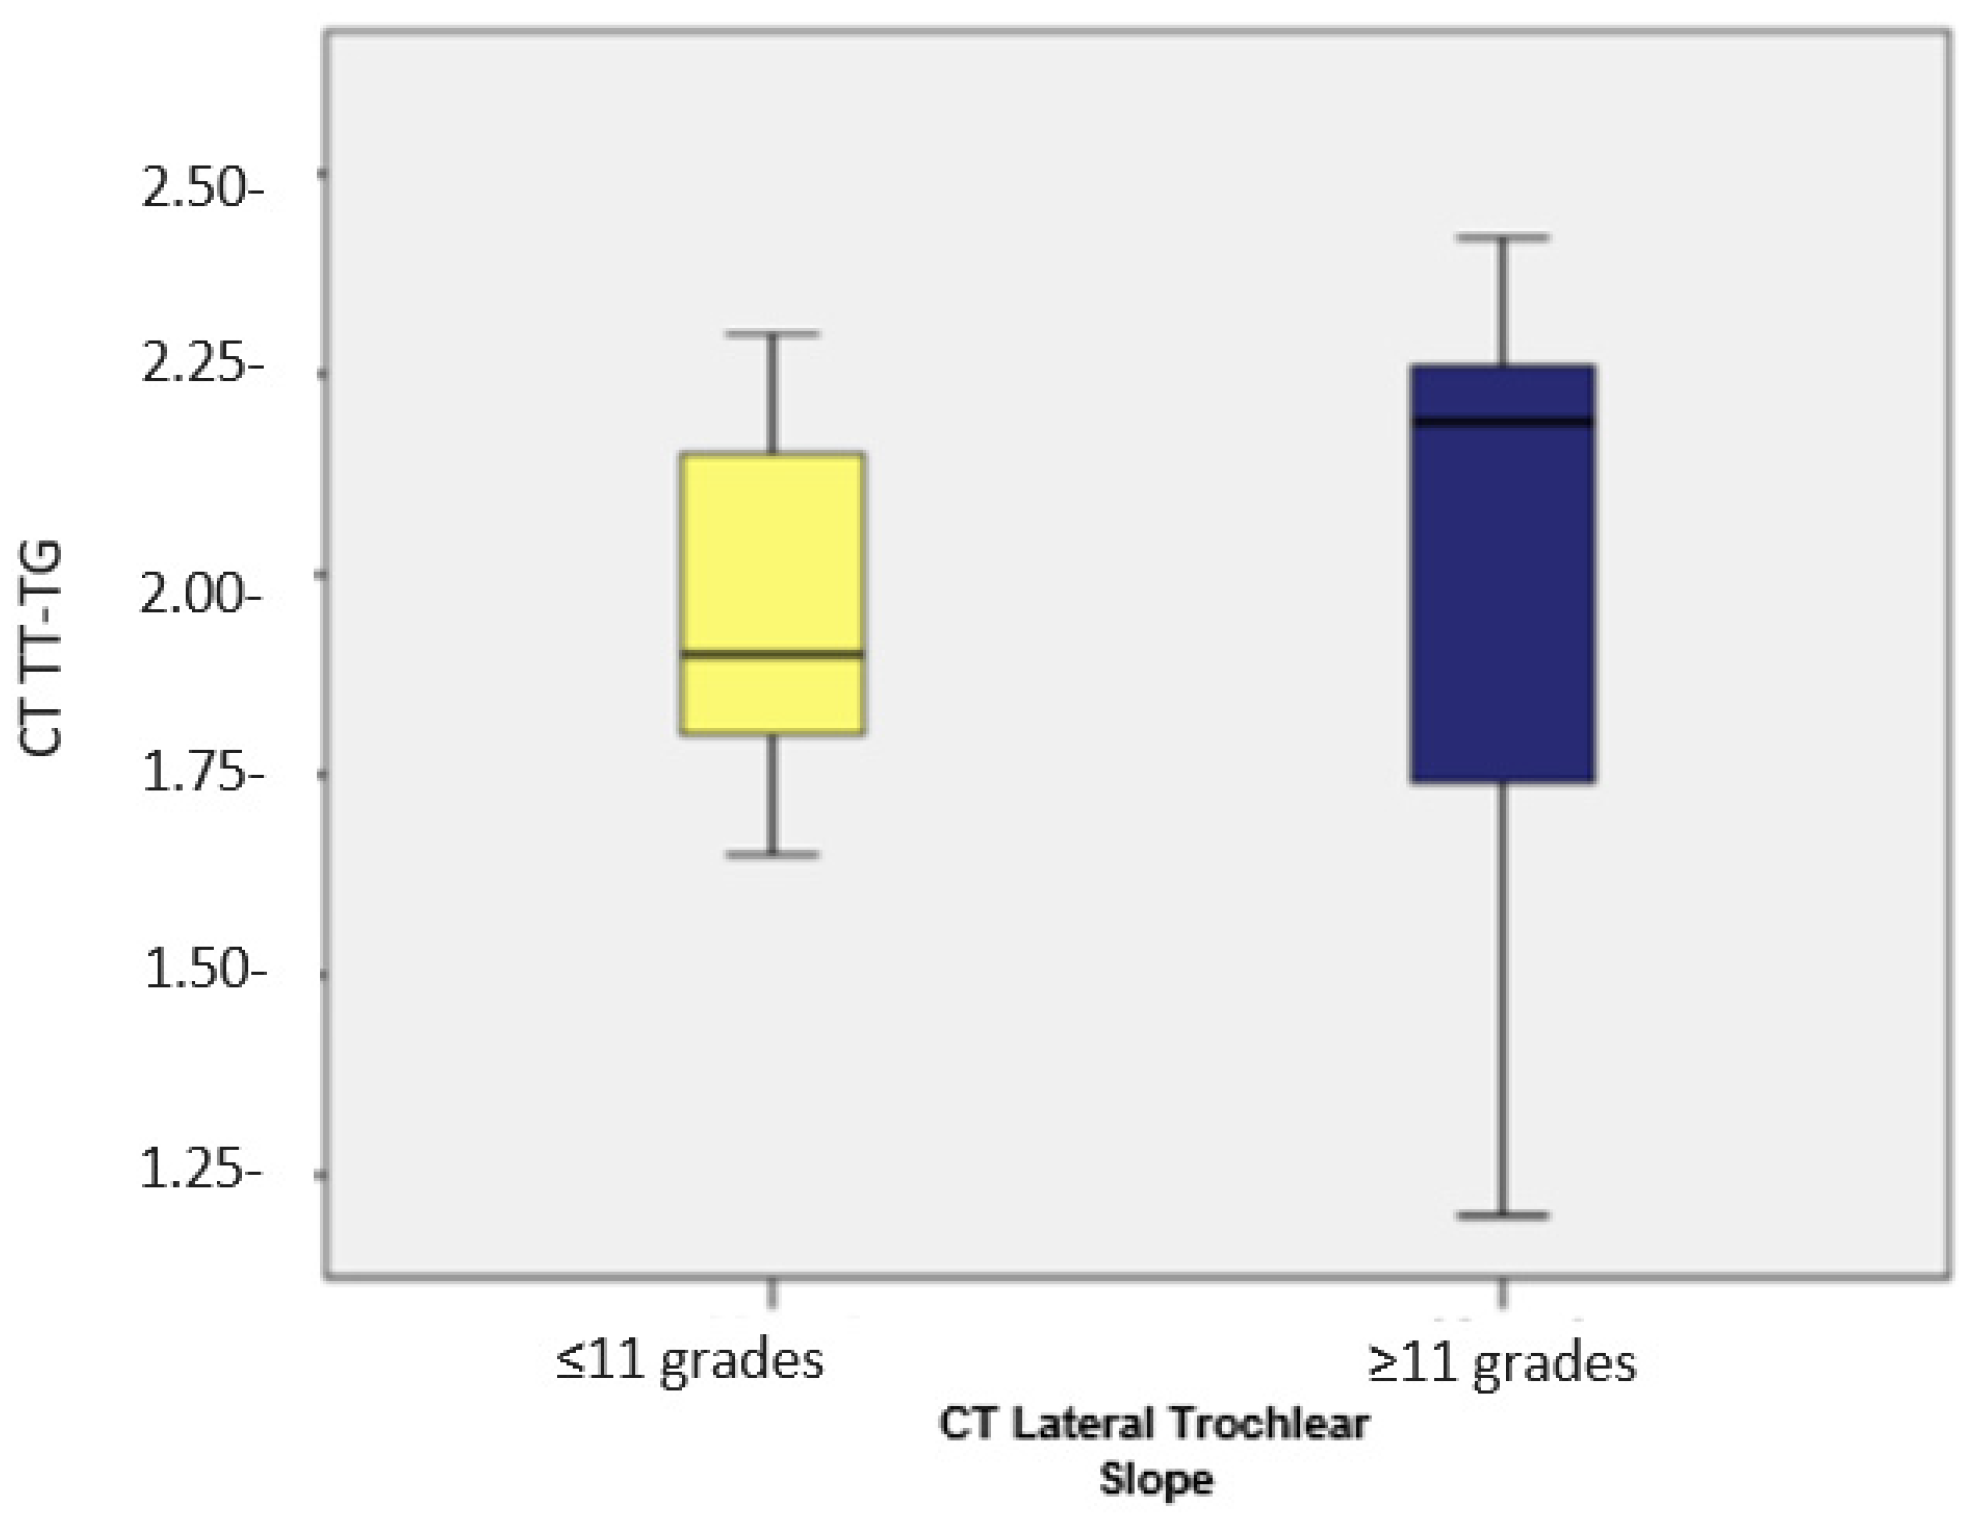
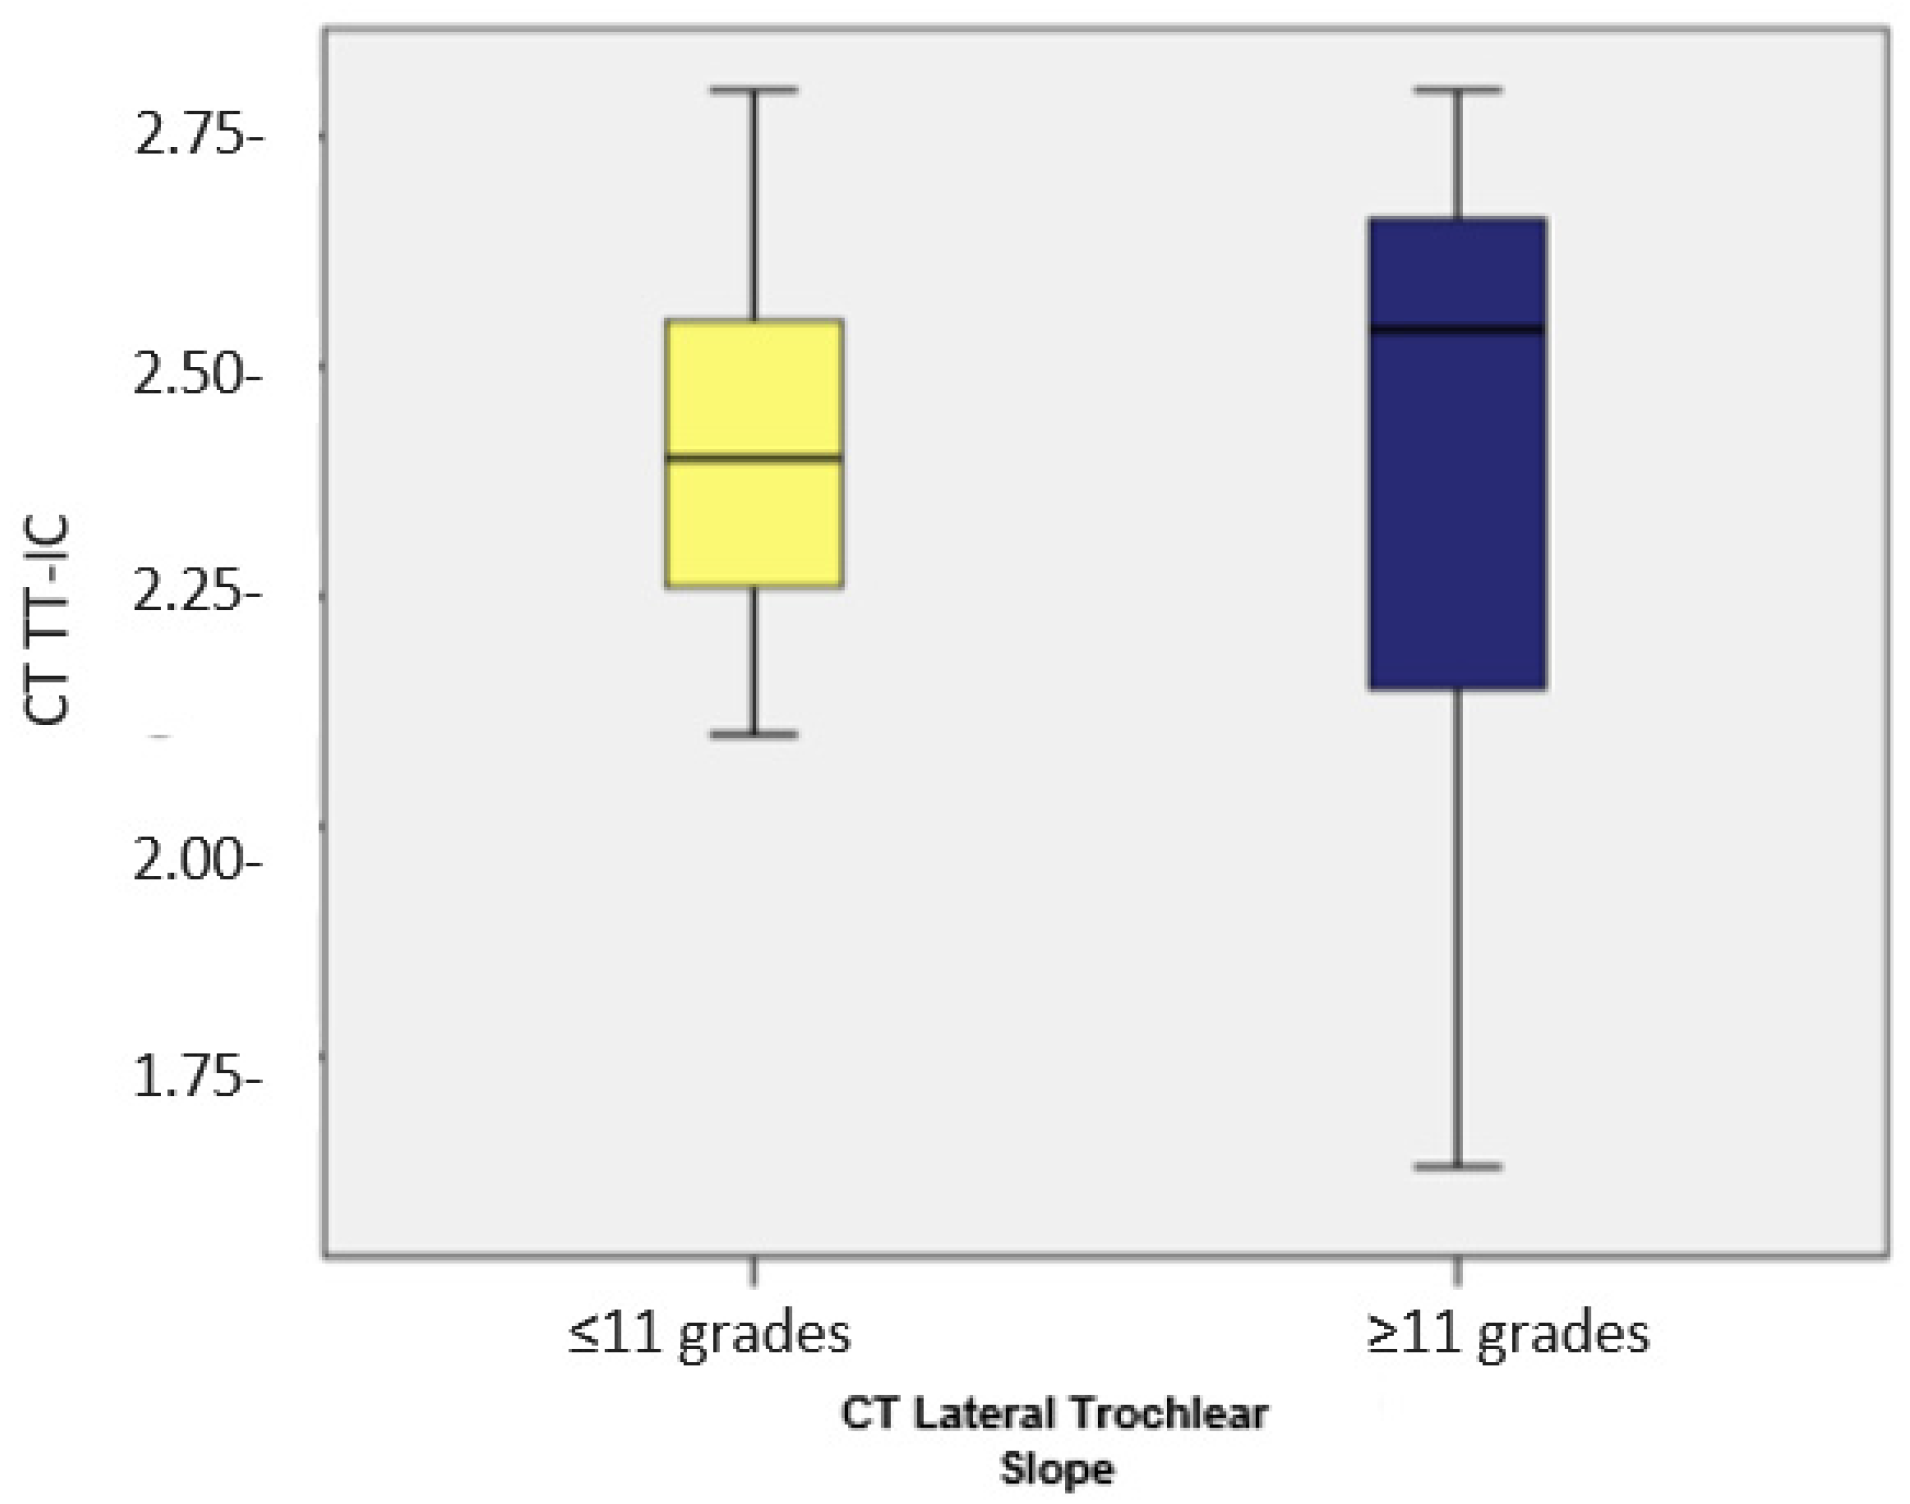
3.1. Assessment of the Lateral Trochlear Slope and Its Association with TT-IC by CT
3.2. Assessing Trochlear Facet Asymmetry and Its Relationship with TT-TG and TT-IC by MRI
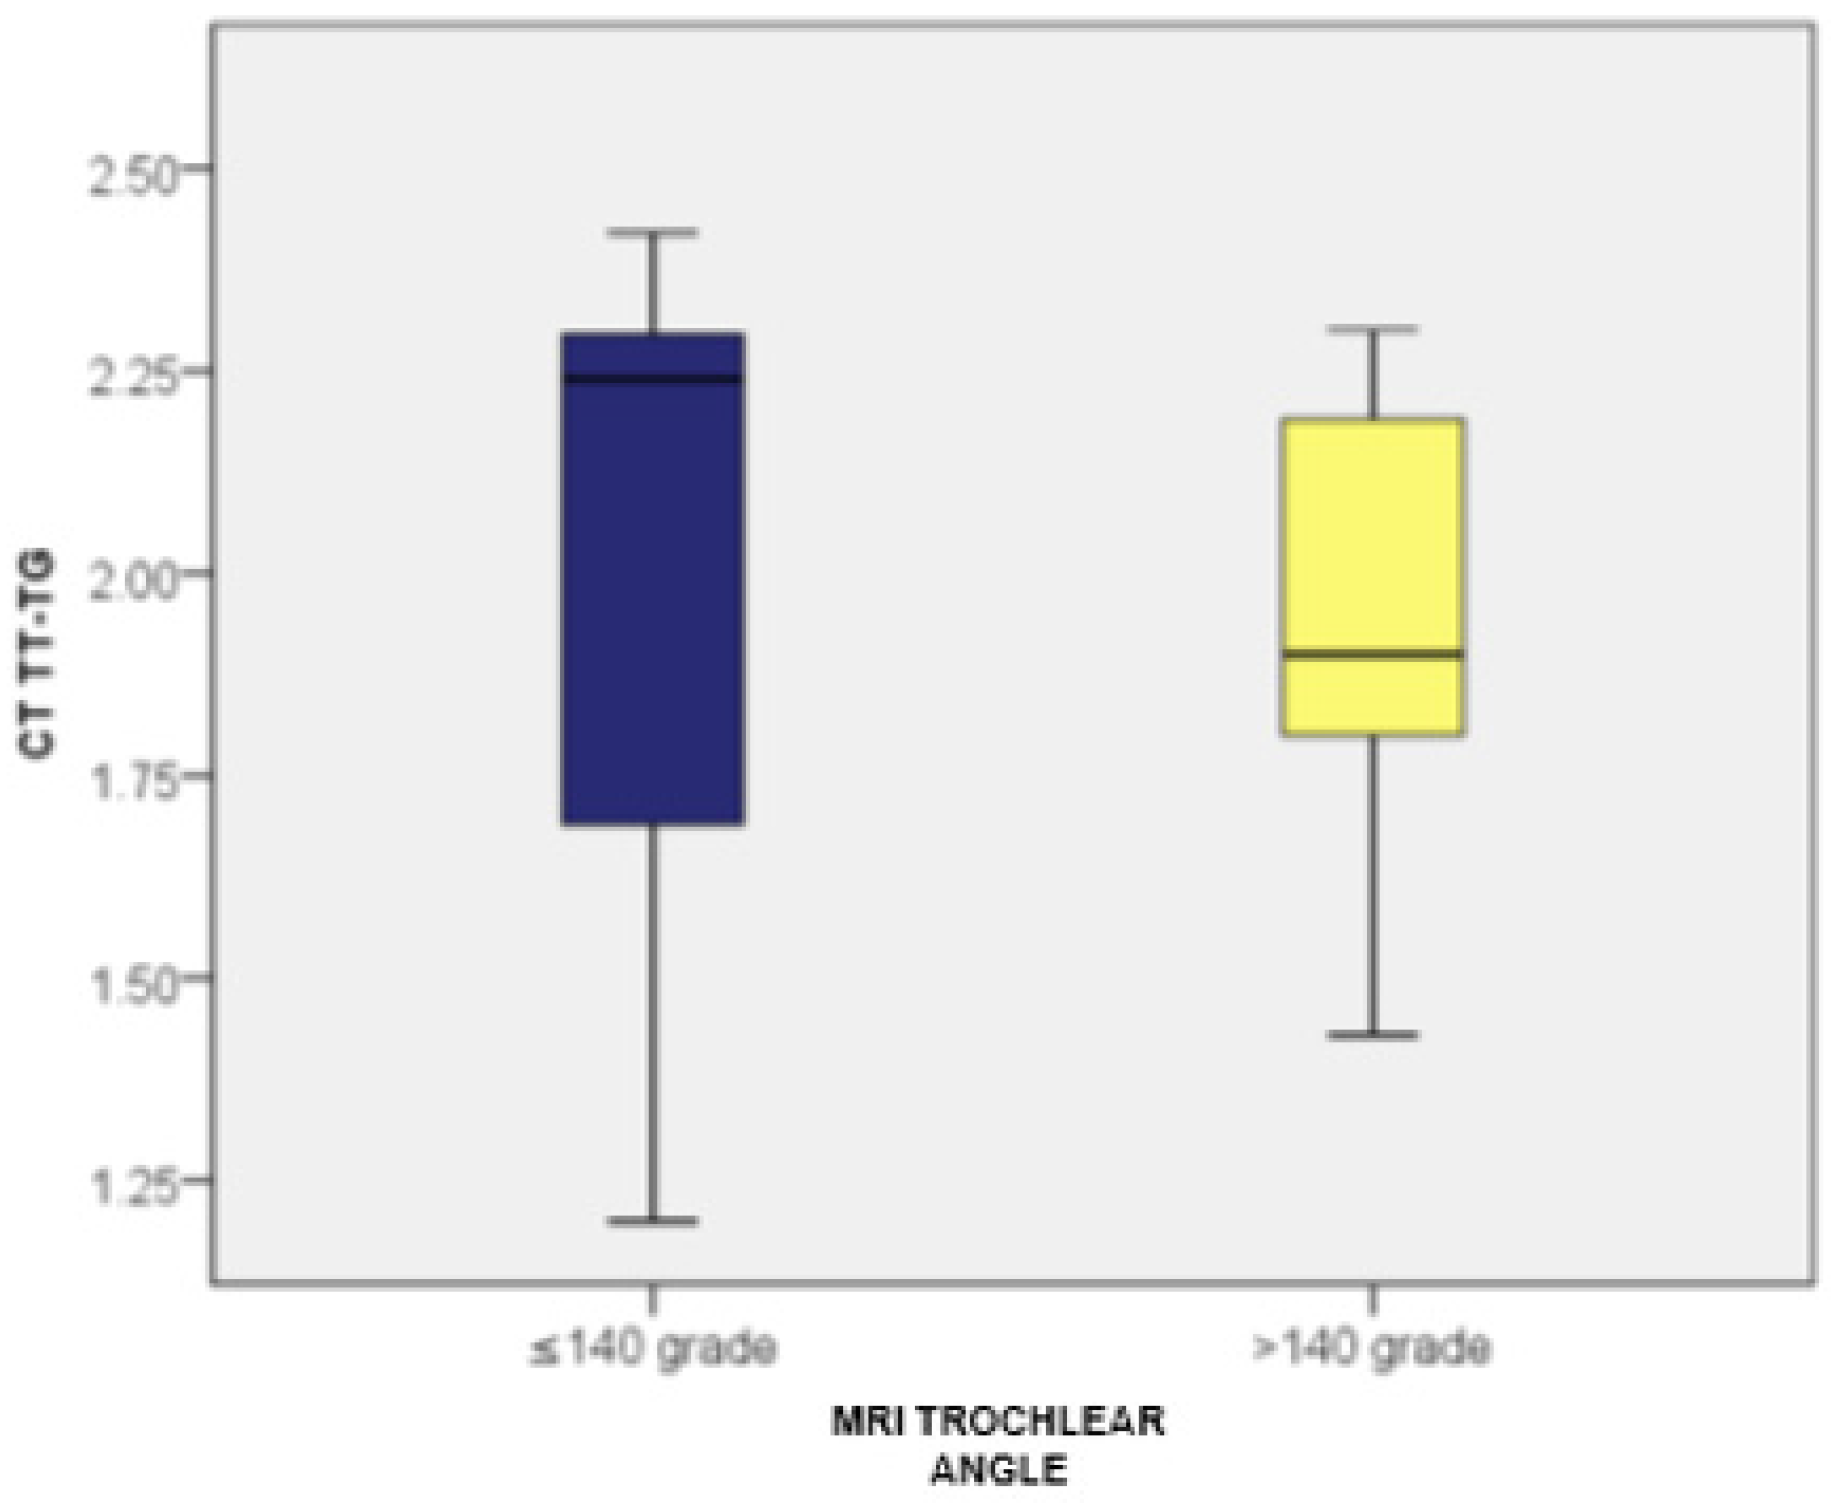
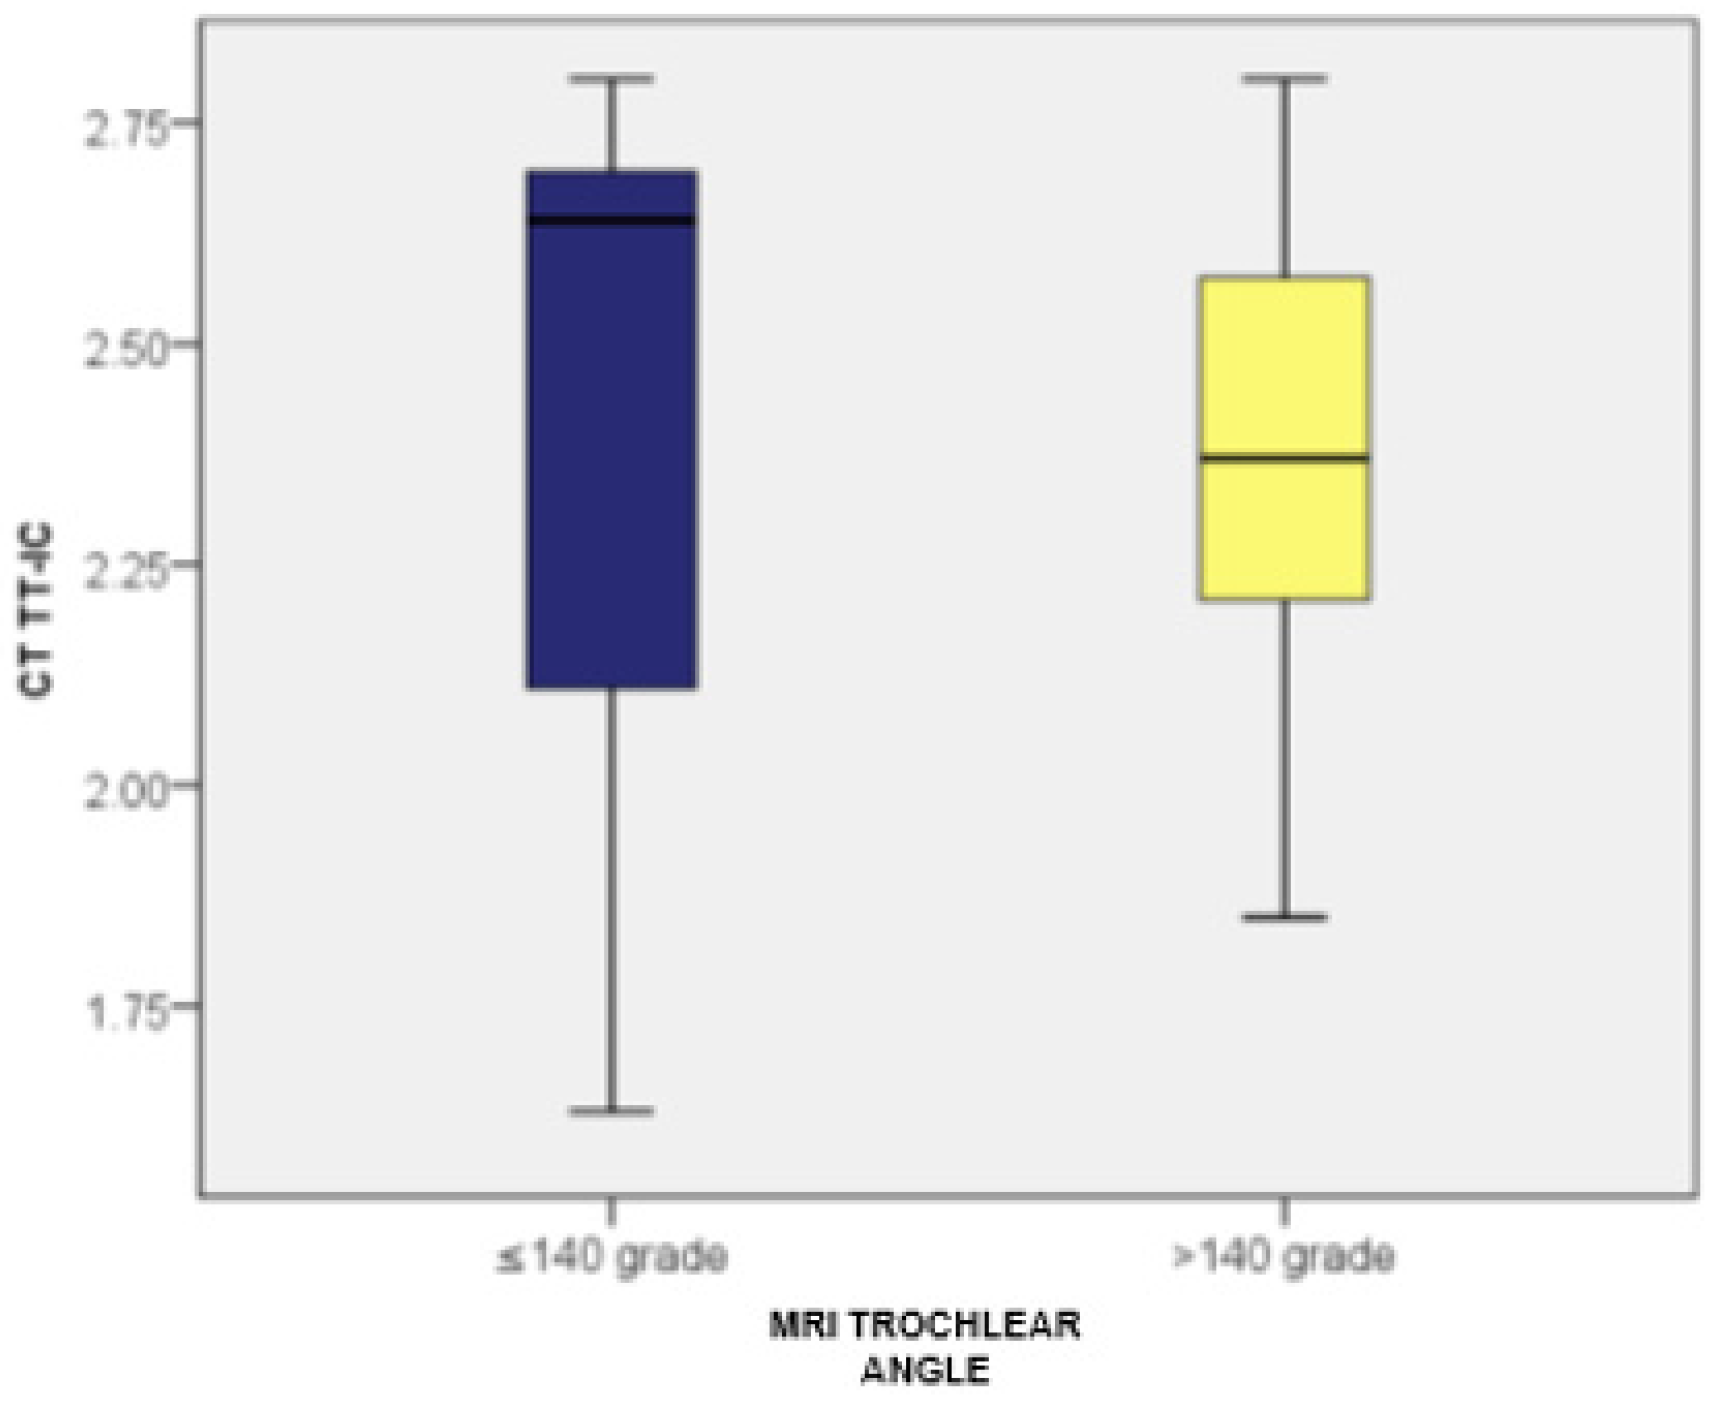
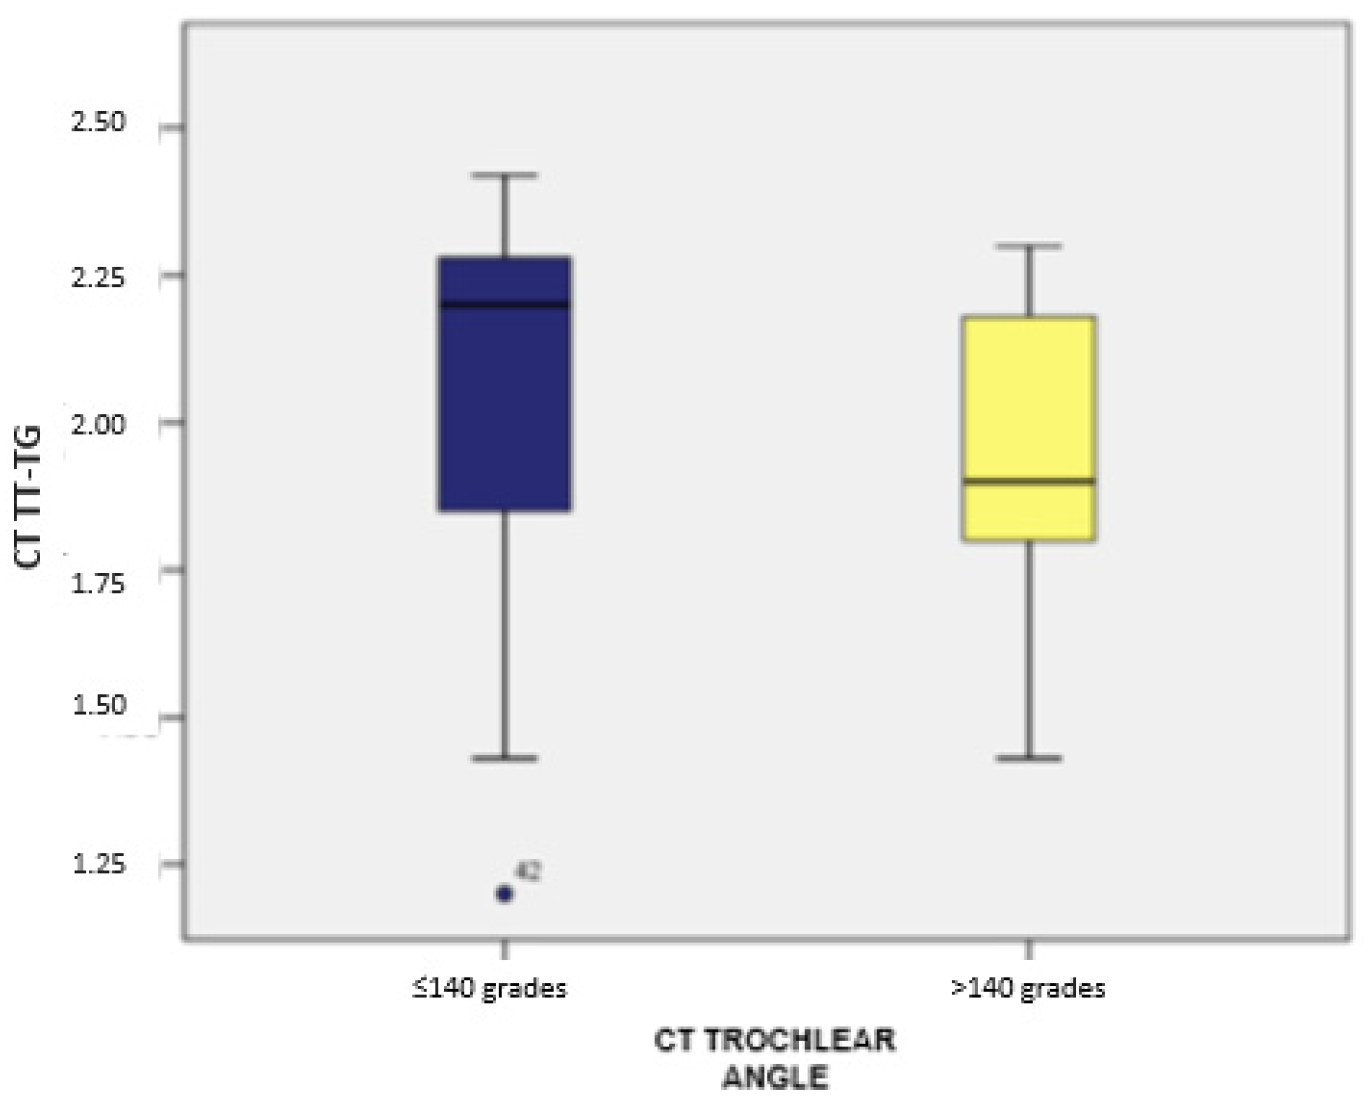
3.3. Assessment of the Trochlear Angle and Its Correlation with TT-TG and TT-IC by Both CT and MRI
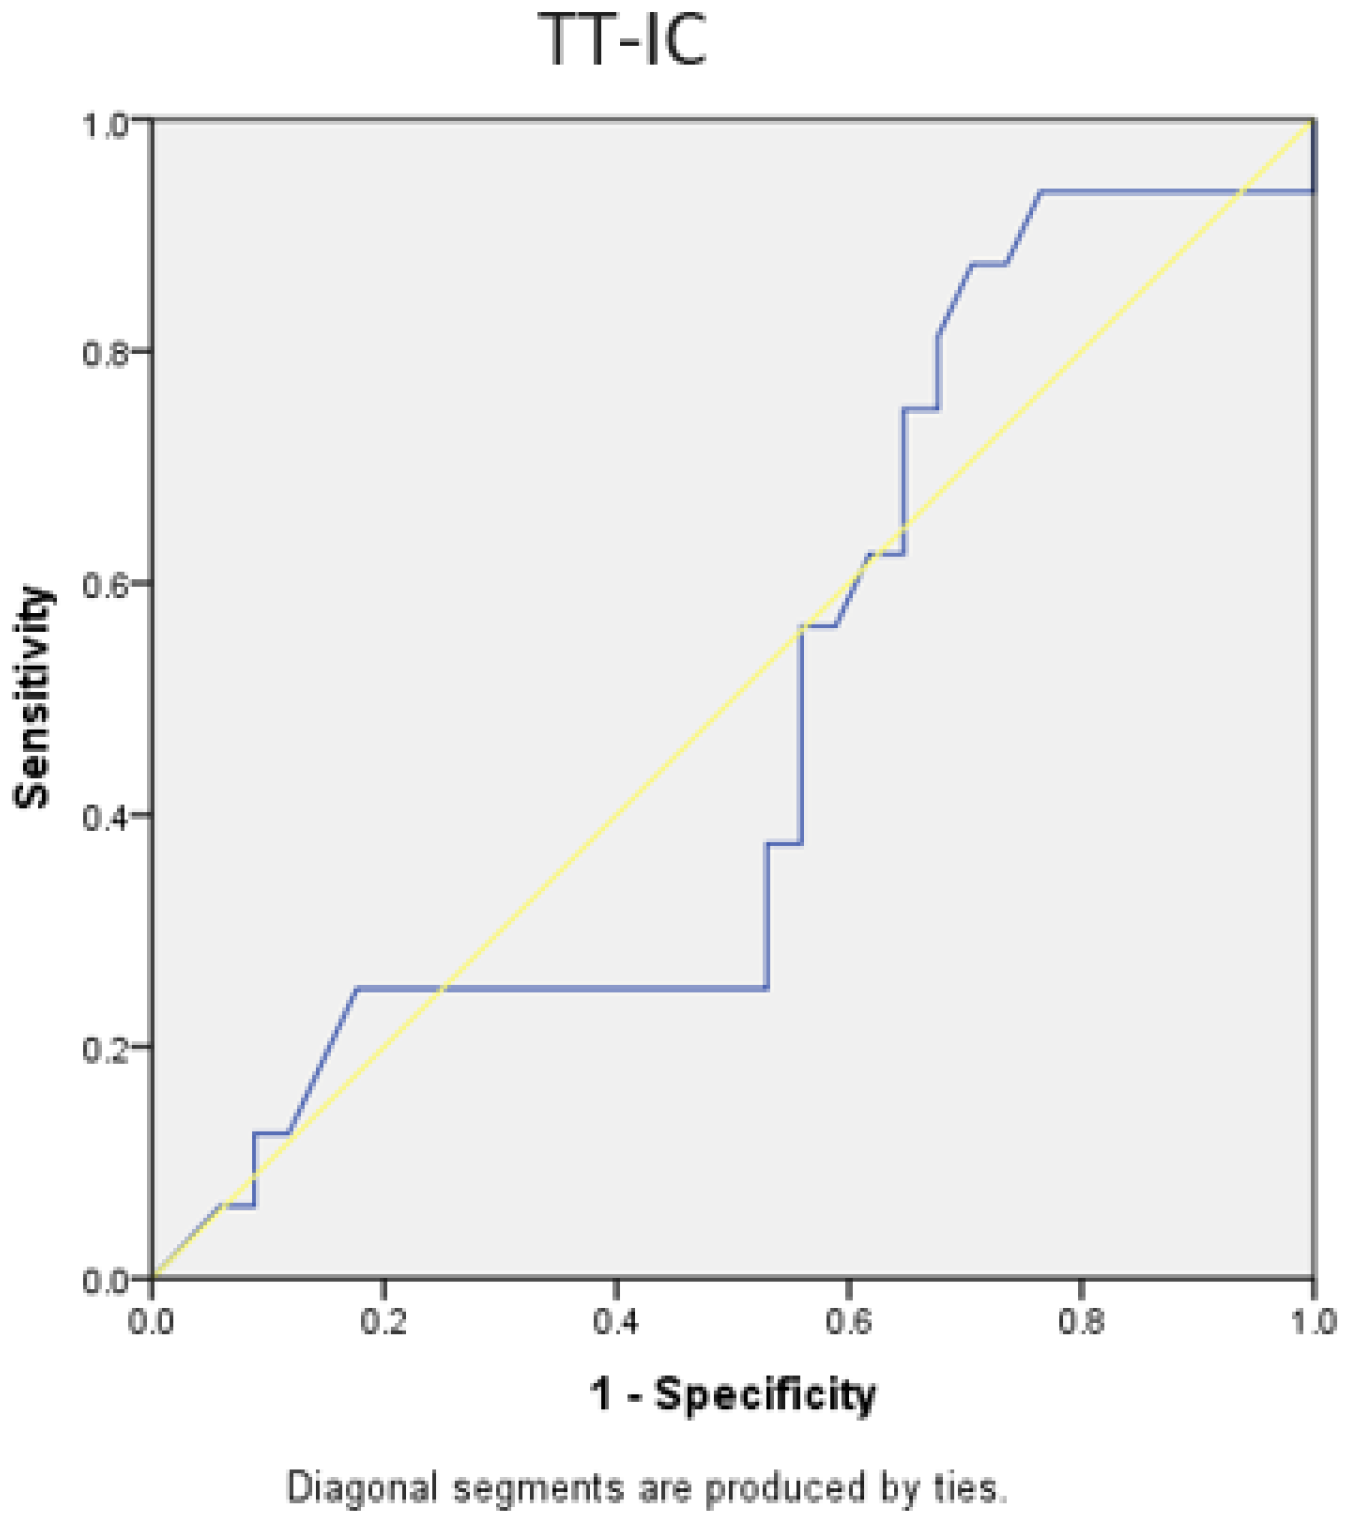
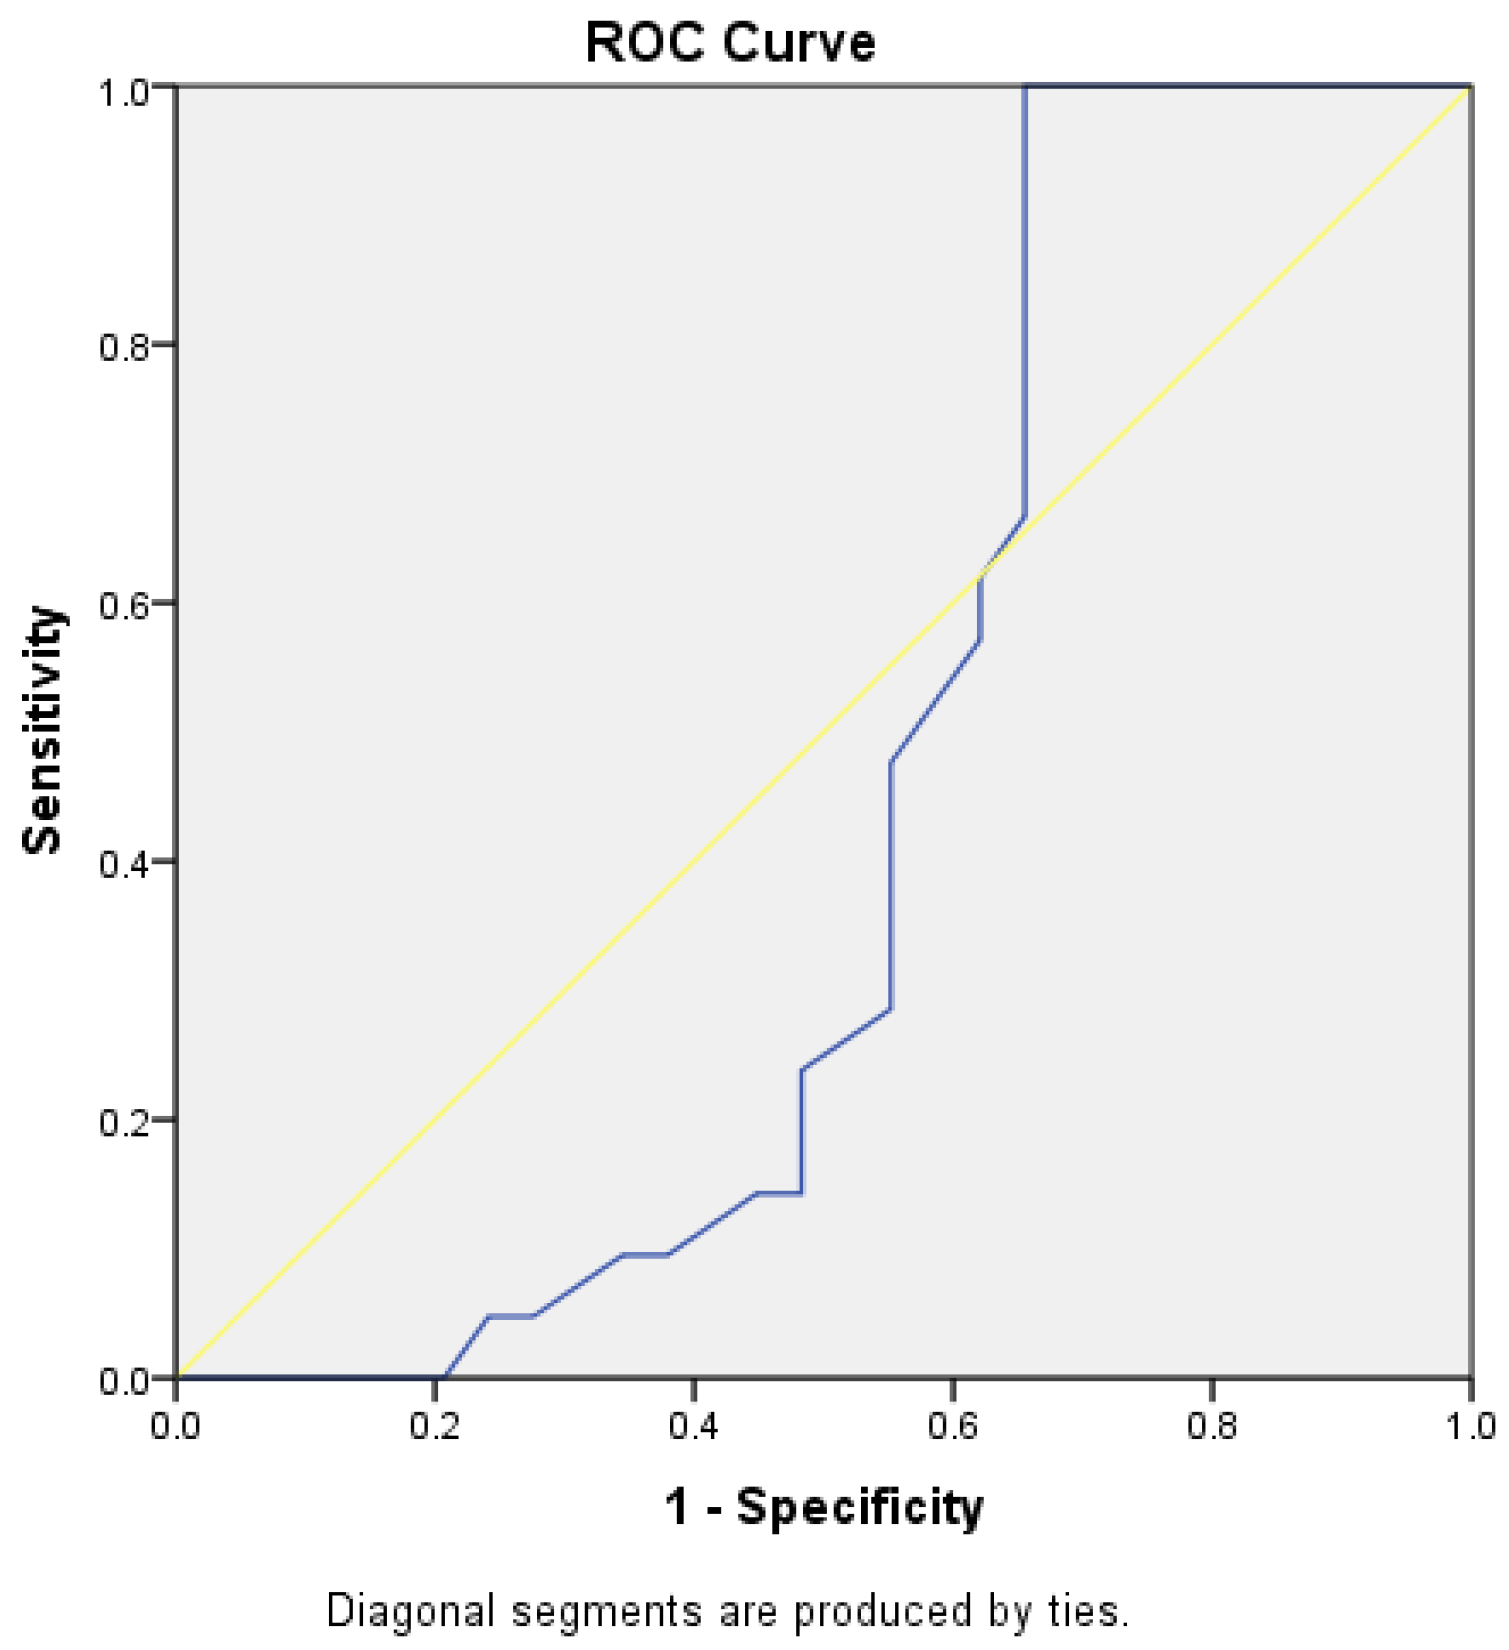
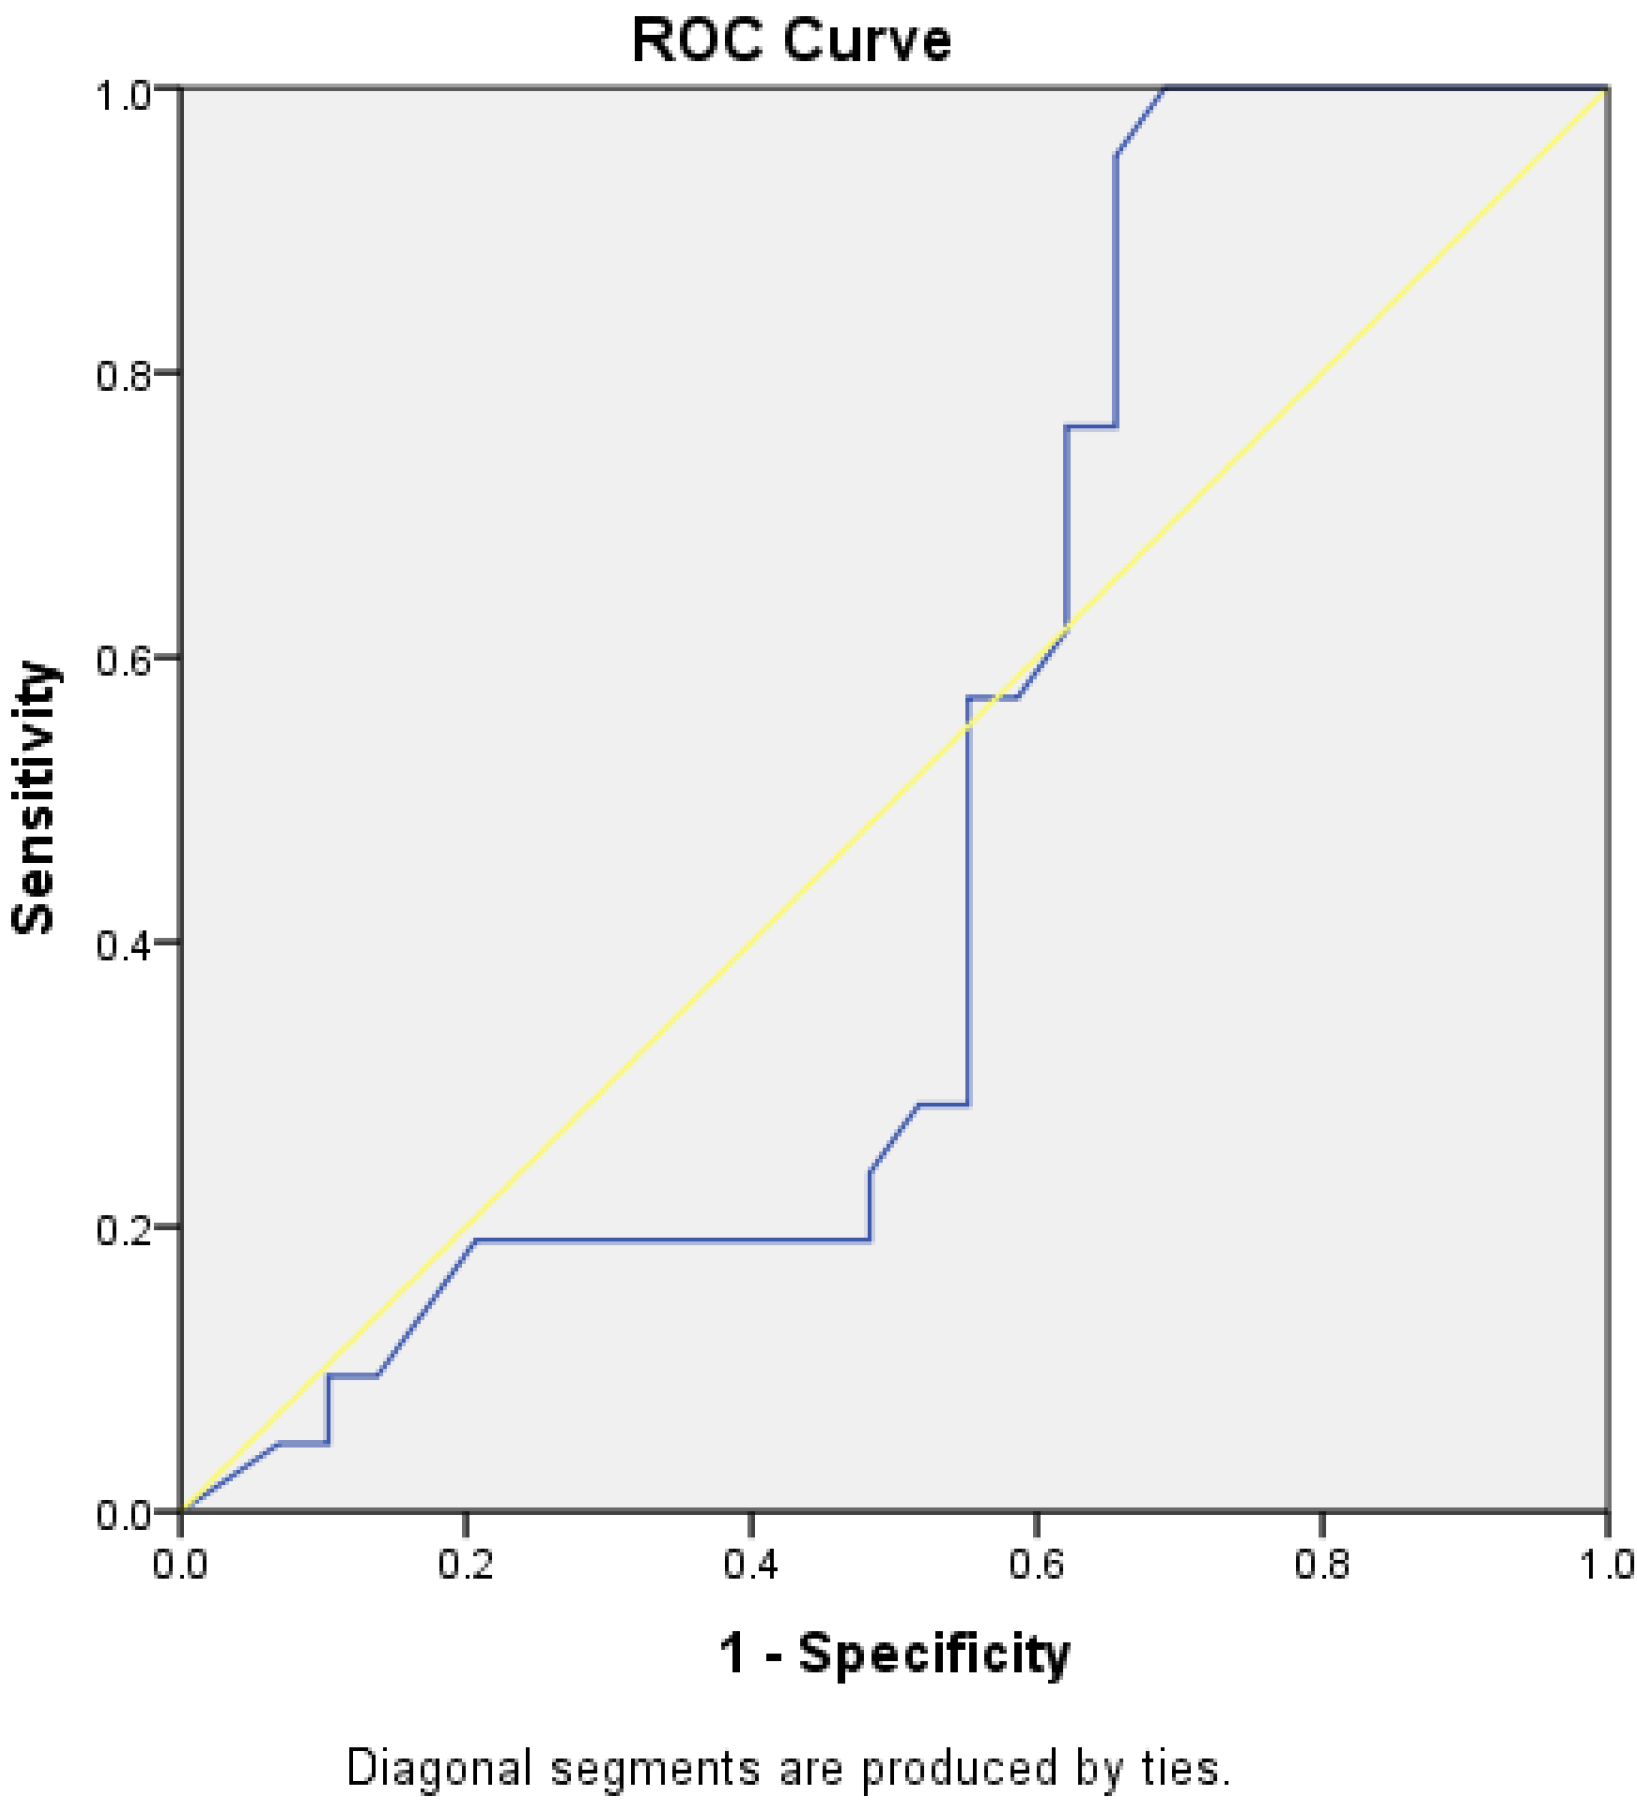
3.4. Evaluation of TT-TG and TT-IC Parameters Using ROC Curves
4. Discussion
5. Conclusions
Author Contributions
Funding
Institutional Review Board Statement
Informed Consent Statement
Data Availability Statement
Conflicts of Interest
References
- Dejour, D.; Le Coultre, B. Osteotomies in Patello-Femoral Instabilities. Sports Med. Arthrosc. Rev. 2007, 15, 39–46. [Google Scholar] [CrossRef] [PubMed]
- Camp, C.L.; Stuart, M.J.; Krych, A.J.; Levy, B.A.; Bond, J.R.; Collins, M.S.; Dahm, D.L. CT and MRI Measurements of Tibial Tubercle–Trochlear Groove Distances Are Not Equivalent in Patients with Patellar Instability. Am. J. Sports Med. 2013, 41, 1835–1840. [Google Scholar] [CrossRef] [PubMed]
- Dejour, D.H.; Mesnard, G.; De Sanctis, E.G. Updated treatment guidelines for patellar instability: “un menu à la carte”. J. Exp. Orthop. 2021, 8, 109. [Google Scholar] [CrossRef] [PubMed]
- Catelas, I.; Wimmer, M.A. New Insights into Wear and Biological Effects of Metal-on-Metal Bearings. J. Bone Jt. Surg. 2011, 93 (Suppl. S2), 76–83. [Google Scholar] [CrossRef]
- O’Neill, D.B. Open lateral retinacular lengthening compared with arthroscopic release. A prospective, randomized outcome study. J. Bone Jt. Surg. Am. 1997, 79, 1759–1769. [Google Scholar] [CrossRef]
- Vitale, T.E.; Mooney, B.; Vitale, A.; Apergis, D.; Wirth, S.; Grossman, M.G. Physical therapy intervention for medial patellofemoral ligament reconstruction after repeated lateral patellar subluxation/dislocation. Int. J. Sports Phys. Ther. 2016, 11, 423–435. [Google Scholar] [PubMed]
- Pirri, C.; Stecco, C.; Güvener, O.; Mezian, K.; Ricci, V.; Jačisko, J.; Novotný, T.; Kara, M.; Chang, K.-V.; Dughbaj, M.; et al. EURO-MUSCULUS/USPRM Dynamic Ultrasound Protocols for Knee. Am. J. Phys. Med. Rehabil. 2023, 102, e67–e72. [Google Scholar] [CrossRef]
- Cocco, G.; Ricci, V.; Corvino, A.; Abate, M.; Vaccaro, A.; Bernabei, C.; Cantisani, V.; Vallone, G.; Caiazzo, C.; Caulo, M.; et al. Musculoskeletal disorders in padel: From biomechanics to sonography. J. Ultrasound 2024, 27, 335–354. [Google Scholar] [CrossRef] [PubMed]
- Wagner, D.; Pfalzer, F.; Hingelbaum, S.; Huth, J.; Mauch, F.; Bauer, G. The influence of risk factors on clinical outcomes following anatomical medial patellofemoral ligament (MPFL) reconstruction using the gracilis tendon. Knee Surg. Sports Traumatol. Arthrosc. 2013, 21, 318–324. [Google Scholar] [CrossRef] [PubMed]
- Wang, S.; Qin, C.; Jiang, N.; Wang, B.; Wang, L.; Yu, B. Is surgical treatment better than conservative treatment for primary patellar dislocations? A meta-analysis of randomized controlled trials. Arch. Orthop. Trauma Surg. 2016, 136, 371–379. [Google Scholar] [CrossRef] [PubMed]
- Beaufils, P.; Thaunat, M.; Pujol, N.; Scheffler, S.; Rossi, R.; Carmont, M. Trochleoplasty in major trochlear dysplasia: Current concepts. Sports Med. Arthrosc. Rehabil. Ther. Technol. 2012, 4, 7. [Google Scholar] [CrossRef] [PubMed]
- Biedert, R.M. Lengthening Osteotomy with or without Elevation of the Lateral Trochlear Facet. In Patellofemoral Pain, Instability, and Arthritis; Dejour, D., Zaffagnini, S., Arendt, E.A., Sillanpää, P., Dirisamer, F., Eds.; Springer: Berlin/Heidelberg, Germany, 2020; pp. 335–341. [Google Scholar] [CrossRef]
- Xu, Z.; Zhang, H.; Fu, B.; Mohamed, S.I.; Zhang, J.; Zhou, A. Tibial Tubercle–Roman Arch Distance: A New Measurement of Patellar Dislocation and Indication of Tibial Tubercle Osteotomy. Orthop. J. Sports Med. 2020, 8, 232596712091487. [Google Scholar] [CrossRef] [PubMed]


| Characteristic | Number (n) | Percentage (%) |
|---|---|---|
| Total Patients | 60 | 100 |
| Sex Distribution | ||
| Female | 50 | 83.3 |
| Male | 10 | 16.7 |
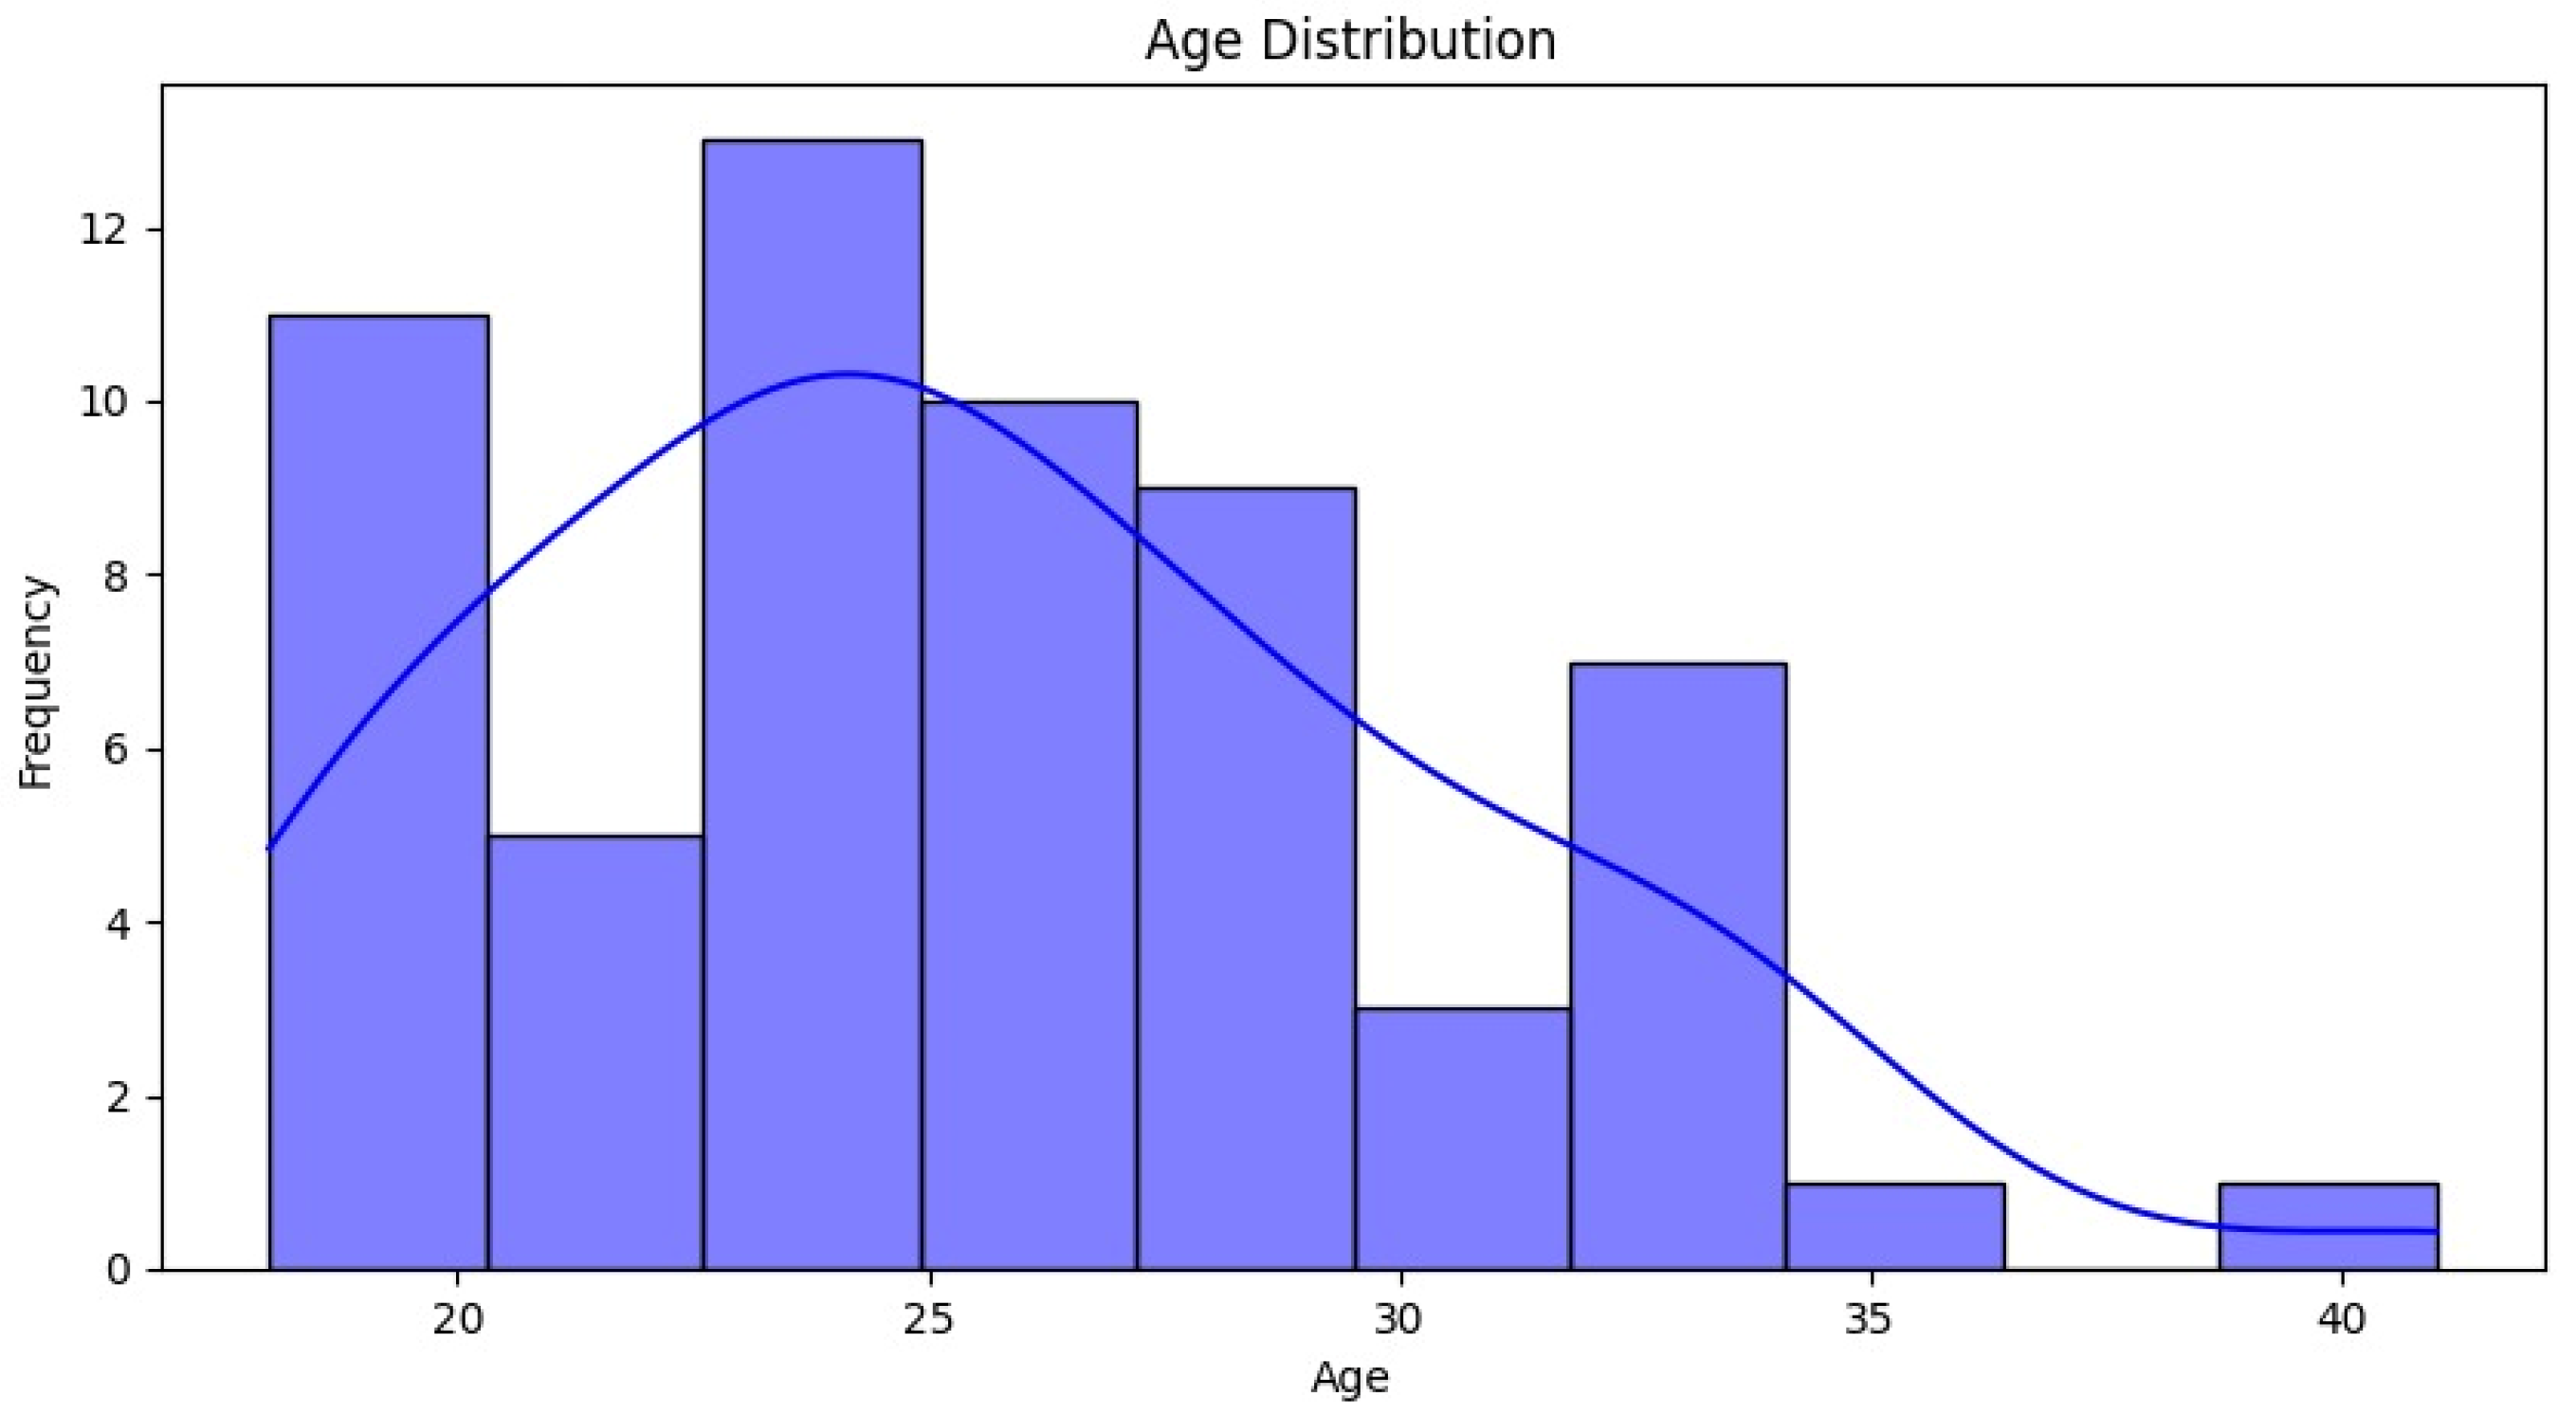
| Age Distribution | ||
| 20–24 years | 15 | 25 |
| 25–29 years | 30 | 50 |
| 30–34 years | 10 | 16.7 |
| 35–40 years | 5 | 8.3 |
| Mean Age (years) | 25.57 | |
| Standard Deviation | 5.01 |
| Measurement | Trochlear Angle ≤ 140° (n = 27) | Trochlear Angle > 140° (n = 23) | p-Value |
|---|---|---|---|
| TT-TG Distance (CT) | Mean: 2.04 cm (SD: 0.33) | Mean: 1.94 cm (SD: 0.23) | 0.056 |
| TT-IC Distance (CT) | Mean: 2.45 cm (SD: 0.32) | Mean: 2.38 cm (SD: 0.23) | 0.184 |
| TT-TG Distance (MRI) | Mean: 2.02 cm (SD: 0.36) | Mean: 1.94 cm (SD: 0.23) | 0.149 |
| TT-IC Distance (MRI) | Mean: 2.42 cm (SD: 0.35) | Mean: 2.38 cm (SD: 0.24) | 0.425 |
| Measurement | With Asymmetry (n = 21) | Without Asymmetry (n = 29) | p-Value |
|---|---|---|---|
| TT-TG Distance (MRI) | Mean: 1.99 cm (SD: 0.20) | Mean: 1.99 cm (SD: 0.37) | 0.51 |
| TT-IC Distance (MRI) | Mean: 2.42 cm (SD: 0.21) | Mean: 2.40 cm (SD: 0.36) | 0.984 |
| TT-TG vs. TT-IC Difference (MRI) | Z = −4.018; p < 0.001 | Z = −4.759; p < 0.001 |
| Parameter | AUC | Cut-Off Value | Sensitivity (%) | Specificity (%) | p-Value |
|---|---|---|---|---|---|
| TT-TG Distance | 0.778 | 1.86 cm | 78 | 62 | 0.001 |
| TT-IC Distance | 0.787 | 2.25 cm | 85 | 62 | <0.0001 |
Disclaimer/Publisher’s Note: The statements, opinions and data contained in all publications are solely those of the individual author(s) and contributor(s) and not of MDPI and/or the editor(s). MDPI and/or the editor(s) disclaim responsibility for any injury to people or property resulting from any ideas, methods, instructions or products referred to in the content. |
© 2024 by the authors. Published by MDPI on behalf of the Lithuanian University of Health Sciences. Licensee MDPI, Basel, Switzerland. This article is an open access article distributed under the terms and conditions of the Creative Commons Attribution (CC BY) license (https://creativecommons.org/licenses/by/4.0/).
Share and Cite
Iacobescu, G.-L.; Corlatescu, A.-D.; Munteanu, O.; Serban, B.; Spiridonica, R.; Cirstoiu, C. Assessing the Tibial Tubercle–Posterior Intercondylar Eminence Distance as a Superior Indicator for Patellar Instability and Surgical Planning in Tibial Tubercle Osteotomy. Medicina 2024, 60, 1570. https://doi.org/10.3390/medicina60101570
Iacobescu G-L, Corlatescu A-D, Munteanu O, Serban B, Spiridonica R, Cirstoiu C. Assessing the Tibial Tubercle–Posterior Intercondylar Eminence Distance as a Superior Indicator for Patellar Instability and Surgical Planning in Tibial Tubercle Osteotomy. Medicina. 2024; 60(10):1570. https://doi.org/10.3390/medicina60101570
Chicago/Turabian StyleIacobescu, Georgian-Longin, Antonio-Daniel Corlatescu, Octavian Munteanu, Bogdan Serban, Razvan Spiridonica, and Catalin Cirstoiu. 2024. "Assessing the Tibial Tubercle–Posterior Intercondylar Eminence Distance as a Superior Indicator for Patellar Instability and Surgical Planning in Tibial Tubercle Osteotomy" Medicina 60, no. 10: 1570. https://doi.org/10.3390/medicina60101570
APA StyleIacobescu, G.-L., Corlatescu, A.-D., Munteanu, O., Serban, B., Spiridonica, R., & Cirstoiu, C. (2024). Assessing the Tibial Tubercle–Posterior Intercondylar Eminence Distance as a Superior Indicator for Patellar Instability and Surgical Planning in Tibial Tubercle Osteotomy. Medicina, 60(10), 1570. https://doi.org/10.3390/medicina60101570