Article

Understanding of Depressive Symptomatology across Major Depressive Disorder and Bipolar Disorder: A Network Analysis

1
Department of Neuropsychiatry, Seoul National University Bundang Hospital, Seongnam 13620, Republic of Korea
2
Department of Psychology, Kyungpook National University, Daegu 41566, Republic of Korea
3
Department of Psychiatry, Seoul National University College of Medicine, Seoul 03087, Republic of Korea
*
Authors to whom correspondence should be addressed.
These authors contributed equally to this work.
Medicina 2024, 60(1), 32; https://doi.org/10.3390/medicina60010032
Submission received: 26 November 2023 / Revised: 21 December 2023 / Accepted: 22 December 2023 / Published: 24 December 2023
(This article belongs to the Section Psychiatry)

Abstract

:
Background and Objectives: Depressive symptoms are prominent in both major depressive disorder (MDD) and bipolar disorder (BD). However, comparative research on the network structure of depressive symptoms in these two diagnostic groups has been limited. This study aims to compare the network structure of depressive symptoms in MDD and BD, providing a deeper understanding of the depressive symptomatology of each disorder. Materials and Methods: The Zung Self-Rating Depressive Scale, a 20-item questionnaire, was administered to assess the depressive symptoms in individuals with MDD (n = 322) and BD (n = 516). A network analysis was conducted using exploratory graph analysis (EGA), and the network structure was analyzed using regularized partial correlation models. To validate the dimensionality of the Zung SDS, principal component analysis (PCA) was adopted. Centrality measures of the depressive symptoms within each group were assessed, followed by a network comparison test between the two groups. Results: In both diagnostic groups, the network analysis revealed four distinct categories, aligning closely with the PCA results. “Depressed affect” emerged as the most central symptom in both MDD and BD. Furthermore, non-core symptoms, “Personal devaluation” in MDD and “Confusion” in BD, displayed strong centrality. The network comparison test did not reveal significant differences in the network structure between MDD and BD. Conclusions: The absence of significant differences in the network structures between MDD and BD suggests that the underlying mechanisms of depressive symptoms may be similar across these disorders. The identified central symptoms, including “Depressed affect”, in both disorders and the distinct non-core symptoms in each highlight the complexity of the depressive symptomatology. Future research should focus on validating these symptoms as therapeutic targets and incorporate various methodologies, including non-metric dimension reduction techniques or canonical analysis.

Graphical Abstract

1. Introduction

Depressive symptoms are common psychiatric features of mood disorders, including major depressive disorder (MDD) and bipolar disorder (BD). MDD and BD—with a lifetime prevalence of 16% and 5%, respectively—are common conditions associated with reduced quality of life, increased mortality, and risk of suicide [1,2,3,4,5,6,7]. Both MDD and BD are debilitating conditions, with frequent recurrence observed in approximately 85% and over 90% of individuals, respectively, and imposing significant personal and societal burdens [8,9,10].
While MDD and BD share the diagnostic criterion of depressive episodes within the Diagnostic and Statistical Manual of Mental Disorders, Fifth Edition (DSM-5) framework, they exhibit distinct differences [11]. To address the diagnostic ambiguity, the DSM-5 introduced a transdiagnostic mixed-features specifier, emphasizing a continuum, and alternative classifications such as “research-based diagnostic criteria” for a mixed major depressive episode (MDE) have also emerged [12,13]. In the clinical course, BD typically exhibits earlier onset, more frequent and shorter duration of depressive episodes, and greater short-term mood variability compared to MDD [14]. Symptomatically, depressive episodes in MDD are characterized by features such as decreased appetite, early insomnia, somatization, anxiety, agitation, and anger, whereas those in BD often exhibit irritability, psychotic symptoms, diurnal variation, and atypical symptoms [14,15,16,17,18,19]. Despite these distinctions, distinguishing between MDD and BD remains a challenge for mental health professionals due to the absence of clear differences. The fact that only 20% of patients with BD receive an accurate diagnosis when they experience depressive episodes, with 60% initially being diagnosed with MDD, highlights the difficulty in differentiating between these disorders [20,21]. Moreover, such misdiagnoses result in poorer outcomes, increased suicide risk, manic episodes, and increased healthcare costs [21,22,23,24,25,26].
Network analysis, based on a causal system perspective, prioritizes the possibility that the co-occurrence of symptoms arises from interactions between symptoms rather than a shared underlying cause, which sets it apart from traditional psychopathology [27,28]. Network analysis allows for exploring how the symptoms of mental disorders influence each other within a network framework [29]. This approach, known as network psychiatry, utilizes computational methods. It proves particularly valuable for analyzing heterogeneous conditions such as mood disorders—as it helps evaluate the contributions of individual symptoms to adaptive functioning within the network—and assessing distinctive, interconnected, or potential acting symptoms as risk factors for chronicity [30,31,32].
To date, network analyses comparing MDD and BD remains limited, despite their clinical importance [33]. Previous studies have had mixed findings. One has highlighted anergia and psychomotor speed as a central feature of BD compared to a group including MDD [33]. Meanwhile, another study did not reveal significant differences in depressive symptoms between the groups [34]. In the present study, we aimed to compare the network structures of self-rating depression severity scales in patients with MDD and BD to elucidate the central depressive symptoms in both groups and explore the connections among the clustering of symptoms.

2. Materials and Methods

2.1. Sample

A total of 838 participants (MDD [n = 322], BD [n = 516]) were included in the study. Individuals with a raw score <40 on the Zung Self-Rating Depression Scale (SDS) were excluded, as this study primarily focused on depressive symptoms in MDD and BD. All the diagnoses were made by board-certified psychiatrists (W.M. and T.H.H.) based on structured diagnostic interviews using the Mini-International Neuropsychiatric Interview (M.I.N.I) and through a review of case records or other available data [35]. Additionally, the diagnoses were established following the criteria outlined in the DSM-5 [11]. Demographic data and information related to the depressive symptom scales were collected from the patients.

2.2. Measurement

The Zung Self-Rating Depression Scale

The Zung SDS is a 20-item self-report questionnaire in which 10 items are positively worded and the other 10 are scored in reverse [36]. Responses are rated on a scale from 1 to 4, and the raw score (ranging from 20 to 80) is transformed into an index score between 25 and 100. Zung’s index score categorizes depression severity as follows: 50–59 for mild-to-moderate depression, 60–69 for moderate-to-severe depression, and ≥70 for severe depression [37]. The Zung SDS was designed to assess a wide range of depressive symptoms, including both unipolar and bipolar depression, and it is used to evaluate depressive symptoms not only in MDD but also in BD [38,39].

2.3. Statistical Analysis

2.3.1. Network Construction and Community Detection

In the network, nodes represent items from the Zung SDS, while edges represent the bivariate partial correlation coefficients between items. These coefficients, expressed as edge weights, reflect the degree of connection between two nodes considering the influence of all the other nodes [40]. Nodes with stronger connections are positioned closer together, and thicker edges indicate a higher level of relevance. Within the network structure, nodes with stronger and more connections tend to be located at the center, while nodes with weaker and fewer connections are often found at the periphery. An undirected network was calculated and visualized using a Gaussian Graphical Model, which is suitable for a cross-sectional study design [41].
In order to build a reliable and parsimonious network, the Graphical Least Absolute Shrinkage and Selection Operator (glasso) method was employed. This technique effectively eliminates spurious edges and retains only robust associations by shrinking smaller edge weights to zero, thereby controlling for false positive edges and regularizing the network. The analysis utilized the EBICglasso function from the R-package “qgraph” [42,43].
Exploratory Graph Analysis (EGA) was used to identify distinct item communities within the network structure [44,45]. EGA is a data-driven community detection method that explores the underlying dimensionality of the items, without relying on prior knowledge. In comparison to traditional analytic methods such as factor analysis, EGA represents a more advanced and visually intuitive way to identify dimensions and reveal intricate associations within multivariable data [46]. In order to identify the optimal community structure for the Zung SDS items, the Louvain algorithm was employed, optimizing the hierarchically structured modularity measure between vertices within these item-based communities [47] For the evaluation of the item stability and the dimensionality of the network, a parametric bootstrapping procedure was executed. A total of 1000 bootstrap samples were generated from a multivariate normal distribution, ensuring the results from the EGA reflected the original dataset [45]. The EGA and bootEGA functions from the EGAnet package were utilized to perform these procedures [48]. To validate the dimensionality of the Zung SDS, traditional data reduction method—principal component analysis (PCA)—was adopted, and its solution was compared with the community structure for the Zung SDS obtained from the EGA.

2.3.2. Centrality Estimation

To identify and evaluate the centrality of key symptoms in patients with MDD and BD, several centrality indices were employed: (1) node strength centrality, which measures the overall importance of specific symptoms in the network and is known as reliability; (2) node closeness centrality, indicating how well a symptom indirectly connects with others; and (3) node betweenness centrality, which highlights how frequently a symptom acts as a bridge between other symptoms following the shortest paths [49].

2.3.3. Network Stability and Robustness

The network stability and the robustness of the centrality were evaluated using the correlation stability coefficient. This coefficient indicates the maximum proportion of cases that can be removed while maintaining a correlation of 0.7 with the original data, with a 95% probability [43]. A network is considered stable if most samples can be removed without a significant decrease in the centrality indices, with values between 0 and 1. Values >0.25 indicate moderate stability, while values >0.50 indicate strong stability [43]. Bootstrapped difference tests were conducted to evaluate the differences in both the strength centrality and edge weights between all the possible pairs of nodes using 1000 bootstrapping samples. Significant differences in the centrality indices and edge weights were determined via the 95% bootstrap CIs. Specifically, narrow bootstrapping CIs suggest that the estimates are precise, and if the CI contains a zero, it indicates that there is no significant difference in the centrality indices and edge weights between the two nodes. These procedures were carried out using the R-package “botnet” [50].

2.3.4. Network Comparisons between MDD and BD

To compare the network structures between the MDD and BD groups, network comparison tests (NCTs) were conducted. These tests assessed the differences in the network structure (i.e., network invariance), the number of edges with significant differences (i.e., edge invariance), and overall network connectivity (i.e., global strength) between the two groups. Subsequently, Holm–Bonferroni correction was applied to account for multiple comparisons [51].

3. Results

3.1. Demographic and Clinical Characteristics

Table 1 shows the demographic data of the patients with MDD and BD enrolled in this study. The cohort had a mean age of 34.39 years old (SD = 12.55) and was predominantly female (72.2%) (Supplementary Figure S1). Based on the Bonferroni correction, we identified significant differences in age, marital status, and alcohol use status between the MDD and BD groups. Specifically, individuals with BD were younger, less frequently married, and more often engaged in alcohol use compared with their counterparts with MDD. Table 2 quantifies the responses to the Zung SDS across both diagnostic categories (Supplementary Figure S2). No significant mean differences were found in the SDS item scores between the MDD and BD groups after being subjected to Bonferroni correction for multiple comparisons.

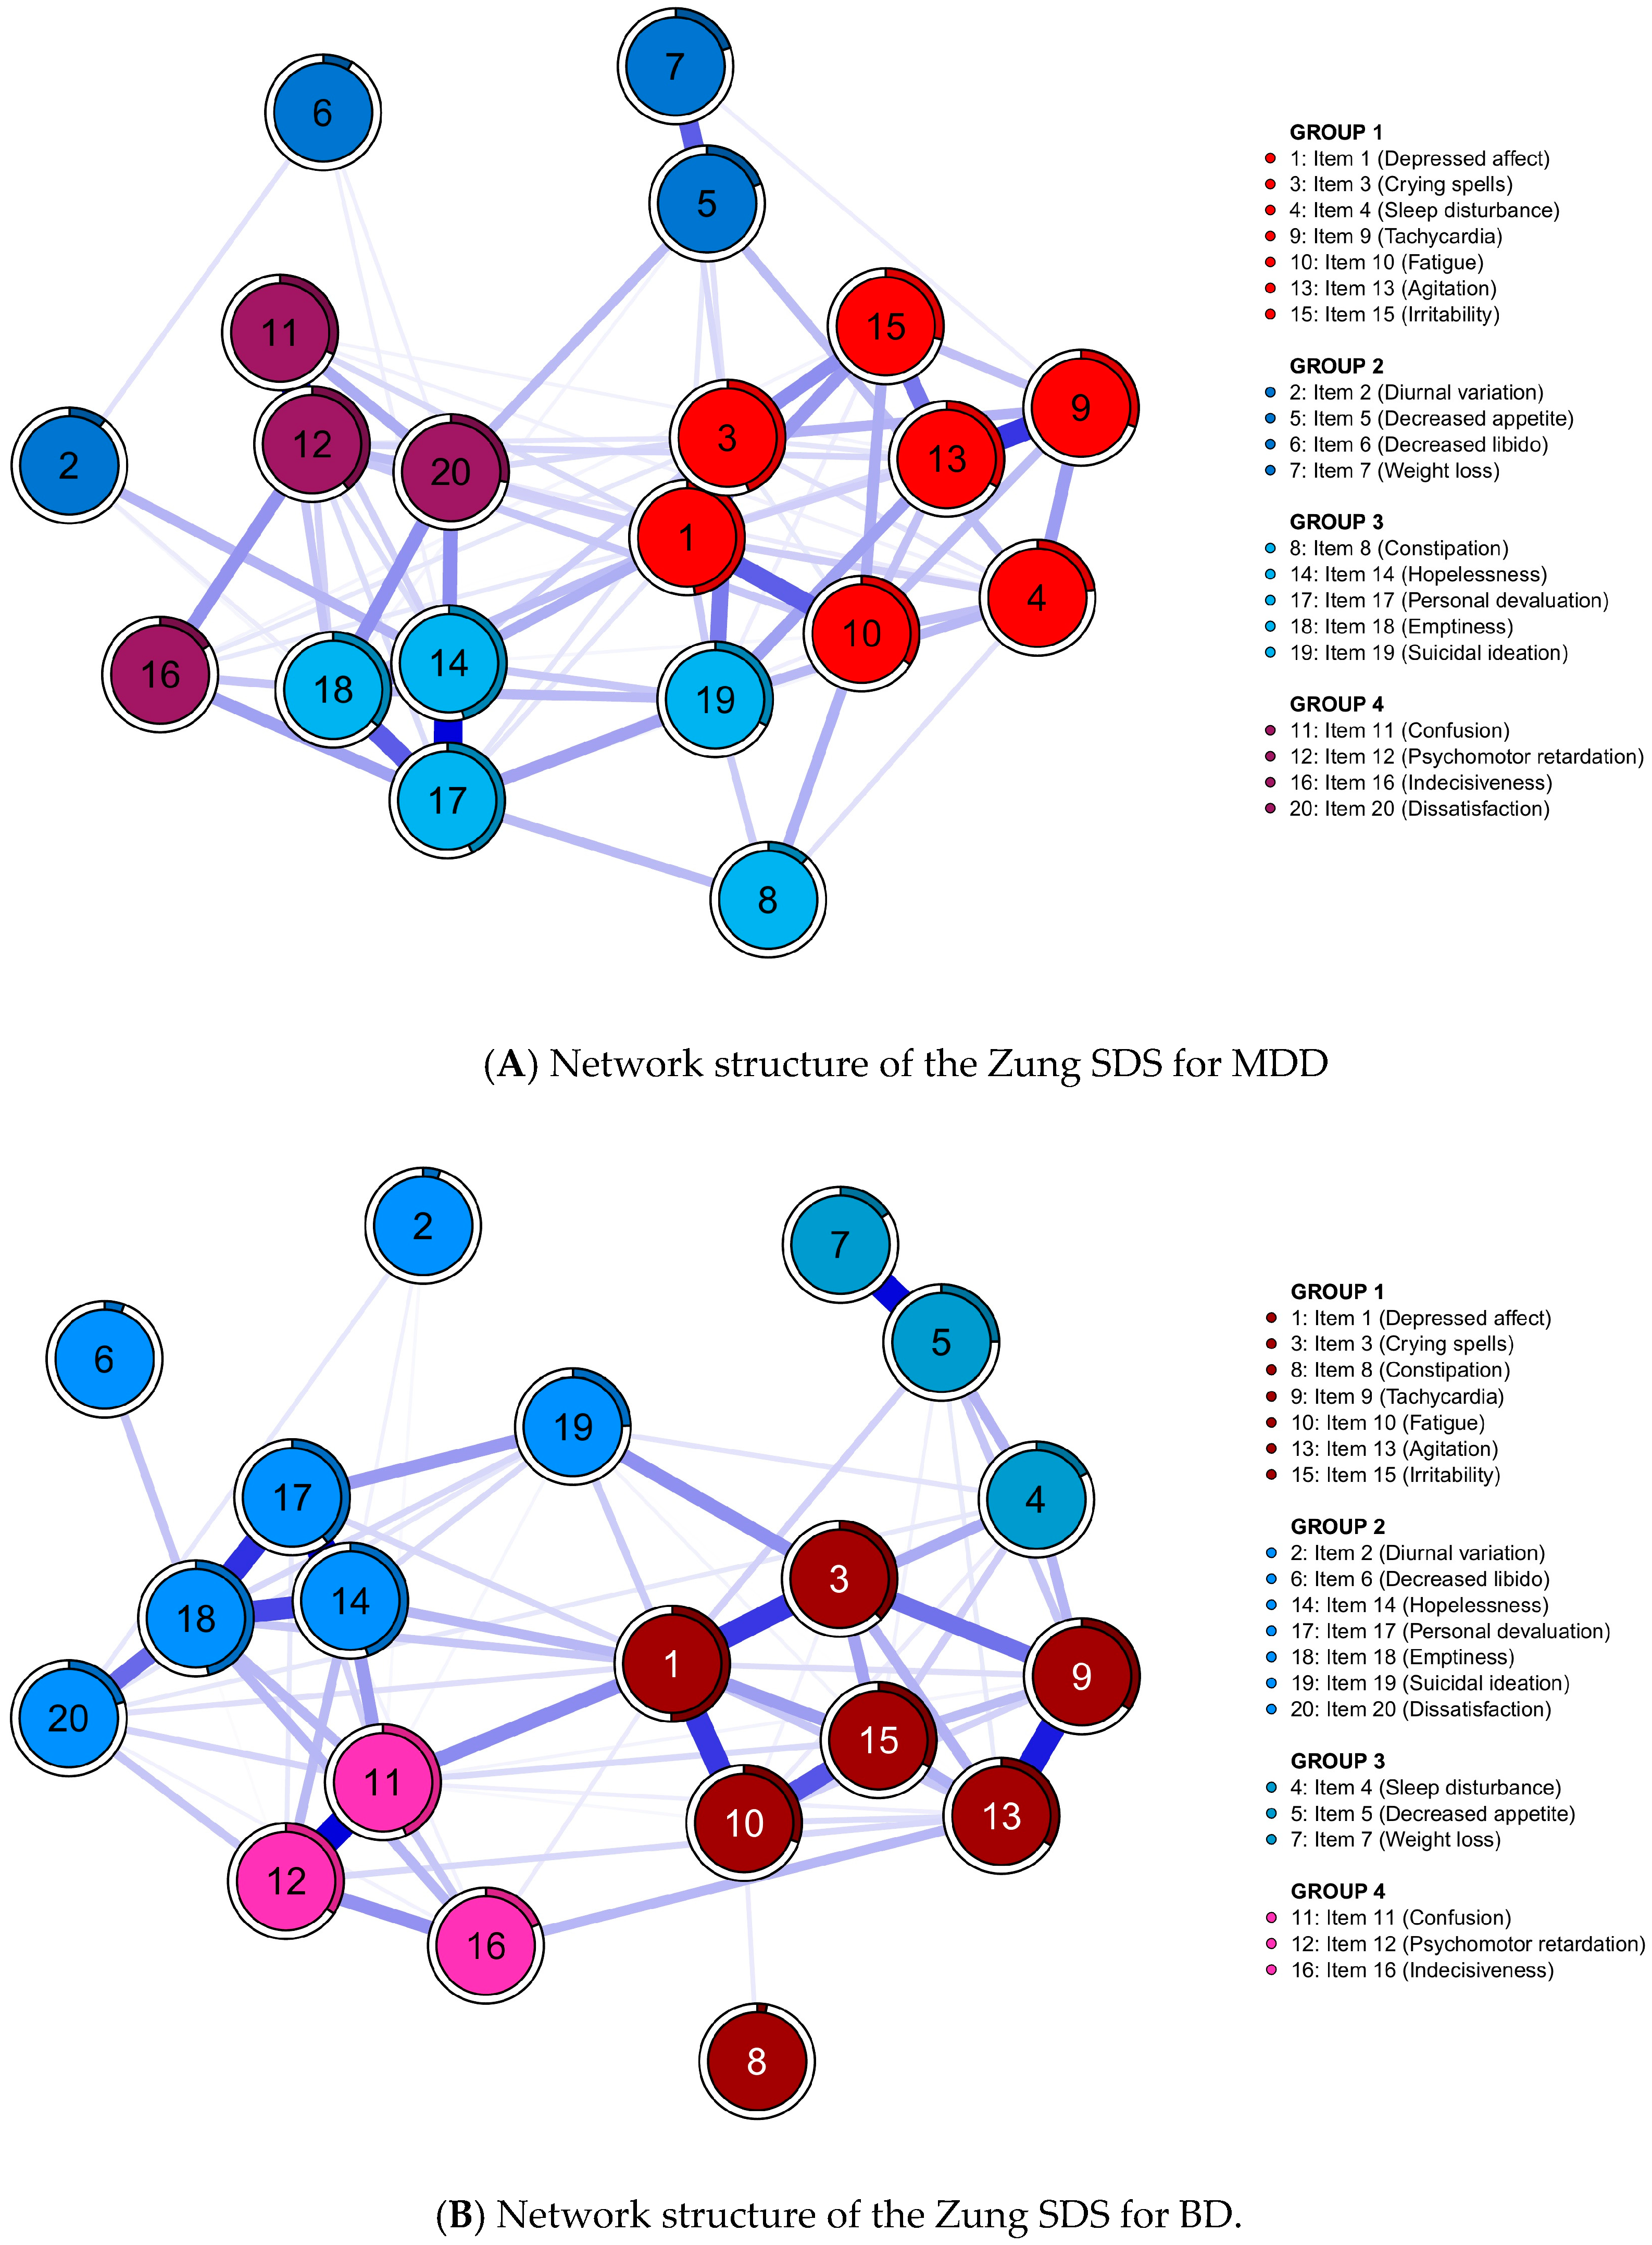
3.2. Network and Community Estimation

Figure 1 illustrates the estimated symptom networks for both the MDD and BD groups. As shown in Figure 1, four distinct communities were discerned within each diagnostic group. In the MDD cohort, Community 1 comprised items 1, 3, 4, 9, 10, 13, and 15; Community 2, items 2, 5, 6, and 7; Community 3, items 8, 14, 17, 18, and 19; and Community 4, items 11, 12, 16, and 20. On the other hand, the BD cohort’s Community 1 included items 1, 3, 8, 9, 10, 13, and 15; Community 2, items 2, 6, 14, 17, 18, 19, and 20; Community 3, items 4, 5, and 7; and Community 4, items 11, 12, and 16. The results of the bootstrapped iterations showed that the derived four-dimension solution exhibits a replication rate of 74.7% (747 out of 1,000) in MDD and 74.8% (748 out of 1000) in BD.

3.3. Principal Component Analysis

To confirm the robustness of the item dimensions identified in the EGA, the EGA results were compared with those of the PCA. In the PCA analysis, four dimensions were identified, as shown in the scree plots (Supplementary Figures S3 and S4), which was an identical solution to the EGA. The patterns of the component loadings revealed that most items loaded on the same components as grouped in the EGA, confirming the dimensional robustness across the two methods, except for a few items, including item 11, 12, 16 and 19 in the BD group and item 4, 6, 8 and 20 in the MDD group. In particular, the patterns of the component loadings on PC1 and PC2 are similar in both the MDD and BD groups, while PC3 in MDD and PC4 in BD are distinct from each other, thus they might be considered as potential bases for discriminating between BD and MDD (Supplementary Tables S1 and S2). Supplementary Figures S5 and S6 display the visual representation of the network nodes, with PC1 and PC2 as the X-Y axes for the BD and MDD groups. These results demonstrate a high degree of similarity between the item clusters identified for the groups with distinct disorders by both the EGA and PCA, while some individual items were differently grouped between the identified clusters.

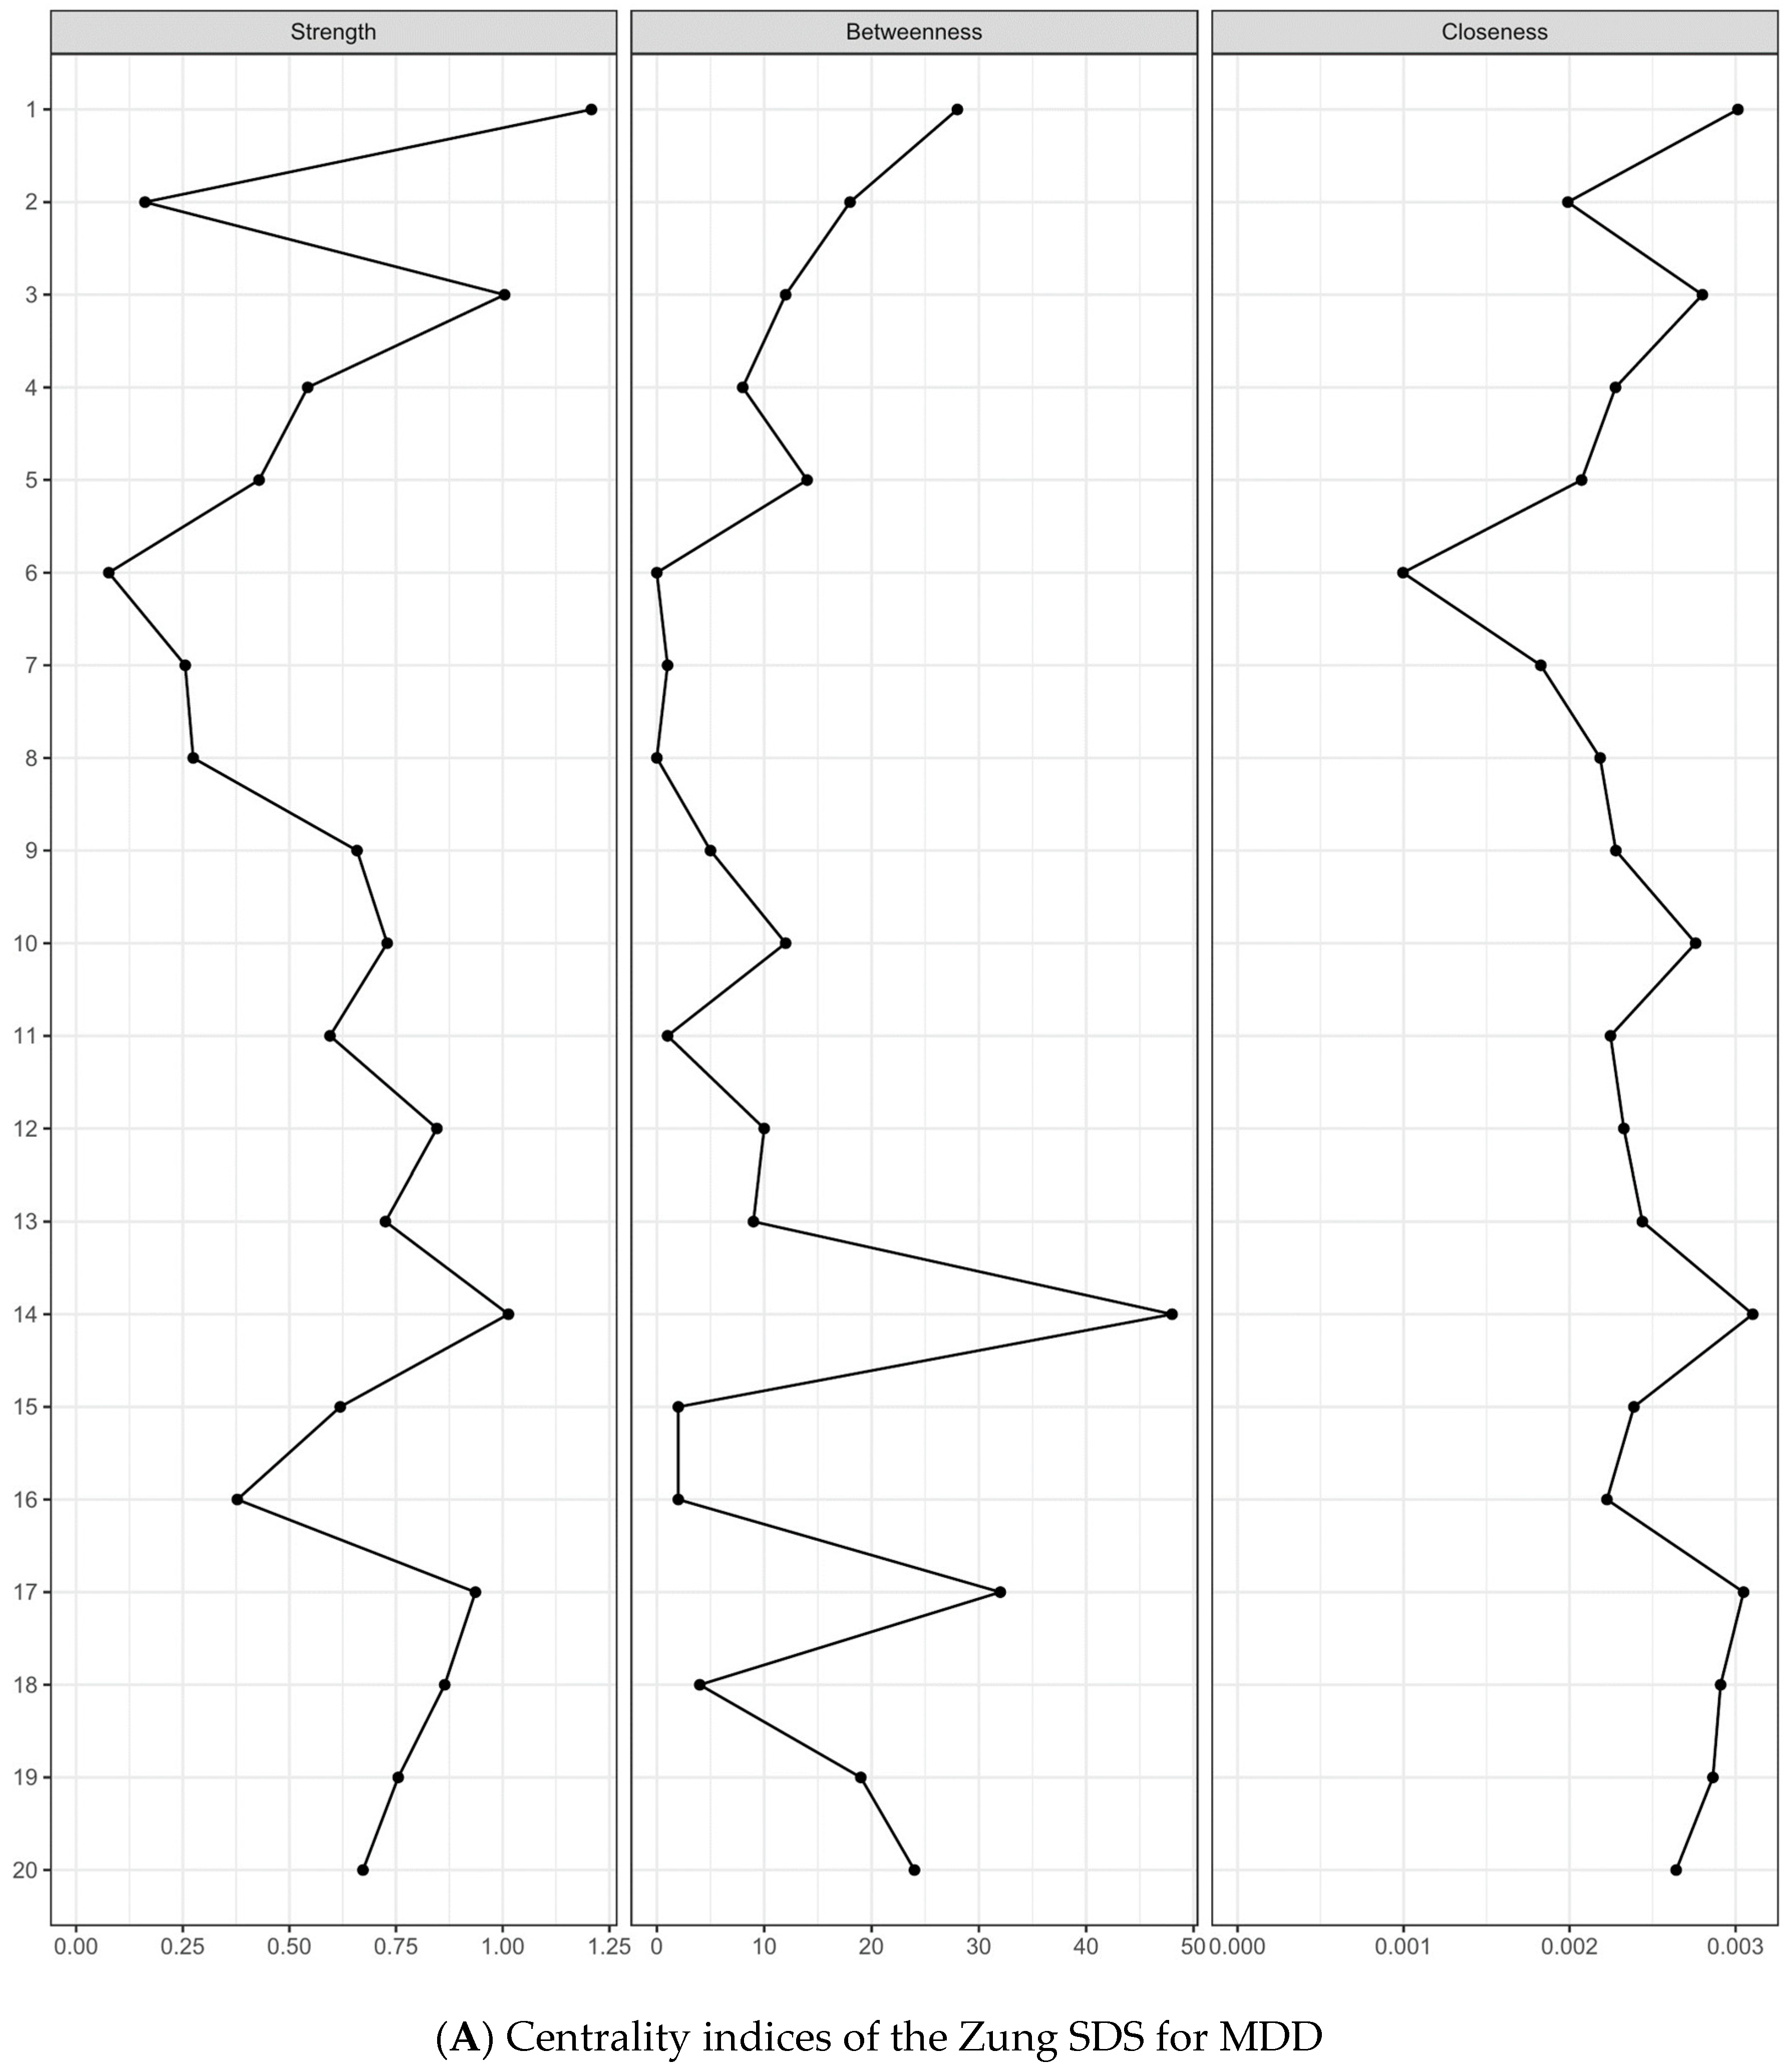
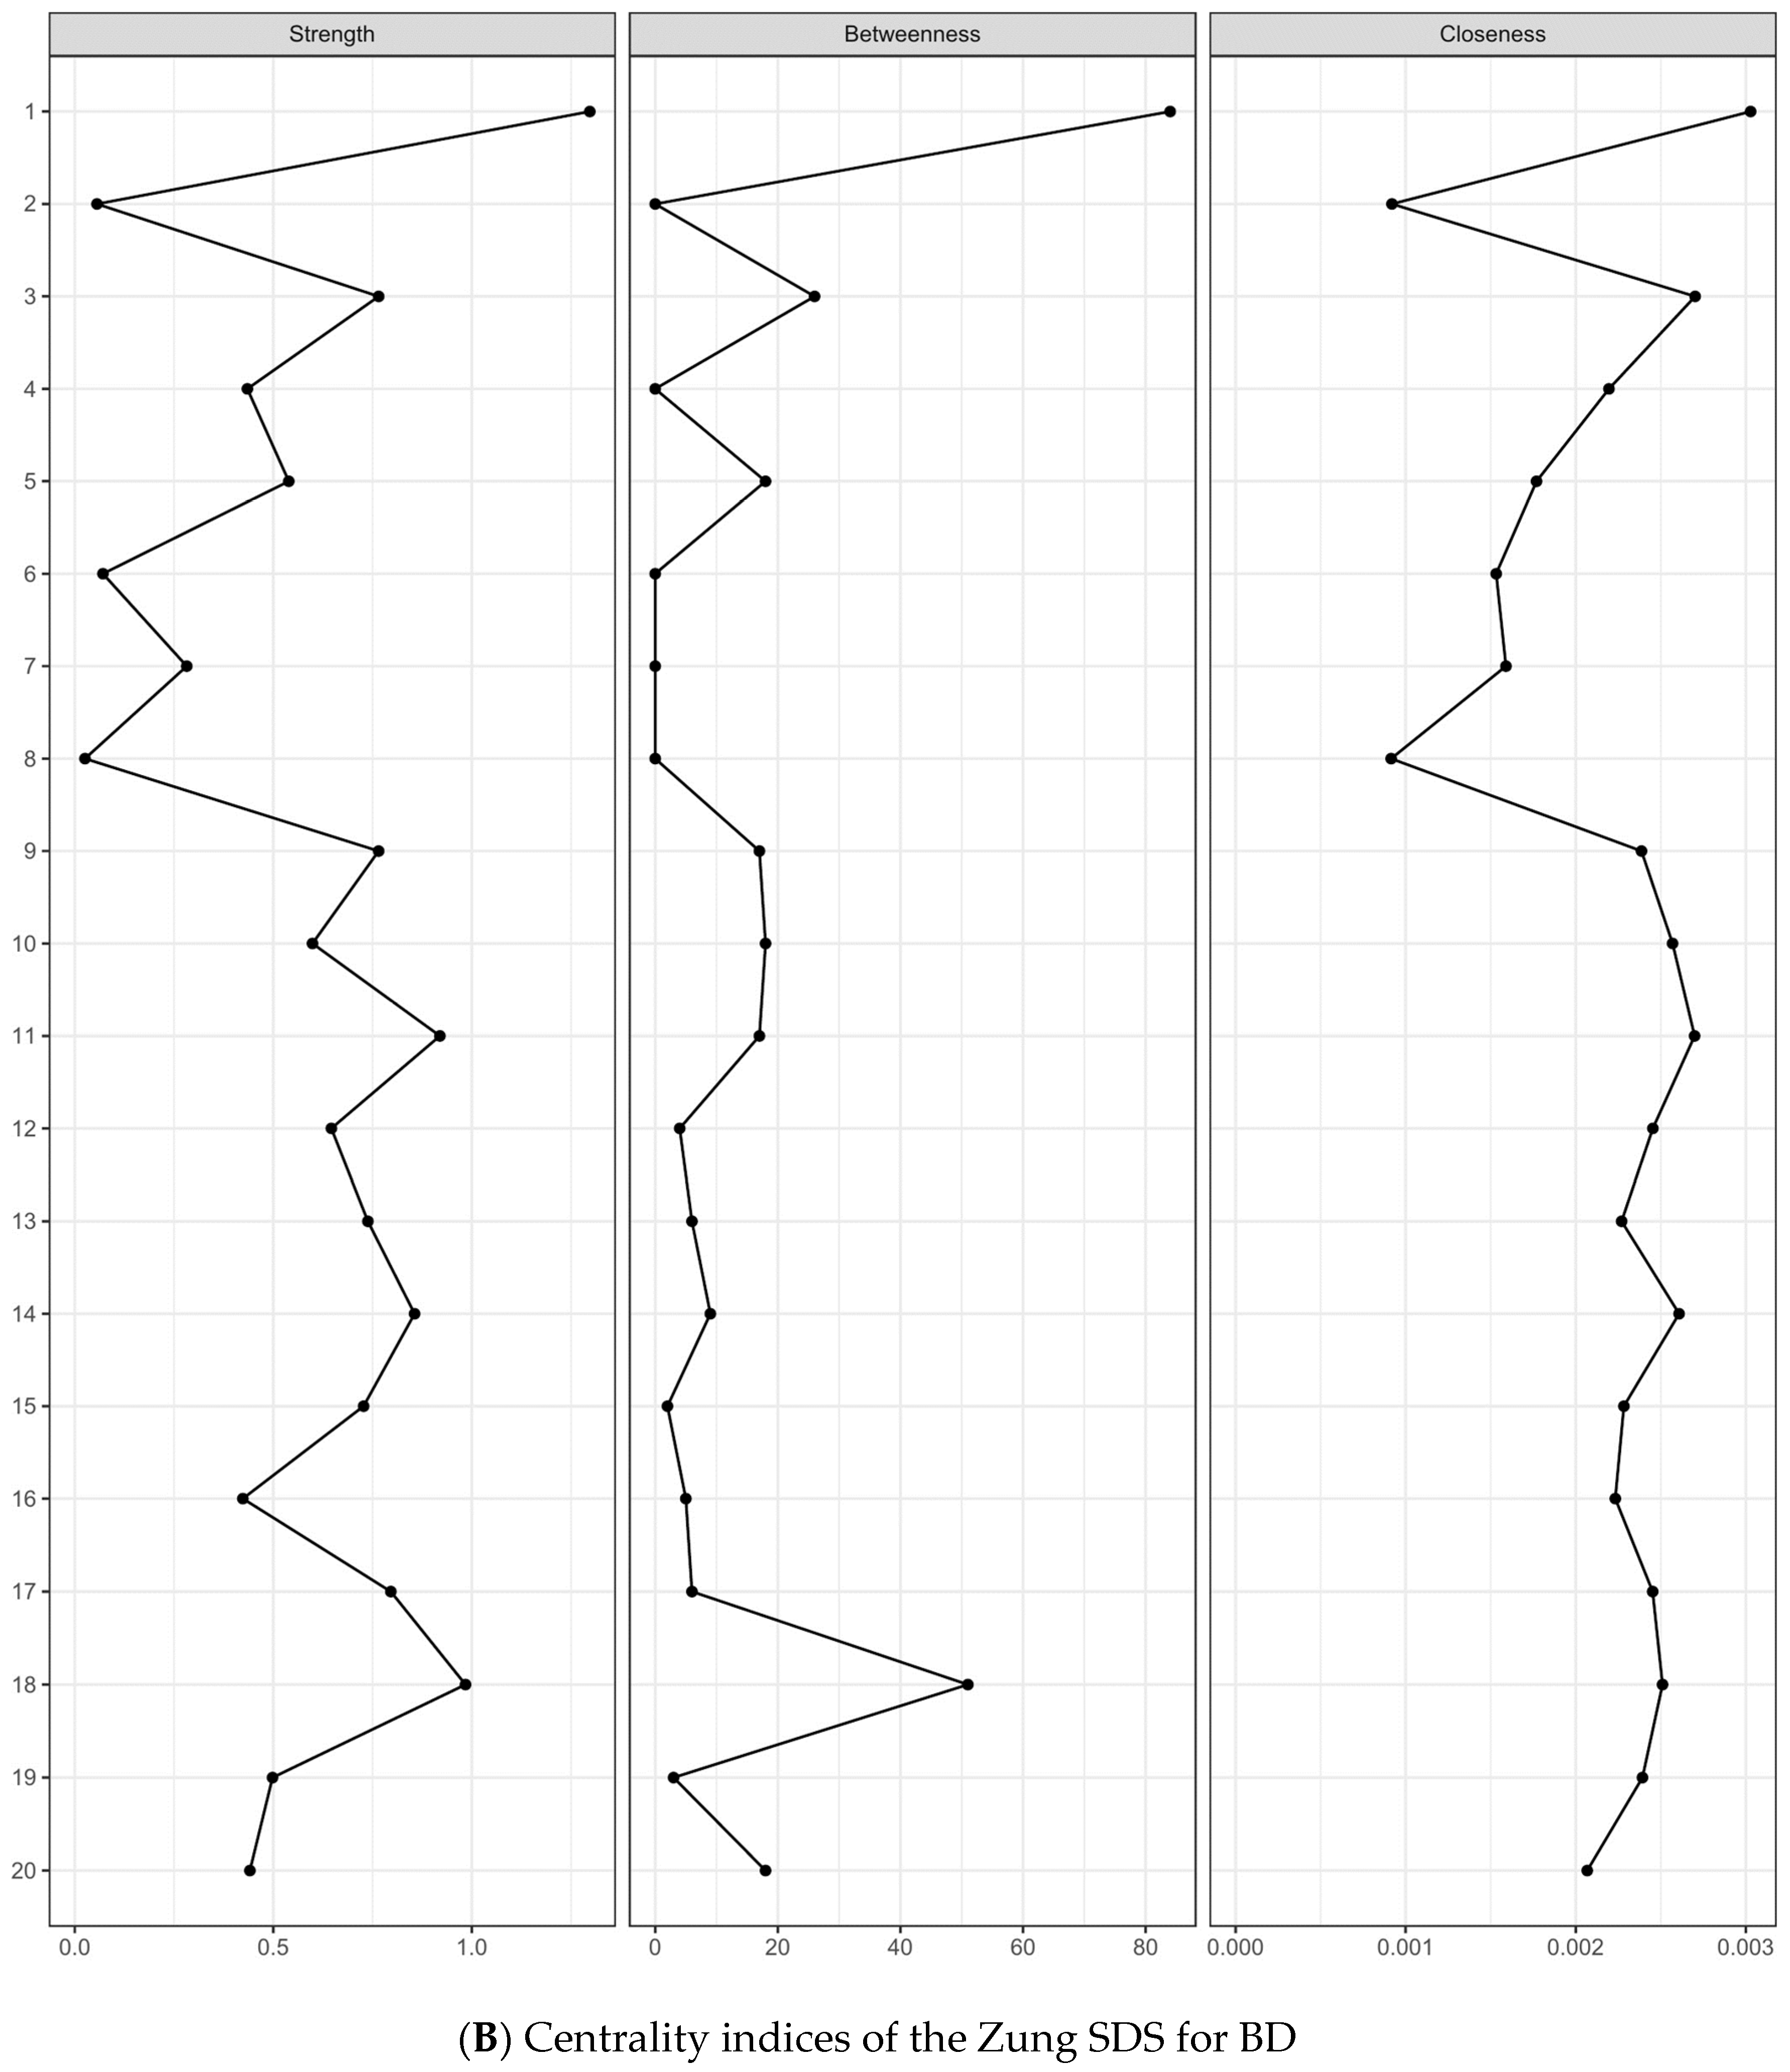
3.4. Centrality Indices and Edge Weights

The centrality indices for the study are outlined in Figure 2, highlighting that Item 1 (“Depressed affect”) consistently exhibited- high centrality across all the metrics in both the MDD and BD groups. Specifically, in the MDD group, the metrics were strength = 1.208, betweenness = 56, and closeness = 0.0030, whereas in the BD group, they were strength = 1.297, betweenness = 168, and closeness = 0.0030. In the MDD group, Items 14 (“Hopelessness”), 3 (“Crying spell”), 17 (“Personal devaluation”), and 18 (“Emptiness”) followed in the centrality metrics. In the BD group, Items 18 (“Emptiness”), 11 (“Confusion”), 14 (“Hopelessness”), 3 (“Crying spell”), and 9 (“Tachycardia”) followed. Notably, the bootstrapped difference tests confirmed the relative importance of these items (Supplementary Figures S7 and S8). In the MDD group, no significant differences in the strength centrality were observed among Items 1, 14, 3, 17, and 18 (Supplementary Figure S7). However, in the BD group, significant differences were found between Item 1 and Items 18, 11, 14, 3, and 9 (Supplementary Figure S8). Additionally, the bootstrapped difference tests for the edge weight (Supplementary Figures S9 and S10) showed that the edges between Item 11 (“Confusion”) and Item 12 (“Psychomotor retardation”), and between Item 14 (“Hopelessness”) and Item 17 (“Personal devaluation”), were most robust in the MDD group. Similarly, the edges between Item 14 (“Hopelessness”) and Item 17 (“Personal devaluation”), and between Item 11 (“Confusion”) and Item 12 (“Psychomotor retardation”), were most prominent in the BD group.

3.5. Network stability

In our investigation into the network stability, we assessed the indices of strength centrality in both patient groups—those with MDD and those with BD (Supplementary Figures S11 and S12). Our findings revealed that the correlation coefficient of 0.7 was maintained until 28.3% and 59.5% of the sample were removed in the MDD and BD groups, respectively. These results suggest a moderate-to-excellent level of strength stability in both groups.

3.6. Network Comparisons

In the comparative network analysis between patients with MDD and those with BD, we observed non-significant differences across the three pivotal metrics. Specifically, the overall network structure was not significantly different between the MDD and BD patients (M = 0.14, p = 0.623), while the difference in the global strength was also not significant as well (S = 0.309, p = 0.775). Additionally, no edges were found to be significant in the edge comparison tests.

4. Discussion

This study presents a network analysis using the Zung SDS, a severity rating scale for depressive symptoms, to explore the differences between MDD and BD. Our results revealed no significant differences in the results of the symptom severity scales or NCT within the network analysis, consistent with a previous study comparing MDD and BD [34]. This suggests that solely distinguishing between MDD and BD based on the characteristics of depressive episodes is a significant challenge.
In both the MDD and BD groups, Item 1 (“Depressed affect”) exhibited the strongest centrality in the network analysis. This finding aligns with previous network analyses of depression and the DSM-V, wherein “Depressed affect” is classified as a core symptom [11,52,53,54]. Moreover, “Depressed affect” not only has the highest impact on psychosocial functioning impairment among depressive symptoms but also serves as the most potent predictor of a depression diagnosis [55,56]. These observations are consistent with its centrality in our study.
We found that certain symptoms exhibited strong centrality despite not being included in the DSM-5 as core symptoms. Specifically, the symptoms “Personal devaluation” in MDD and “Confusion” in BD were identified as having strong centrality. “Personal devaluation” has well-established consistency in MDD [57,58]. Furthermore, a systematic review of network analyses of depressive symptoms in MDD revealed that the symptom of “Worthlessness” held significant centrality, in accordance with the results of the present study [59]. In BD, “Confusion” corresponds to the “Diminished ability to think or concentrate” in the DSM-5 and it is the second most commonly reported symptom among patients with mood disorder, following mood-related symptoms [60]. Cognitive symptoms in patients with BD are associated with a more severe prior course of illness, a higher number of manic episodes, more frequent hospitalizations, and a longer overall illness duration [61]. Despite not conforming to the DSM core symptom criteria, the strong centrality of these symptoms suggests that they should be carefully considered when assessing the interconnections and chronicity of depressive symptoms in patients with MDD and those with BD.
The symptoms that exhibited strong centrality in both groups, specifically “Emptiness” (Item 18) and “Hopelessness” (Item 14), indeed reflect the core symptoms of the DSM-5 (Supplementary Figures S7 and S8). “Hopelessness” is a symptom that encompasses both state and trait aspects [62]. It has long been a major focus of research on the etiology of depressive disorders related to cognitive vulnerabilities [62]. Longitudinal studies have shown that the symptom of “Hopelessness” plays a mediating role in the relationship between low levels of social support and increases in depressive symptoms, indicating its role not only as a symptom but also as a causal factor in MDD. Additionally, it is understood that “Emptiness” is a symptom serving as a defense mechanism to prevent psychotic regression and profound suffering, closely associated with social and occupational functional impairments [63,64,65,66]. The specificity of these symptoms of “Hopelessness” and “Emptiness” may have influenced the findings of this study.
In the NCT analysis, there were no significant differences between the MDD and BD groups. As indicated by previous findings, it is challenging to differentiate between these two groups based solely on the patterns of depressive symptoms [34,67]. This difficulty is reinforced by the absence of significant results in terms of the symptom mean differences in our study. Consequently, distinguishing between MDD and BD within an MDE necessitates a comprehensive, longitudinal evaluation, extending beyond a mere cross-sectional evaluation of depressive symptoms. This evaluation should consider associated factors, including comorbid anxiety and psychotic features, family history, substance use, medication response, seasonality, and history of suicide, with a recognition that variables such as alcohol use and family history may contribute to the differentiation, as revealed in our results [20,67,68,69,70].
Regarding the clustering and edge connections, Items 1, 3, 14, and 18 (“Depressed affect”, “Crying spell”, “Hopelessness” and “Emptiness”) align with the first criteria of the DSM-5 MDE symptoms, and the present study consistently demonstrates strong centrality for all four of these items. However, among the four symptoms, only “Hopelessness” and “Emptiness” are separately clustered in Group 2, aligning with prior research showing a strong association between these two symptoms (Figure 1) [71]. In addition, “Personal devaluation” also exhibits a robust edge with “Hopelessness” and “Emptiness” in both the MDD and BD groups. The relationships between “Hopelessness” and “Personal devaluation” are in line with Beck’s cognitive triad concept [72]. Consequently, “Emptiness”, despite being categorized as the first criterion of the DSM-5 MDE symptoms, presents distinct dimensions compared with the affective valence of “Depressed affect” and “Crying spell”. Furthermore, Items 11, 12, and 16 (“Confusion”, “Psychomotor retardation”, and “Indecisiveness”) are symptoms that cluster in both the MDD and BD groups, a finding that is in line with previous research on cognitive factors, demonstrating interconnectedness [73]. Moreover, the assessment of “Suicidal ideation” as a psychiatric emergency symptom reveals strong connections with “Personal devaluation”. Prior research has also established that “Personal devaluation” is a predictor of suicidal ideation and attempts, underscoring its significance in treatment [74,75,76].
This study must be interpreted in light of several limitations. First, network analysis is an evolving approach with enormous potential [29,77]. However, there are concerns about model selection, as well as uncertainties regarding reliability and replicability [78,79,80]. Particularly, in the analysis of symptom networks, selecting which symptoms to include is crucial; nevertheless, there is currently no consensus on which symptomatology to employ [33]. It is expected that ongoing research on various symptom clusters will lead to a consensus in this regard. Furthermore, to enhance the reliability and robustness of the study results, future investigations should consider extending the analysis by using non-metric dimension reduction techniques and canonical analysis. This extension is anticipated to contribute to elucidating the central depressive symptoms in both groups and exploring the connections among the clustering of symptoms. Secondly, due to the cross-sectional design of this study, the network analysis remains undirected, revealing associations but not establishing causal inferences. Consequently, it remains inconclusive whether the central symptom caused other adjacent depressive symptoms or vice versa. Additionally, due to the relatively small sample size, challenges in interpreting the closeness and betweenness compared to the strength of items persist. The potential for bias is also present due to the predominance of females in the total sample and the significant demographic differences between MDD and BD, such as age and alcohol use status. While previous studies have indicated no sex-based differences in the network structure, future research with a larger and more diverse sample is necessary for a more detailed analysis of these variables [81]. Thirdly, although there were general similarities, some differences in individual items were observed between the EGA and PCA results in this study. Future research should concentrate on integrating and comparing those two methods, emphasizing their dimensionality and loadings. Such an integrated approach would provide valuable insights into the underlying structures of depressive symptoms in MDD and BD.

5. Conclusions

This study aimed to explore the distinction in depressive symptoms between MDD and BD and to gain a deeper understanding of depressive symptomatology in both disorders using the depressive severity self-rating scale and network analysis. The results did not reveal significant differences in the depressive symptom severity between the two groups. In both MDD and BD, “Depressed affect” emerged as the most influential node. Additionally, certain symptoms that do not align with the core symptoms of an MDE per the DSM-5 exhibited strong centrality, that is, “Personal devaluation” in the MDD group and “Confusion” in the BD group. The present study demonstrated the challenge of differentiating between MDD and BD solely based on depressive symptoms. However, by identifying the influential symptoms and their associations, the study has contributed to an enhanced understanding of the depressive symptomatology within MDD and BD. Future research should focus on a diverse symptomatology range and consider adopting various models, including non-metric dimension reduction techniques, as well as canonical analysis with a larger sample size and a longitudinal evaluation of symptoms to better observe changes in symptomatology. Additionally, while the primary focus of this study was on the centrality in the network analysis, the results not only highlighted the similarities but also revealed some differences between PCA and EGA. This suggests the need for further research integrating these two analytical methods. Furthermore, the centrality findings from this study suggest the need for effectiveness validation of evidence-based interventions targeting symptoms with strong centrality.

Supplementary Materials

The following supporting information can be downloaded at: https://www.mdpi.com/article/10.3390/medicina60010032/s1, Figure S1. Raincloud plot of ages between patients with major depressive disorder and bipolar disorder. Figure S2. Raincloud plot of total Zung SDS score between patients with major depressive disorder and bipolar disorder. Figure S3. Scree plot illustrating principal component analysis for patients with major depressive disorder. Figure S4. Scree plot illustrating principal component analysis for patients with bipolar disorder. Figure S5. Network plot of Zung SDS from principal component analysis loadings in patients with major depressive disorder. Figure S6. Network plot of Zung SDS from principal component analysis loadings in patients with bipolar disorder. Figure S7. Bootstrapped difference tests between nodes in the Zung SDS 20-symptom-items network among major depressive disorder patients. Figure S8. Bootstrapped difference tests between nodes in the Zung SDS 20-symptom-items network among bipolar disorder patients. Figure S9. Bootstrapped difference tests between edge-weights that were in the Zung SDS 20-symptom-items network among major depressive disorder patients. Figure S10. Bootstrapped difference tests between edge-weights that were in the Zung SDS 20-symptom-items network among bipolar disorder patients. Figure S11. Bootstrapped the strength centrality stability of the Zung SDS 20-symptom-items network among major depressive disorder patients. Figure S12. Bootstrapped the strength centrality stability of the Zung SDS 20-symptom-items network among bipolar disorder patients. Table S1. Component loadings of Zung Self-Rating Depression Scale in major depressive disorder. Table S2. Component loadings of Zung Self-Rating Depression Scale in bipolar disorder.

Author Contributions

Conceptualization: J.P., T.H.H. and W.M.; data curation: H.L., D.L. and H.Y.; funding acquisition: W.M.; investigation: H.L.; supervision: H.S.K., J.P., T.H.H. and W.M.; statistical analysis: H.L.; writing original draft: H.L.; writing review and editing: all authors. All authors have read and agreed to the published version of the manuscript.

Funding

This work was supported by a National Research Foundation (NRF) of Korea Grant (NRF-2021R1A2C4001779; WM). The study’s conceptualization, data collection, analysis, and interpretation, as well as the preparation of this report, were conducted independently of the funding sources. The decision to submit the study for publication was made by the corresponding authors, who also had complete access to all the study’s data.

Institutional Review Board Statement

This study was conducted according to the guidelines of the Declaration of Helsinki and was approved by the Institutional Review Board of Seoul National Bundang Hospital (protocol code B-2205-756-111, approved 2 May 2022).

Informed Consent Statement

Patient consent was waived because the data were gathered through a medical chart review. Comparison consent was also waived, as the researchers did not have direct access to participants’ personal information and used anonymized survey data for the analyses.

Data Availability Statement

The data presented in this study are available on request from the corresponding author ([email protected]). The data are not publicly available due to containing patients’ medical information.

Conflicts of Interest

The authors declare no conflicts of interest.

References

  1. Kessler, R.C.; Berglund, P.; Demler, O.; Jin, R.; Koretz, D.; Merikangas, K.R.; Rush, A.J.; Walters, E.E.; Wang, P.S. The epidemiology of major depressive disorder: Results from the National Comorbidity Survey Replication (NCS-R). Jama 2003, 289, 3095–3105. [Google Scholar] [CrossRef] [PubMed]
  2. Merikangas, K.R.; Akiskal, H.S.; Angst, J.; Greenberg, P.E.; Hirschfeld, R.M.; Petukhova, M.; Kessler, R.C. Lifetime and 12-month prevalence of bipolar spectrum disorder in the National Comorbidity Survey replication. Arch. Gen. Psychiatry 2007, 64, 543–552. [Google Scholar] [CrossRef] [PubMed]
  3. Papakostas, G.I.; Petersen, T.; Mahal, Y.; Mischoulon, D.; Nierenberg, A.A.; Fava, M. Quality of life assessments in major depressive disorder: A review of the literature. Gen. Hosp. Psychiatry 2004, 26, 13–17. [Google Scholar] [CrossRef] [PubMed]
  4. Michalak, E.E.; Yatham, L.N.; Lam, R.W. Quality of life in bipolar disorder: A review of the literature. Health Qual. Life Outcomes 2005, 3, 72. [Google Scholar] [CrossRef] [PubMed]
  5. Cuijpers, P.; Smit, F. Excess mortality in depression: A meta-analysis of community studies. J. Affect. Disord. 2002, 72, 227–236. [Google Scholar] [CrossRef] [PubMed]
  6. Crump, C.; Sundquist, K.; Winkleby, M.A.; Sundquist, J. Comorbidities and mortality in bipolar disorder: A Swedish national cohort study. JAMA Psychiatry 2013, 70, 931–939. [Google Scholar] [CrossRef] [PubMed]
  7. Rihmer, Z.; Döme, P. Major mood disorders and suicidal behavior. In The International Handbook of Suicide Prevention; John Wiley & Sons, Inc.: Hoboken, NJ, USA, 2016; pp. 74–92. [Google Scholar]
  8. Perlis, R.H.; Ostacher, M.J.; Patel, J.K.; Marangell, L.B.; Zhang, H.; Wisniewski, S.R.; Ketter, T.A.; Miklowitz, D.J.; Otto, M.W.; Gyulai, L. Predictors of recurrence in bipolar disorder: Primary outcomes from the Systematic Treatment Enhancement Program for Bipolar Disorder (STEP-BD). Am. J. Psychiatry 2006, 163, 217–224. [Google Scholar] [CrossRef]
  9. Mueller, T.I.; Leon, A.C.; Keller, M.B.; Solomon, D.A.; Endicott, J.; Coryell, W.; Warshaw, M.; Maser, J.D. Recurrence after recovery from major depressive disorder during 15 years of observational follow-up. Am. J. Psychiatry 1999, 156, 1000–1006. [Google Scholar] [CrossRef]
  10. Solomon, D.A.; Keitner, G.I.; Miller, I.W.; Shea, M.T.; Keller, M.B. Course of illness and maintenance treatments for patients with bipolar disorder. J. Clin. Psychiatry 1995, 56, 5–13. [Google Scholar]
  11. American Psychiatric Association, D.; Association, A.P. Diagnostic and Statistical Manual of Mental Disorders: DSM-5; American Psychiatric Association: Washington, DC, USA, 2013; Volume 5. [Google Scholar]
  12. Perugi, G.; Angst, J.; Azorin, J.-M.; Bowden, C.L.; Mosolov, S.; Reis, J.; Vieta, E.; Young, A.H.; Group, B.-I.-M.S. Mixed features in patients with a major depressive episode: The BRIDGE-II-MIX study. J. Clin. Psychiatry 2015, 76, 12074. [Google Scholar] [CrossRef]
  13. Vieta, E.; Valentí, M. Mixed states in DSM-5: Implications for clinical care, education, and research. J. Affect. Disord. 2013, 148, 28–36. [Google Scholar] [CrossRef] [PubMed]
  14. Cuellar, A.K.; Johnson, S.L.; Winters, R. Distinctions between bipolar and unipolar depression. Clin. Psychol. Rev. 2005, 25, 307–339. [Google Scholar] [CrossRef] [PubMed]
  15. Abrams, R.; Taylor, M.A. A comparison of unipolar and bipolar depressive illness. Am. J. Psychiatry 1980, 137, 1084–1087. [Google Scholar] [PubMed]
  16. Brockington, I.F.; Altman, E.; Hillier, V.; Meltzer, H.Y.; Nand, S. The clinical picture of bipolar affective disorder in its depressed phase: A report from London and Chicago. Br. J. Psychiatry 1982, 141, 558–562. [Google Scholar] [CrossRef] [PubMed]
  17. Forty, L.; Smith, D.; Jones, L.; Jones, I.; Caesar, S.; Cooper, C.; Fraser, C.; Gordon-Smith, K.; Hyde, S.; Farmer, A. Clinical differences between bipolar and unipolar depression. Br. J. Psychiatry 2008, 192, 388–389. [Google Scholar] [CrossRef] [PubMed]
  18. Ghaemi, N.; Sachs, G.S.; Goodwin, F.K. What is to be done? Controversies in the diagnosis and treatment of manic-depressive illness. World J. Biol. Psychiatry 2000, 1, 65–74. [Google Scholar] [CrossRef] [PubMed]
  19. Yatham, L.N. Diagnosis and management of patients with bipolar II disorder. J. Clin. Psychiatry 2005, 66, 13–17. [Google Scholar]
  20. Goodwin, F.K.; Jamison, K.R. Manic-Depressive Illness: Bipolar Disorders and Recurrent Depression; Oxford University Press: Oxford, UK, 2007; Volume 2. [Google Scholar]
  21. Hirschfeld, R.M.; Lewis, L.; Vornik, L.A. Perceptions and impact of bipolar disorder: How far have we really come? Results of the national depressive and manic-depressive association 2000 survey of individuals with bipolar disorder. J. Clin. Psychiatry 2003, 64, 161–174. [Google Scholar] [CrossRef]
  22. Perlis, R.H.; Ostacher, M.J.; Goldberg, J.F.; Miklowitz, D.J.; Friedman, E.; Calabrese, J.; Thase, M.E.; Sachs, G.S. Transition to mania during treatment of bipolar depression. Neuropsychopharmacology 2010, 35, 2545–2552. [Google Scholar] [CrossRef]
  23. Valentí, M.; Pacchiarotti, I.; Bonnín, C.M.; Rosa, A.R.; Popovic, D.; Nivoli, A.M.; Goikolea, J.M.; Murru, A.; Undurraga, J.; Colom, F. Risk factors for antidepressant-related switch to mania. J. Clin. Psychiatry 2012, 73, 18391. [Google Scholar] [CrossRef]
  24. Baldessarini, R.J.; Salvatore, P.; Khalsa, H.M.K.; Gebre-Medhin, P.; Imaz, H.; González-Pinto, A.; Perez, J.; Cruz, N.; Maggini, C.; Tohen, M. Morbidity in 303 first-episode bipolar I disorder patients. Bipolar Disord. 2010, 12, 264–270. [Google Scholar] [CrossRef] [PubMed]
  25. Rosa, A.R.; Reinares, M.; Michalak, E.E.; Bonnin, C.M.; Sole, B.; Franco, C.; Comes, M.; Torrent, C.; Kapczinski, F.; Vieta, E. Functional impairment and disability across mood states in bipolar disorder. Value Health 2010, 13, 984–988. [Google Scholar] [CrossRef] [PubMed]
  26. Goodwin, G.M. Bipolar depression and treatment with antidepressants. Br. J. Psychiatry 2012, 200, 5–6. [Google Scholar] [CrossRef] [PubMed]
  27. Borsboom, D. Psychometric perspectives on diagnostic systems. J. Clin. Psychol. 2008, 64, 1089–1108. [Google Scholar] [CrossRef] [PubMed]
  28. Schmittmann, V.D.; Cramer, A.O.; Waldorp, L.J.; Epskamp, S.; Kievit, R.A.; Borsboom, D. Deconstructing the construct: A network perspective on psychological phenomena. New Ideas Psychol. 2013, 31, 43–53. [Google Scholar] [CrossRef]
  29. Borsboom, D. A network theory of mental disorders. World Psychiatry 2017, 16, 5–13. [Google Scholar] [CrossRef] [PubMed]
  30. Saxe, G.N. Network psychiatry: Computational methods to understand the complexity of psychiatric disorders. J. Am. Acad. Child Adolesc. Psychiatry 2017, 56, 639–641. [Google Scholar] [CrossRef]
  31. Barabási, A.-L. Network medicine—From obesity to the “diseasome”. N. Engl. J. Med. 2007, 357, 404–407. [Google Scholar] [CrossRef]
  32. van Borkulo, C.; Boschloo, L.; Borsboom, D.; Penninx, B.W.; Waldorp, L.J.; Schoevers, R.A. Association of symptom network structure with the course of depression. JAMA Psychiatry 2015, 72, 1219–1226. [Google Scholar] [CrossRef]
  33. Scott, J.; Crouse, J.J.; Ho, N.; Carpenter, J.; Martin, N.; Medland, S.; Parker, R.; Byrne, E.; Couvy-Duchesne, B.; Mitchell, B. Can network analysis of self-reported psychopathology shed light on the core phenomenology of bipolar disorders in adolescents and young adults? Bipolar Disord. 2021, 23, 584–594. [Google Scholar] [CrossRef]
  34. Corponi, F.; Anmella, G.; Verdolini, N.; Pacchiarotti, I.; Samalin, L.; Popovic, D.; Azorin, J.-M.; Angst, J.; Bowden, C.L.; Mosolov, S. Symptom networks in acute depression across bipolar and major depressive disorders: A network analysis on a large, international, observational study. Eur. Neuropsychopharmacol. 2020, 35, 49–60. [Google Scholar] [CrossRef] [PubMed]
  35. Sheehan, D.V.; Lecrubier, Y.; Sheehan, K.H.; Amorim, P.; Janavs, J.; Weiller, E.; Hergueta, T.; Baker, R.; Dunbar, G.C. The Mini-International Neuropsychiatric Interview (MINI): The development and validation of a structured diagnostic psychiatric interview for DSM-IV and ICD-10. J. Clin. Psychiatry 1998, 59, 22–33. [Google Scholar] [PubMed]
  36. Zung, W.W. A self-rating depression scale. Arch. Gen. Psychiatry 1965, 12, 63–70. [Google Scholar] [CrossRef] [PubMed]
  37. Zung, W.W. How normal is depression? Psychosom. J. Consult. Liaison Psychiatry 1972, 13, 174–178. [Google Scholar] [CrossRef] [PubMed]
  38. Zung, W.W. Zung self-rating depression scale and depression status inventory. In Assessment of Depression; Springer: Berlin/Heidelberg, Germany, 1986; pp. 221–231. [Google Scholar]
  39. Perugi, G.; Fornaro, M.; Maremmani, I.; Canonico, P.L.; Carbonatto, P.; Mencacci, C.; Muscettola, G.; Pani, L.; Torta, R.; Vampini, C. Discriminative hypomania checklist-32 factors in unipolar and bipolar major depressive patients. Psychopathology 2012, 45, 390–398. [Google Scholar] [CrossRef] [PubMed]
  40. Friedman, J.; Hastie, T.; Tibshirani, R. Sparse inverse covariance estimation with the graphical lasso. Biostatistics 2008, 9, 432–441. [Google Scholar] [CrossRef] [PubMed]
  41. Lauritzen, S.L.; Wermuth, N. Graphical models for associations between variables, some of which are qualitative and some quantitative. Ann. Stat. 1989, 17, 31–57. [Google Scholar] [CrossRef]
  42. Chen, J.; Chen, Z. Extended Bayesian information criteria for model selection with large model spaces. Biometrika 2008, 95, 759–771. [Google Scholar] [CrossRef]
  43. Epskamp, S.; Borsboom, D.; Fried, E.I. Estimating psychological networks and their accuracy: A tutorial paper. Behav. Res. Methods 2018, 50, 195–212. [Google Scholar] [CrossRef]
  44. Golino, H.F.; Epskamp, S. Exploratory graph analysis: A new approach for estimating the number of dimensions in psychological research. PLoS ONE 2017, 12, e0174035. [Google Scholar] [CrossRef]
  45. Christensen, A.P.; Golino, H. Estimating the stability of psychological dimensions via bootstrap exploratory graph analysis: A Monte Carlo simulation and tutorial. Psych 2021, 3, 479–500. [Google Scholar] [CrossRef]
  46. Golino, H.; Shi, D.; Christensen, A.P.; Garrido, L.E.; Nieto, M.D.; Sadana, R.; Thiyagarajan, J.A.; Martinez-Molina, A. Investigating the performance of exploratory graph analysis and traditional techniques to identify the number of latent factors: A simulation and tutorial. Psychol. Methods 2020, 25, 292. [Google Scholar] [CrossRef] [PubMed]
  47. Blondel, V.D.; Guillaume, J.-L.; Lambiotte, R.; Lefebvre, E. Fast unfolding of communities in large networks. J. Stat. Mech. Theory Exp. 2008, 2008, P10008. [Google Scholar] [CrossRef]
  48. Golino, H.; Christensen, A.P.; Moulder, R. EGAnet: Exploratory graph analysis: A framework for estimating the number of dimensions in multivariate data using network psychometrics. R Package Version 0.9 2020, 5, 3–10. [Google Scholar]
  49. Fried, E.I.; Boschloo, L.; Van Borkulo, C.D.; Schoevers, R.A.; Romeijn, J.-W.; Wichers, M.; De Jonge, P.; Nesse, R.M.; Tuerlinckx, F.; Borsboom, D. Commentary: “Consistent superiority of selective serotonin reuptake inhibitors over placebo in reducing depressed mood in patients with major depression”. Front. Psychiatry 2015, 6, 117. [Google Scholar] [CrossRef] [PubMed]
  50. Epskamp, S.; Waldorp, L.J.; Mõttus, R.; Borsboom, D. The Gaussian graphical model in cross-sectional and time-series data. Multivar. Behav. Res. 2018, 53, 453–480. [Google Scholar] [CrossRef] [PubMed]
  51. Van Borkulo, C.D.; van Bork, R.; Boschloo, L.; Kossakowski, J.J.; Tio, P.; Schoevers, R.A.; Borsboom, D.; Waldorp, L.J. Comparing network structures on three aspects: A permutation test. Psychol. Methods 2022. [Google Scholar] [CrossRef]
  52. Fried, E.I.; Epskamp, S.; Nesse, R.M.; Tuerlinckx, F.; Borsboom, D. What are ‘good’ depression symptoms? Comparing the centrality of DSM and non-DSM symptoms of depression in a network analysis. J. Affect. Disord. 2016, 189, 314–320. [Google Scholar] [CrossRef]
  53. Beard, C.; Millner, A.J.; Forgeard, M.J.; Fried, E.I.; Hsu, K.J.; Treadway, M.T.; Leonard, C.V.; Kertz, S.; Björgvinsson, T. Network analysis of depression and anxiety symptom relationships in a psychiatric sample. Psychol. Med. 2016, 46, 3359–3369. [Google Scholar] [CrossRef]
  54. Fried, E.I.; van Borkulo, C.D.; Epskamp, S.; Schoevers, R.A.; Tuerlinckx, F.; Borsboom, D. Measuring depression over time. Or not? Lack of unidimensionality and longitudinal measurement invariance in four common rating scales of depression. Psychol. Assess 2016, 28, 1354–1367. [Google Scholar] [CrossRef]
  55. Fried, E.I.; Nesse, R.M. The impact of individual depressive symptoms on impairment of psychosocial functioning. PLoS ONE 2014, 9, e90311. [Google Scholar] [CrossRef] [PubMed]
  56. Rosenström, T.; Elovainio, M.; Jokela, M.; Pirkola, S.; Koskinen, S.; Lindfors, O.; Keltikangas-Järvinen, L. Concordance between Composite International Diagnostic Interview and self-reports of depressive symptoms: A re-analysis. Int. J. Methods Psychiatr. Res. 2015, 24, 213–225. [Google Scholar] [CrossRef] [PubMed]
  57. Sartorius, N.; Jablensky, A.; Gulbinat, W.; Ernberg, G. WHO collaborative study: Assessment of depressive disorders. Psychol. Med. 1980, 10, 743–749. [Google Scholar] [CrossRef] [PubMed]
  58. Zahn, R.; Lythe, K.E.; Gethin, J.A.; Green, S.; Deakin, J.F.; Young, A.H.; Moll, J. The role of self-blame and worthlessness in the psychopathology of major depressive disorder. J. Affect. Disord. 2015, 186, 337–341. [Google Scholar] [CrossRef] [PubMed]
  59. Malgaroli, M.; Calderon, A.; Bonanno, G.A. Networks of major depressive disorder: A systematic review. Clin. Psychol. Rev. 2021, 85, 102000. [Google Scholar] [CrossRef] [PubMed]
  60. Keitner, G.I.; Solomon, D.A.; Ryan, C.E.; Miller, I.W.; Mallinger, A.; Kupfer, D.J.; Frank, E. Prodromal and residual symptoms in bipolar I disorder. Compr. Psychiatry 1996, 37, 362–367. [Google Scholar] [CrossRef] [PubMed]
  61. Robinson, L.J.; Ferrier, I.N. Evolution of cognitive impairment in bipolar disorder: A systematic review of cross-sectional evidence. Bipolar Disord. 2006, 8, 103–116. [Google Scholar] [CrossRef]
  62. Abramson, L.Y.; Metalsky, G.I.; Alloy, L.B. Hopelessness depression: A theory-based subtype of depression. Psychol. Rev. 1989, 96, 358. [Google Scholar] [CrossRef]
  63. LaFarge, L. Emptiness as defense in severe regressive states. J. Am. Psychoanal. Assoc. 1989, 37, 965–995. [Google Scholar] [CrossRef]
  64. Miller, C.E.; Lewis, K.L.; Huxley, E.; Townsend, M.L.; Grenyer, B.F.S. A 1-year follow-up study of capacity to love and work: What components of borderline personality disorder most impair interpersonal and vocational functioning? Pers. Ment. Health 2018, 12, 334–344. [Google Scholar] [CrossRef]
  65. Ellison, W.D.; Rosenstein, L.; Chelminski, I.; Dalrymple, K.; Zimmerman, M. The Clinical Significance of Single Features of Borderline Personality Disorder: Anger, Affective Instability, Impulsivity, and Chronic Emptiness in Psychiatric Outpatients. J. Pers. Disord. 2016, 30, 261–270. [Google Scholar] [CrossRef] [PubMed]
  66. Didonna, F.; Gonzalez, Y.R. Mindfulness and feelings of emptiness. In Clinical Handbook of Mindfulness; Springer: Berlin/Heidelberg, Germany, 2009; pp. 125–151. [Google Scholar]
  67. Hirschfeld, R. Differential diagnosis of bipolar disorder and major depressive disorder. J. Affect. Disord. 2014, 169, S12–S16. [Google Scholar] [CrossRef] [PubMed]
  68. Vöhringer, P.A.; Perlis, R.H. Discriminating between bipolar disorder and major depressive disorder. Psychiatr. Clin. 2016, 39, 1–10. [Google Scholar] [CrossRef] [PubMed]
  69. McElroy, S.L.; Kotwal, R.; Keck Jr, P.E.; Akiskal, H.S. Comorbidity of bipolar and eating disorders: Distinct or related disorders with shared dysregulations? J. Affect. Disord. 2005, 86, 107–127. [Google Scholar] [CrossRef]
  70. Angst, J.; Azorin, J.-M.; Bowden, C.L.; Perugi, G.; Vieta, E.; Gamma, A.; Young, A.H.; Group, B.S. Prevalence and characteristics of undiagnosed bipolar disorders in patients with a major depressive episode: The BRIDGE study. Arch. Gen. Psychiatry 2011, 68, 791–799. [Google Scholar] [CrossRef] [PubMed]
  71. Miller, C.E.; Townsend, M.L.; Day, N.J.S.; Grenyer, B.F.S. Measuring the shadows: A systematic review of chronic emptiness in borderline personality disorder. PLoS ONE 2020, 15, e0233970. [Google Scholar] [CrossRef] [PubMed]
  72. Beck, A.T. Cognitive Therapy of Depression; Guilford Press: New York, NY, USA, 1979. [Google Scholar]
  73. Romera, I.; Delgado-Cohen, H.; Perez, T.; Caballero, L.; Gilaberte, I. Factor analysis of the Zung self-rating depression scale in a large sample of patients with major depressive disorder in primary care. BMC Psychiatry 2008, 8, 4. [Google Scholar] [CrossRef]
  74. Linehan, M.M.; Goodstein, J.L.; Nielsen, S.L.; Chiles, J.A. Reasons for staying alive when you are thinking of killing yourself: The reasons for living inventory. J. Consult Clin. Psychol. 1983, 51, 276–286. [Google Scholar] [CrossRef]
  75. Malone, K.M.; Oquendo, M.A.; Haas, G.L.; Ellis, S.P.; Li, S.; Mann, J.J. Protective factors against suicidal acts in major depression: Reasons for living. Am. J. Psychiatry 2000, 157, 1084–1088. [Google Scholar] [CrossRef]
  76. Ellis, T.E.; Rutherford, B. Cognition and suicide: Two decades of progress. Int. J. Cogn. Ther. 2008, 1, 47–68. [Google Scholar] [CrossRef]
  77. Barabasi, A.-L. The network takeover. Nat. Phys. 2011, 8, 14–16. [Google Scholar] [CrossRef]
  78. Epskamp, S.; Kruis, J.; Marsman, M. Estimating psychopathological networks: Be careful what you wish for. PLoS ONE 2017, 12, e0179891. [Google Scholar] [CrossRef] [PubMed]
  79. Contreras, A.; Nieto, I.; Valiente, C.; Espinosa, R.; Vazquez, C. The Study of Psychopathology from the Network Analysis Perspective: A Systematic Review. Psychother. Psychosom. 2019, 88, 71–83. [Google Scholar] [CrossRef] [PubMed]
  80. Forbes, M.K.; Wright, A.G.C.; Markon, K.E.; Krueger, R.F. Evidence that psychopathology symptom networks have limited replicability. J. Abnorm. Psychol. 2017, 126, 969–988. [Google Scholar] [CrossRef]
  81. Vetter, J.S.; Spiller, T.R.; Cathomas, F.; Robinaugh, D.; Brühl, A.; Boeker, H.; Seifritz, E.; Kleim, B. Sex differences in depressive symptoms and their networks in a treatment-seeking population–a cross-sectional study. J. Affect. Disord. 2021, 278, 357–364. [Google Scholar] [CrossRef]
Figure 1. Network structure of the Zung SDS 20-symptom items for (A) MDD (n = 322) and (B) BD (n = 516). Each node (1 to 20) belongs to one of four distinct cluster. Description of their items’ symptoms are presented on the right side of the network. The thickness and saturation of the edges represent weights indicate the strength of the connection between two nodes. BD, bipolar disorder; MDD, major depressive disorder; SDS, Self-Rating Depression Scale.
Medicina 60 00032 g001
Figure 2. Centrality indices of the Zung SDS 20-symptom-items network for (A) MDD and (B) BD. The x-axis represents the standardized z-scores, and the y-axis represents the Zung SDS 20-symptom items. BD, bipolar disorder; MDD, major depressive disorder; SDS, Self-Rating Depression Scale.
Medicina 60 00032 g002aMedicina 60 00032 g002b
Table 1. Clinical and demographic characteristics of participants (n = 838).
CharacteristicsTotal Sample
Mean ± SD,
n or %
MDD
Mean ± SD,
n or %
BD
Mean ± SD,
n or %
Test
Statistics
Bonferroni
Corrected
p-Value
Age (years)34.39 ± 12.5538.21 ± 13.3632.00 ± 11.387.18<0.001 ***
Gender (%) 0.901.00
Male27.829.826.6
Female72.270.273.4
Education (%) 2.970.68
High school or below31.735.429.5
Others68.364.670.5
Employment status (%) 1.391.00
Unemployed45.147.843.4
Employed54.952.256.6
Marital status (%) 12.10<0.05 *
Married30.837.326.7
Others (Single, divorced, or widowed)69.262.773.3
Alcohol use status (%) 11.93<0.01 **
Former or current55.547.860.3
Never44.552.239.7
Smoking status (%) 0.941.00
Past or current32.647.833.9
Never67.452.266.1
Psychiatric familial history45.635.152.122.52<0.001 ***
Note. * p < 0.05, ** p < 0.001, *** p < 0.001. Abbreviation: BD, bipolar disorder; MDD, major depressive disorder; SDS, Self-Rating Depression Scale.
Table 2. Analysis of item scores of Zung SDS between major depressive disorder and bipolar disorder.
ItemsMean (SD)U_StatisticBonferroni Corrected
MDD
(n = 322)
BD
(n = 516)
p-Value
1I feel down-hearted and blue.2.79 (0.93)2.78 (0.81)83,3841.00
2Morning is when I feel the best.*3.58 (0.74)3.46 (0.82)89,542.0.49
3I have crying spells or feel like it.2.31 (0.90)2.26 (0.86)84,5311.00
4I have trouble sleeping at night.2.58 (1.05)2.54 (1.06)84,6911.00
5I eat as much as I used to.*2.50 (1.06)2.38 (1.06)88,5461.00
6I still enjoy sex.*3.68 (0.66)3.58 (0.72)90,0130.20
7I notice that I am losing weight.1.53 (0.79)1.45 (0.77)88,4081.00
8I have trouble with constipation.1.65 (0.91)1.76 (1.0)78,8881.00
9My heart beats faster than usual.2.25 (0.88)2.29 (0.91)80,6631.00
10I get tired for no reason.2.90 (0.90)2.99 (0.93)78,2981.00
11My mind is as clear as it used to be.*3.40 (0.82)3.51 (0.78)76,9390.75
12I find it easy to do the things I used to.*3.33 (0.86)3.48 (0.77)75,4210.22
13I am restless and can’t keep still.2.02 (0.87)2.13 (0.89)77,2511.00
14I feel hopeful about the future.*3.36 (0.81)3.41 (0.74)81,2421.00
15I am more irritable than usual.2.45 (0.96)2.40 (0.96)85,7911.00
16I find it easy to make decisions.*3.11 (0.92)3.23 (0.86)77,8041.00
17I feel that I am useful and needed.*3.17 (0.88)3.26 (0.85)78,0331.00
18My life is pretty full.*3.55 (0.71)3.60 (0.65)80,9911.00
19I feel that others would be better off if I were dead.1.62 (0.90)1.77 (0.99)76,6240.74
20I still enjoy the things I used to do.*3.29 (0.84)3.41 (0.72)78,2201.00
Total score55.08 (8.69)55.67 (7.86)79,7831.00
* Inversely coded items. Abbreviation: BD, bipolar disorder; MDD, major depressive disorder; SDS, Self-Rating Depression Scale.
Disclaimer/Publisher’s Note: The statements, opinions and data contained in all publications are solely those of the individual author(s) and contributor(s) and not of MDPI and/or the editor(s). MDPI and/or the editor(s) disclaim responsibility for any injury to people or property resulting from any ideas, methods, instructions or products referred to in the content.

