
Trends of Surgical Service Utilization for Lumbar Spinal Stenosis in South Korea: A 10-Year (2010–2019) Cross-Sectional Analysis of the Health Insurance Review and Assessment Service—National Patient Sample Data


Abstract
1. Introduction
2. Materials and Methods
2.1. Data Source
2.2. Study Design and Study Population
2.3. Study Outcomes
2.4. Statistical Analysis
3. Results
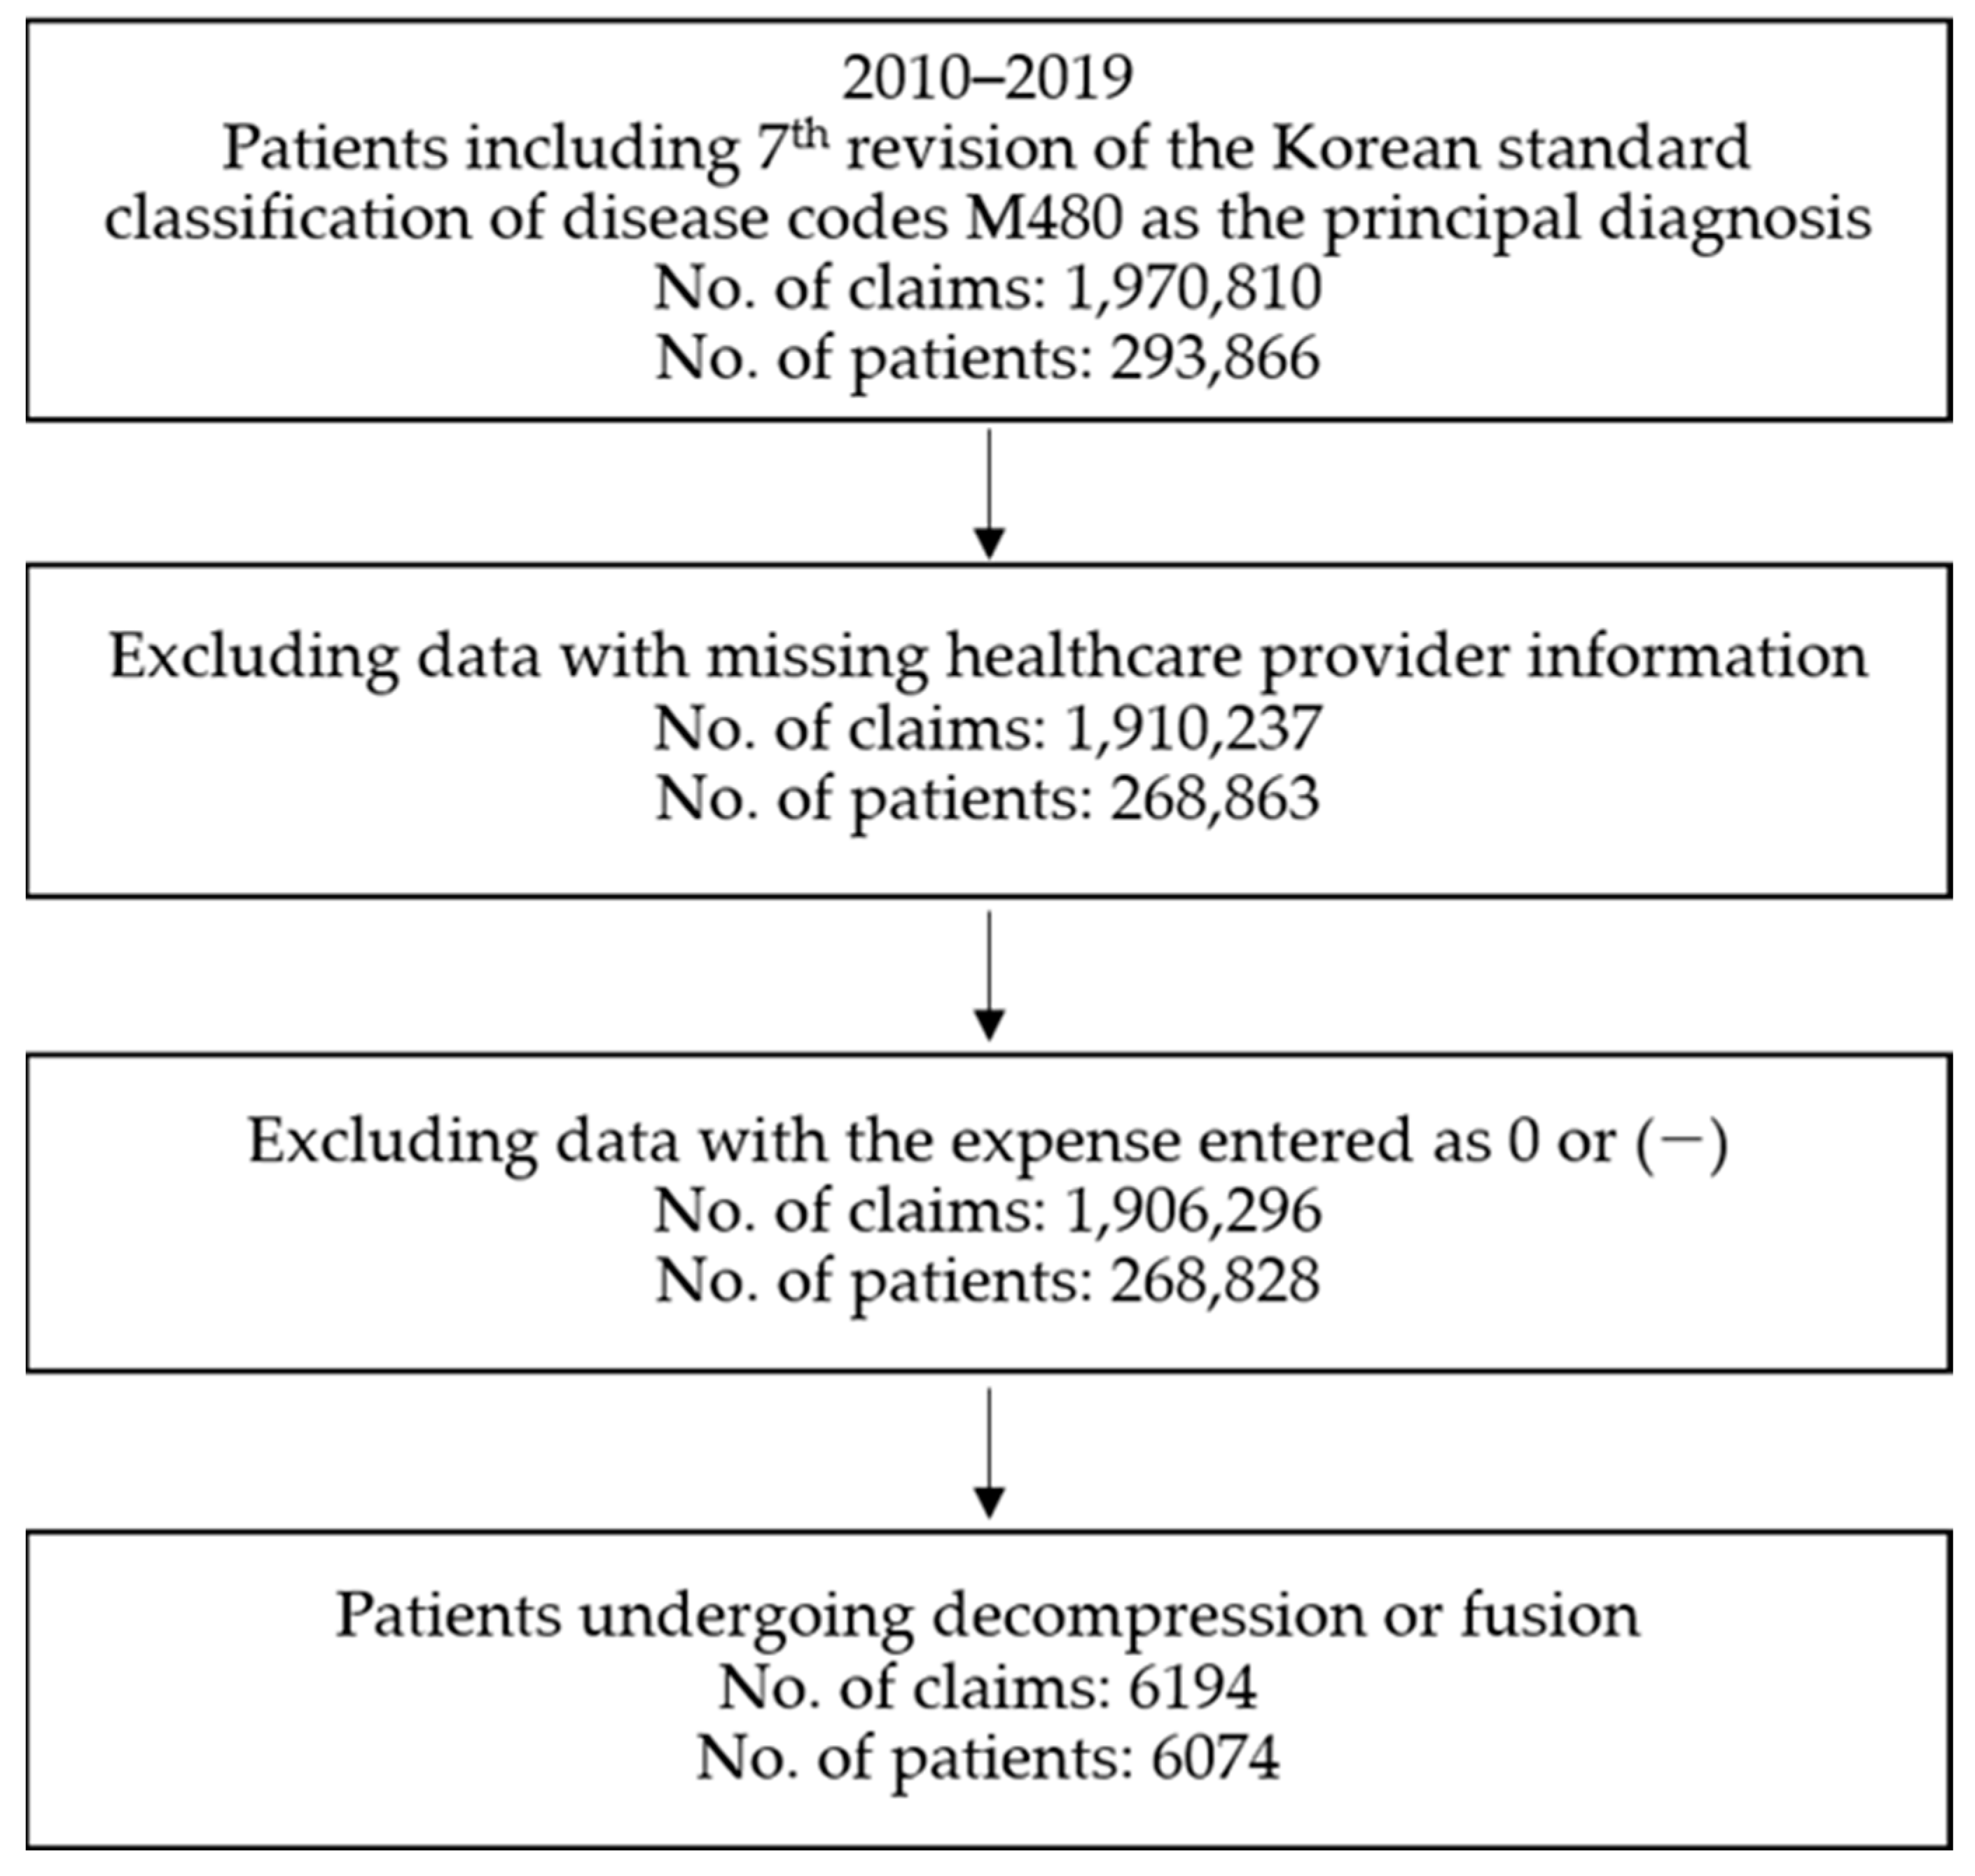
3.1. Flow Chart
3.2. General Characteristics of the Participants
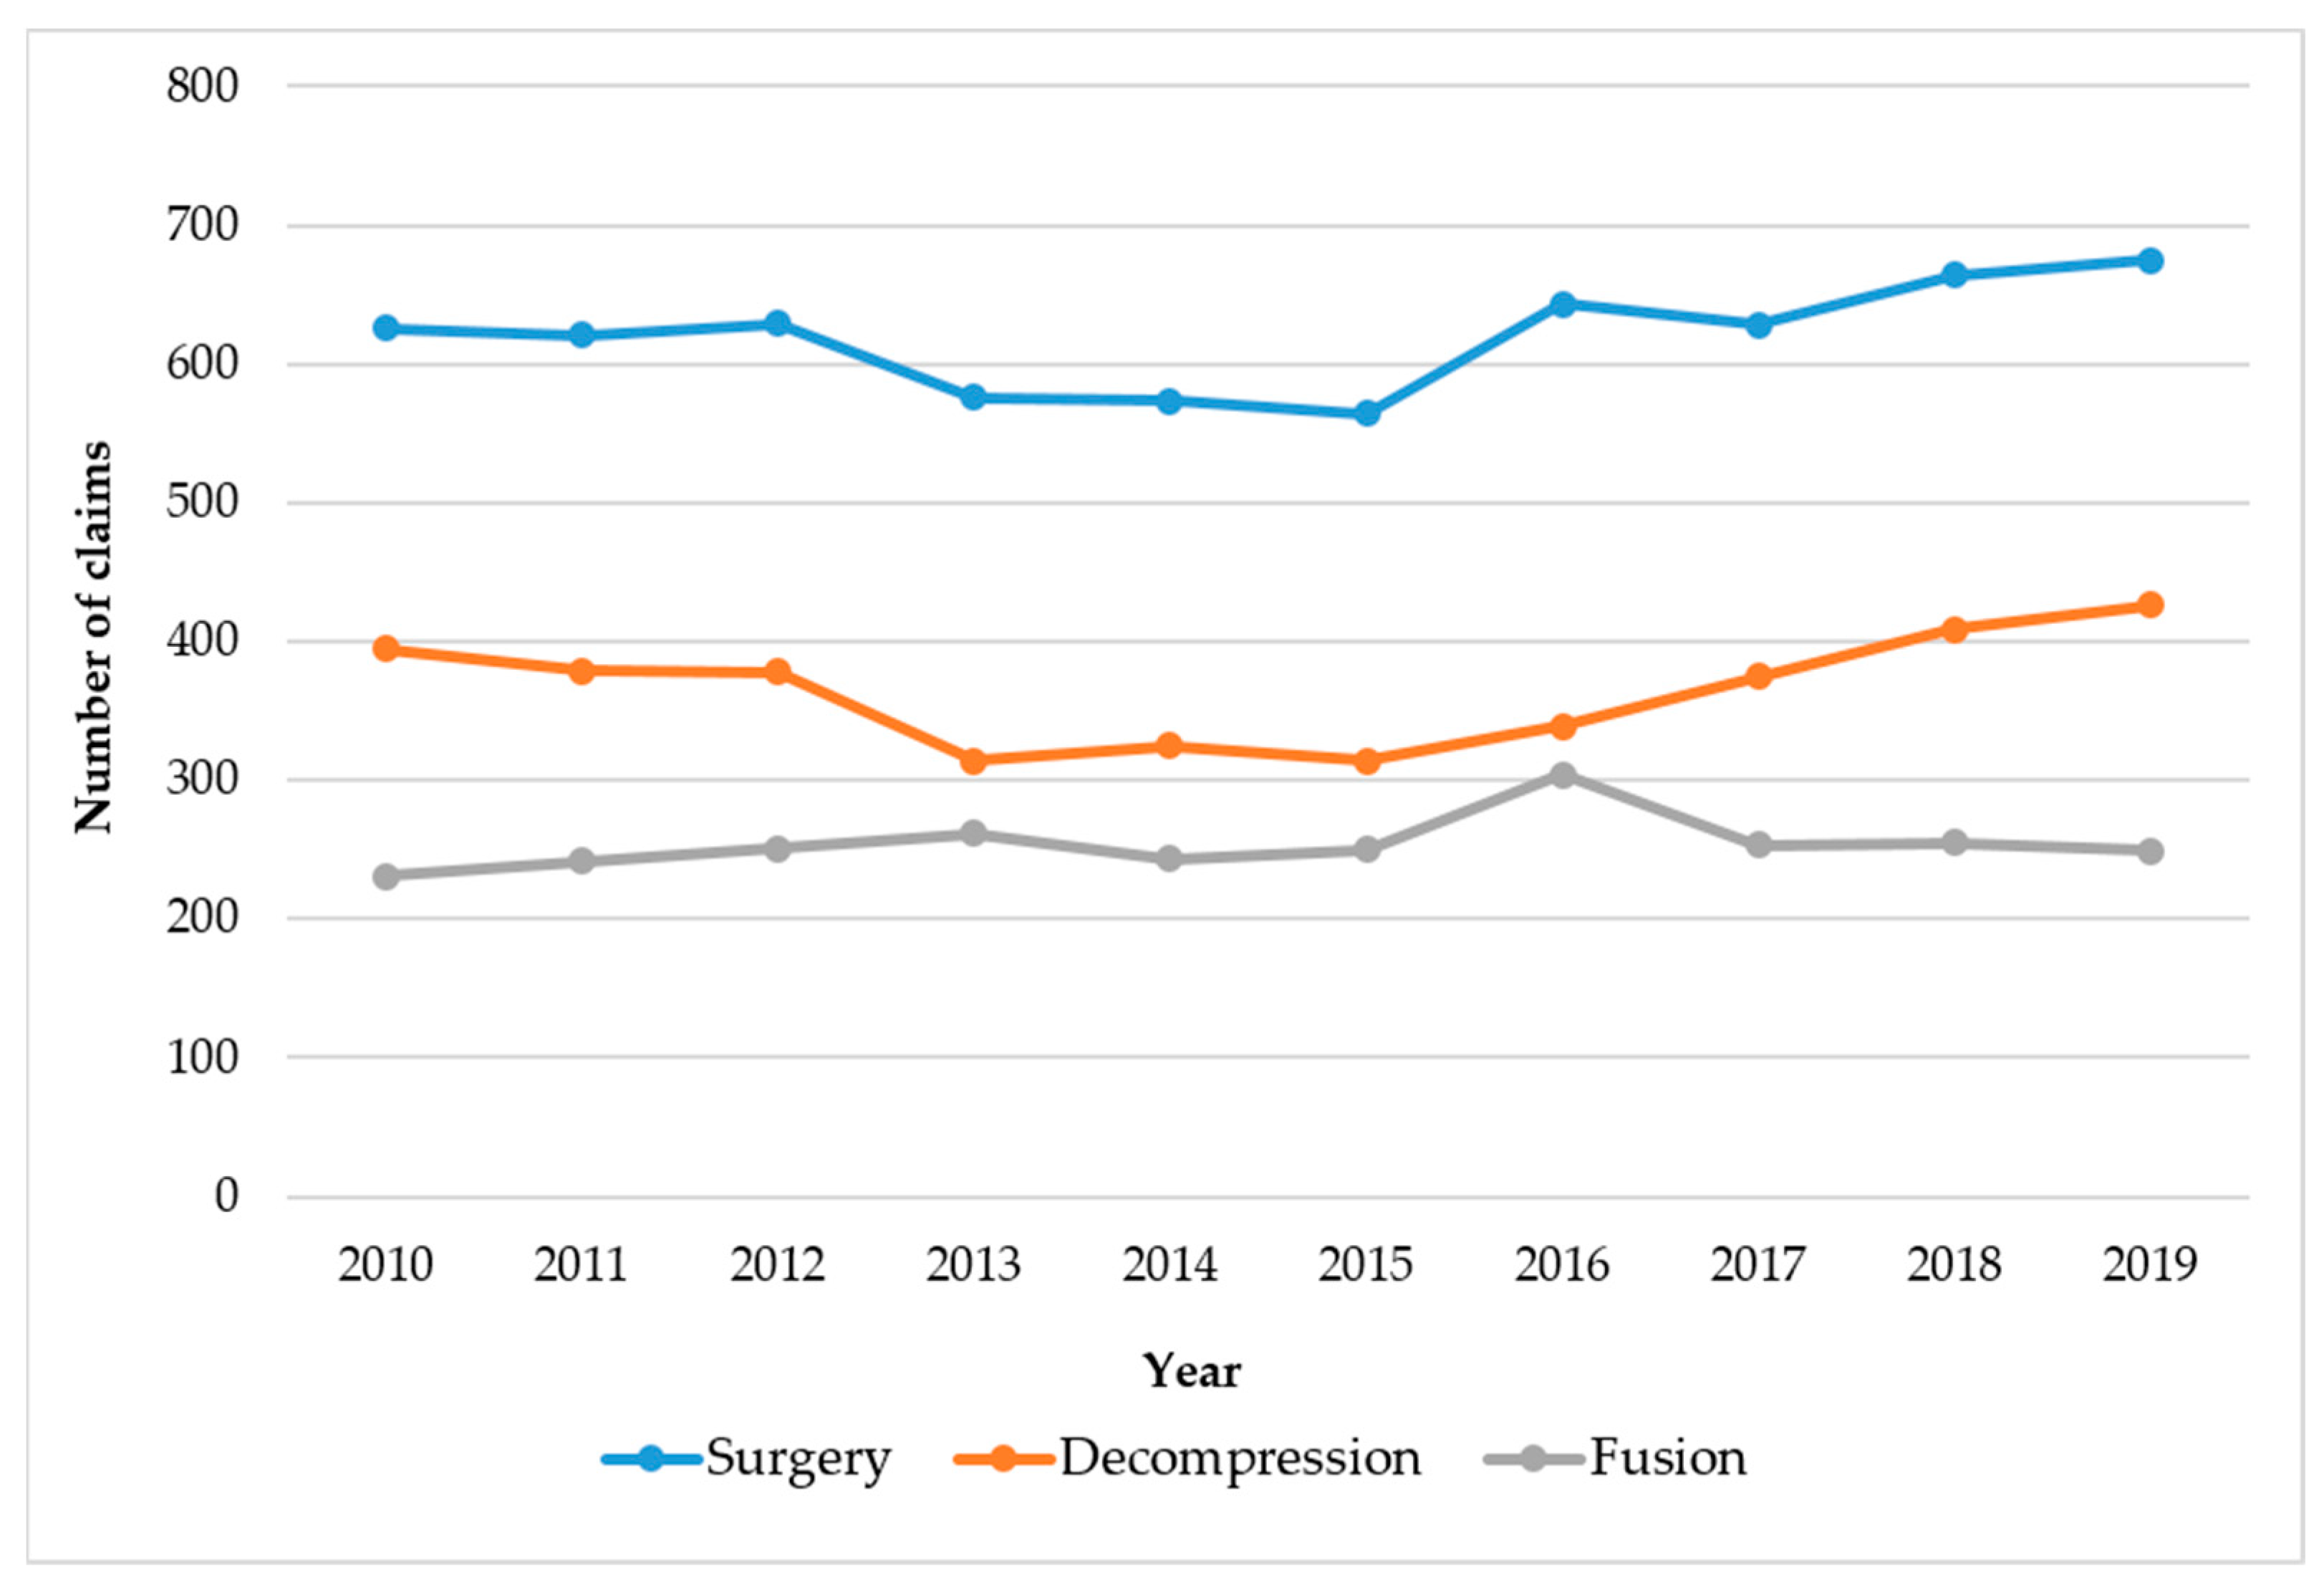
3.3. Overall Trends of Surgical Treatment for LSS
3.4. Patients Undergoing Two or More Surgeries
3.5. Analysis of Medical Service Utilization for the Inpatient Care of LSS Patients Undergoing Spinal Surgery
3.5.1. LOS and Medical Expenses
3.5.2. Details of Treatment Received for Inpatient Care
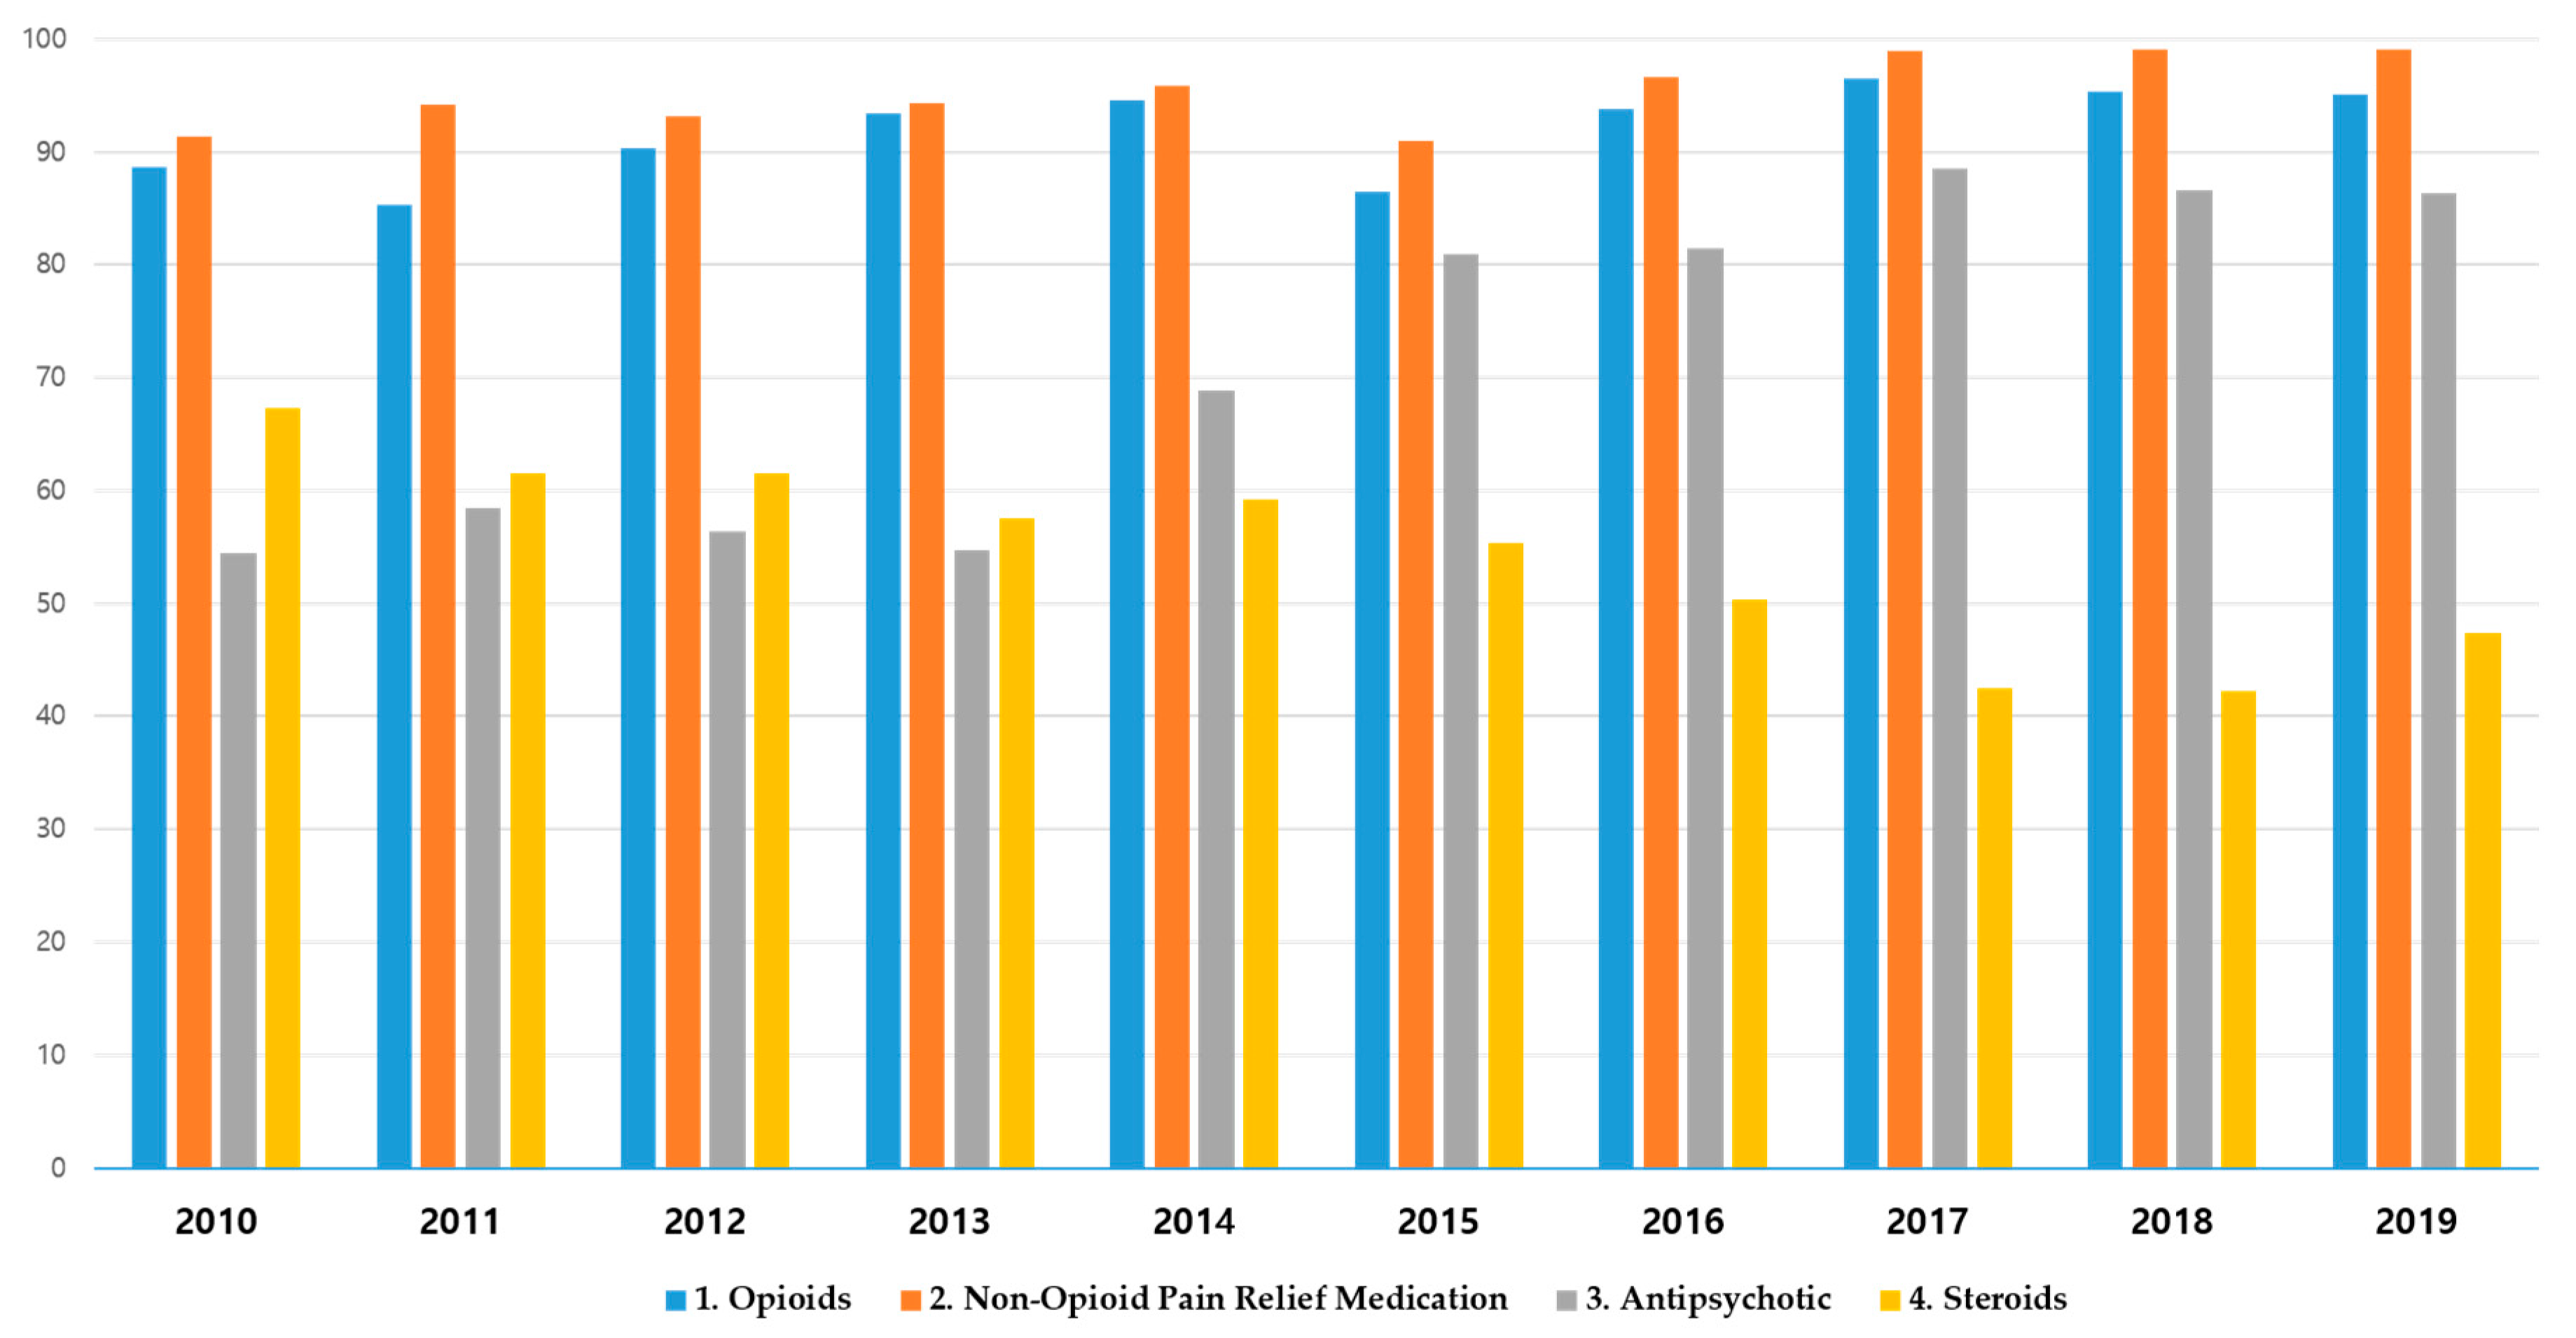
3.5.3. Details of Prescribed Medications during Inpatient Care
4. Discussion
Strengths and Limitations
5. Conclusions
Supplementary Materials
Author Contributions
Funding
Institutional Review Board Statement
Informed Consent Statement
Data Availability Statement
Conflicts of Interest
References
- Lee, B.H.; Moon, S.-H.; Suk, K.-S.; Kim, H.-S.; Yang, J.-H.; Lee, H.-M. Lumbar spinal stenosis: Pathophysiology and treatment principle: A narrative review. Asian Spine J. 2020, 14, 682. [Google Scholar] [CrossRef]
- Tomkins-Lane, C.; Melloh, M.; Lurie, J.; Smuck, M. ISSLS prize winner: Consensus on the clinical diagnosis of lumbar spinal stenosis. Spine 2016, 41, 1239–1246. [Google Scholar] [CrossRef]
- Kreiner, D.S.; Matz, P.; Bono, C.M.; Cho, C.H.; Easa, J.E.; Ghiselli, G.; Ghogawala, Z.; Reitman, C.A.; Resnick, D.K.; Watters, W.C., III. Guideline summary review: An evidence-based clinical guideline for the diagnosis and treatment of low back pain. Spine J. 2020, 20, 998–1024. [Google Scholar] [CrossRef] [PubMed]
- Jensen, R.K.; Jensen, T.S.; Koes, B.; Hartvigsen, J. Prevalence of lumbar spinal stenosis in general and clinical populations: A systematic review and meta-analysis. Eur. Spine J. 2020, 29, 2143–2163. [Google Scholar] [CrossRef] [PubMed]
- Katz, J.N.; Zimmerman, Z.E.; Mass, H.; Makhni, M.C. Diagnosis and management of lumbar spinal stenosis: A review. JAMA 2022, 327, 1688–1699. [Google Scholar] [CrossRef]
- Choi, S.Y.; Bae, J.M.; Choi, J.W.; Yang, G.Y.; Lee, B.R.; Kim, K.H. Patient’s Perception for developing research questions of a clinical practice guideline of Korean medicine for degenerative lumbar spinal stenosis: A descriptive cross-sectional survey. Korean J. Acupunct. 2018, 35, 130–138. [Google Scholar] [CrossRef]
- Ishimoto, Y.; Yoshimura, N.; Muraki, S.; Yamada, H.; Nagata, K.; Hashizume, H.; Takiguchi, N.; Minamide, A.; Oka, H.; Kawaguchi, H. Prevalence of symptomatic lumbar spinal stenosis and its association with physical performance in a population-based cohort in Japan: The Wakayama Spine Study. Osteoarthr. Cartil. 2012, 20, 1103–1108. [Google Scholar] [CrossRef]
- Patel, J.; Osburn, I.; Wanaselja, A.; Nobles, R. Optimal treatment for lumbar spinal stenosis: An update. Curr. Opin. Anaesthesiol. 2017, 30, 598–603. [Google Scholar] [CrossRef]
- Lurie, J.; Tomkins-Lane, C. Management of lumbar spinal stenosis. BMJ 2016, 352, h6234. [Google Scholar] [CrossRef]
- Kwon, J.-W.; Moon, S.-H.; Park, S.-Y.; Park, S.-J.; Park, S.-R.; Suk, K.-S.; Kim, H.-S.; Lee, B.H. Lumbar spinal stenosis: Review update 2022. Asian Spine J. 2022, 16, 789. [Google Scholar] [CrossRef]
- Herkowitz, H.N.; Kurz, L. Degenerative lumbar spondylolisthesis with spinal stenosis. A prospective study comparing decompression with decompression and intertransverse process arthrodesis. JBJS 1991, 73, 802–808. [Google Scholar] [CrossRef]
- Jensen, R.K.; Schiøttz-Christensen, B.; Skovsgaard, C.V.; Thorvaldsen, M.; Mieritz, R.M.; Andresen, A.K.; Christensen, H.W.; Hartvigsen, J. Surgery rates for lumbar spinal stenosis in Denmark between 2002 and 2018: A registry-based study of 43,454 patients. Acta Orthop. 2022, 93, 488. [Google Scholar] [CrossRef] [PubMed]
- Deyo, R.A.; Gray, D.T.; Kreuter, W.; Mirza, S.; Martin, B.I. United States trends in lumbar fusion surgery for degenerative conditions. Spine 2005, 30, 1441–1445. [Google Scholar] [CrossRef] [PubMed]
- Kim, C.H.; Chung, C.K.; Kim, M.J.; Choi, Y.; Kim, M.-J.; Shin, S.; Jung, J.-M.; Hwang, S.H.; Yang, S.H.; Park, S.B. Increased volume of surgery for lumbar spinal stenosis and changes in surgical methods and outcomes: A nationwide cohort study with a 5-year follow-up. World Neurosurg. 2018, 119, e313–e322. [Google Scholar] [CrossRef]
- Noh, S.H. Epidemiology of senile spinal diseases: A study based on the Health Insurance Review & Assessment Service database. J. Korean Med. Assoc. 2021, 64, 178–2021. [Google Scholar] [CrossRef]
- Shen, J.; Shen, X.; Xu, S.; Sen, Y.; Hao, J. Fusion or not for degenerative lumbar spinal stenosis: A meta-analysis and systematic review. Pain Physician 2018, 21, 1. [Google Scholar]
- Deyo, R.A.; Mirza, S.K.; Martin, B.I.; Kreuter, W.; Goodman, D.C.; Jarvik, J.G. Trends, major medical complications, and charges associated with surgery for lumbar spinal stenosis in older adults. JAMA 2010, 303, 1259–1265. [Google Scholar] [CrossRef]
- Deyo, R.; Cherkin, D.; Loeser, J.; Bigos, S.; Ciol, M. Morbidity and mortality in association with operations on the lumbar spine. The influence of age, diagnosis, and procedure. JBJS 1992, 74, 536–543. [Google Scholar] [CrossRef]
- Bono, C.M.; Lee, C.K. Critical analysis of trends in fusion for degenerative disc disease over the past 20 years: Influence of technique on fusion rate and clinical outcome. Spine 2004, 29, 455–463. [Google Scholar] [CrossRef]
- Martin, B.I.; Mirza, S.K.; Spina, N.; Spiker, W.R.; Lawrence, B.; Brodke, D.S. Trends in lumbar fusion procedure rates and associated hospital costs for degenerative spinal diseases in the United States, 2004 to 2015. Spine 2019, 44, 369–376. [Google Scholar] [CrossRef]
- Rajaee, S.S.; Bae, H.W.; Kanim, L.E.; Delamarter, R.B. Spinal fusion in the United States: Analysis of trends from 1998 to 2008. Spine 2012, 37, 67–76. [Google Scholar] [CrossRef]
- Försth, P.; Ólafsson, G.; Carlsson, T.; Frost, A.; Borgström, F.; Fritzell, P.; Öhagen, P.; Michaëlsson, K.; Sandén, B. A randomized, controlled trial of fusion surgery for lumbar spinal stenosis. N. Engl. J. Med. 2016, 374, 1413–1423. [Google Scholar] [CrossRef] [PubMed]
- Zaina, F.; Tomkins-Lane, C.; Carragee, E.; Negrini, S. Surgical versus non-surgical treatment for lumbar spinal stenosis. Cochrane Database Syst. Rev. 2016, 1, 1–49. [Google Scholar] [CrossRef] [PubMed]
- Yoo, J.-B.; Jang, H.J. Length of stay in PACU among surgical patients using data mining technique. J. Korea Acad.-Ind. Coop. Soc. 2013, 14, 3400–3411. [Google Scholar]
- Foley, K.T.; Holly, L.T.; Schwender, J.D. Minimally invasive lumbar fusion. Spine 2003, 28, S26–S35. [Google Scholar] [CrossRef]
- Ciol, M.A.; Deyo, R.A.; Kreuter, W.; Bigos, S.J. Characteristics in Medicare beneficiaries associated with reoperation after lumbar spine surgery. Spine 1994, 19, 1329–1334. [Google Scholar] [CrossRef]
- Kim, C.H.; Chung, C.K.; Park, C.S.; Choi, B.; Hahn, S.; Kim, M.J.; Lee, K.S.; Park, B.J. Reoperation rate after surgery for lumbar spinal stenosis without spondylolisthesis: A nationwide cohort study. Spine J. 2013, 13, 1230–1237. [Google Scholar] [CrossRef]
- Deyo, R.A.; Mirza, S.K. Trends and variations in the use of spine surgery. Clin. Orthop. Relat. Res. 2006, 443, 139–146. [Google Scholar] [CrossRef]
- Jansson, K.-Å.; Németh, G.; Granath, F.; Blomqvist, P. Spinal stenosis re-operation rate in Sweden is 11% at 10 years—A national analysis of 9,664 operations. Eur. Spine J. 2005, 14, 659–663. [Google Scholar] [CrossRef]
- Martin, B.I.; Mirza, S.K.; Comstock, B.A.; Gray, D.T.; Kreuter, W.; Deyo, R.A. Reoperation rates following lumbar spine surgery and the influence of spinal fusion procedures. Spine 2007, 32, 382–387. [Google Scholar] [CrossRef]
- Lee, Y.-W. Opioid therapy for chronic nonmaliganat pain. Hanyang Med. Rev. 2011, 31, 70–75. [Google Scholar] [CrossRef][Green Version]
- Megale, R.Z.; Deveza, L.A.; Blyth, F.M.; Naganathan, V.; Ferreira, P.H.; McLachlan, A.J.; Ferreira, M.L. Efficacy and safety of oral and transdermal opioid analgesics for musculoskeletal pain in older adults: A systematic review of randomized, placebo-controlled trials. J. Pain 2018, 19, 475.e1–475.e24. [Google Scholar] [CrossRef]
- Karhade, A.V.; Ogink, P.T.; Thio, Q.C.; Cha, T.D.; Gormley, W.B.; Hershman, S.H.; Smith, T.R.; Mao, J.; Schoenfeld, A.J.; Bono, C.M. Development of machine learning algorithms for prediction of prolonged opioid prescription after surgery for lumbar disc herniation. Spine J. 2019, 19, 1764–1771. [Google Scholar] [CrossRef] [PubMed]
- Walid, M.S.; Hyer, L.; Ajjan, M.; Barth, A.C.; Robinson, J.S., Jr. Prevalence of opioid dependence in spine surgery patients and correlation with length of stay. J. Opioid Manag. 2007, 3, 127–132. [Google Scholar] [CrossRef] [PubMed]
- Deyo, R.A.; Von Korff, M.; Duhrkoop, D. Opioids for low back pain. BMJ 2015, 350, g6380. [Google Scholar] [CrossRef]
- Lindenhovious, A.L.; Helmerhorts, G.T.; Schnellen, A.C.; Vrahas, M.; Ring, D.; Kloen, P. Differences in prescription of narcotic pain medication after operative treatment of hip and ankle fractures in the United States and The Netherlands. J. Trauma Acute Care Surg. 2009, 67, 160–164. [Google Scholar] [CrossRef]
- Li, R.J.; Li, M.L.; Leon, E.; Ng, C.W.; Shindo, M.; Manzione, K.; Andersen, P.; Clayburgh, D.; Wax, M.; Chan, J.Y. Comparison of opioid utilization patterns after major head and neck procedures between Hong Kong and the United States. JAMA Otolaryngol.–Head Neck Surg. 2018, 144, 1060–1065. [Google Scholar] [CrossRef]
- Shah, S.; Kapoor, S.; Durkin, B. Analgesic management of acute pain in the opioid-tolerant patient. Curr. Opin. Anaesthesiol. 2015, 28, 398–402. [Google Scholar] [CrossRef]
- Obata, H. Analgesic mechanisms of antidepressants for neuropathic pain. Int. J. Mol. Sci. 2017, 18, 2483. [Google Scholar] [CrossRef]
- Kim, J.M.; Park, S.H. Risk and benefit of steroid therapy. Korean J. Med. 2009, 77, 298–303. [Google Scholar]


| Total | Type of Surgery | |||
|---|---|---|---|---|
| Decompression | Fusion | p-Value | ||
| Total | 6194 (100) | 3654 (100) | 2540 (100) | |
| Age (years) | □ | □ | □ | <0.0001 |
| ≤44 | 203 (3.3) | 165 (4.5) | 38 (1.5) | |
| 45–54 | 675 (10.9) | 432 (11.8) | 243 (9.6) | |
| 55–64 | 1713 (27.7) | 990 (27.1) | 723 (28.5) | |
| 65–74 | 2482 (40.1) | 1371 (37.5) | 1111 (43.7) | |
| ≥75 | 1121 (18.1) | 696 (19.0) | 425 (16.7) | |
| Sex | □ | □ | □ | <0.0001 |
| Male | 2696 (43.5) | 1675 (45.8) | 1021 (40.2) | |
| Female | 3498 (56.5) | 1979 (54.2) | 1519 (59.8) | |
| Payer type | □ | □ | □ | <0.0001 |
| National Health Insurance | 5680 (91.7) | 3406 (93.2) | 2274 (89.5) | |
| Medicaid | 479 (7.7) | 228 (6.2) | 251 (9.9) | |
| Others | 35 (0.6) | 20 (0.5) | 15 (0.6) | |
| Type of visit | □ | □ | □ | 0.0007 |
| Outpatient | 15 (0.2) | 15 (0.4) | 0 (0.0) | |
| Inpatient | 6179 (99.8) | 3639 (99.6) | 2540 (100) | |
| Medical institutions | □ | □ | □ | <0.0001 |
| Tertiary hospitals | 2649 (42.8) | 1033 (28.3) | 1616 (63.6) | |
| General hospitals | 3449 (55.7) | 2545 (69.6) | 904 (35.6) | |
| Hospitals or local clinics | 96 (1.5) | 76 (2.1) | 20 (0.8) | |
| Category | No. of Patients, n (%) |
|---|---|
| Total number of patients | 79 |
| Number of surgeries | □ |
| Twice | 78 (98.7) |
| Thrice | 1 (1.3) |
| Year | □ |
| 2010 | 4 (5.1) |
| 2011 | 3 (3.8) |
| 2012 | 8 (10.1) |
| 2013 | 9 (11.4) |
| 2014 | 9 (11.4) |
| 2015 | 9 (11.4) |
| 2016 | 7 (8.9) |
| 2017 | 5 (6.3) |
| 2018 | 13 (16.5) |
| 2019 | 12 (15.2) |
| Sex | □ |
| Male | 35 (44.3) |
| Female | 44 (55.7) |
| Age (Years) | □ |
| ≤44 | 1 (1.3) |
| 45–54 | 11 (13.9) |
| 55–64 | 23 (29.1) |
| 65–74 | 33 (41.8) |
| ≥75 | 11 (13.9) |
| Characteristics of Surgery | Values | p-Value |
|---|---|---|
| Type of the first surgery, N (%) | □ | 0.0093 1 |
| Decompression | 52 (65.8) | |
| Fusion | 27 (34.2) | |
| Type of the second surgery, N (%) | □ | |
| Decompression | 39 (49.4) | |
| Fusion | 40 (50.6) | |
| Interval between the two surgeries (days) | □ | |
| Mean ± SD | 88.61 ± 70.16 | |
| Median(IQR) | 67 (35, 126) | |
| Medical expense (USD) | □ | 0.7404 2 |
| First surgery | 3887.92 ± 3171.12 | |
| Second surgery | 4034.26 ± 3450.92 | |
| Length of stay (days) | □ | 0.3406 2 |
| First surgery | 16.27 ± 11.81 | |
| Second surgery | 17.86 ± 12.57 |
| Category | Total | Type of Surgery | |
|---|---|---|---|
| Decompression | Fusion | ||
| Length of Stay (Days) | |||
| Age | □ | □ | □ |
| ≤44 | 12.93 ± 8.67 | 11.55 ± 7.13 | 18.92 ± 11.81 |
| 45–54 | 14.24 ± 8.22 | 12.53 ± 7.37 | 17.27 ± 8.78 |
| 55–64 | 14.41 ± 8.48 | 12.58 ± 7.75 | 16.91 ± 8.80 |
| 65–74 | 15.56 ± 9.37 | 13.15 ± 7.81 | 18.53 ± 10.24 |
| ≥75 | 16.02 ± 10.42 | 14.19 ± 9.16 | 19.01 ± 11.61 |
| Sex | □ | □ | □ |
| Male | 13.94 ± 8.77 | 11.97 ± 7.36 | 17.17 ± 9.89 |
| Female | 15.98 ± 9.46 | 13.96 ± 8.43 | 18.61 ± 10.07 |
| Medical expense (USD) | |||
| Age | |||
| ≤44 | 2329.15 ± 8.67 | 1879.04 ± 7.13 | 4283.59 ± 11.81 |
| 45–54 | 2988.59 ± 8.22 | 2039.98 ± 7.37 | 4675.02 ± 8.78 |
| 55–64 | 3513.05 ± 8.48 | 2164.21 ± 7.75 | 5360.00 ± 8.80 |
| 65–74 | 4041.33 ± 9.37 | 2468.05 ± 7.81 | 5982.78 ± 10.24 |
| ≥75 | 4056.42 ± 10.42 | 2732.02 ± 9.16 | 6225.33 ± 11.61 |
| Sex | □ | □ | □ |
| Male | 3434.28 ± 8.77 | 2239.85 ± 7.36 | 5393.79 ± 9.89 |
| Female | 3952.82 ± 9.46 | 2459.48 ± 8.43 | 5898.39 ± 10.07 |
| Total | Type of Surgery | ||
|---|---|---|---|
| Decompression | Fusion | ||
| □ | N (%) | N (%) | N (%) |
| Injection | □ | □ | □ |
| Subcutaneous or intramuscular injection | 5426 (87.6) | 3179 (87.0) | 2247 (88.5) |
| Intravenous injection | 6186 (99.9) | 3646 (99.8) | 2540 (100.0) |
| Intra articular injection | 146 (2.4) | 90 (2.5) | 56 (2.2) |
| Total | 6187 (99.9) | 3647 (99.8) | 2540 (100.0) |
| Nerve block | □ | □ | □ |
| Epidural block | 650 (10.5) | 376 (10.3) | 274 (10.8) |
| Peripheral branch block | 70 (1.1) | 40 (1.1) | 30 (1.2) |
| Spinal nerve plexus, root or ganglion block | 381 (6.2) | 245 (6.7) | 136 (5.4) |
| Sympathetic plexus or ganglion block | 2 (0.0) | - (0.0) | 2 (0.1) |
| Total | 996 (16.1) | 592 (16.2) | 404 (15.9) |
| Physical therapy | □ | □ | □ |
| Heat/cold therapy | 2262 (36.5) | 1526 (41.8) | 736 (29.0) |
| Electric therapy | 2277 (36.8) | 1528 (41.8) | 749 (29.5) |
| Trigger point injection therapy | 159 (2.6) | 89 (2.4) | 70 (2.8) |
| Exercise therapy | 663 (10.7) | 347 (9.5) | 316 (12.4) |
| Traction therapy | 48 (0.8) | 35 (1.0) | 13 (0.5) |
| Laser therapy | 374 (6.0) | 263 (7.2) | 111 (4.4) |
| Total | 2771 (44.7) | 1771 (48.5) | 1000 (39.4) |
| Total | 6194 (100.0) | 3654 (100.0) | 2540 (100.0) |
| □ | Total | Type of Surgery | |
|---|---|---|---|
| □ | Decompression | Fusion | |
| N (%) | N (%) | N (%) | |
| Opioids | 5717 (92.3) | 3235 (88.5) | 2482 (97.7) |
| Non-opioid analgesics | □ | □ | □ |
| Non-steroidal anti-inflammatory drugs | 5077 (82.0) | 2898 (79.3) | 2179 (85.8) |
| Neuralgia medication | 2332 (37.6) | 1065 (29.1) | 1267 (49.9) |
| Muscle relaxants | 4182 (67.5) | 2349 (64.3) | 1833 (72.2) |
| Others | 2148 (34.7) | 1091 (29.9) | 1057 (41.6) |
| Total | 5913 (95.5) | 3421 (93.6) | 2492 (98.1) |
| Anesthetics | 5679 (91.7) | 3342 (91.5) | 2337 (92.0) |
| Gastrointestinal medications | 6110 (98.6) | 3584 (98.1) | 2526 (99.4) |
| Antipsychotics | 4460 (72.0) | 2442 (66.8) | 2018 (79.4) |
| Antibiotics | □ | □ | □ |
| Systemic antibiotics | 255 (4.1) | 104 (2.8) | 151 (5.9) |
| Topical antibiotics | 5331 (86.1) | 2971 (81.3) | 2360 (92.9) |
| Total | 4460 (72.0) | 2442 (66.8) | 2018 (79.4) |
| Steroids | □ | □ | □ |
| Systemic steroids | 293 (4.7) | 131 (3.6) | 162 (6.4) |
| Topical steroids | 3229 (52.1) | 1726 (47.2) | 1503 (59.2) |
| Total | 3360 (54.2) | 1796 (49.2) | 1564 (61.6) |
| Total | 6194 (100.0) | 3654 (100.0) | 2540 (100.0) |
Disclaimer/Publisher’s Note: The statements, opinions and data contained in all publications are solely those of the individual author(s) and contributor(s) and not of MDPI and/or the editor(s). MDPI and/or the editor(s) disclaim responsibility for any injury to people or property resulting from any ideas, methods, instructions or products referred to in the content. |
© 2023 by the authors. Licensee MDPI, Basel, Switzerland. This article is an open access article distributed under the terms and conditions of the Creative Commons Attribution (CC BY) license (https://creativecommons.org/licenses/by/4.0/).
Share and Cite
Ji, H.; Shin, S.; Kim, Y.; Ha, I.-H.; Kim, D.; Lee, Y.J. Trends of Surgical Service Utilization for Lumbar Spinal Stenosis in South Korea: A 10-Year (2010–2019) Cross-Sectional Analysis of the Health Insurance Review and Assessment Service—National Patient Sample Data. Medicina 2023, 59, 1582. https://doi.org/10.3390/medicina59091582
Ji H, Shin S, Kim Y, Ha I-H, Kim D, Lee YJ. Trends of Surgical Service Utilization for Lumbar Spinal Stenosis in South Korea: A 10-Year (2010–2019) Cross-Sectional Analysis of the Health Insurance Review and Assessment Service—National Patient Sample Data. Medicina. 2023; 59(9):1582. https://doi.org/10.3390/medicina59091582
Chicago/Turabian StyleJi, HyungWook, Seungwon Shin, Yongjoo Kim, In-Hyuk Ha, Doori Kim, and Yoon Jae Lee. 2023. "Trends of Surgical Service Utilization for Lumbar Spinal Stenosis in South Korea: A 10-Year (2010–2019) Cross-Sectional Analysis of the Health Insurance Review and Assessment Service—National Patient Sample Data" Medicina 59, no. 9: 1582. https://doi.org/10.3390/medicina59091582
APA StyleJi, H., Shin, S., Kim, Y., Ha, I.-H., Kim, D., & Lee, Y. J. (2023). Trends of Surgical Service Utilization for Lumbar Spinal Stenosis in South Korea: A 10-Year (2010–2019) Cross-Sectional Analysis of the Health Insurance Review and Assessment Service—National Patient Sample Data. Medicina, 59(9), 1582. https://doi.org/10.3390/medicina59091582