
Hemogram-Derived Ratios in the Prognosis of Acute Diverticulitis

 , ,
, ,  and
and 
Abstract
:1. Introduction
2. Materials and Methods
2.1. Study Desing, Setting, and Participants
2.2. Variables of Interest
2.3. Data Sources and Measurements
2.4. Statistical Analysis
3. Results
3.1. General Characteristics
3.2. Patients’ Characteristics According to the Severity of Diverticulitis
3.3. Inflammatory Markers in Patients with AD
4. Discussion
5. Conclusions
Supplementary Materials
Author Contributions
Funding
Institutional Review Board Statement
Informed Consent Statement
Data Availability Statement
Conflicts of Interest
References
- Swanson, S.M.; Strate, L.L. Acute Colonic Diverticulitis. Ann. Intern. Med. 2018, 168, ITC65–ITC80. [Google Scholar] [CrossRef]
- Tursi, A.; Scarpignato, C.; Strate, L.L.; Lanas, A.; Kruis, W.; Lahat, A.; Danese, S. Colonic diverticular disease. Nat. Rev. Dis. Prim. 2020, 6, 20. [Google Scholar] [CrossRef]
- Trifan, A.; Gheorghe, C.; Marica Sabo, C.; Diculescu, M.; Nedelcu, L.; Singeap, A.M.; Sfarti, C.; Gheorghe, L.; Sporea, I.; Tanțău, M.; et al. Diagnosis and Treatment of Colonic Diverticular Disease: Position Paper of the Romanian Society of Gastroenterology and Hepatology. J. Gastrointest. Liver Dis. JGLD 2018, 27, 449–457. [Google Scholar] [CrossRef] [PubMed]
- Bharucha, A.E.; Parthasarathy, G.; Ditah, I.; Fletcher, J.G.; Ewelukwa, O.; Pendlimari, R.; Yawn, B.P.; Melton, L.J.; Schleck, C.; Zinsmeister, A.R. Temporal Trends in the Incidence and Natural History of Diverticulitis: A Population-Based Study. Am. J. Gastroenterol. 2015, 110, 1589–1596. [Google Scholar] [CrossRef] [PubMed]
- Laméris, W.; van Randen, A.; van Gulik, T.M.; Busch, O.R.; Winkelhagen, J.; Bossuyt, P.M.; Stoker, J.; Boermeester, M.A. A Clinical decision rule to establish the diagnosis of acute diverticulitis at the emergency department. Dis. Colon Rectum 2010, 53, 896–904. [Google Scholar] [CrossRef] [PubMed]
- Sartelli, M.; Weber, D.G.; Kluger, Y.; Ansaloni, L.; Coccolini, F.; Abu-Zidan, F.; Augustin, G.; Ben-Ishay, O.; Biffl, W.L.; Bouliaris, K.; et al. 2020 update of the WSES guidelines for the management of acute colonic diverticulitis in the emergency setting. World J. Emerg. Surg. WJES 2020, 15, 32. [Google Scholar] [CrossRef]
- Mari, A.; Khoury, T.; Lubany, A.; Safadi, M.; Farraj, M.; Farah, A.; Kadah, A.; Sbeit, W.; Mahamid, M. Neutrophil-to-Lymphocyte and Platelet-to-Lymphocyte Ratios Are Correlated with Complicated Diverticulitis and Hinchey Classification: A Simple Tool to Assess Disease Severity in the Emergency Department. Emerg. Med. Int. 2019, 2019, 6321060. [Google Scholar] [CrossRef]
- Hogan, J.; Sehgal, R.; Murphy, D.; O’Leary, P.; Coffey, J.C. Do Inflammatory Indices Play a Role in Distinguishing between Uncomplicated and Complicated Diverticulitis? Dig. Surg. 2017, 34, 7–11. [Google Scholar] [CrossRef]
- Reynolds, I.S.; Heaney, R.M.; Khan, W.; Khan, I.Z.; Waldron, R.; Barry, K. The Utility of Neutrophil to Lymphocyte Ratio as a Predictor of Intervention in Acute Diverticulitis. Dig. Surg. 2017, 34, 227–232. [Google Scholar] [CrossRef]
- Kim, J.H.; Han, S.H.; Lee, J.-W.; Kim, H.; Han, J. Platelet to lymphocyte ratio is a risk factor for failure of non-operative treatment of colonic diverticulitis. Sci. Rep. 2023, 13, 4377. [Google Scholar] [CrossRef]
- Zager, Y.; Horesh, N.; Dan, A.; Aharoni, M.; Khalilieh, S.; Cordoba, M.; Nevler, A.; Gutman, M.; Rosin, D. Associations of novel inflammatory markers with long-term outcomes and recurrence of diverticulitis. ANZ J. Surg. 2020, 90, 2041–2045. [Google Scholar] [CrossRef] [PubMed]
- Park, Y.Y.; Nam, S.; Han, J.H.; Lee, J.; Cheong, C. Predictive factors for conservative treatment failure of right colonic diverticulitis. Ann. Surg. Treat. Res. 2021, 100, 347–355. [Google Scholar] [CrossRef] [PubMed]
- Wasvary, H.; Turfah, F.; Kadro, O.; Beauregard, W. Same hospitalization resection for acute diverticulitis. Am. Surg. 1999, 65, 632–635; discussion 636. [Google Scholar] [CrossRef] [PubMed]
- Kaiser, A.M.; Jiang, J.-K.; Lake, J.P.; Ault, G.; Artinyan, A.; Gonzalez-Ruiz, C.; Essani, R.; Beart, R.W., Jr. The management of complicated diverticulitis and the role of computed tomography. Am. J. Gastroenterol. 2005, 100, 910–917. [Google Scholar] [CrossRef]
- Vandenbroucke, J.P.; von Elm, E.; Altman, D.G.; Gøtzsche, P.C.; Mulrow, C.D.; Pocock, S.J.; Poole, C.; Schlesselman, J.J.; Egger, M. Strengthening the Reporting of Observational Studies in Epidemiology (STROBE): Explanation and elaboration. PLoS Med. 2007, 4, e297. [Google Scholar] [CrossRef]
- Fugazzola, P.; Ceresoli, M.; Coccolini, F.; Gabrielli, F.; Puzziello, A.; Monzani, F.; Amato, B.; Sganga, G.; Sartelli, M.; Menichetti, F.; et al. The WSES/SICG/ACOI/SICUT/AcEMC/SIFIPAC guidelines for diagnosis and treatment of acute left colonic diverticulitis in the elderly. World J. Emerg. Surg. WJES 2022, 17, 5. [Google Scholar] [CrossRef]
- Palacios Huatuco, R.M.; Pantoja Pachajoa, D.A.; Bruera, N.; Pinsak, A.E.; Llahi, F.; Doniquian, A.M.; Alvarez, F.A.; Parodi, M. Neutrophil-to-lymphocyte ratio as a predictor of complicated acute diverticulitis: A retrospective cohort study. Ann. Med. Surg. 2021, 63, 102128. [Google Scholar] [CrossRef]
- Chang, C.-Y.; Hsu, T.-Y.; He, G.-Y.; Shih, H.-M.; Wu, S.-H.; Huang, F.-W.; Chen, P.-C.; Tsai, W.-C. Utility of monocyte distribution width in the differential diagnosis between simple and complicated diverticulitis: A retrospective cohort study. BMC Gastroenterol. 2023, 23, 96. [Google Scholar] [CrossRef]
- Suppiah, A.; Malde, D.; Arab, T.; Hamed, M.; Allgar, V.; Smith, A.M.; Morris-Stiff, G. The prognostic value of the neutrophil–lymphocyte ratio (NLR) in acute pancreatitis: Identification of an optimal NLR. J. Gastrointest. Surg. 2013, 17, 675–681. [Google Scholar] [CrossRef]
- Jeger, V.; Pop, R.; Forudastan, F.; Barras, J.P.; Zuber, M.; Piso, R.J. Is there a role for procalcitonin in differentiating uncomplicated and complicated diverticulitis in order to reduce antibiotic therapy? A prospective diagnostic cohort study. Swiss Med. Wkly. 2017, 147, w14555. [Google Scholar] [CrossRef]
- Shelat, V.G. Role of inflammatory indices in management of hepatocellular carcinoma—Neutrophil to lymphocyte ratio. Ann. Transl. Med. 2020, 8, 912. [Google Scholar] [CrossRef]
- Li, D.-Z.; Guo, J.; Song, Q.-K.; Hu, X.-J.; Bao, X.-L.; Lu, J. Prognostic prediction of the platelet-to-lymphocyte ratio in hepatocellular carcinoma: A systematic review and meta-analysis. Transl. Cancer Res. 2022, 11, 4037–4050. [Google Scholar] [CrossRef] [PubMed]
- Botoș, I.D.; Pantiș, C.; Bodolea, C.; Nemes, A.; Crișan, D.; Avram, L.; Negrău, M.O.; Hirișcău, I.E.; Crăciun, R.; Puia, C.I. The Dynamics of the Neutrophil-to-Lymphocyte and Platelet-to-Lymphocyte Ratios Predict Progression to Septic Shock and Death in Patients with Prolonged Intensive Care Unit Stay. Medicina 2023, 59, 32. [Google Scholar] [CrossRef] [PubMed]
- Pantic, I.; Lugonja, S.; Rajovic, N.; Dumic, I.; Milovanovic, T. Colonic Diverticulosis and Non-Alcoholic Fatty Liver Disease: Is There a Connection? Medicina 2021, 58, 38. [Google Scholar] [CrossRef] [PubMed]
- Aune, D.; Sen, A.; Leitzmann, M.F.; Norat, T.; Tonstad, S.; Vatten, L.J. Body mass index and physical activity and the risk of diverticular disease: A systematic review and meta-analysis of prospective studies. Eur. J. Nutr. 2017, 56, 2423–2438. [Google Scholar] [CrossRef]

| Characteristic | Number (%) (n = 147) | Uncomplicated AD (n = 82) | Complicated AD (n = 65) | p-Value |
|---|---|---|---|---|
| Age (years), mean (SD) | 60.8 (14.05) | 62.05 (14) | 59.22 (14.06) | 0.226 |
| Sex | ||||
| female | 72 (48,97) | 40 (57.14) | 32 (56.14) | 0.957 |
| Location of diverticula | ||||
| rectum | 1 (0.79) | 1 (1.43) | 0 (0) | 1 |
| sigmoid colon | 85 (66.93) | 38 (54.29) | 47 (82.46) | <0.001 |
| descending colon | 13 (10.24) | 6 (8.57) | 7 (12.28) | 0.493 |
| transverse colon | 4 (3.15) | 4 (5.71) | 0 (0) | 0.127 |
| ascending colon | 3 (2.36) | 2 (2.86) | 1 (1.75) | 1 |
| cecum | 0 (0) | |||
| Symptoms | ||||
| abdominal pain | 133 (91.72) | 72 (87.8) | 61 (96.83) | 0.051 |
| right iliac region | 10 (6.9) | 5 (6.1) | 5 (7.94) | 0.747 |
| right lumbar region | 4 (2.76) | 3 (3.66) | 1 (1.59) | 0.633 |
| right hypochondriac region | 3 (2.07) | 3 (3.66) | 0 (0) | 0.258 |
| epigastric region | 3 (2.07) | 3 (3.66) | 0 (0) | 0.258 |
| left hypochondriac region | 5 (3.45) | 5 (6.1) | 0 (0) | 0.069 |
| left lumbar region | 30 (20.69) | 20 (24.39) | 10 (15.87) | 0.209 |
| left iliac region | 63 (43.45) | 38 (46.34) | 25 (39.68) | 0.423 |
| hypogastric region | 19 (13.1) | 9 (10.98) | 10 (15.87) | 0.386 |
| umbilical region | 1 (0.69) | 1 (1.22) | 0 (0) | 1 |
| diffuse | 37 (25.52) | 13 (15.85) | 24 (38.1) | 0.002 |
| diarrhea at admission | 43 (29.66) | 29 (35.37) | 14 (22.22) | 0.086 |
| constipation at admission | 17 (11.72) | 14 (17.07) | 3 (4.76) | 0.022 |
| nausea | 19 (13.1) | 12 (14.63) | 7 (11.11) | 0.533 |
| vomiting | 17 (11.72) | 8 (9.76) | 9 (14.29) | 0.401 |
| fever | 27 (18.62) | 11 (13.41) | 16 (25.4) | 0.066 |
| Hinchey classification | ||||
| stage 0 | 43 (29.25) | |||
| stage IA | 39 (26.53) | |||
| stage IB | 10 (6.8) | |||
| stage II | 11 (7.48) | |||
| stage III | 44 (29.93) | |||
| stage IV | 0 (0) | |||
| Treatment | ||||
| conservative | 106 (72.11) | 80 (97.56) | 26 (40) | <0.001 |
| drainage | 22 (14.97) | 1 (1.22) | 21 (32.31) | <0.001 |
| surgery | ||||
| without | 103 (70.07) | 80 (97.56) | 23 (35.38) | |
| emergency | 37 (25.17) | 1 (1.22) | 36 (55.38) | <0.001 |
| elective | 7 (4.76) | 1 (1.22) | 6 (9.23) | |
| Recurrence | ||||
| one episode | 12 | |||
| two episodes | 2 | |||
| ≥ three episodes | 1 | |||
| unknown | 1 | |||
| Hinchey Classification | 0/Ia (n = 82) | Ib/II (n = 21) | III (n = 44) | p-Value |
|---|---|---|---|---|
| WBC (×109/mL), median (IQR) | 7.95 (6.45–9.84) | 11.11 (9.67–16.34) | 11.18 (7.29–13.26) | <0.001 (0.003/0.01/0.742) [n1 = 79, n2 = 20, n3 = 43] |
| WBC, n (%) | < 0.001 | |||
| Below NR | 0 (0) | 0 (0) | 2 (4.65) | |
| NR | 64 (81.01) | 10 (50) | 19 (44.19) | |
| Above NR | 15 (18.99) | 10 (50) | 22 (51.16) | |
| Ly (×109/mL), median (IQR) | 1.6 (1.24–2) | 1.35 (1.05–1.72) | 1.44 (0.9–1.76) | 0.096 (0.336/0.233/1) [n1 = 75, n2 = 14, n3 = 36] |
| Ly, n (%) | 0.012 | |||
| Below NR | 9 (12) | 3 (21.43) | 13 (36.11) | |
| NR | 66 (88) | 11 (78.57) | 23 (63.89) | |
| M (×109/mL), median (IQR) | 0.47 (0.37–0.71) | 0.76 (0.52–0.92) | 0.55 (0.4–0.74) | 0.169 (0.163/0.85/0.523) [n1 = 69, n2 = 10, n3 = 25] |
| M, n (%) | 0.017 | |||
| Below NR | 0 (0) | 0 (0) | 2 (8) | |
| NR | 58 (84.06) | 5 (50) | 18 (72) | |
| Above NR | 11 (15.94) | 5 (50) | 5 (20) | |
| N (×109/mL), median (IQR) | 5.38 (4.16–7.36) | 8.69 (6.96–12.3) | 9.48 (5.38–11.96) | <0.001 (0.004/0.009/0.983) [n1 = 75, n2 = 14, n3 = 36] |
| N, n (%) | <0.001 | |||
| Below NR | 1 (1.33) | 0 (0) | 1 (2.78) | |
| NR | 54 (72) | 4 (28.57) | 13 (36.11) | |
| Above NR | 20 (26.67) | 10 (71.43) | 22 (61.11) | |
| P (×103/mL), median (IQR) | 239 (195.5–273.5) | 300 (272.5–447.5) | 257 (227–354) | <0.001 (<0.001/0.175/0.051) [n1 = 79, n2 = 20, n3 = 42] |
| P, n (%) | 0.01 | |||
| Below NR | 4 (5.06) | 0 (0) | 4 (9.52) | |
| NR | 72 (91.14) | 15 (75) | 31 (73.81) | |
| Above NR | 3 (3.8) | 5 (25) | 7 (16.67) |
| Hinchey Classification | 0/Ia (n = 82) | Ib/II (n = 21) | III (n = 44) | p-Value |
|---|---|---|---|---|
| MLR, median (IQR) | 0.35 (0.21–0.42) | 0.43 (0.4–0.6) | 0.42 (0.28–0.62) | 0.013 (0.101/0.133/0.738) [n1 = 69, n2 = 10, n3 = 25] |
| NLR, median (IQR) | 3.53 (2.51–4.81) | 5.86 (4.14–13.18) | 6.96 (5.1–10.52) | <0.001 (0.006/<0.001/0.976) [n1 = 75, n2 = 14, n3 = 36] |
| PDW, median (IQR) | 13.75 (11.83–16) | 12.9 (10.75–15.75) | 13.95 (11.12–15.9) | 0.318 (0.383/0.614/0.767) [n1 = 70, n2 = 16, n3 = 40] |
| PLR, median (IQR) | 140.15 (108.1–214.34) | 278.32 (204.28–426.21) | 228.7 (149.68–400.46) | <0.001 (0.002/0.006/0.541) [n1 = 75, n2 = 14, n3 = 36] |
| RDW, median (IQR) | 42.3 (40.1–46.6) | 44.65 (41.18–50.9) | 43.3 (41.5–46.2) | 0.443 (0.584/0.755/0.782) [n1 = 65, n2 = 12, n3 = 29] |
| SII, median (IQR) | 773.24 (539.28–1173.68) | 2856.29 (1434.65–3631.29) | 1689.24 (1310.22–3532.76) | <0.001 (<0.001/<0.001/0.775) [n1 = 75, n2 = 14, n3 = 36] |
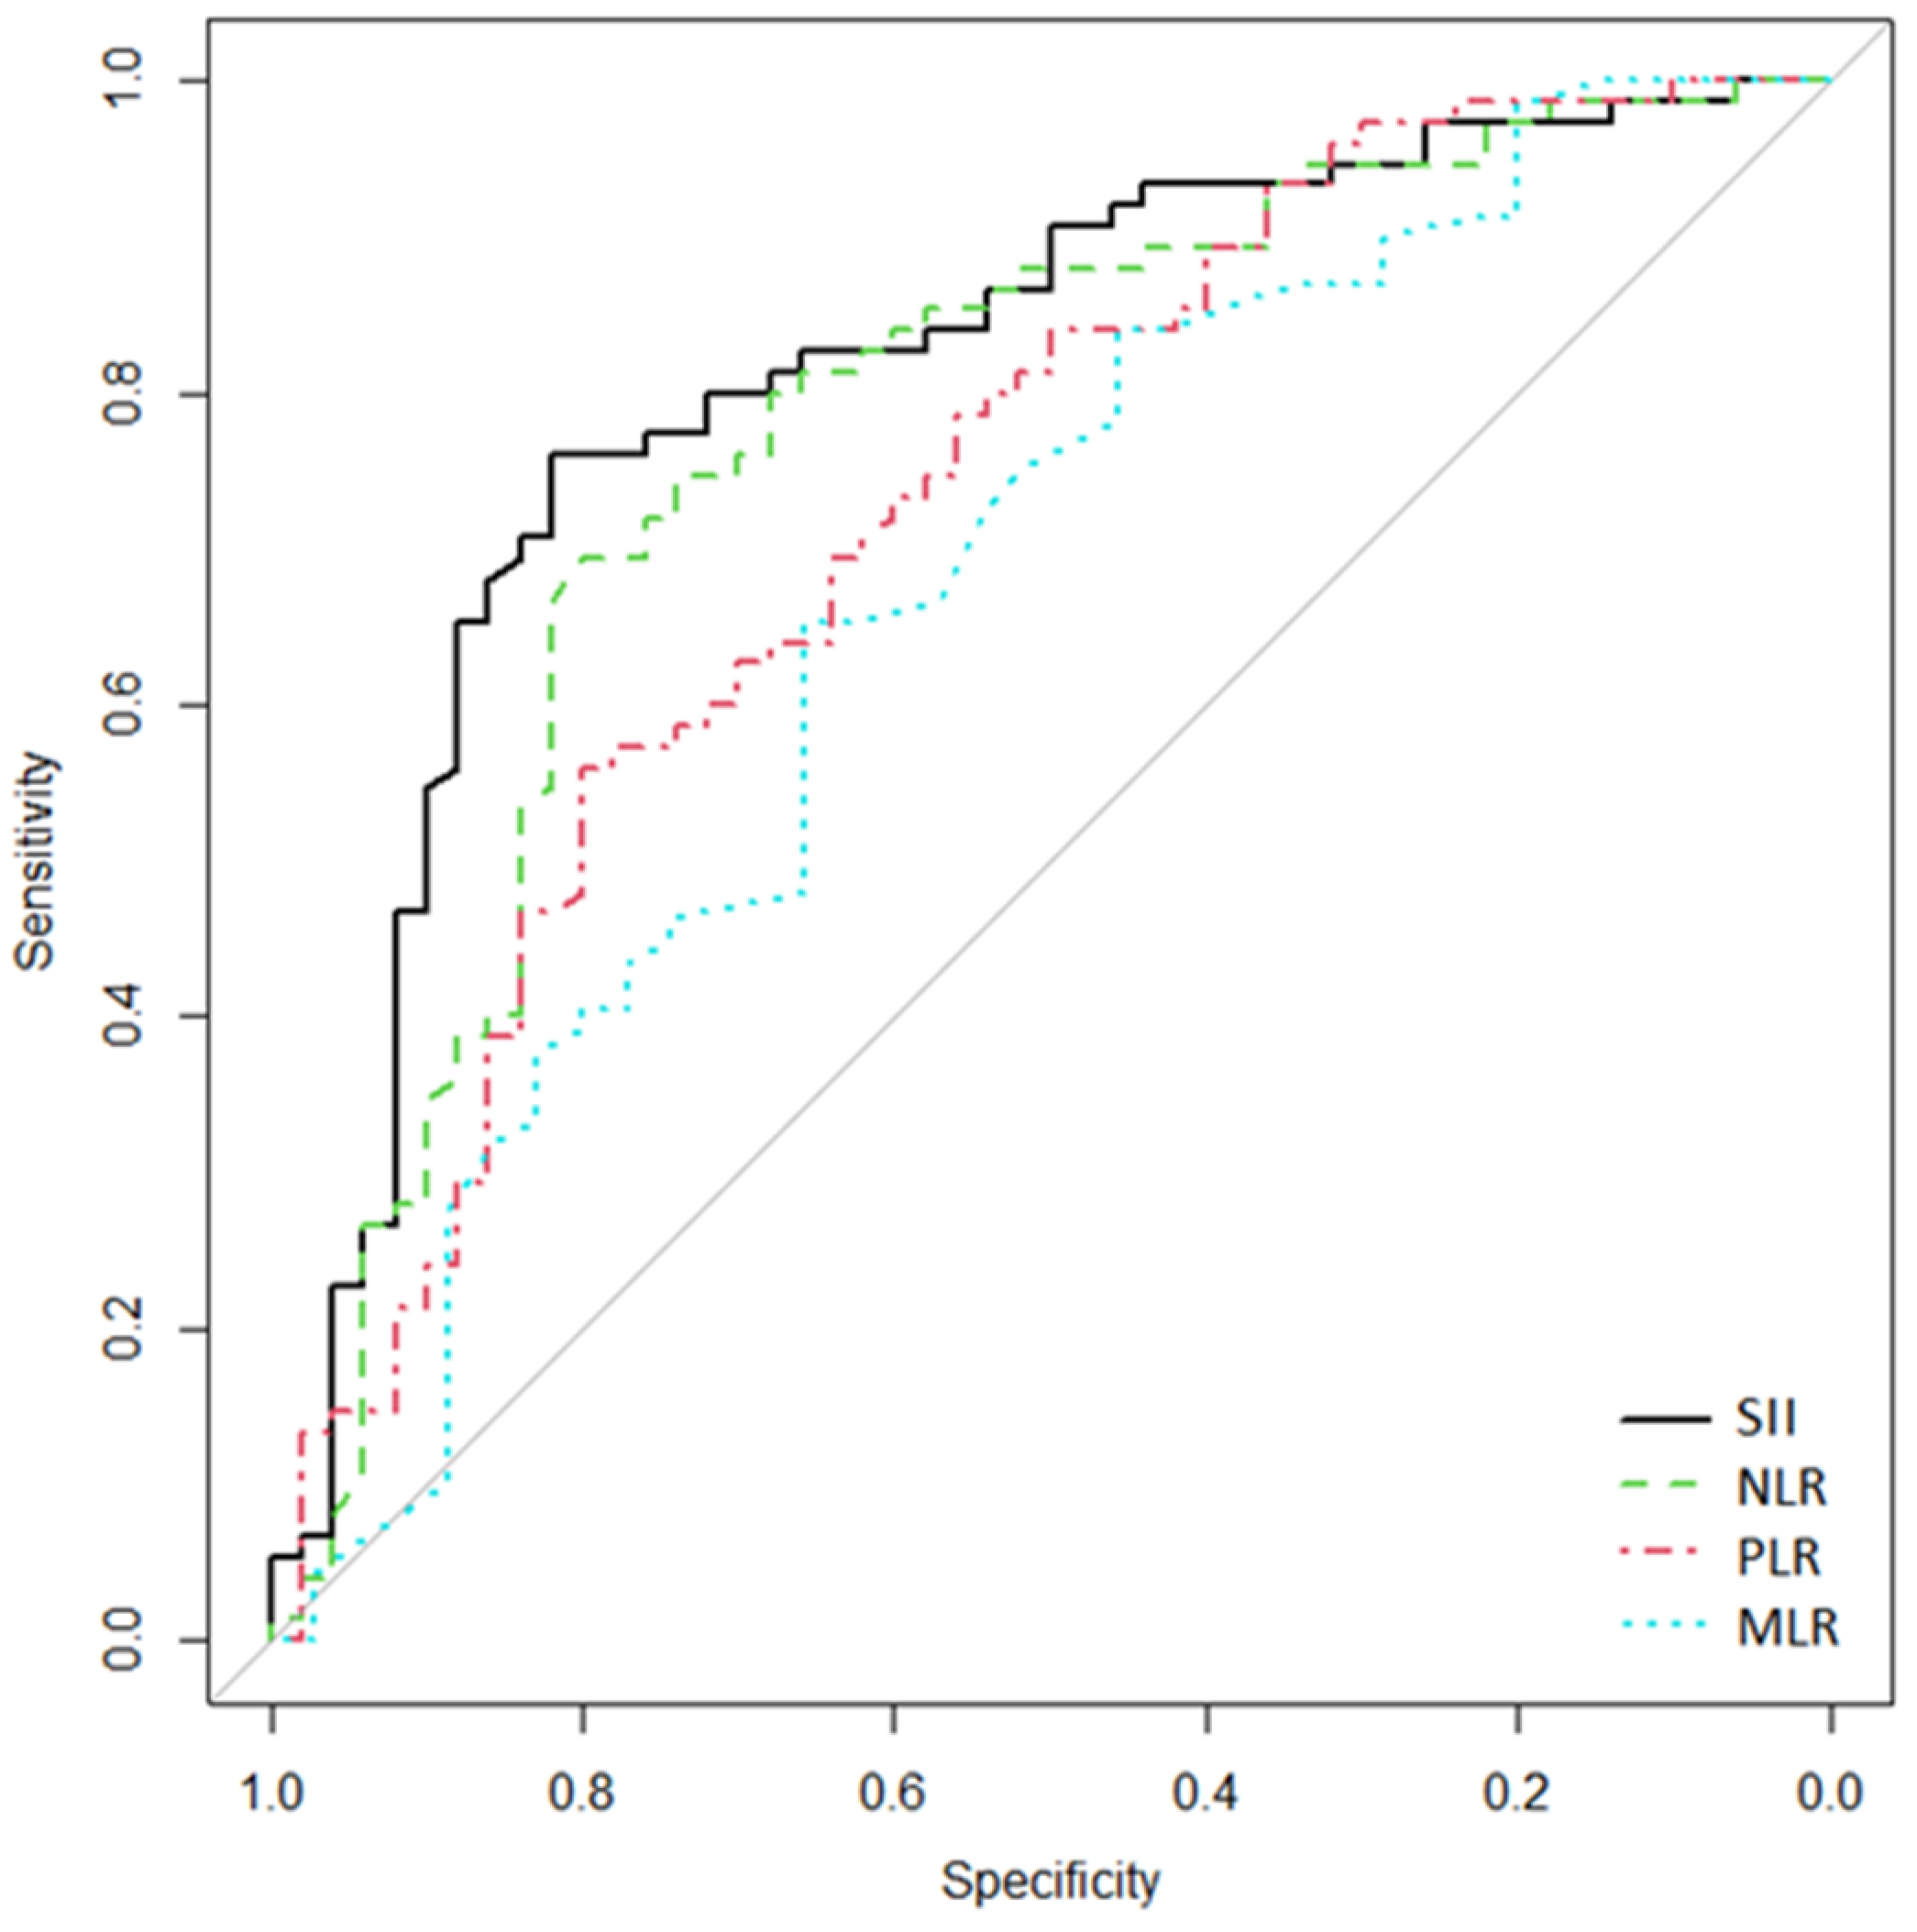
| Characteristic | AUROC (95% CI) | Cutoff | Se | Sp |
|---|---|---|---|---|
| MLR | 0.665 (0.542–0.777) | 0.38 | 65.7 | 65.2 |
| NLR | 0.773 (0.676–0.857) | 4.06 | 80 | 69.3 |
| PLR | 0.725 (0.63–0.813) | 144.38 | 80 | 56 |
| SII | 0.812 (0.73–0.888) | 1200 | 82 | 76 |
| SII vs. NLR | p = 0.111 | |||
| SII vs. MLR | p = 0.027 | |||
| SII vs. PLR | p = 0.019 | |||
| NLR vs. PLR | p = 0.323 | |||
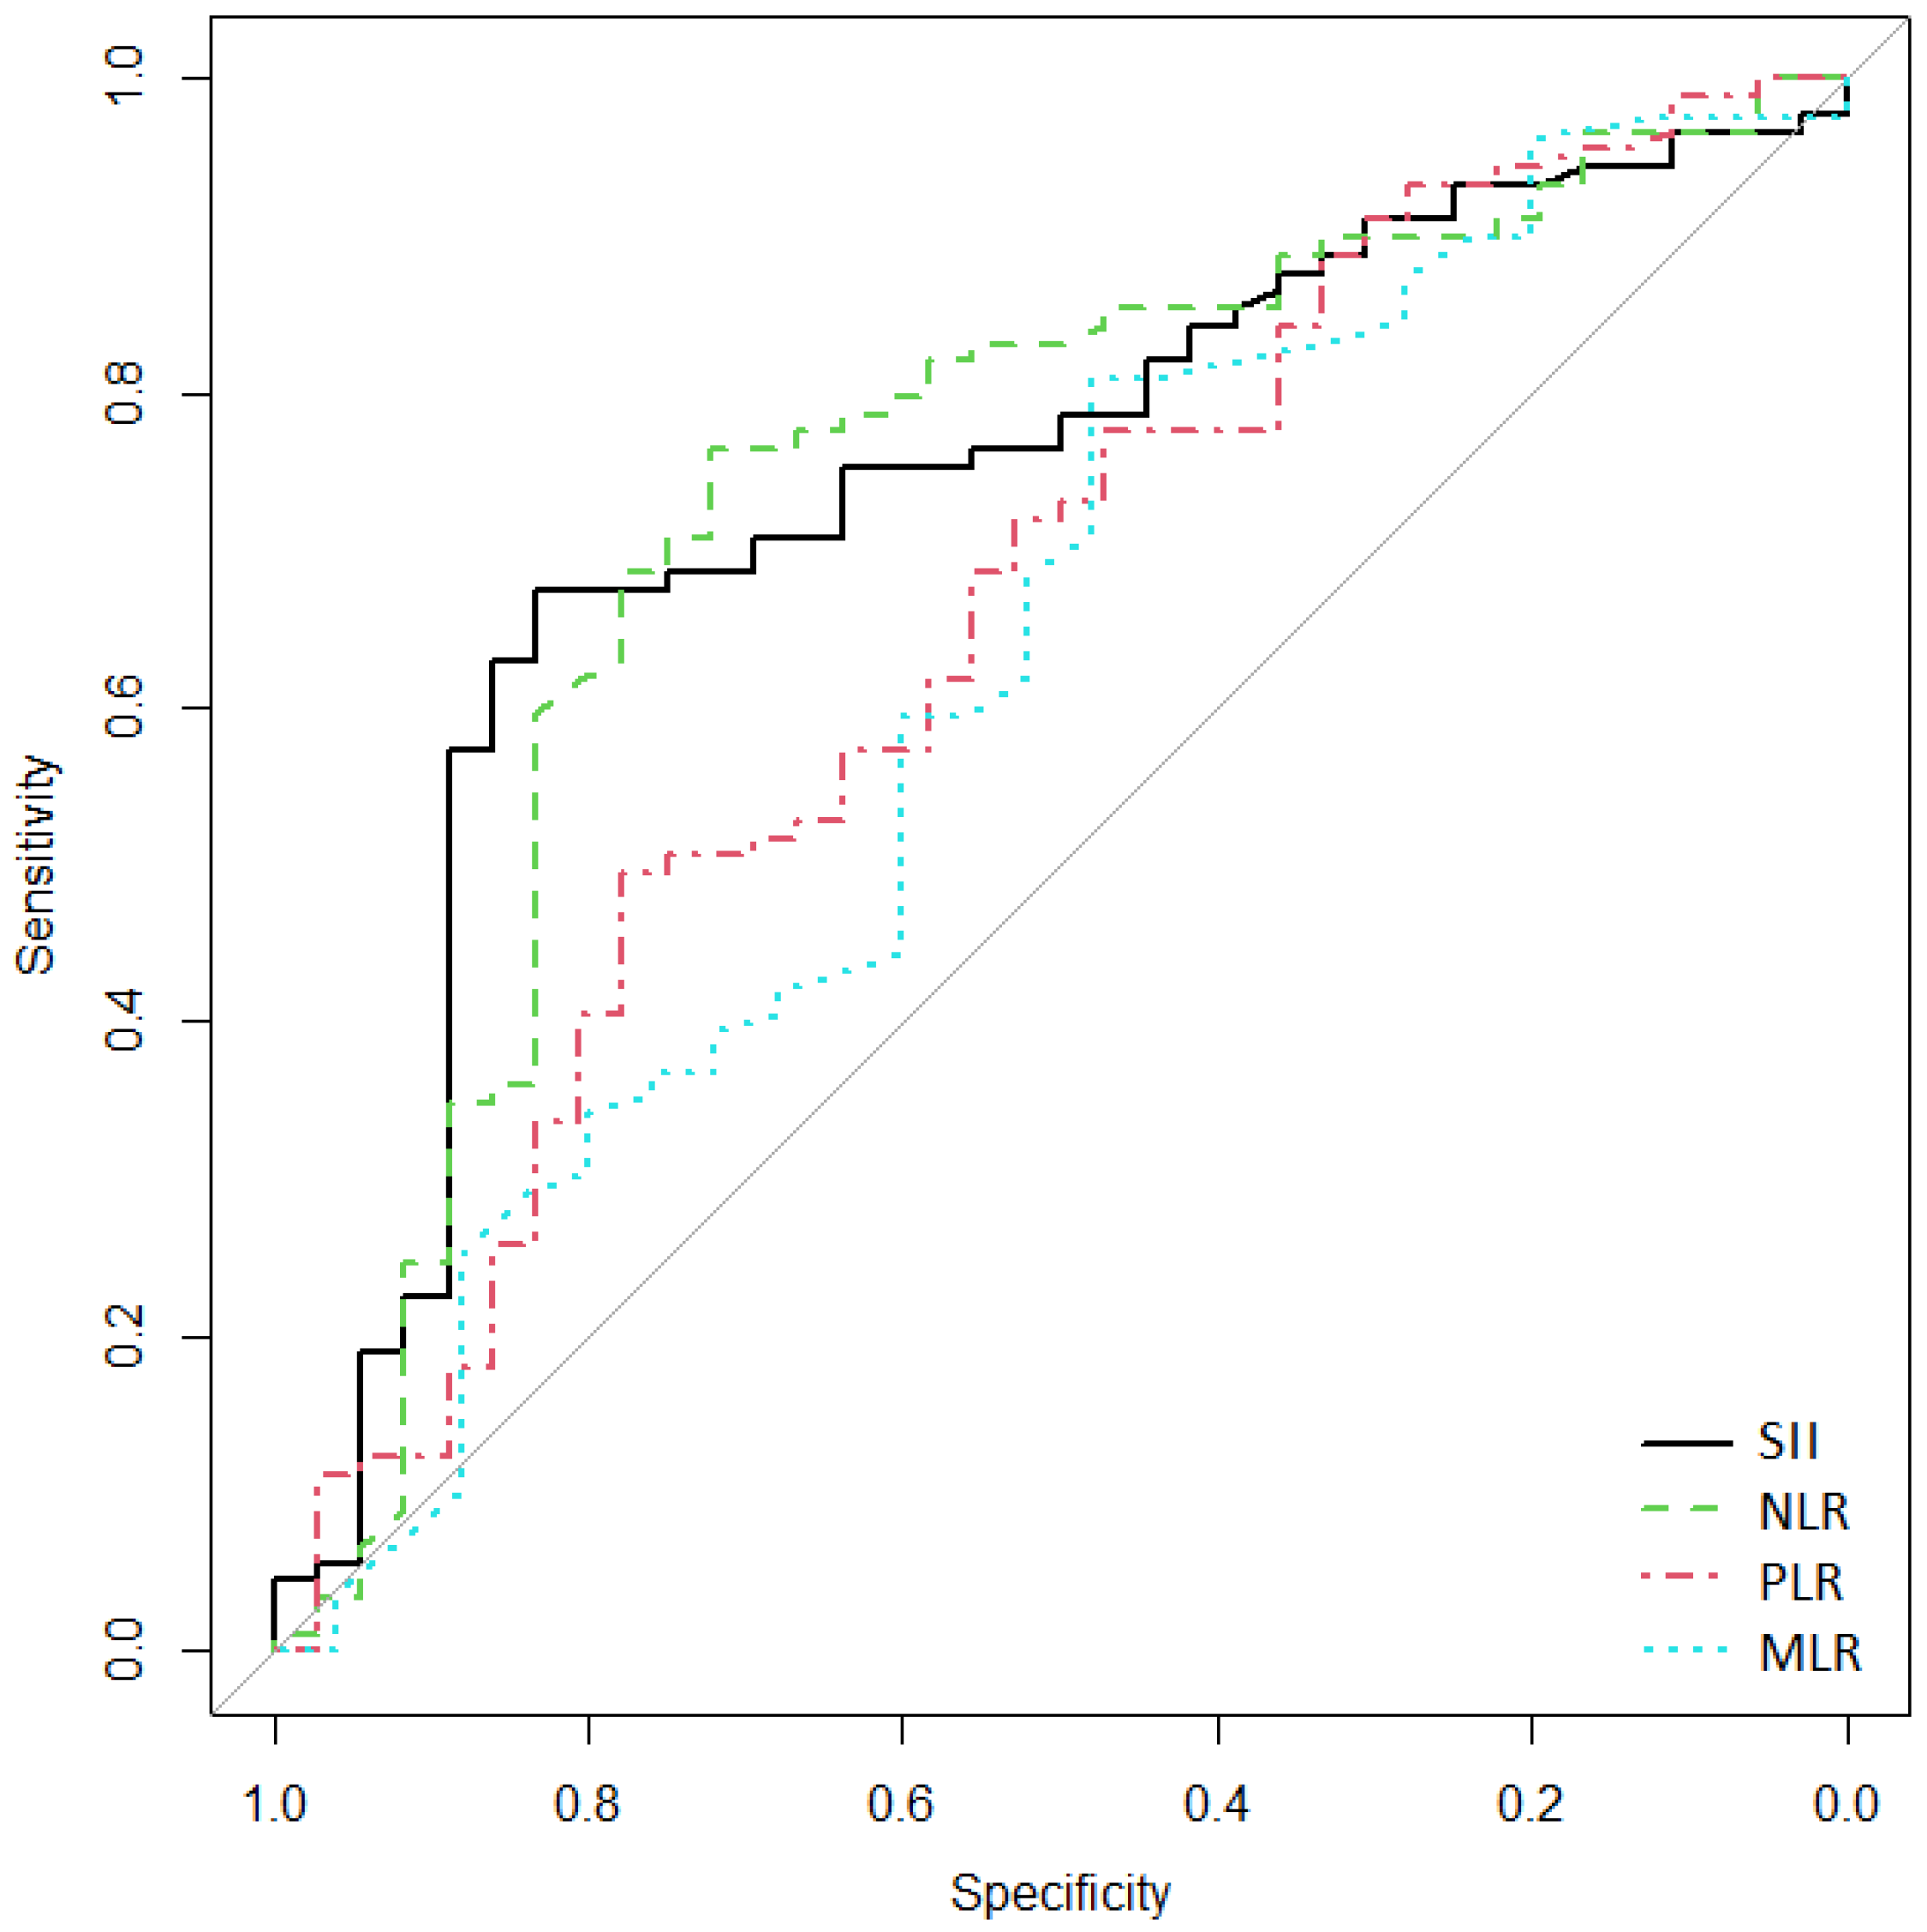
| Characteristic | AUROC (95% CI) | Cutoff | Se | Sp |
|---|---|---|---|---|
| MLR | 0.614 (0.474–0.738) | 0.51 | 48 | 81 |
| NLR | 0.737 (0.629–0.834) | 5.61 | 72.2 | 76.4 |
| PLR | 0.65 (0.53–0.754) | 144.38 | 77.8 | 49.4 |
| SII | 0.738 (0.632–0.831) | 1200 | 83.3 | 67.4 |
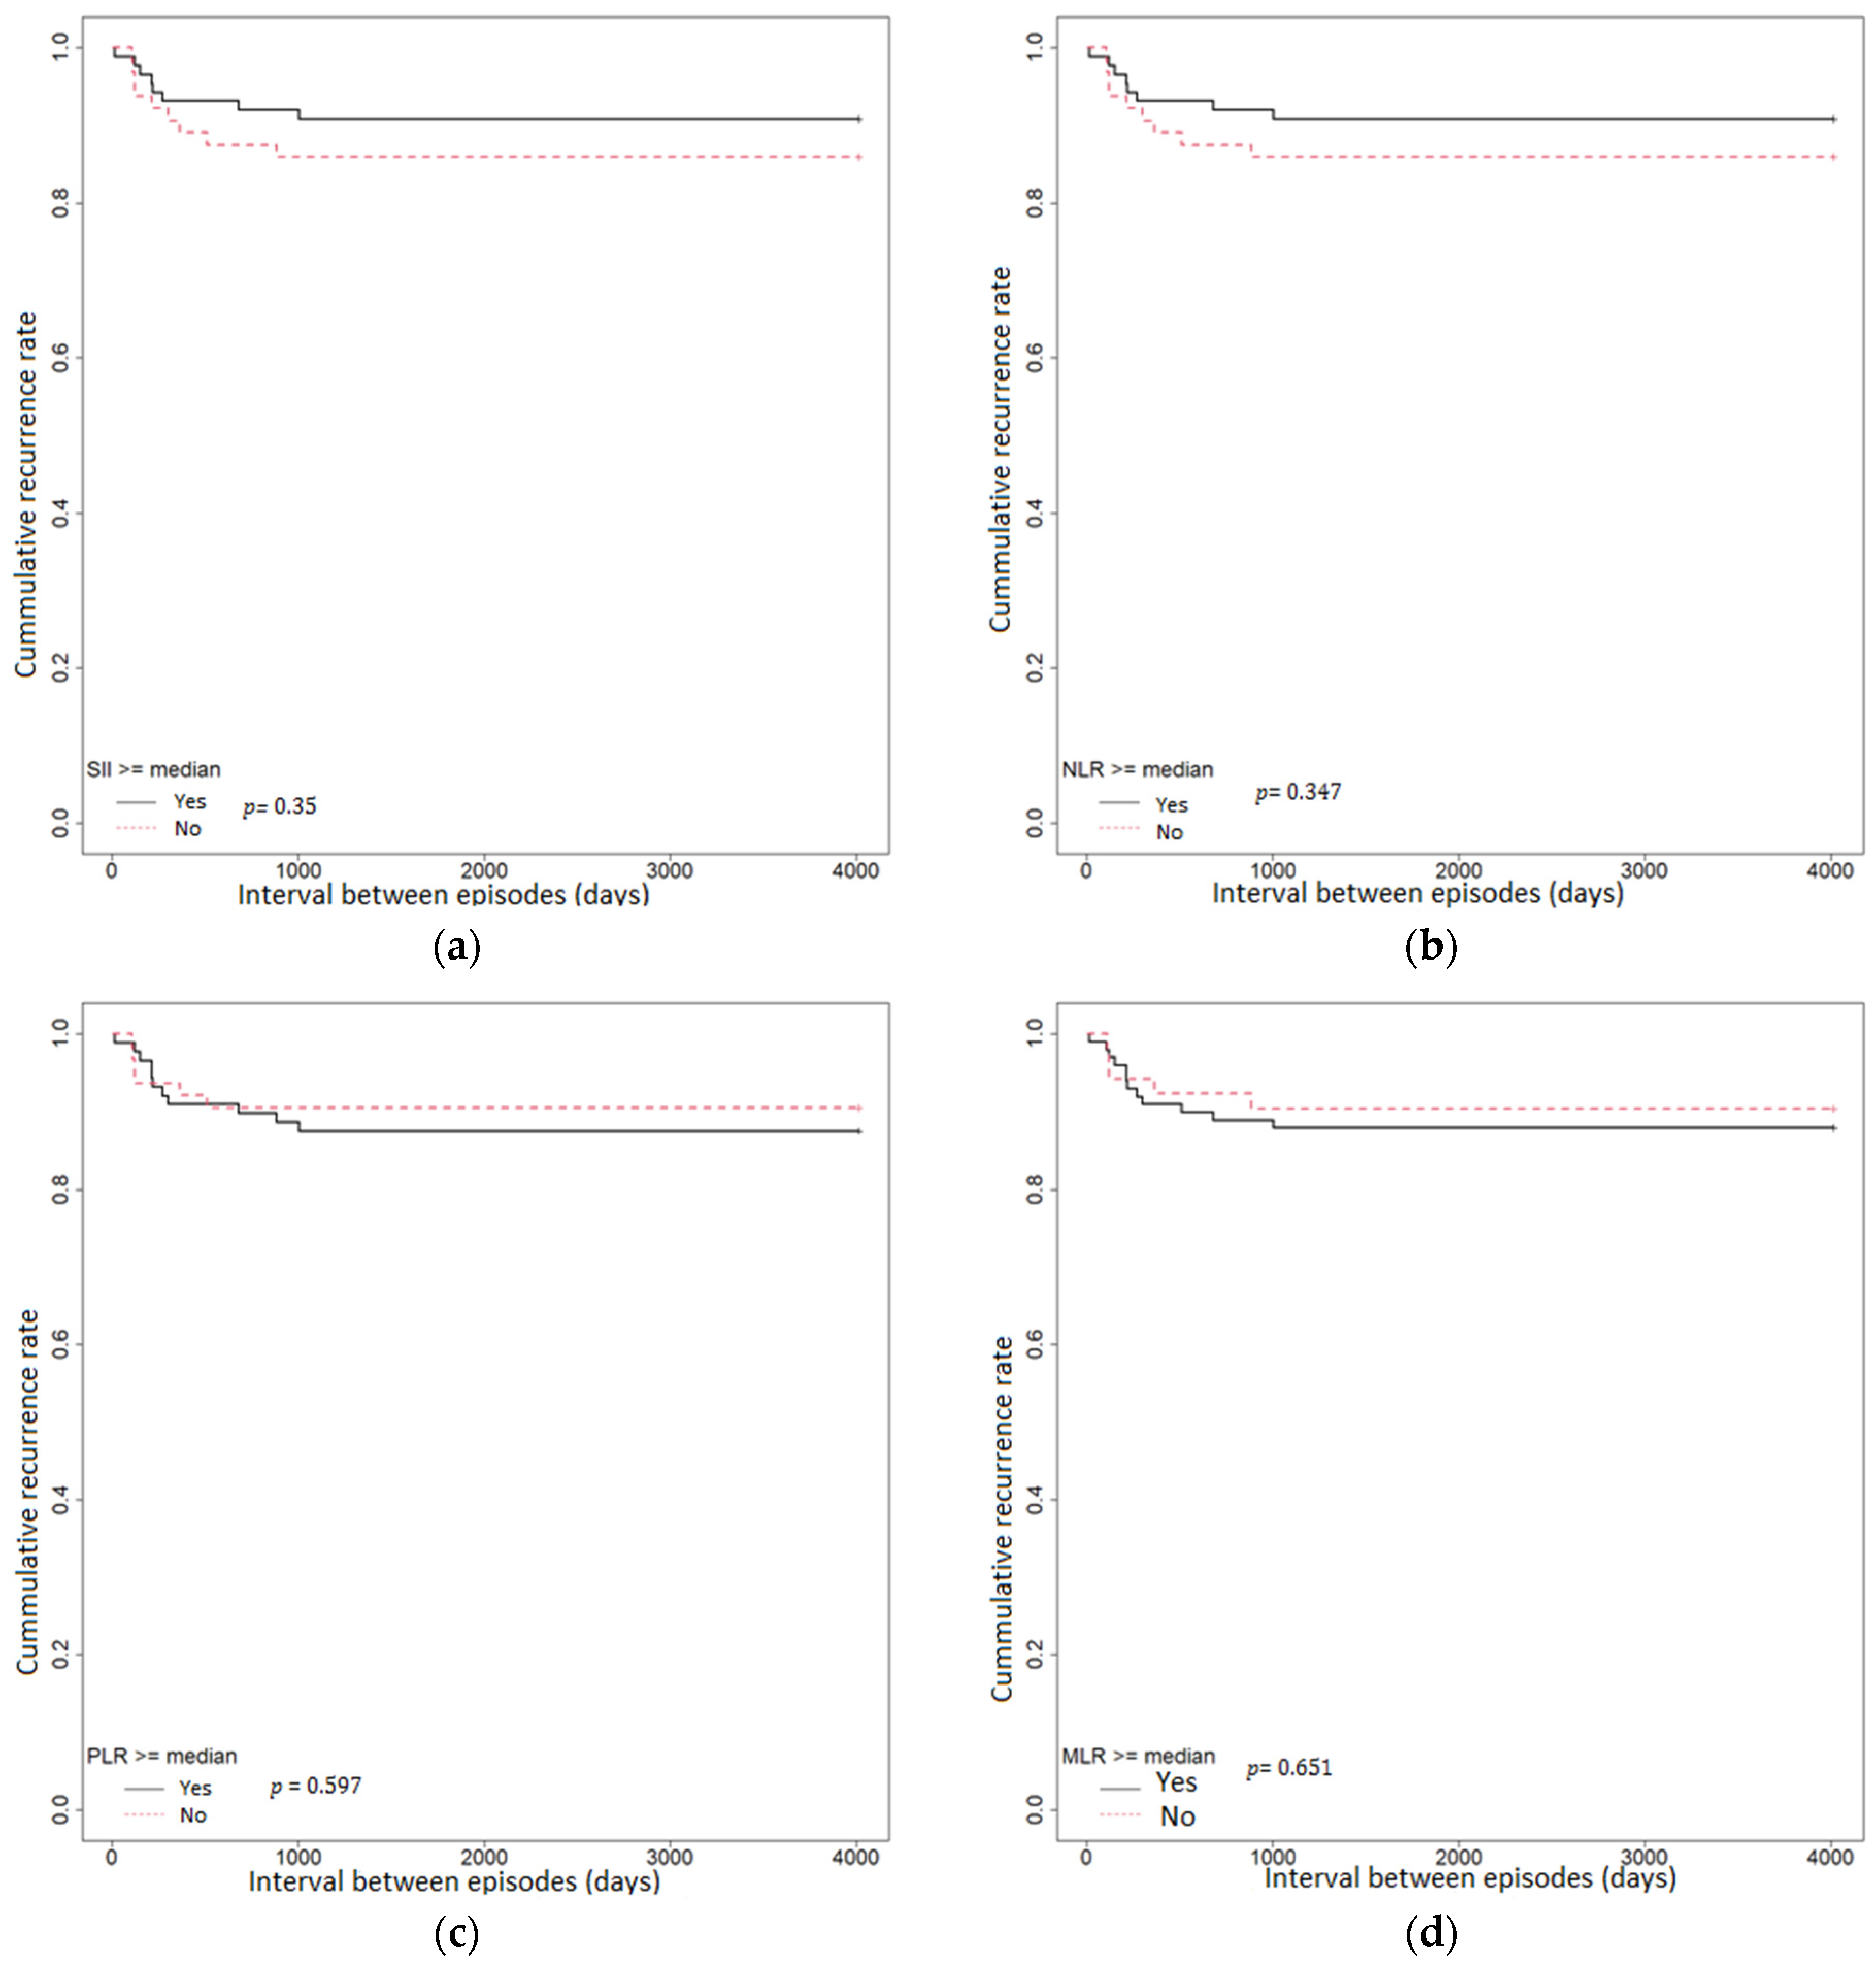
| Characteristic | HR | p-Value |
|---|---|---|
| MLR ≥ median | 1.27 (95% CI 0.45–3.6) | 0.651 |
| NLR ≥ median | 1.57 (95% CI 0.61–4.08) | 0.347 |
| PLR ≥ median | 1.31 (95% CI 0.48–3.53) | 0.597 |
| SII ≥ median | 1.57 (95% CI 0.61–4.08) | 0.347 |
Disclaimer/Publisher’s Note: The statements, opinions and data contained in all publications are solely those of the individual author(s) and contributor(s) and not of MDPI and/or the editor(s). MDPI and/or the editor(s) disclaim responsibility for any injury to people or property resulting from any ideas, methods, instructions or products referred to in the content. |
© 2023 by the authors. Licensee MDPI, Basel, Switzerland. This article is an open access article distributed under the terms and conditions of the Creative Commons Attribution (CC BY) license (https://creativecommons.org/licenses/by/4.0/).
Share and Cite
Sabo, C.M.; Leucuta, D.-C.; Simiraș, C.; Deac, I.Ș.; Ismaiel, A.; Dumitrascu, D.L. Hemogram-Derived Ratios in the Prognosis of Acute Diverticulitis. Medicina 2023, 59, 1523. https://doi.org/10.3390/medicina59091523
Sabo CM, Leucuta D-C, Simiraș C, Deac IȘ, Ismaiel A, Dumitrascu DL. Hemogram-Derived Ratios in the Prognosis of Acute Diverticulitis. Medicina. 2023; 59(9):1523. https://doi.org/10.3390/medicina59091523
Chicago/Turabian StyleSabo, Cristina Maria, Daniel-Corneliu Leucuta, Constantin Simiraș, Ioana Ștefania Deac, Abdulrahman Ismaiel, and Dan L. Dumitrascu. 2023. "Hemogram-Derived Ratios in the Prognosis of Acute Diverticulitis" Medicina 59, no. 9: 1523. https://doi.org/10.3390/medicina59091523
APA StyleSabo, C. M., Leucuta, D.-C., Simiraș, C., Deac, I. Ș., Ismaiel, A., & Dumitrascu, D. L. (2023). Hemogram-Derived Ratios in the Prognosis of Acute Diverticulitis. Medicina, 59(9), 1523. https://doi.org/10.3390/medicina59091523