
Association of Heart Rate Variability with Obstructive Sleep Apnea in Adults


Abstract
1. Introduction
2. Materials and Methods
2.1. Ethical Considerations
2.2. Materials
2.2.1. Data Collection from PSG
2.2.2. HRV Measurement
2.3. Method
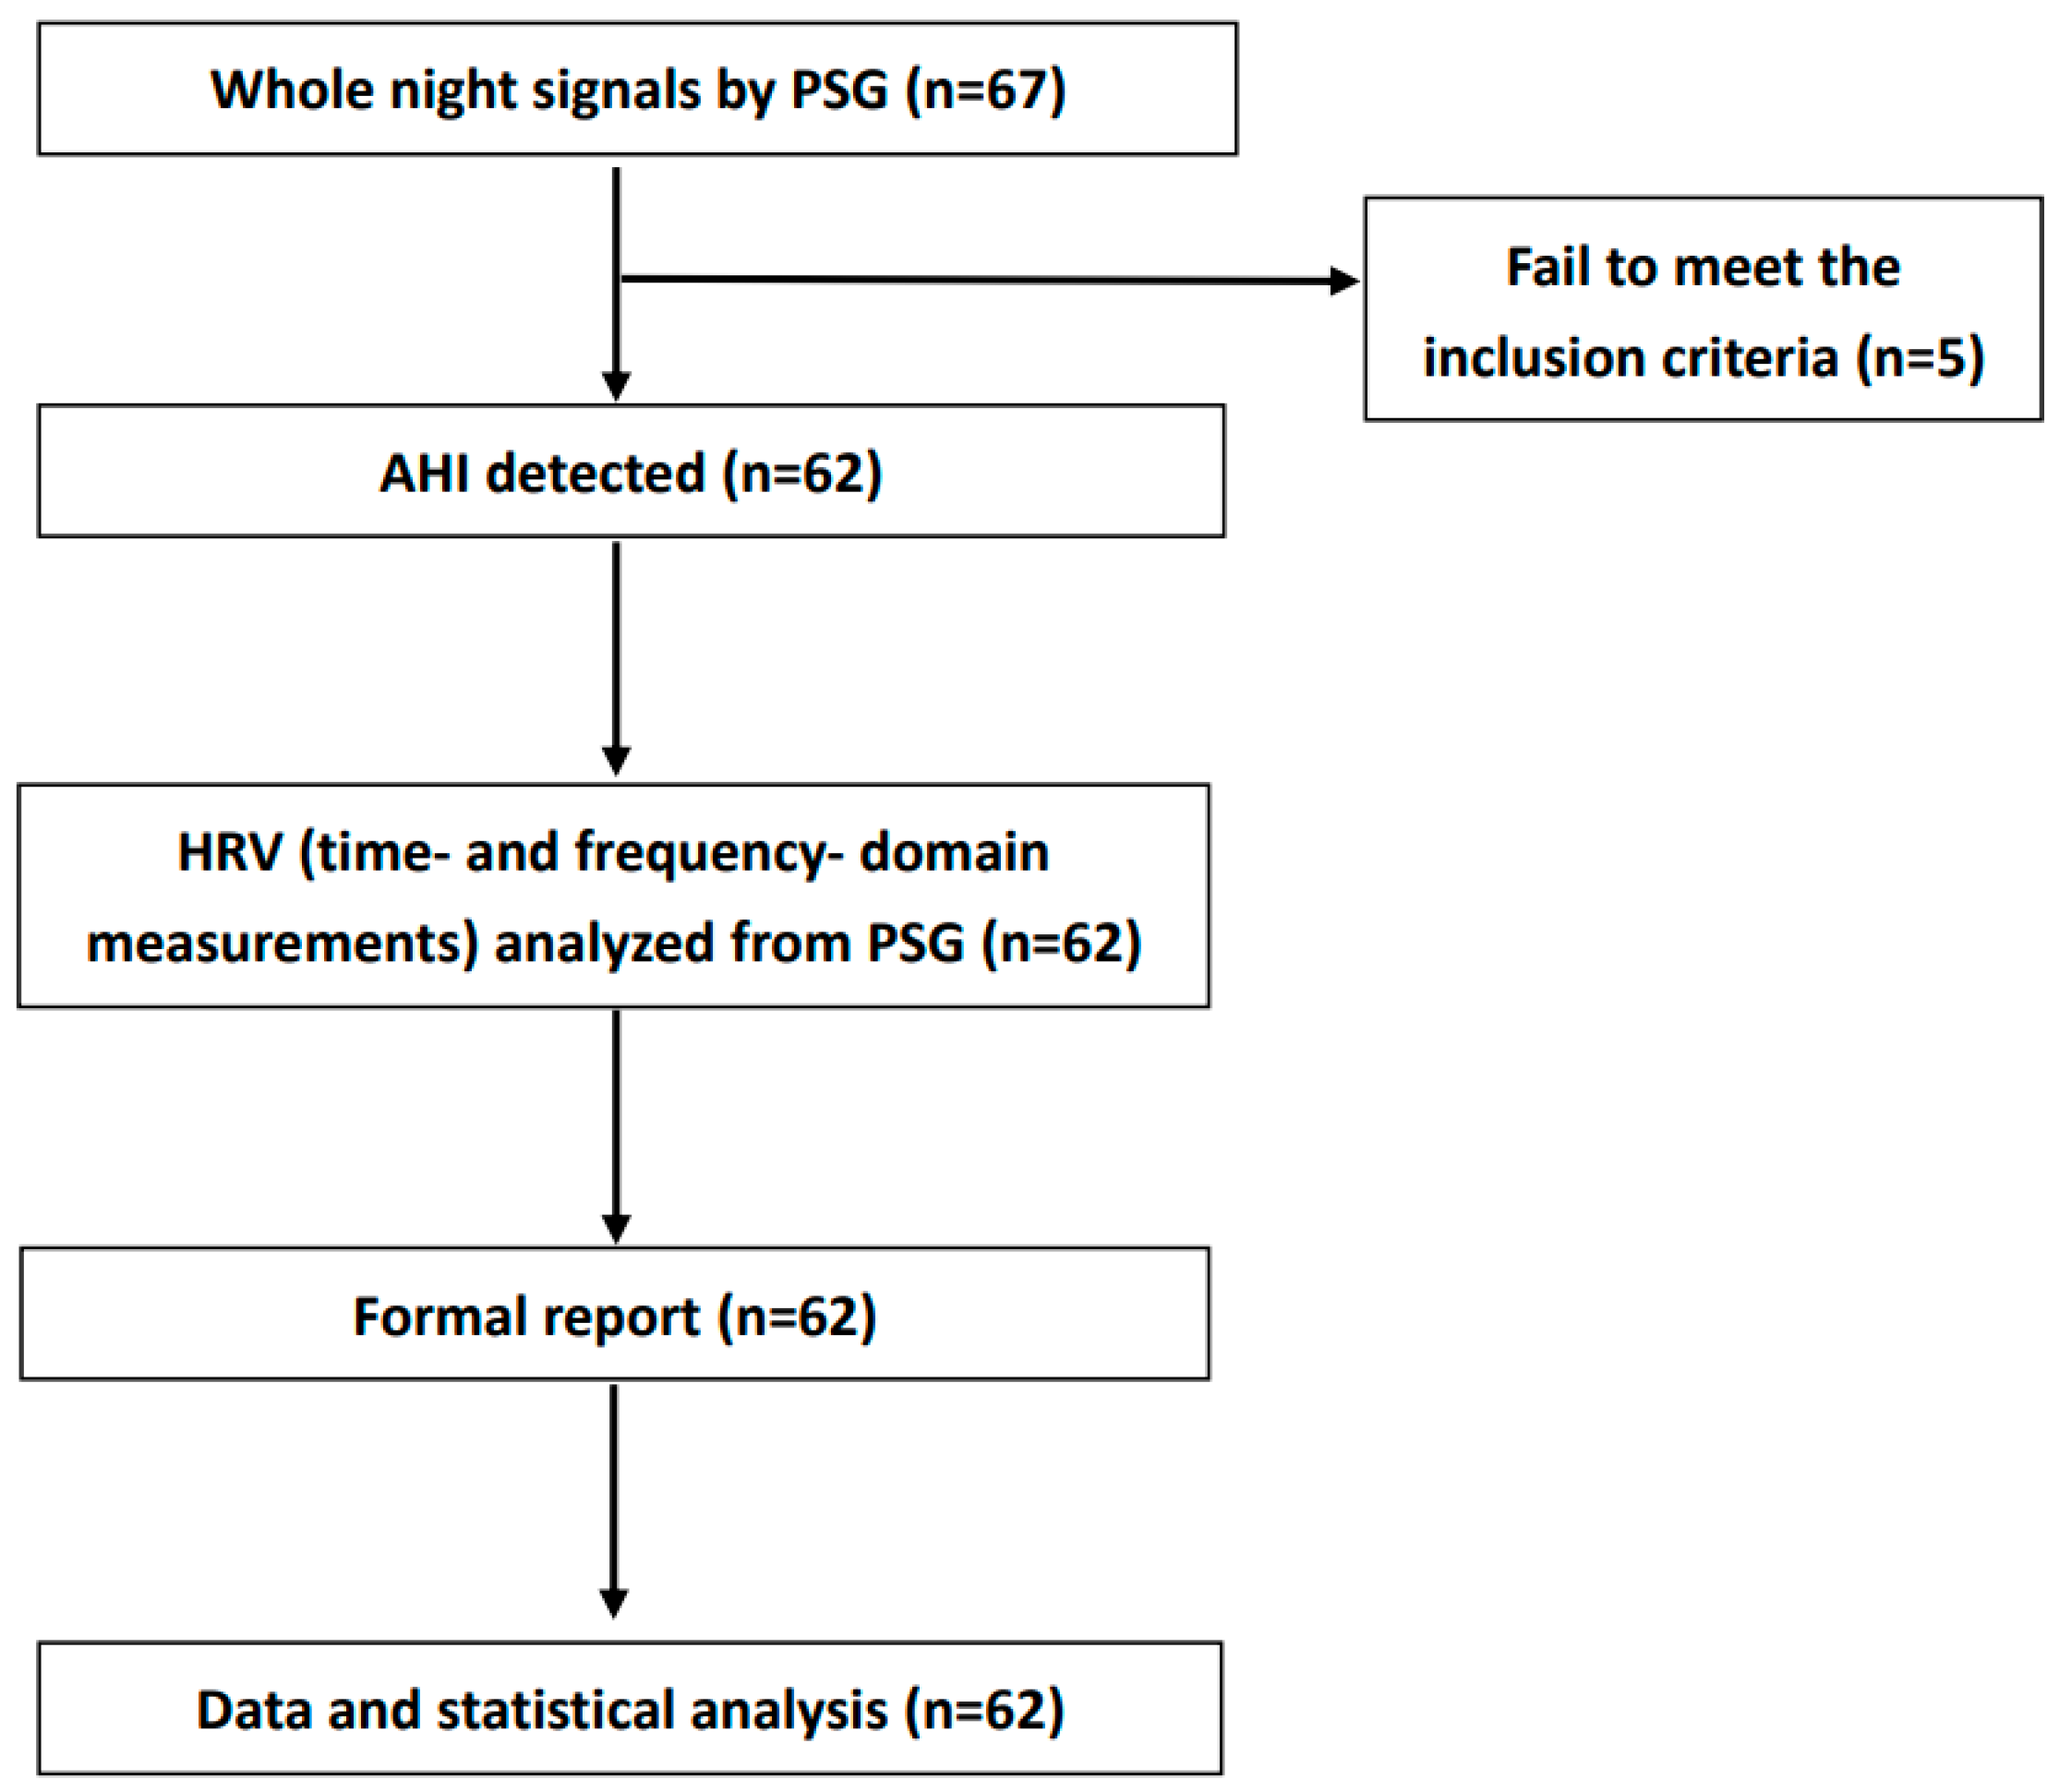
2.3.1. Data Design and Setting
2.3.2. Study Outcome
2.4. Statistical Analysis
3. Results
4. Discussion
5. Conclusions
6. Patents
Author Contributions
Funding
Institutional Review Board Statement
Informed Consent Statement
Data Availability Statement
Conflicts of Interest
References
- Watson, N.F.; Badr, M.S.; Belenky, G.; Bliwise, D.L.; Buxton, O.M.; Buysse, D.; Dinges, D.F.; Gangwisch, J.; Grandner, M.A.; Kushida, C.; et al. Recommended Amount of Sleep for a Healthy Adult: A Joint Consensus Statement of the American Academy of Sleep Medicine and Sleep Research Society. Sleep 2015, 38, 843–844. [Google Scholar] [CrossRef]
- Lavie, P.; Ben-Yosef, R.; Rubin, A.E. Prevalence of sleep apnea syndrome among patients with essential hypertension. Am. Heart J. 1984, 108, 373–376. [Google Scholar] [CrossRef]
- Mesquita, J.; Sola-Soler, J.; Fiz, J.A.; Morera, J.; Jane, R. All night analysis of time interval between snores in subjects with sleep apnea hypopnea syndrome. Med. Biol. Eng. Comput. 2012, 50, 373–381. [Google Scholar] [CrossRef]
- Epstein, L.J.; Kristo, D.; Strollo, P.J., Jr.; Friedman, N.; Malhotra, A.; Patil, S.P.; Ramar, K.; Rogers, R.; Schwab, R.J.; Weaver, E.M.; et al. Clinical guideline for the evaluation, management and long-term care of obstructive sleep apnea in adults. J. Clin. Sleep Med. 2009, 5, 263–276. [Google Scholar]
- Park, J.G.; Ramar, K.; Olson, E.J. Updates on definition, consequences, and management of obstructive sleep apnea. Mayo Clin. Proc. 2011, 86, 549–554, quiz 554-545. [Google Scholar] [CrossRef]
- Wang, X.; Bi, Y.; Zhang, Q.; Pan, F. Obstructive sleep apnoea and the risk of type 2 diabetes: A meta-analysis of prospective cohort studies. Respirology 2013, 18, 140–146. [Google Scholar] [CrossRef]
- Li, M.; Hou, W.S.; Zhang, X.W.; Tang, Z.Y. Obstructive sleep apnea and risk of stroke: A meta-analysis of prospective studies. Int. J. Cardiol. 2014, 172, 466–469. [Google Scholar] [CrossRef]
- Wang, X.; Ouyang, Y.; Wang, Z.; Zhao, G.; Liu, L.; Bi, Y. Obstructive sleep apnea and risk of cardiovascular disease and all-cause mortality: A meta-analysis of prospective cohort studies. Int. J. Cardiol. 2013, 169, 207–214. [Google Scholar] [CrossRef]
- Thayer, J.F.; Yamamoto, S.S.; Brosschot, J.F. The relationship of autonomic imbalance, heart rate variability and cardiovascular disease risk factors. Int. J. Cardiol. 2010, 141, 122–131. [Google Scholar] [CrossRef]
- Dekker, J.M.; Crow, R.S.; Folsom, A.R.; Hannan, P.J.; Liao, D.; Swenne, C.A.; Schouten, E.G. Low heart rate variability in a 2-minute rhythm strip predicts risk of coronary heart disease and mortality from several causes: The ARIC Study. Atherosclerosis Risk In Communities. Circulation 2000, 102, 1239–1244. [Google Scholar] [CrossRef] [PubMed]
- Stein, P.K.; Barzilay, J.I.; Chaves, P.H.; Mistretta, S.Q.; Domitrovich, P.P.; Gottdiener, J.S.; Rich, M.W.; Kleiger, R.E. Novel measures of heart rate variability predict cardiovascular mortality in older adults independent of traditional cardiovascular risk factors: The Cardiovascular Health Study (CHS). J. Cardiovasc. Electrophysiol. 2008, 19, 1169–1174. [Google Scholar] [CrossRef] [PubMed]
- Wulsin, L.R.; Horn, P.S.; Perry, J.L.; Massaro, J.M.; D’Agostino, R.B. Autonomic Imbalance as a Predictor of Metabolic Risks, Cardiovascular Disease, Diabetes, and Mortality. J. Clin. Endocrinol. Metab. 2015, 100, 2443–2448. [Google Scholar] [CrossRef] [PubMed]
- Report and recommendations of the San Antonio conference on diabetic neuropathy. Consensus statement. Diabetes 1988, 37, 1000–1004. [CrossRef] [PubMed]
- Fang, S.C.; Wu, Y.L.; Tsai, P.S. Heart Rate Variability and Risk of All-Cause Death and Cardiovascular Events in Patients With Cardiovascular Disease: A Meta-Analysis of Cohort Studies. Biol. Res. Nurs. 2020, 22, 45–56. [Google Scholar] [CrossRef]
- Hillebrand, S.; Gast, K.B.; de Mutsert, R.; Swenne, C.A.; Jukema, J.W.; Middeldorp, S.; Rosendaal, F.R.; Dekkers, O.M. Heart rate variability and first cardiovascular event in populations without known cardiovascular disease: Meta-analysis and dose-response meta-regression. Europace 2013, 15, 742–749. [Google Scholar] [CrossRef]
- Shah, A.S.; El Ghormli, L.; Vajravelu, M.E.; Bacha, F.; Farrell, R.M.; Gidding, S.S.; Levitt Katz, L.E.; Tryggestad, J.B.; White, N.H.; Urbina, E.M. Heart Rate Variability and Cardiac Autonomic Dysfunction: Prevalence, Risk Factors, and Relationship to Arterial Stiffness in the Treatment Options for Type 2 Diabetes in Adolescents and Youth (TODAY) Study. Diabetes Care 2019, 42, 2143–2150. [Google Scholar] [CrossRef]
- Gula, L.J.; Krahn, A.D.; Skanes, A.; Ferguson, K.A.; George, C.; Yee, R.; Klein, G.J. Heart rate variability in obstructive sleep apnea: A prospective study and frequency domain analysis. Ann. Noninvasive Electrocardiol. 2003, 8, 144–149. [Google Scholar] [CrossRef]
- Ucak, S.; Dissanayake, H.U.; Sutherland, K.; de Chazal, P.; Cistulli, P.A. Heart rate variability and obstructive sleep apnea: Current perspectives and novel technologies. J. Sleep Res. 2021, 30, e13274. [Google Scholar] [CrossRef]
- Narkiewicz, K.; Somers, V.K. The sympathetic nervous system and obstructive sleep apnea: Implications for hypertension. J. Hypertens. 1997, 15, 1613–1619. [Google Scholar] [CrossRef]
- Somers, V.K.; Dyken, M.E.; Mark, A.L.; Abboud, F.M. Sympathetic-nerve activity during sleep in normal subjects. N. Engl. J. Med. 1993, 328, 303–307. [Google Scholar] [CrossRef]
- Somers, V.K.; Dyken, M.E.; Clary, M.P.; Abboud, F.M. Sympathetic neural mechanisms in obstructive sleep apnea. J. Clin. Investig. 1995, 96, 1897–1904. [Google Scholar] [CrossRef] [PubMed]
- Roux, F.; D’Ambrosio, C.; Mohsenin, V. Sleep-related breathing disorders and cardiovascular disease. Am. J. Med. 2000, 108, 396–402. [Google Scholar] [CrossRef] [PubMed]
- Sequeira, V.C.C.; Bandeira, P.M.; Azevedo, J.C.M. Heart rate variability in adults with obstructive sleep apnea: A systematic review. Sleep Sci. 2019, 12, 214–221. [Google Scholar] [CrossRef] [PubMed]
- Glos, M.; Sabil, A.; Jelavic, K.S.; Schobel, C.; Fietze, I.; Penzel, T. Characterization of Respiratory Events in Obstructive Sleep Apnea Using Suprasternal Pressure Monitoring. J. Clin. Sleep Med. 2018, 14, 359–369. [Google Scholar] [CrossRef]
- Buchheit, M. Monitoring training status with HR measures: Do all roads lead to Rome? Front. Physiol. 2014, 5, 73. [Google Scholar] [CrossRef]
- Fu, C.H.; Yang, C.C.; Lin, C.L.; Kuo, T.B. Effects of long-term vegetarian diets on cardiovascular autonomic functions in healthy postmenopausal women. Am. J. Cardiol. 2006, 97, 380–383. [Google Scholar] [CrossRef]
- Kamandulis, S.; Juodsnukis, A.; Stanislovaitiene, J.; Zuoziene, I.J.; Bogdelis, A.; Mickevicius, M.; Eimantas, N.; Snieckus, A.; Olstad, B.H.; Venckunas, T. Daily Resting Heart Rate Variability in Adolescent Swimmers during 11 Weeks of Training. Int. J. Environ. Res. Public Health 2020, 17, 2097. [Google Scholar] [CrossRef]
- Chiang, J.K.; Fu, C.H.; Kuo, T.B.; Koo, M. Association between frequency domain heart rate variability and unplanned readmission to hospital in geriatric patients. BMC Public Health 2011, 11, 137. [Google Scholar] [CrossRef]
- McCraty, R.; Shaffer, F. Heart Rate Variability: New Perspectives on Physiological Mechanisms, Assessment of Self-regulatory Capacity, and Health risk. Glob. Adv. Health Med. 2015, 4, 46–61. [Google Scholar] [CrossRef]
- Nakamura, F.Y.; Flatt, A.A.; Pereira, L.A.; Ramirez-Campillo, R.; Loturco, I.; Esco, M.R. Ultra-Short-Term Heart Rate Variability is Sensitive to Training Effects in Team Sports Players. J. Sports Sci. Med. 2015, 14, 602–605. [Google Scholar]
- Shaffer, F.; Ginsberg, J.P. An Overview of Heart Rate Variability Metrics and Norms. Front. Public Health 2017, 5, 258. [Google Scholar] [CrossRef] [PubMed]
- Bigger, J.T., Jr.; Albrecht, P.; Steinman, R.C.; Rolnitzky, L.M.; Fleiss, J.L.; Cohen, R.J. Comparison of time- and frequency domain-based measures of cardiac parasympathetic activity in Holter recordings after myocardial infarction. Am. J. Cardiol. 1989, 64, 536–538. [Google Scholar] [CrossRef] [PubMed]
- Kim, Y.S.; Kim, S.Y.; Park, D.Y.; Wu, H.W.; Hwang, G.S.; Kim, H.J. Clinical Implication of Heart Rate Variability in Obstructive Sleep Apnea Syndrome Patients. J. Craniofac. Surg. 2015, 26, 1592–1595. [Google Scholar] [CrossRef] [PubMed]
- Xie, J.; Yu, W.; Wan, Z.; Han, F.; Wang, Q.; Chen, R. Correlation Analysis between Obstructive Sleep Apnea Syndrome (OSAS) and Heart Rate Variability. Iran. J. Public Health 2017, 46, 1502–1511. [Google Scholar]
- Zhu, K.; Chemla, D.; Roisman, G.; Mao, W.; Bazizi, S.; Lefevre, A.; Escourrou, P. Overnight heart rate variability in patients with obstructive sleep apnoea: A time and frequency domain study. Clin. Exp. Pharmacol. Physiol. 2012, 39, 901–908. [Google Scholar] [CrossRef]
- Aytemir, K.; Deniz, A.; Yavuz, B.; Ugur Demir, A.; Sahiner, L.; Ciftci, O.; Tokgozoglu, L.; Can, I.; Sahin, A.; Oto, A. Increased myocardial vulnerability and autonomic nervous system imbalance in obstructive sleep apnea syndrome. Respir. Med. 2007, 101, 1277–1282. [Google Scholar] [CrossRef]
- Kleiger, R.E.; Miller, J.P.; Bigger, J.T., Jr.; Moss, A.J. Decreased heart rate variability and its association with increased mortality after acute myocardial infarction. Am. J. Cardiol. 1987, 59, 256–262. [Google Scholar] [CrossRef]
- Brostrom, A.; Sunnergren, O.; Arestedt, K.; Johansson, P.; Ulander, M.; Riegel, B.; Svanborg, E. Factors associated with undiagnosed obstructive sleep apnoea in hypertensive primary care patients. Scand. J. Prim. Health Care 2012, 30, 107–113. [Google Scholar] [CrossRef]
- Cairns, A.; Poulos, G.; Bogan, R. Sex differences in sleep apnea predictors and outcomes from home sleep apnea testing. Nat. Sci. Sleep 2016, 8, 197–205. [Google Scholar] [CrossRef]
- Kawada, T.; Otsuka, T.; Nakamura, T.; Kon, Y. Relationship between sleep-disordered breathing and metabolic syndrome after adjustment with cardiovascular risk factors. Diabetes Metab. Syndr. 2016, 10, 92–95. [Google Scholar] [CrossRef]
- Young, T.; Shahar, E.; Nieto, F.J.; Redline, S.; Newman, A.B.; Gottlieb, D.J.; Walsleben, J.A.; Finn, L.; Enright, P.; Samet, J.M.; et al. Predictors of sleep-disordered breathing in community-dwelling adults: The Sleep Heart Health Study. Arch. Intern. Med. 2002, 162, 893–900. [Google Scholar] [CrossRef] [PubMed]


| AHI Score | Total | AHI < 15 | AHI ≥ 15 | p |
|---|---|---|---|---|
| Gender | 0.334 | |||
| female | 12 | 6 | 6 | |
| male | 50 | 17 | 33 | |
| Age, year | 44.4 ± 11.5 | 44.8 ± 12.0 | 44.2 ± 11.3 | 0.833 |
| Recording time, hour | 6.9 ± 0.3 | 6.9 ± 0.3 | 6.9 ± 0.3 | 0.897 |
| BMI | 28.7 ± 5.2 | 27.3 ± 4.2 | 30.0 ± 5.5 | 0.124 |
| NC, cm | 40.2 ± 4.8 | 38.5 ± 3.8 | 41.2 ± 5.1 | 0.016 |
| AHI score (1/hour) | 32.1 ± 27.0 | 7.1 ± 2.9 | 46.8 ± 23.9 | <0.001 |
| Hypoxemia index (1/hour) | 9.7 ± 8.6 | 5.0 ± 2.5 | 12.5 ± 9.7 | 0.004 |
| Arousal index (1/hour) | 19.7 ± 13.9 | 10.4 ± 3.8 | 25.2 ± 14.9 | <0.001 |
| Time domain | ||||
| SDNN, log (ms) | 4.8 ± 0.5 | 4.9 ± 0.5 | 4.8 ± 0.5 | 0.206 |
| SDANN, log (ms) | 4.2 ± 0.7 | 4.4 ± 0.7 | 4.1 ± 0.7 | 0.097 |
| SDNNIDX, log (ms) | 4.5 ± 0.5 | 4.5 ± 0.5 | 4.5 ± 0.6 | 0.761 |
| pNN50, log (%) | 3.1 ± 0.8 | 3.3 ± 0.8 | 3.0 ± 0.9 | 0.207 |
| TINN, log (ms) | 5.3 ± 0.4 | 5.3 ± 0.3 | 5.4 ± 0.5 | 0.443 |
| SDSD, log (ms) | 4.5 ± 0.6 | 4.6 ± 0.5 | 4.4 ± 0.6 | 0.303 |
| RMSSD, log (ms) | 4.5 ± 0.6 | 4.6 ± 0.5 | 4.4 ± 0.6 | 0.303 |
| Frequency domain | ||||
| VLF, log (Hz) | 6.3 ± 0.9 | 6.1 ± 0.7 | 6.4 ± 1.0 | 0.356 |
| LF, log (Hz) | 7.0 ± 1.2 | 7.1 ± 1.0 | 7.0 ± 1.3 | 0.856 |
| HF, log (Hz) | 7.0 ± 1.4 | 7.2 ± 1.1 | 6.9 ± 1.5 | 0.686 |
| LF/HF, log (ratio) | 0.1 ± 0.5 | 0.01 ± 0.5 | 0.2 ± 0.4 | 0.106 |
| Variables | Value | Age | BMI | NC | AHI | Hypoxemia Index | Arousal Index |
|---|---|---|---|---|---|---|---|
| Time domain | |||||||
| SDNN, log (ms) | 4.8 ± 0.5 | 0.01 (0.955) | −0.27 (0.036) | −0.31 (0.014) | −0.13 (0.308) | −0.23 (0.076) | <0.01 (0.997) |
| SDANN, log (ms) | 4.2 ± 0.7 | 0.20 (0.115) | −0.20 (0.121) | −0.10 (0.450) | −0.09 (0.484) | −0.18 (0.158) | −0.05 (0.681) |
| SDNNIDX, log (ms) | 4.5 ± 0.5 | −0.10 (0.421) | −0.20 (0.113) | −0.30 (0.016) | −0.01 (0.945) | −0.19 (0.141) | 0.07 (0.563) |
| pNN50, log (%) | 3.1 ± 0.8 | −0.09 (0.492) | −0.23 (0.072) | −0.28 (0.026) | −0.16 (0.204) | −0.30 (0.016) | 0.05 (0.691) |
| TINN, log (ms) | 5.3 ± 0.4 | −0.37 (0.003) | 0.27 (0.003) | −0.04 (0.740) | 0.22 (0.090) | 0.21 (0.096) | 0.11 (0.384) |
| SDSD, log (ms) | 4.5 ± 0.6 | −0.08 (0.534) | −0.27 (0.034) | −0.38 (0.003) | −0.17 (0.191) | −0.25 (0.052) | −0.04 (0.782) |
| RMSSD, log (ms) | 4.5 ± 0.6 | −0.08 (0.534) | −0.27 (0.034) | −0.38 (0.003) | −0.17 (0.191) | −0.25 (0.052) | −0.04 (0.782) |
| Frequency domain | |||||||
| VLF, log (Hz) | 6.3 ± 0.9 | −0.13 (0.311) | −0.02 (0.855) | −0.15 (0.233) | 0.17 (0.197) | −0.03 (0.841) | 0.19 (0.142) |
| LF, log (Hz) | 7.0 ± 1.2 | −0.11 (0.379) | −0.23 (0.070) | −0.35 (0.006) | −0.08 (0.524) | −0.17 (0.194) | 0.03 (0.804) |
| HF, log (Hz) | 7.0 ± 1.4 | −0.15 (0.260) | −0.28 (0.030) | −0.42 (0.001) | −0.19 (0.139) | −0.27 (0.031) | −0.02 (0.903) |
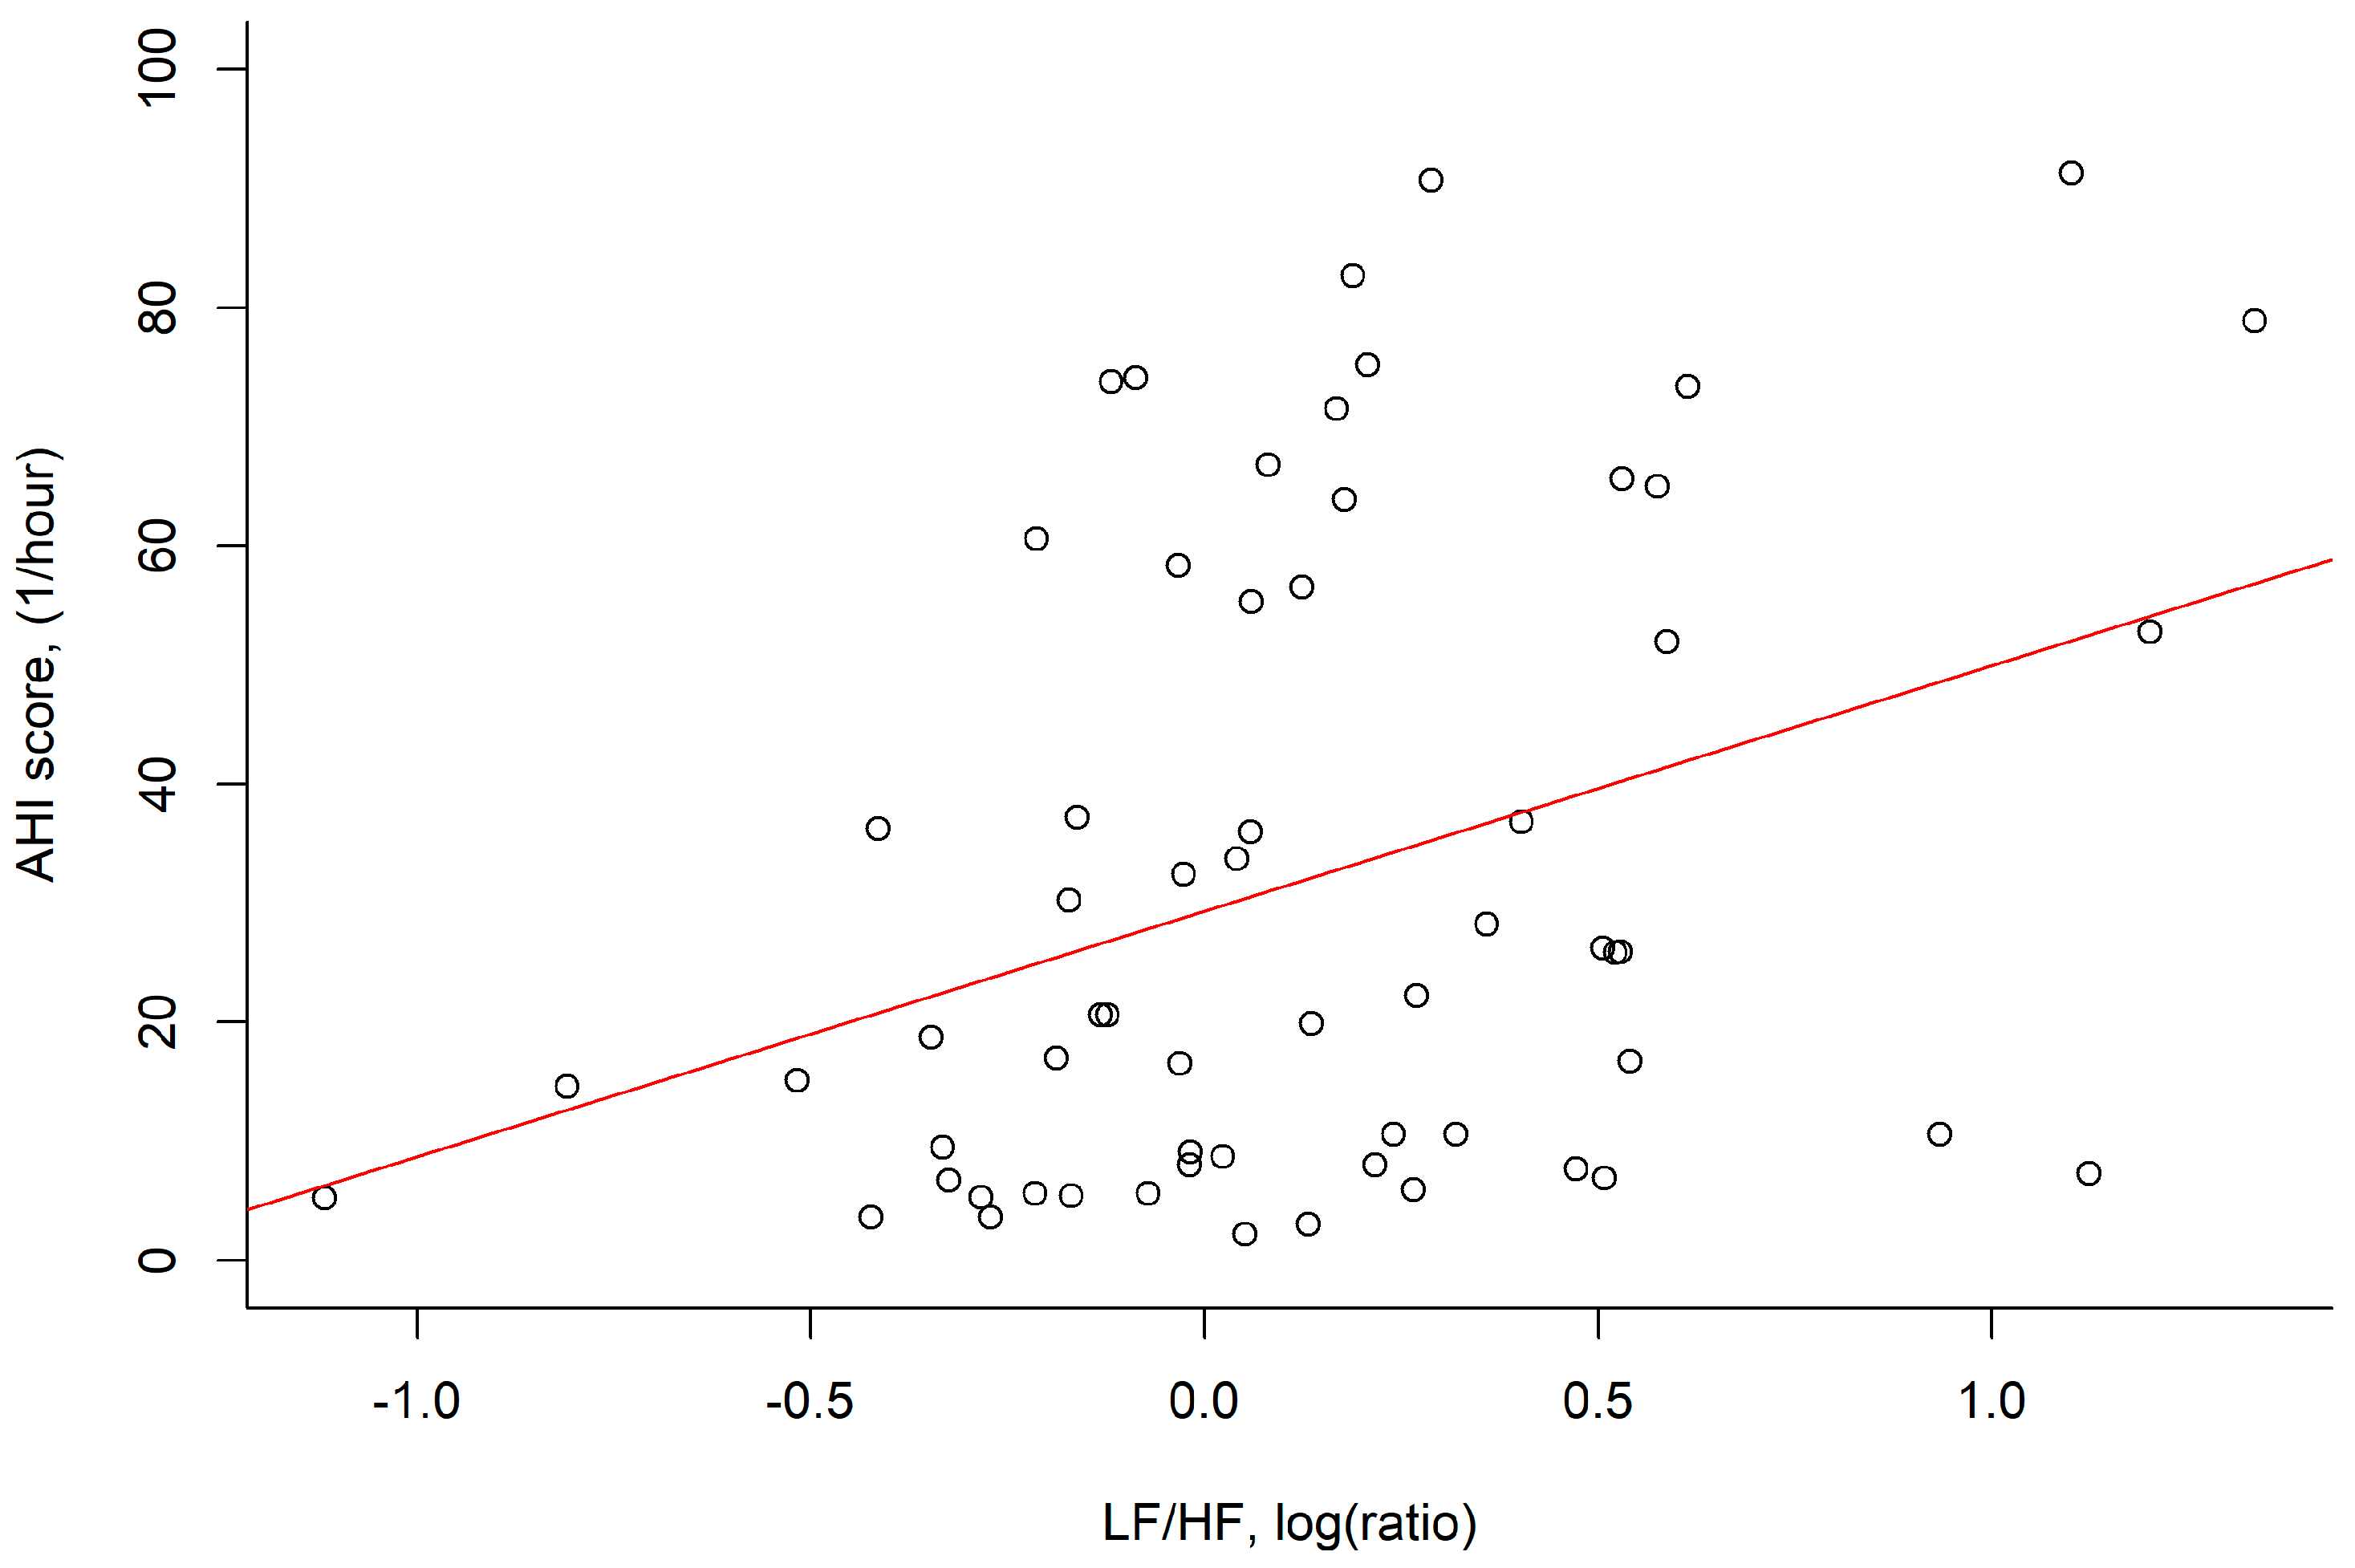
| LF/HF, log (ratio) | 0.1 ± 0.5 | 0.06 (0.624) | 0.22 (0.080) | 0.26 (0.040) | 0.35 (0.006) | 0.43 (0.001) | 0.09 (0.473) |
| β | S.E. | t Value | p | |
|---|---|---|---|---|
| BMI | 2.20 | 0.59 | 3.72 | <0.001 |
| LF/HF, log (ratio) | 15.01 | 6.71 | 2.24 | 0.029 |
| Intercept | −33.08 | 17.04 | −1.94 | 0.057 |
Disclaimer/Publisher’s Note: The statements, opinions and data contained in all publications are solely those of the individual author(s) and contributor(s) and not of MDPI and/or the editor(s). MDPI and/or the editor(s) disclaim responsibility for any injury to people or property resulting from any ideas, methods, instructions or products referred to in the content. |
© 2023 by the authors. Licensee MDPI, Basel, Switzerland. This article is an open access article distributed under the terms and conditions of the Creative Commons Attribution (CC BY) license (https://creativecommons.org/licenses/by/4.0/).
Share and Cite
Lin, Y.-C.; Chiang, J.-K.; Lu, C.-M.; Kao, Y.-H. Association of Heart Rate Variability with Obstructive Sleep Apnea in Adults. Medicina 2023, 59, 471. https://doi.org/10.3390/medicina59030471
Lin Y-C, Chiang J-K, Lu C-M, Kao Y-H. Association of Heart Rate Variability with Obstructive Sleep Apnea in Adults. Medicina. 2023; 59(3):471. https://doi.org/10.3390/medicina59030471
Chicago/Turabian StyleLin, Yen-Chang, Jui-Kun Chiang, Chih-Ming Lu, and Yee-Hsin Kao. 2023. "Association of Heart Rate Variability with Obstructive Sleep Apnea in Adults" Medicina 59, no. 3: 471. https://doi.org/10.3390/medicina59030471
APA StyleLin, Y.-C., Chiang, J.-K., Lu, C.-M., & Kao, Y.-H. (2023). Association of Heart Rate Variability with Obstructive Sleep Apnea in Adults. Medicina, 59(3), 471. https://doi.org/10.3390/medicina59030471