

Patellofemoral Angle, Pelvis Diameter, Foot Posture Index, and Single Leg Hop in Post-Operative ACL Reconstruction

Abstract
1. Introduction
2. Materials and Methods
2.1. Participants
2.2. Experimental Design
2.3. Procedures
2.3.1. Hop Tests
2.3.2. Anthropometric Measures
- (1)
- Talus head palpation (TH)
- (2)
- The curvature below and above the lateral malleolus (LATM)
- (3)
- Inversion and eversion of the os calcaneus (CALC)
- (4)
- Protrusion in the talonavicular joint area (TNJ)
- (5)
- Medial longitudinal arch alignment (MA)
- (6)
- Abduction and adduction of the forefoot when compared with the rearfoot (ABD)
2.4. Statistical Analysis
3. Results
4. Discussion
5. Conclusions
Author Contributions
Funding
Institutional Review Board Statement
Informed Consent Statement
Data Availability Statement
Acknowledgments
Conflicts of Interest
References
- Sanders, T.L.; Maradit Kremers, H.; Bryan, A.J.; Larson, D.R.; Dahm, D.L.; Levy, B.A.; Stuart, M.J.; Krych, A.J. Incidence of Anterior Cruciate Ligament Tears and Reconstruction. Am. J. Sports Med. 2016, 44, 1502–1507. [Google Scholar] [CrossRef]
- Wilk, K.E.; Romaniello, W.T.; Soscia, S.M.; Arrigo, C.A.; Andrews, J.R. The Relationship Between Subjective Knee Scores, Isokinetic Testing, and Functional Testing in the ACL-Reconstructed Knee. J. Orthop. Sport. Phys. Ther. 1994, 20, 60–73. [Google Scholar]
- Beynnon, B.D.; Johnson, R.J.; Fleming, B.C.; Kannus, P.; Kaplan, M.; Samani, J.; Renström, P. Anterior Cruciate Ligament Replacement: Comparison of Bone-Patellar Tendon-Bone Grafts with Two-Strand Hamstring Grafts. A Prospective, Randomized Study. J. Bone Jt. Surg. Am. 2002, 84, 1503–1513. [Google Scholar] [CrossRef]
- Boden, B.P.; Griffin, L.Y.; Garrett, W.E. Etiology and Prevention of Noncontact ACL Injury. Phys. Sportsmed. 2000, 28, 53–60. [Google Scholar] [CrossRef]
- Draganich, L.F.; Vahey, J.W. An In Vitro Study of Anterior Cruciate Ligament Strain Induced by Quadriceps and Hamstrings Forces. J. Orthop. Res. 1990, 8, 57–63. [Google Scholar] [CrossRef]
- Insall, J.; Falvo, K.A.; Wise, D.W. Chondromalacia Patellae. A Prospective Study. J. Bone Jt. Surg. Am. 1976, 58, 1–8. [Google Scholar] [CrossRef]
- Byl, T.; Cole, J.A.; Livingston, L.A. What Determines the Magnitude of the Q Angle? A Preliminary Study of Selected Skeletal and Muscular Measures. J. Sport Rehabil. 2000, 9, 26–34. [Google Scholar]
- Wilson, T.; Kitsell, F. Is the Q-Angle an Absolute or a Variable Measure? Physiotherapy 2002, 88, 296–302. [Google Scholar] [CrossRef]
- McConnell, J.; Fulkerson, J.P. The Knee: Patellofemoral and Soft Tissue Injuries. Athletic Injuries and Rehabilitation; WB Saunders Co.: Philadelphia, PA, USA, 1996; pp. 693–728. [Google Scholar]
- Caylor, D.; Fites, R.; Worrell, T.W. The Relationship between Quadriceps Angle and Anterior Knee Pain Syndrome. J. Orthop. Sport. Phys. Ther. 1993, 17, 11–16. [Google Scholar] [CrossRef]
- Outerbridge, R.E. Further Studies On The Etiology of Chondromalacia Patellae. J. Bone Jt. Surg. Br. 1964, 46, 179–190. [Google Scholar] [CrossRef]
- Marenčáková, J.; Svoboda, Z.; Vařeka, I.; Zahálka, F. Functional Clinical Typology of the Foot and Kinematic Gait Parameters. Acta Gymnica 2016, 46, 74–81. [Google Scholar] [CrossRef]
- Gill, S.V.; Lewis, C.L.; DeSilva, J.M. Arch Height Mediation of Obesity-Related Walking in Adults: Contributors to Physical Activity Limitations. Physiol. J. 2014, 2014, 821482. [Google Scholar] [CrossRef]
- Clement, D.B.; Taunton, J.E.; Smart, G.W.; McNicol, K.L. A Survey of Overuse Running Injuries. Phys. Sportsmed. 1981, 9, 47–58. [Google Scholar] [CrossRef]
- Williams, D.S.; McClay, I.S.; Hamill, J.; Buchanan, T.S. Lower Extremity Kinematic and Kinetic Differences in Runners with High and Low Arches. J. Appl. Biomech. 2001, 17, 153–163. [Google Scholar] [CrossRef]
- Razeghi, M.; Batt, M.E. Foot Type Classification: A Critical Review of Current Methods. Gait Posture. 2002, 15, 282–291. [Google Scholar] [CrossRef]
- Kernozek, T.W.; Ricard, M.D. Foot Placement Angle and Arch Type: Effect on Rearfoot Motion. Arch. Phys. Med. Rehabil. 1990, 71, 988–991. [Google Scholar]
- Nachbauer, W.; Nigg, B.M. Effects of Arch Height of the Foot on Ground Reaction Forces in Running. Med. Sci. Sports Exerc. 1992, 24, 1264–1269. [Google Scholar] [CrossRef]
- Cournapeau, J.; Klouche, S.; Hardy, P. Material Costs of Anterior Cruciate Ligament Reconstruction with Hamstring Tendons by Two Different Techniques. Orthop. Traumatol. Surg. Res. 2013, 99, 196–201. [Google Scholar] [CrossRef]
- Logerstedt, D.S.; Snyder-Mackler, L.; Ritter, R.C.; Axe, M.J.; Godges, J.J. Knee Stability and Movement Coordination Impairments: Knee Ligament Sprain. J. Orthop. Sport. Phys. Ther. 2010, 40, A1–A37. [Google Scholar] [CrossRef]
- Clark, N.C. Functional Performance Testing Following Knee Ligament Injury. Phys. Ther. Sport. 2001, 2, 91–105. [Google Scholar] [CrossRef]
- Roberts, D.; Ageberg, E.; Andersson, G.; Fridén, T. Clinical Measurements of Proprioception, Muscle Strength and Laxity in Relation to Function in the ACL-Injured Knee. Knee Surg. Sport Traumatol. Arthrosc. 2007, 15, 9–16. [Google Scholar] [CrossRef]
- Kraus, V.B.; Vail, T.P.; Worrell, T.; McDaniel, G. A Comparative Assessment of Alignment Angle of the Knee by Radiographic and Physical Examination Methods. Arthritis Rheum. 2005, 52, 1730–1735. [Google Scholar] [CrossRef]
- Cornwall, M.W.; McPoil, T.G.; Lebec, M.; Vicenzino, B.; Wilson, J. Reliability of the Modified Foot Posture Index. J. Am. Podiatr. Med. Assoc. 2008, 98, 7–13. [Google Scholar] [CrossRef]
- Redmond, A.C.; Crosbie, J.; Ouvrier, R.A. Development and Validation of a Novel Rating System for Scoring Standing Foot Posture: The Foot Posture Index. Clin. Biomech. 2006, 21, 89–98. [Google Scholar] [CrossRef]
- Dhillon, M.S.; Mohan, P.; Nagi, O.N. Does Harvesting the Medial Third of the Patellar Tendon Cause Lateral Shift of the Patella after ACL Reconstruction? Acta Orthop. Belg. 2003, 69, 334–340. [Google Scholar]
- Guerra, J.P.; Arnold, M.J.; Gajdosik, R.L. Q Angle: Effects of Isometric Quadriceps Contraction and Body Position. J. Orthop. Sport. Phys. Ther. 1994, 19, 200–204. [Google Scholar] [CrossRef][Green Version]
- Livingston, L.A.; Mandigo, J.L. Bilateral Within-Subject Q Angle Asymmetry in Young Adult Females and Males. Biomed. Sci. Instrum. 1997, 33, 112–117. [Google Scholar]
- Woodland, L.H.; Francis, R.S. Parameters and Comparisons of the Quadriceps Angle of College-Aged Men and Women in the Supine and Standing Positions. Am. J. Sports Med. 1992, 20, 208–211. [Google Scholar] [CrossRef]
- Hsu, R.W.; Himeno, S.; Coventry, M.B.; Chao, E.Y. Normal Axial Alignment of the Lower Extremity and Load-Bearing Distribution at the Knee. Clin. Orthop. Relat. Res. 1990, 255, 215–227. [Google Scholar] [CrossRef]
- Shultz, S.J.; Nguyen, A.-D.; Windley, T.C.; Kulas, A.S.; Botic, T.L.; Beynnon, B.D. Intratester and Intertester Reliability of Clinical Measures of Lower Extremity Anatomic Characteristics: Implications for Multicenter Studies. Clin. J. Sport Med. 2006, 16, 155–161. [Google Scholar] [CrossRef]
- Hertel, J.; Dorfman, J.H.; Braham, R.A. Lower Extremity Malalignments and Anterior Cruciate Ligament Injury History. J. Sports Sci. Med. 2004, 3, 220–225. [Google Scholar]
- Elvan, A.; Simsek, I.E.; Cakiroglu, M.A.; Angin, S. Association of Quadriceps Angle with Plantar Pressure Distribution, Navicular Height and Calcaneo-Tibial Angle. Acta Orthop. Traumatol. Turc. 2019, 53, 145–149. [Google Scholar] [CrossRef]
- Levangie, P.K.; Norkin, C.C. Joint Structure and Function: A Comprehensive Analysis; WB Saunders Co.: Philadelphia, PA, USA, 2001. [Google Scholar]
- Barrios, J.A.; Higginson, J.S.; Royer, T.D.; Davis, I.S. Static and Dynamic Correlates of the Knee Adduction Moment in Healthy Knees Ranging from Normal to Varus-Aligned. Clin. Biomech. 2009, 24, 850–854. [Google Scholar] [CrossRef]
- Horton, M.G.; Hall, T.L. Quadriceps Femoris Muscle Angle: Normal Values and Relationships with Gender and Selected Skeletal Measures. Phys. Ther. 1989, 69, 897–901. [Google Scholar] [CrossRef]
- Abdelaziem, A.; Abdelraouf, O.; ElGohary, T.; ElGohary, T. Effect of Body Position on Measurement of Q Angle in Trained Individuals with and without Patellofemoral Pain. Int. J. Ther. Rehabil. Res. 2014, 3, 1. [Google Scholar] [CrossRef]
- Örtqvist, M.; Moström, E.B.; Roos, E.M.; Lundell, P.; Janarv, P.-M.; Werner, S.; Broström, E.W. Reliability and Reference Values of Two Clinical Measurements of Dynamic and Static Knee Position in Healthy Children. Knee Surg. Sport Traumatol. Arthrosc. 2011, 19, 2060–2066. [Google Scholar]
- Hehne, H.J. Biomechanics of the Patellofemoral Joint and Its Clinical Relevance. Clin. Orthop. Relat. Res. 1990, 258, 73–85. [Google Scholar] [CrossRef]
- France, L.; Nester, C. Effect of Errors in the Identification of Anatomical Landmarks on the Accuracy of Q Angle Values. Clin. Biomech. 2001, 16, 710–713. [Google Scholar] [CrossRef]
- Eliöz, M.; Atan, T.; Saç, A.; Yamak, B. Sporcu ve Sedanterlerde Q Açısı İle Bazı Fiziksel Özellikler Arasındaki İlişkinin İncelenmesi. Spor Ve Performans Araştırmaları Derg. 2015, 6, 58. [Google Scholar] [CrossRef][Green Version]
- Grelsamer, R.P.; Dubey, A.; Weinstein, C.H. Men and Women Have Similar Q Angles. J. Bone Joint Surg. Br. 2005, 87, 1498–1501. [Google Scholar] [CrossRef]
- Grubbs, N.; Nelson, R.T.; Bandy, W.D. Predictive Validity of an Injury Score among High School Basketball Players. Med. Sci. Sports Exerc. 1997, 29, 1279–1285. [Google Scholar] [CrossRef]
- Di Brezzo, R.; Frot, L.; Hall, K. The Relationship with Selected Dynamic Performance Variable in Women. Clin. Kines 1996, 50, 66–70. [Google Scholar]
- Kramer, P.G. Patella Malalignment Syndrome: Rationale to Reduce Excessive Lateral Pressure. J. Orthop. Sport. Phys. Ther. 1986, 8, 301–309. [Google Scholar] [CrossRef]
- Kavlak, Y.; Demirtaş, R.N. Effect of Foot Problems on Foot Function in Elderly Men. Türk Geriatr. Derg. 2010, 13, 191–196. [Google Scholar]
- Barber, S.D.; Noyes, F.R.; Mangine, R.E.; McCloskey, J.W.; Hartman, W. Quantitative Assessment of Functional Limitations in Normal and Anterior Cruciate Ligament-Deficient Knees. Clin. Orthop. Relat. Res. 1990, 255, 204–214. [Google Scholar] [CrossRef]
- Tegner, Y.; Lysholm, J.; Lysholm, M.; Gillquist, J. A Performance Test to Monitor Rehabilitation and Evaluate Anterior Cruciate Ligament Injuries. Am. J. Sports Med. 1986, 14, 156–159. [Google Scholar] [CrossRef]
- Augustsson, J.; Thomeé, R.; Karlsson, J. Ability of a New Hop Test to Determine Functional Deficits after Anterior Cruciate Ligament Reconstruction. Knee Surg. Sport Traumatol. Arthrosc. 2004, 12, 350–356. [Google Scholar] [CrossRef]
- Liu-Ambrose, T.; Taunton, J.E.; MacIntyre, D.; McConkey, P.; Khan, K.M. The Effects of Proprioceptive or Strength Training on the Neuromuscular Function of the ACL Reconstructed Knee: A Randomized Clinical Trial. Scand. J. Med. Sci. Sports. 2003, 13, 115–123. [Google Scholar] [CrossRef]
- Kehribar, L.; Yılmaz, A.K.; Karaduman, E.; Kabadayı, M.; Bostancı, Ö.; Sürücü, S.; Aydın, M.; Mahiroğulları, M. Post-Operative Results of ACL Reconstruction Techniques on Single-Leg Hop Tests in Athletes: Hamstring Autograft vs. Hamstring Grafts Fixed Using Adjustable Cortical Suspension in Both the Femur and Tibia. Medicina 2022, 58, 435. [Google Scholar] [CrossRef]
- Acar, K.; Yilmaz, A.K. Functional Dimorphism and Relationship between Different Lower Extremity Strength Tests in Young Elite Judokas. Rev. Artes Marciales Asiáticas. 2021, 16, 56–66. [Google Scholar] [CrossRef]
- Munro, A.G.; Herrington, L.C. Between-Session Reliability of Four Hop Tests and the Agility t-Test. J. Strength Cond. Res. 2011, 25, 1470–1477. [Google Scholar] [CrossRef]
- Hardesty, K.; Hegedus, E.J.; Ford, K.R.; Nguyen, A.-D.; Taylor, J.B. Determination of Clinically Relevant Differences in Frontal Plane Hop Tests in Women’s Collegiate Basketball and Soccer Players. Int. J. Sports Phys. Ther. 2017, 12, 182–189. [Google Scholar]
- Dingenen, B.; Truijen, J.; Bellemans, J.; Gokeler, A. Test–Retest Reliability and Discriminative Ability of Forward, Medial and Rotational Single-Leg Hop Tests. Knee 2019, 26, 978–987. [Google Scholar] [CrossRef]


| Patient Demographics | Mean | SD | Min | Max |
|---|---|---|---|---|
| Age (years) | 29.28 | 6.86 | 18.0 | 35 |
| Height (cm) | 176.36 | 6.30 | 167.0 | 190.0 |
| Weight (kg) | 85.28 | 11.52 | 70.0 | 125.0 |
| BMI (kg/m2) | 27.36 | 2.64 | 22.60 | 34.63 |
| Follow-up (months) | 6.50 | 1.2 | 6 | 8 |
| Pelvis D. (cm) | 39.67 | 3.50 | 32.8 | 51.9 |
| R | L | |||
| Operated Side (n/%) | 15/60 | 10/40 | ||
| Dominant Side (n/%) | 20/80 | 5/20 |
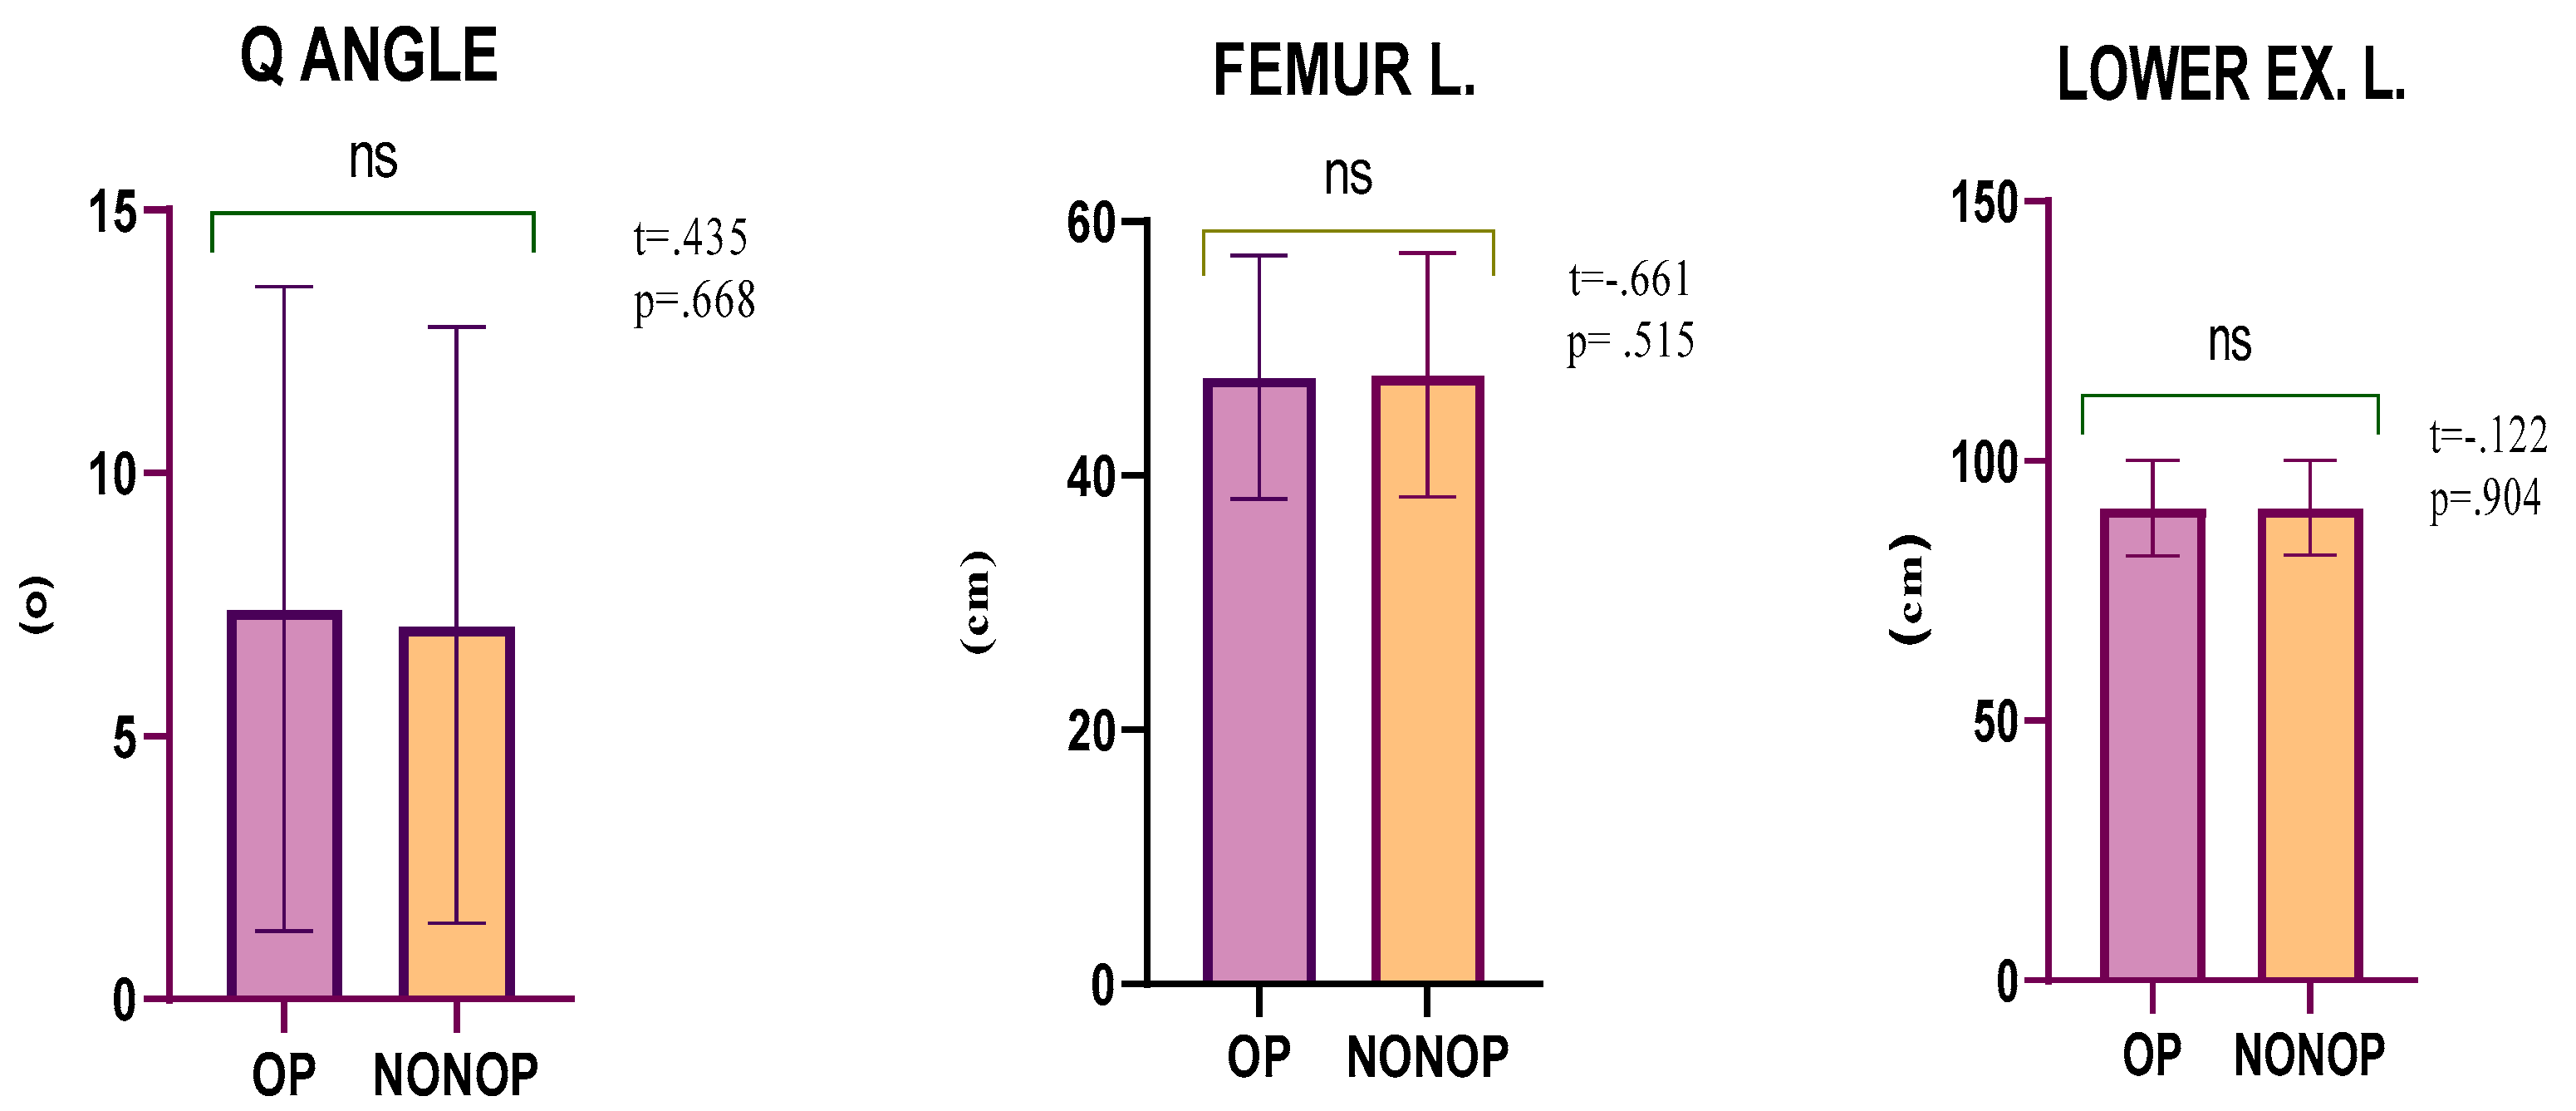
| OP | NONOP | t | p | ES | 95% CI | ||
|---|---|---|---|---|---|---|---|
| Mean ± S.D | Mean ± S.D | LB | UB | ||||
| Q angle (°) | 7.42 ± 6.12 | 7.11 ± 5.67 | 0.435 | 0.668 | 0.05 | −1.17 | 1.79 |
| Femur L. (cm) | 47.76 ± 9.56 | 47.91 ± 9.59 | −0.661 | 0.515 | 0.02 | −0.64 | 0.33 |
| Lower Extremity L. (cm) | 91.00 ± 9.13 | 91.04 ± 9.09 | −0.122 | 0.904 | 0.00 | −0.72 | 0.64 |
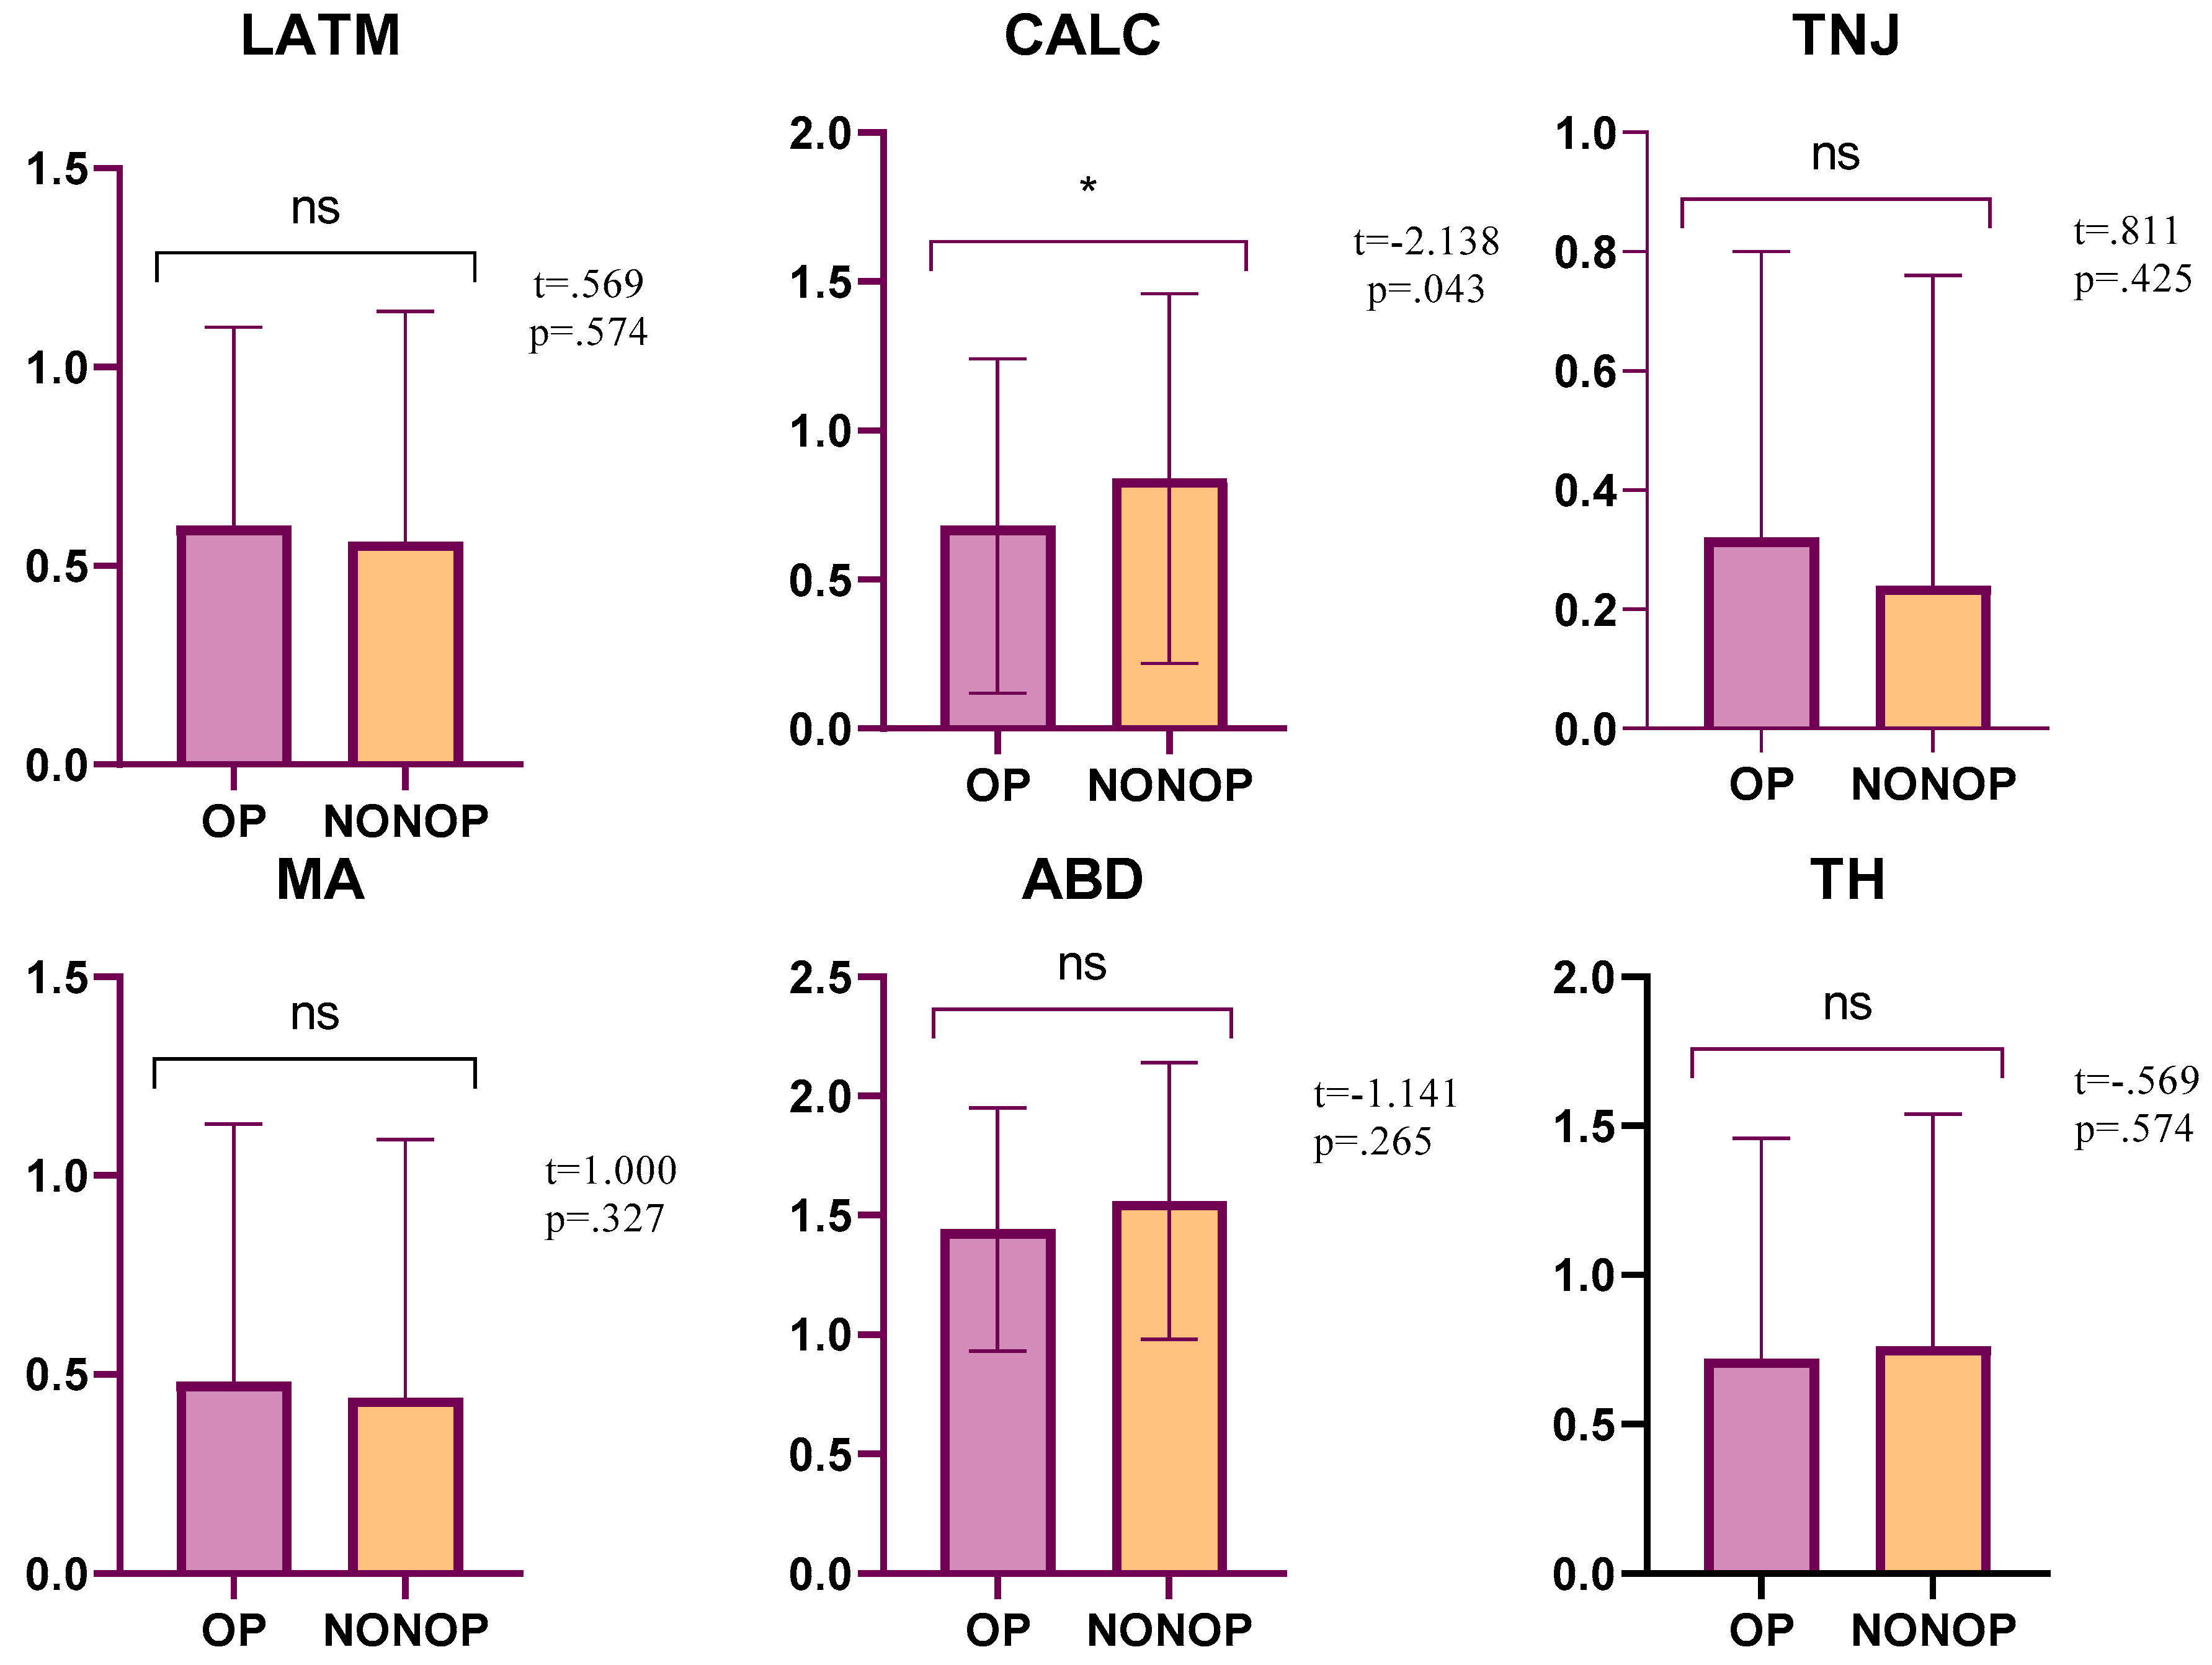
| OP | NONOP | t | p | ES | 95% CI | ||
|---|---|---|---|---|---|---|---|
| Mean ± SD | Mean ± SD | LB | UB | ||||
| TH | 0.72 ± 0.74 | 0.76 ± 0.78 | −0.569 | 0.574 | 0.05 | −0.19 | 0.11 |
| LATM | 0.60 ± 0.50 | 0.56 ± 0.58 | 0.569 | 0.574 | 0.07 | −0.11 | 0.19 |
| CALC | 0.68 ± 0.56 | 0.84 ± 0.62 | −2.138 | 0.043 * | 0.27 | −0.31 | −0.01 |
| TNJ | 0.32 ± 0.48 | 0.24 ± 0.52 | 0.811 | 0.425 | 0.16 | −0.12 | 0.29 |
| MA | 0.48 ± 0.65 | 0.44 ± 0.65 | 1.000 | 0.327 | 0.06 | −0.04 | 0.12 |
| ABD | 1.44 ± 0.51 | 1.56 ± 0.58 | −1.141 | 0.265 | 0.22 | −0.34 | 0.10 |
| TFPI | 4.24 ± 1.98 | 4.36 ± 2.14 | −0.569 | 0.574 | 0.06 | −0.56 | 0.32 |
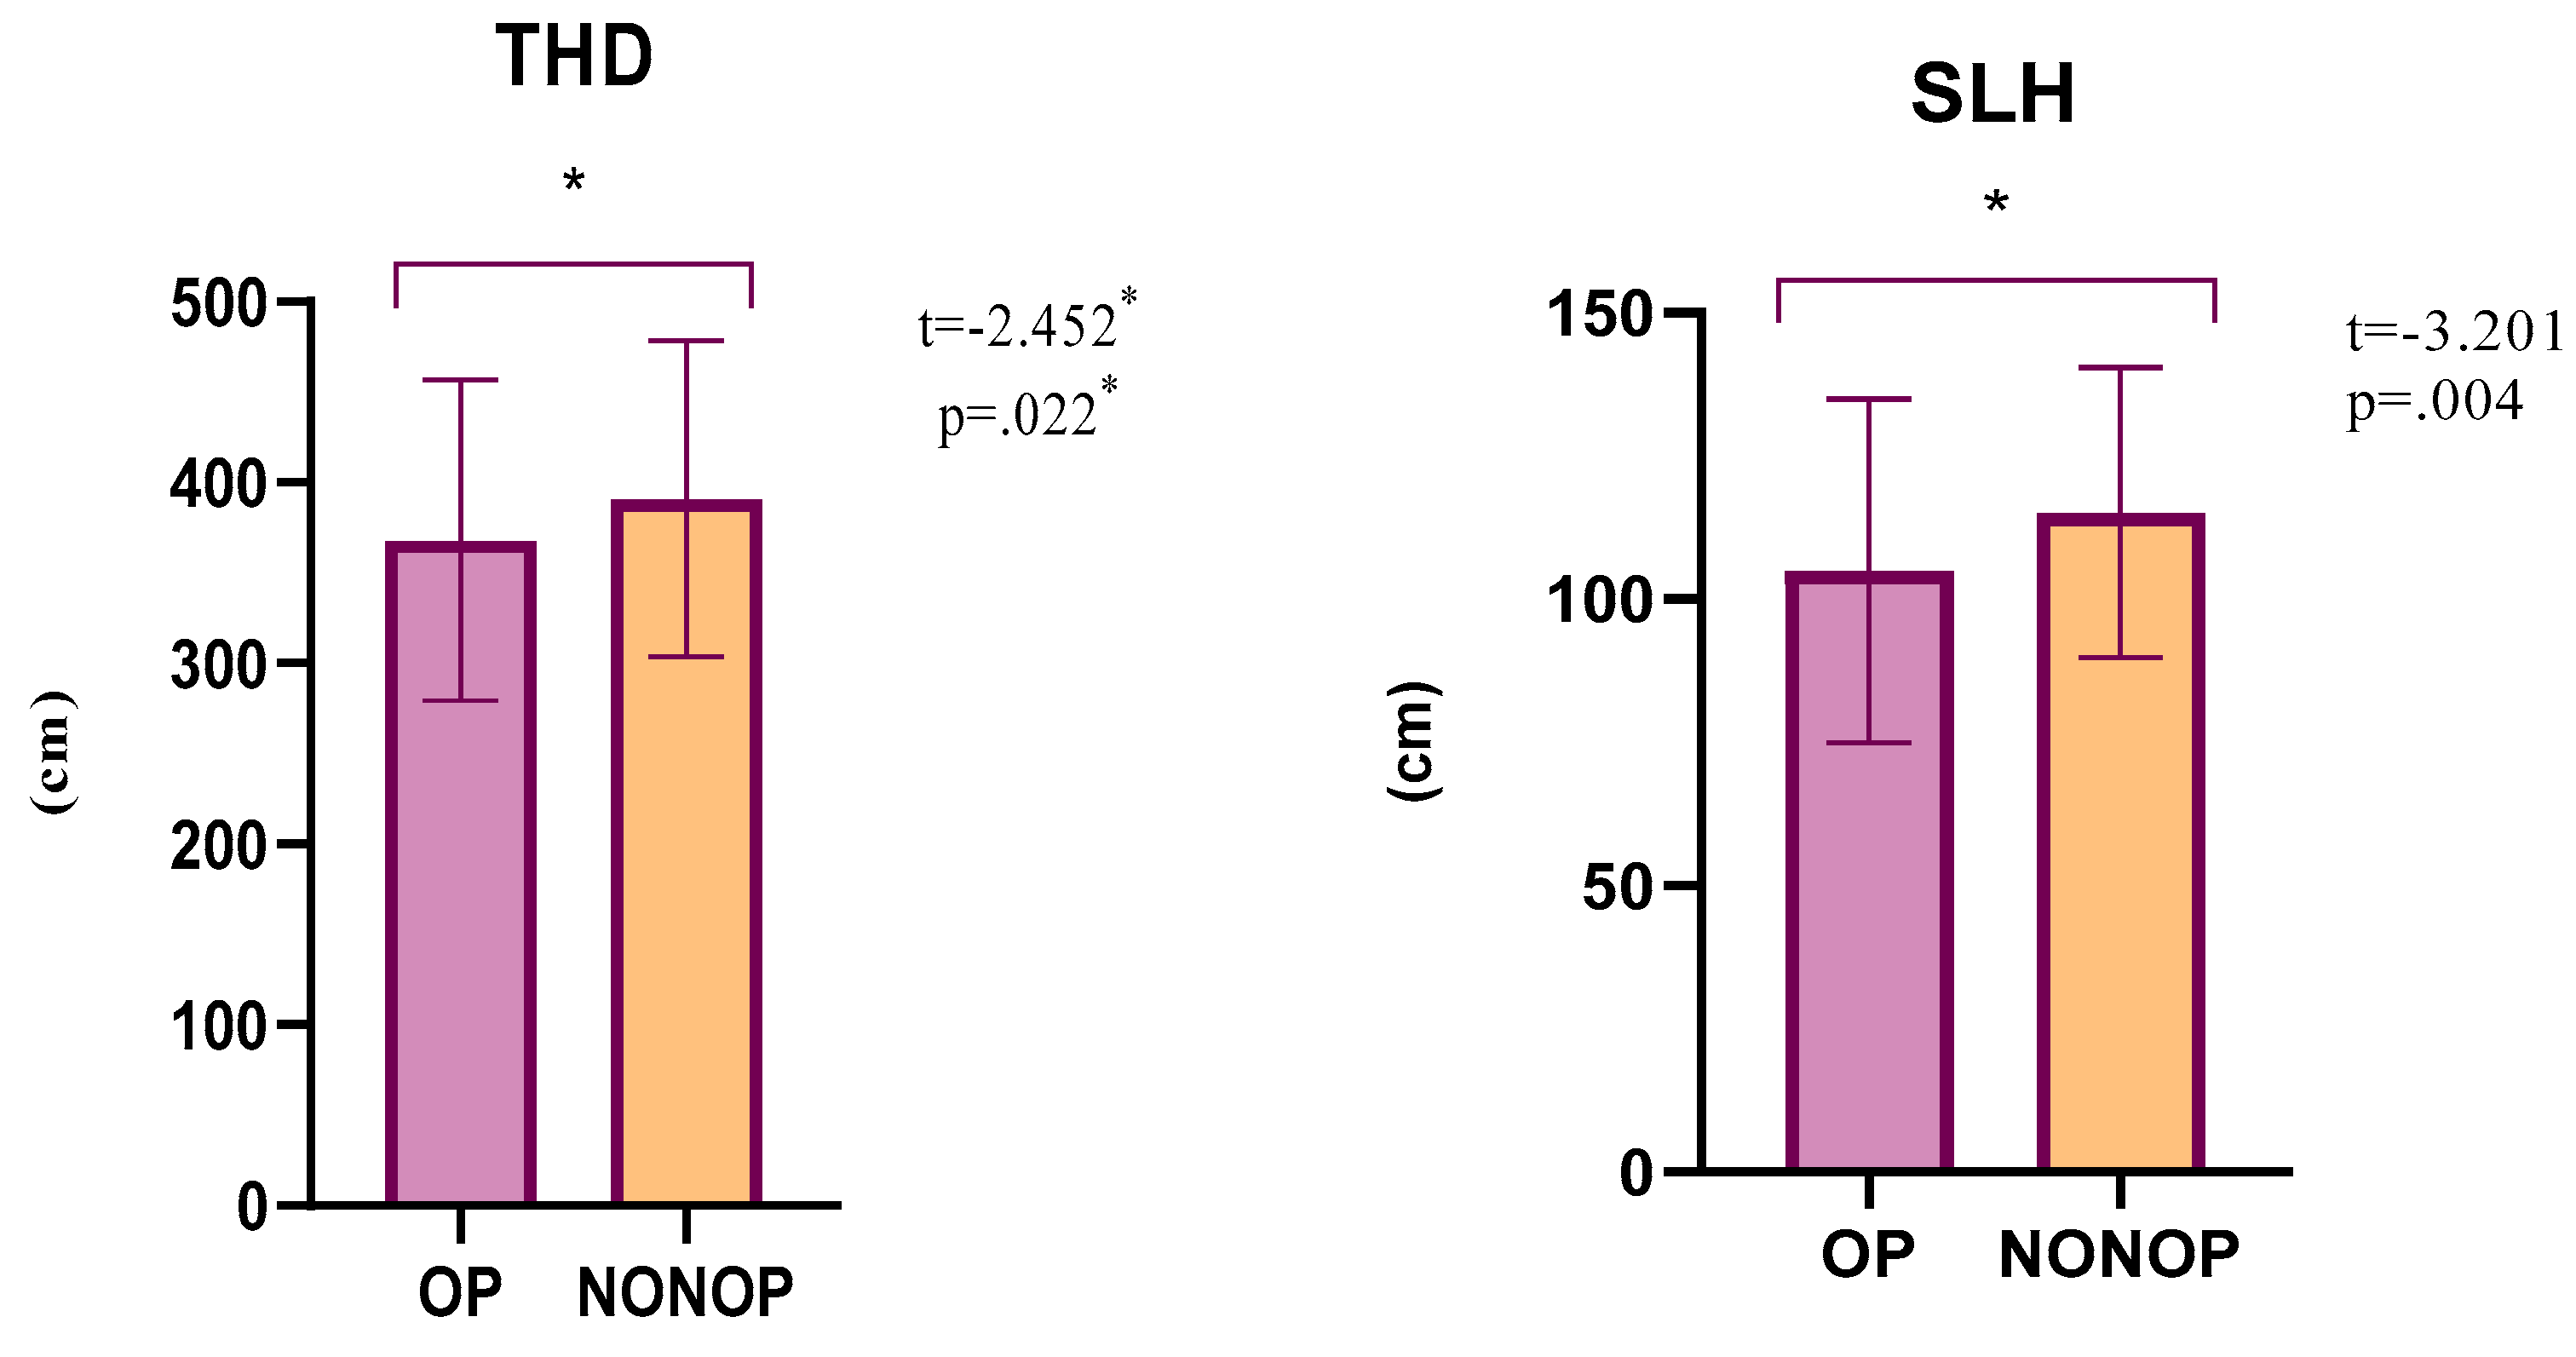
| OP | NONOP | LSI | t | p | ES | 95% CI | ||
|---|---|---|---|---|---|---|---|---|
| Mean ± SD | Mean ± SD | LB | UB | |||||
| SLH | 104.96 ± 30.00 | 115.08 ± 25.32 | 90.73 | −3.201 | 0.004 * | 0.36 | −16.64 | −3.60 |
| THD | 368.20 ± 88.81 | 391.00 ± 87.60 | 94.48 | −2.452 | 0.022 * | 0.26 | −41.99 | −3.61 |
| Pelvis D. | Q Angle | FL (cm) | LEL (cm) | TH | LATM | CALC | TNJ | MA | ABD | TFPI | SLH | |
|---|---|---|---|---|---|---|---|---|---|---|---|---|
| Q Angle | −0.071 | |||||||||||
| FL (cm) | 0.216 | −0.098 | ||||||||||
| LEL (cm) | −0.162 | −0.030 | 0.184 | |||||||||
| TH | 0.133 | −0.257 | −0.105 | 0.118 | ||||||||
| LATM | 0.058 | 0.314 | −0.056 | 0.192 | 0.249 | |||||||
| CALC | 0.207 | 0.147 | −0.062 | 0.213 | 0.382 | 0.718 ** | ||||||
| TNJ | −0.261 | 0.134 | 0.228 | −0.153 | 0.028 | 0.385 | 0.088 | |||||
| MA | 0.280 | 0.243 | 0.233 | −0.014 | 0.118 | −0.026 | −0.133 | 0.289 | ||||
| ABD | 0.166 | −0.071 | 0.187 | 0.144 | 0.233 | 0.395 | 0.520 ** | −0.090 | −0.035 | |||
| TFPI | 0.193 | 0.119 | 0.109 | 0.147 | 0.646 ** | 0.730 ** | 0.713 ** | 0.444 * | 0.389 | 0.554 * | ||
| SLH | −0.221 | −0.127 | −0.094 | 0.265 | −0.057 | −0.298 | −0.475 * | −0.008 | 0.082 | −0.281 | −0.276 | |
| THD | −0.278 | −0.134 | −0.139 | 0.231 | −0.026 | −0.276 | −0.441 * | −0.017 | −0.048 | −0.278 | −0.294 | 0.917 ** |
| Pelvis D. | Q Angle | FL (cm) | LEL (cm) | TH | LATM | CALC | TNJ | MA | ABD | TFAPI | SLH | |
|---|---|---|---|---|---|---|---|---|---|---|---|---|
| Q Angle | −0.278 | |||||||||||
| FL (cm) | 0.225 | −0.031 | ||||||||||
| LEL (cm) | −0.193 | 0.167 | 0.146 | |||||||||
| TH | 0.145 | −0.088 | −0.009 | 0.196 | ||||||||
| LATM | 0.151 | 0.237 | −0.030 | 0.224 | 0.492 * | |||||||
| CALC | 0.282 | 0.029 | 0.039 | 0.317 | 0.517 ** | 0.600 ** | ||||||
| TNJ | −0.403* | 0.305 | 0.046 | 0.024 | 0.045 | −0.049 | −0.005 | |||||
| MA | 0.279 | 0.131 | 0.207 | 0.025 | 0.217 | −0.018 | 0.180 | 0.167 | ||||
| ABD | 0.015 | 0.094 | 0.225 | 0.129 | 0.308 | 0.510 ** | 0.485 * | −0.049 | −0.127 | |||
| TFAPI | 0.123 | 0.227 | 0.123 | 0.252 | 0.729 ** | 0.667 ** | 0.794 ** | 0.329 | 0.420 * | 0.567 ** | ||
| SLH | −0.183 | 0.135 | −0.203 | 0.174 | 0.081 | −0.017 | −0.413 * | 0.250 | −0.129 | −0.302 | −0.171 | |
| THD | −0.311 | 0.151 | −0.180 | 0.180 | 0.084 | 0.030 | −0.427 * | 0.340 | −0.226 | −0.314 | −0.158 | 0.867 ** |
Disclaimer/Publisher’s Note: The statements, opinions and data contained in all publications are solely those of the individual author(s) and contributor(s) and not of MDPI and/or the editor(s). MDPI and/or the editor(s) disclaim responsibility for any injury to people or property resulting from any ideas, methods, instructions or products referred to in the content. |
© 2023 by the authors. Licensee MDPI, Basel, Switzerland. This article is an open access article distributed under the terms and conditions of the Creative Commons Attribution (CC BY) license (https://creativecommons.org/licenses/by/4.0/).
Share and Cite
Genç, A.S.; Güzel, N. Patellofemoral Angle, Pelvis Diameter, Foot Posture Index, and Single Leg Hop in Post-Operative ACL Reconstruction. Medicina 2023, 59, 426. https://doi.org/10.3390/medicina59030426
Genç AS, Güzel N. Patellofemoral Angle, Pelvis Diameter, Foot Posture Index, and Single Leg Hop in Post-Operative ACL Reconstruction. Medicina. 2023; 59(3):426. https://doi.org/10.3390/medicina59030426
Chicago/Turabian StyleGenç, Ahmet Serhat, and Nizamettin Güzel. 2023. "Patellofemoral Angle, Pelvis Diameter, Foot Posture Index, and Single Leg Hop in Post-Operative ACL Reconstruction" Medicina 59, no. 3: 426. https://doi.org/10.3390/medicina59030426
APA StyleGenç, A. S., & Güzel, N. (2023). Patellofemoral Angle, Pelvis Diameter, Foot Posture Index, and Single Leg Hop in Post-Operative ACL Reconstruction. Medicina, 59(3), 426. https://doi.org/10.3390/medicina59030426