
Effects of Sodium-Glucose Co-Transporter-2 Inhibition on Pulmonary Arterial Stiffness and Right Ventricular Function in Heart Failure with Reduced Ejection Fraction


Abstract
:1. Introduction
2. Materials and Methods
2.1. Patients
2.2. Study Protocol
2.3. Definitions
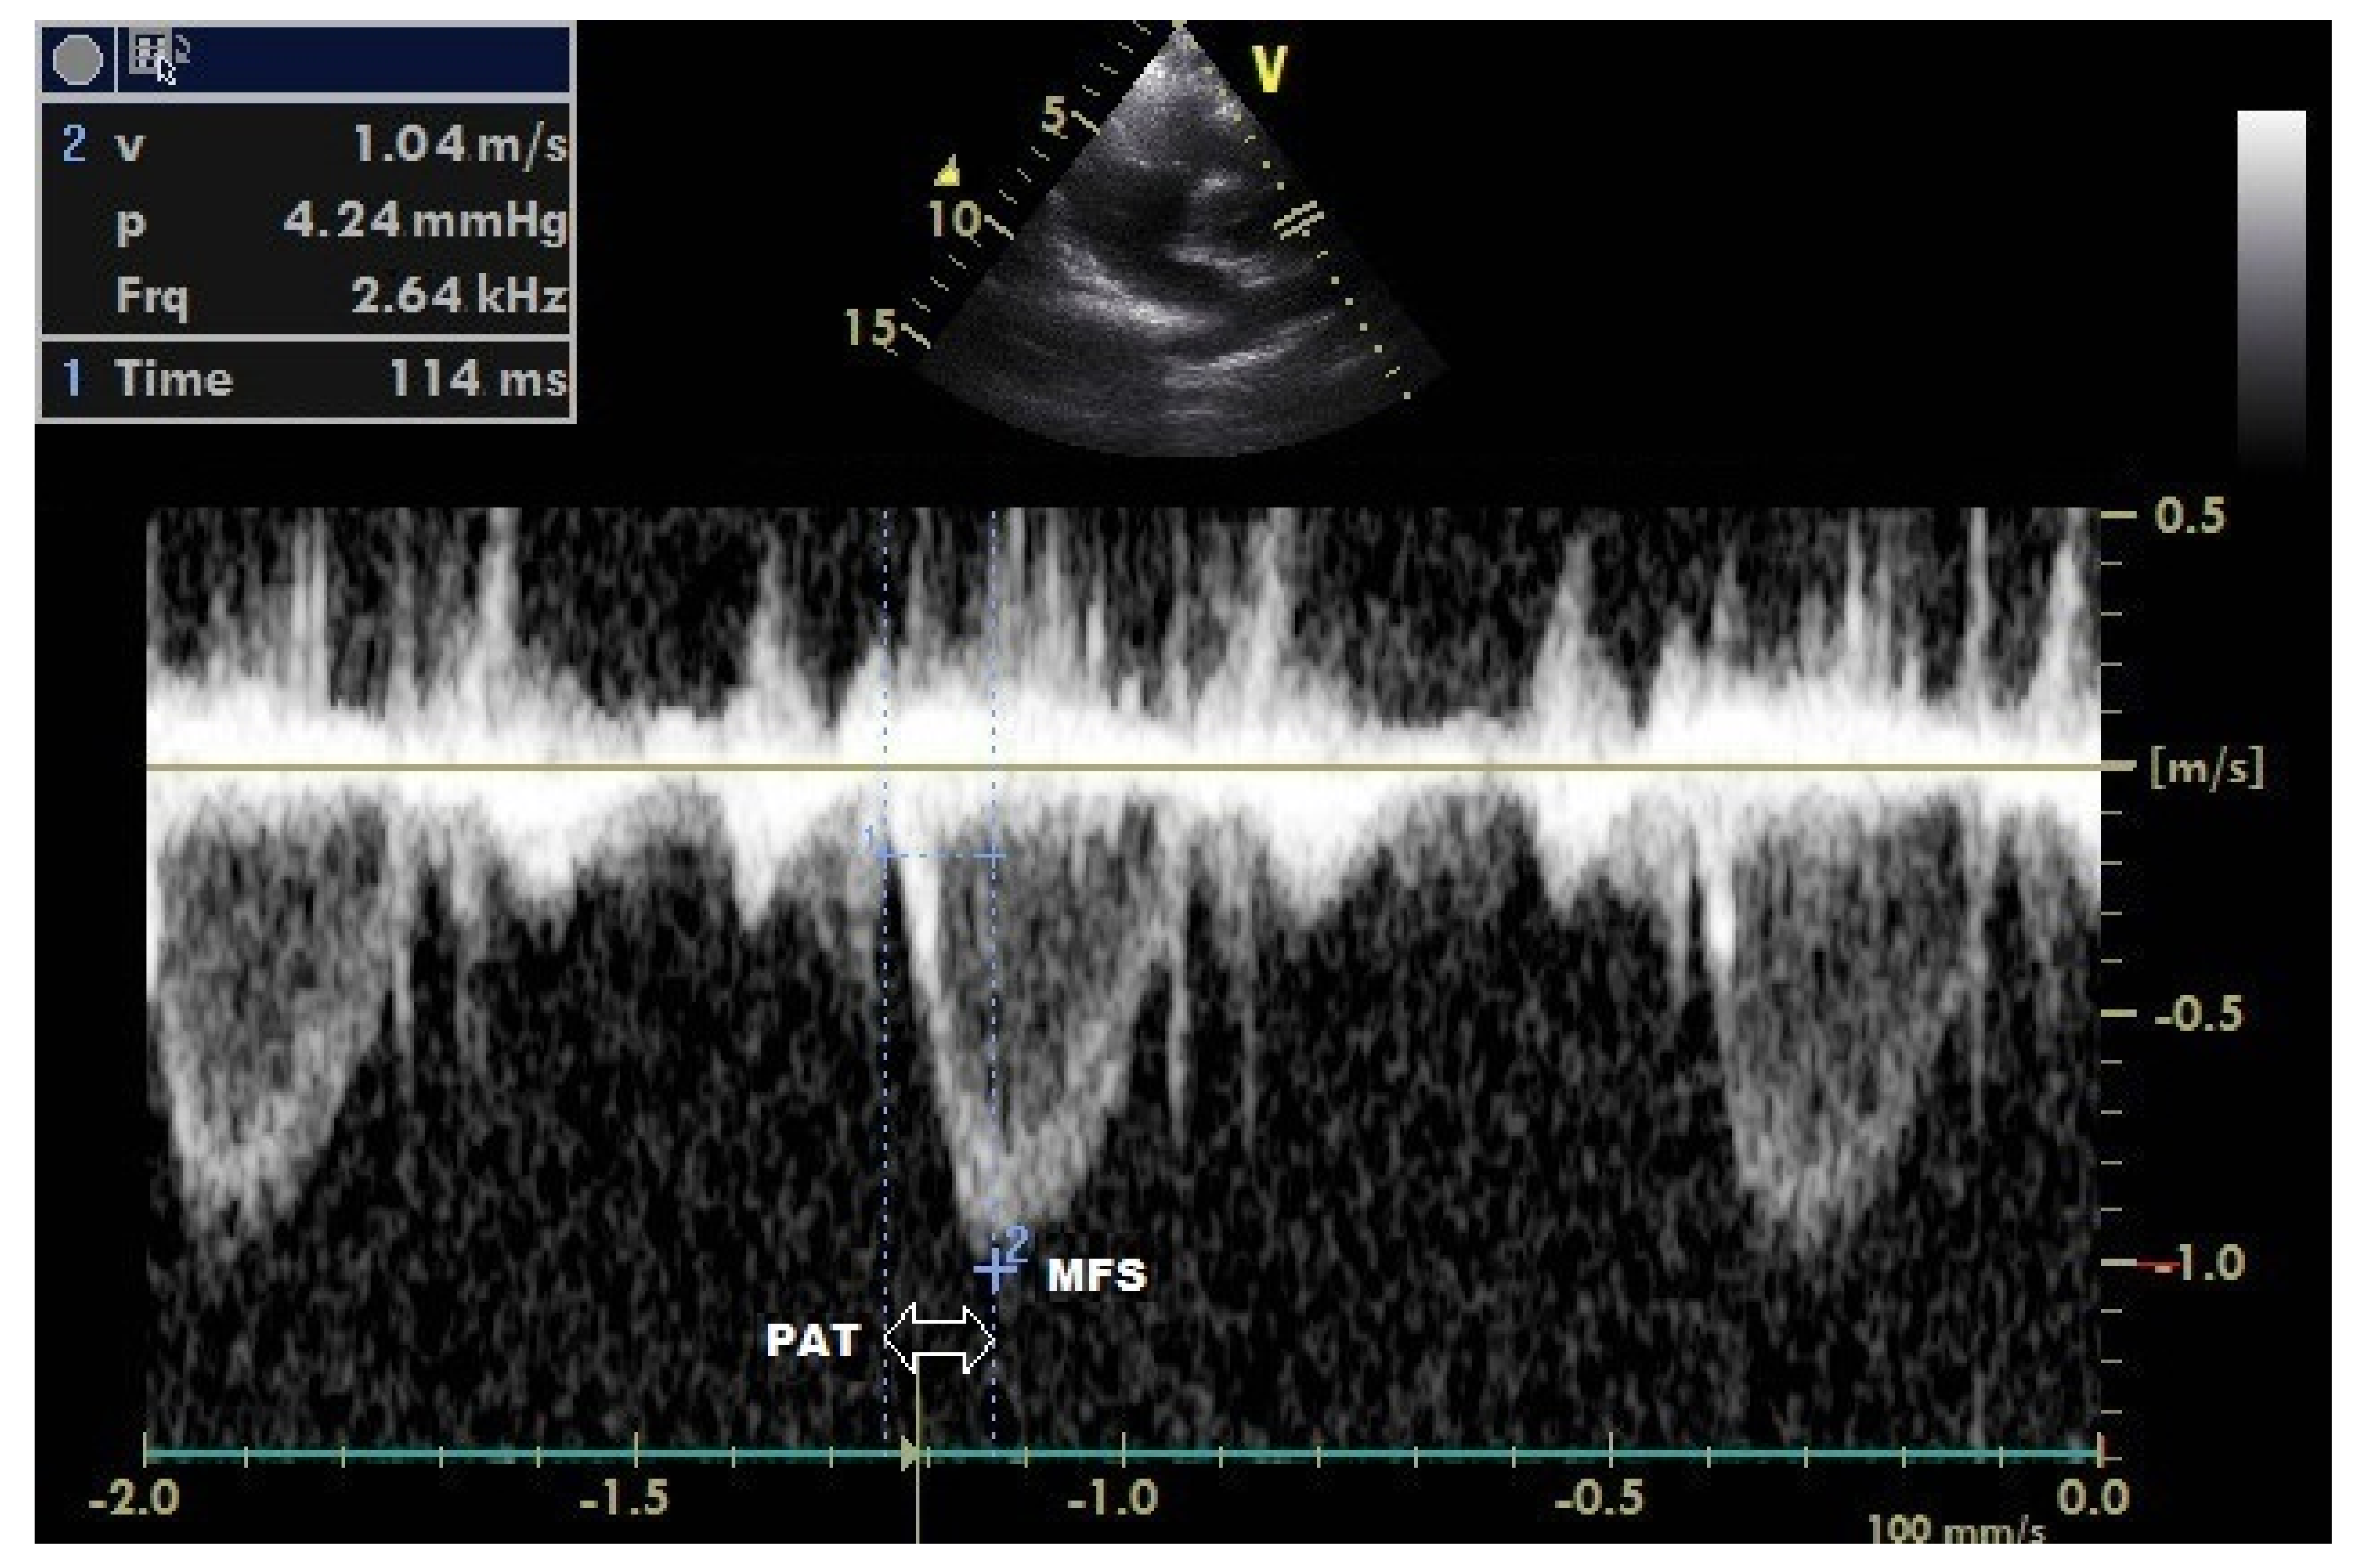
2.4. Echocardiography Measurements
2.5. Statistical Analysis
3. Results
4. Discussion
Limitations
5. Conclusions
Author Contributions
Funding
Institutional Review Board Statement
Informed Consent Statement
Data Availability Statement
Conflicts of Interest
References
- McDonagh, T.A.; Metra, M.; Adamo, M.; Gardner, R.S.; Baumbach, A.; Böhm, M.; Burri, H.; Butler, J.; Čelutkienė, J.; Chioncel, O. 2021 ESC Guidelines for the diagnosis and treatment of acute and chronic heart failure: Developed by the Task Force for the diagnosis and treatment of acute and chronic heart failure of the European Society of Cardiology (ESC) With the special contribution of the Heart Failure Association (HFA) of the ESC. Eur. Heart J. 2021, 42, 3599–3726. [Google Scholar] [CrossRef]
- Carluccio, E.; Biagioli, P.; Alunni, G.; Murrone, A.; Zuchi, C.; Coiro, S.; Riccini, C.; Mengoni, A.; D’Antonio, A.; Ambrosio, G. Prognostic value of right ventricular dysfunction in heart failure with reduced ejection fraction: Superiority of longitudinal strain over tricuspid annular plane systolic excursion. Circ. Cardiovasc. Imaging 2018, 11, e006894. [Google Scholar] [CrossRef] [PubMed]
- Dini, F.; Carluccio, E.; Simioniuc, A.; Biagioli, P.; Reboldi, G.; Galeotti, G.; Raineri, C.; Gargani, L.; Scelsi, L.; Mandoli, G. Network Labs Ultrasound (NEBULA) in Heart Failure Study Group. Right ventricular recovery during follow-up is associated with improved survival in patients with chronic heart failure with reduced ejection fraction. Eur. J. Heart Fail. 2016, 18, 1462–1471. [Google Scholar] [CrossRef] [PubMed]
- Görgülü, S.; Eren, M.; Yildirim, A.; Ozer, O.; Uslu, N.; Çelik, S.; Dağdeviren, B.; Nurkalem, Z.; Bağirtan, B.; Tezel, T. A new echocardiographic approach in assessing pulmonary vascular bed in patients with congenital heart disease: Pulmonary artery stiffness. Anatol. J. Cardiol. 2003, 3, 92–97. [Google Scholar]
- Yildirim, E.; Celik, M.; Yuksel, U.C.; Gungor, M.; Bugan, B.; Dogan, D.; Gokoglan, Y.; Kabul, H.K.; Gormel, S.; Yasar, S. Relationship between pulmonary artery stiffness and functional capacity in patients with heart failure with reduced ejection fraction. Korean Circ. J. 2017, 47, 929–938. [Google Scholar] [CrossRef] [PubMed]
- McMurray, J.J.; Solomon, S.D.; Inzucchi, S.E.; Køber, L.; Kosiborod, M.N.; Martinez, F.A.; Ponikowski, P.; Sabatine, M.S.; Anand, I.S.; Bělohlávek, J. Dapagliflozin in patients with heart failure and reduced ejection fraction. N. Engl. J. Med. 2019, 381, 1995–2008. [Google Scholar] [CrossRef]
- Packer, M.; Anker, S.D.; Butler, J.; Filippatos, G.; Pocock, S.J.; Carson, P.; Januzzi, J.; Verma, S.; Tsutsui, H.; Brueckmann, M. Cardiovascular and renal outcomes with empagliflozin in heart failure. N. Engl. J. Med. 2020, 383, 1413–1424. [Google Scholar] [CrossRef]
- Santos-Gallego, C.G.; Requena-Ibanez, J.A.; San Antonio, R.; Ishikawa, K.; Watanabe, S.; Picatoste, B.; Flores, E.; Garcia-Ropero, A.; Sanz, J.; Hajjar, R.J. Empagliflozin ameliorates adverse left ventricular remodeling in nondiabetic heart failure by enhancing myocardial energetics. J. Am. Coll. Cardiol. 2019, 73, 1931–1944. [Google Scholar] [CrossRef]
- Hülsmann, M.; Berger, R.; Sturm, B.; Bojic, A.; Woloszczuk, W.; Bergler-Klein, J.; Pacher, R. Prediction of outcome by neurohumoral activation, the six-minute walk test and the Minnesota Living with Heart Failure Questionnaire in an outpatient cohort with congestive heart failure. Eur. Heart J. 2002, 23, 886–891. [Google Scholar] [CrossRef]
- Lang, R.M.; Badano, L.P.; Mor-Avi, V.; Afilalo, J.; Armstrong, A.; Ernande, L.; Flachskampf, F.A.; Foster, E.; Goldstein, S.A.; Kuznetsova, T. Recommendations for cardiac chamber quantification by echocardiography in adults: An update from the American Society of Echocardiography and the European Association of Cardiovascular Imaging. Eur. Heart J. Cardiovasc. Imaging 2015, 16, 233–271. [Google Scholar] [CrossRef]
- Chemla, D.; Castelain, V.; Humbert, M.; Hébert, J.L.; Simonneau, G.; Lecarpentier, Y.; Hervé, P. New formula for predicting mean pulmonary artery pressure using systolic pulmonary artery pressure. Chest 2004, 126, 1313–1317. [Google Scholar] [CrossRef]
- Correale, M.; Mazzeo, P.; Magnesa, M.; Fortunato, M.; Tricarico, L.; Leopizzi, A.; Mallardi, A.; Mennella, R.; Tucci, S.; Brunetti, N.D. Predictors of right ventricular function improvement with sacubitril/valsartan in a real-life population of patients with chronic heart failure. Clin. Physiol. Funct. Imaging 2021, 41, 505–513. [Google Scholar] [CrossRef]
- Mercurio, V.; Palazzuoli, A.; Correale, M.; Lombardi, C.; Passantino, A.; Ravera, A.; Ruocco, G.; Sciatti, E.; Triggiani, M.; Lagioia, R. Right heart dysfunction: From pathophysiologic insights to therapeutic options: A translational overview. J. Cardiovasc. Med. 2018, 19, 613–623. [Google Scholar] [CrossRef]
- Duman, D.; Masatlioğlu, S.; Demirtunç, R.; Karadağ, B. Increased pulmonary artery stiffness and its relation to right ventricular function in patients with systemic lupus erythematosus. Arch. Turk. Soc. Cardiol. 2008, 36, 82–89. [Google Scholar]
- Rosenkranz, S.; Gibbs, J.S.R.; Wachter, R.; De Marco, T.; Vonk-Noordegraaf, A.; Vachiery, J.L. Left ventricular heart failure and pulmonary hypertension. Eur. Heart J. 2016, 37, 942–954. [Google Scholar] [CrossRef]
- Delgado, J.F.; Conde, E.; Sánchez, V.; López-Ríos, F.; Gómez-Sánchez, M.A.; Escribano, P.; Sotelo, T.; de la Cámara, A.G.; Cortina, J.; de la Calzada, C.S. Pulmonary vascular remodeling in pulmonary hypertension due to chronic heart failure. Eur. J. Heart Fail. 2005, 7, 1011–1016. [Google Scholar] [CrossRef]
- Tozzi, C.A.; Christiansen, D.L.; Poiani, G.J.; Riley, D.J. Excess collagen in hypertensive pulmonary arteries decreases vascular distensibility. Am. J. Respir. Crit. 1994, 149, 1317–1326. [Google Scholar] [CrossRef]
- Wang, Z.; Lakes, R.S.; Golob, M.; Eickhoff, J.C.; Chesler, N.C. Changes in large pulmonary arterial viscoelasticity in chronic pulmonary hypertension. PLoS ONE 2013, 8, e78569. [Google Scholar] [CrossRef]
- Wang, Z.; Lakes, R.S.; Eickhoff, J.C.; Chesler, N.C. Effects of collagen deposition on passive and active mechanical properties of large pulmonary arteries in hypoxic pulmonary hypertension. Biomech. Model Mechanobiol. 2013, 12, 1115–1125. [Google Scholar] [CrossRef]
- Stevens, G.R.; Garcia-Alvarez, A.; Sahni, S.; Garcia, M.J.; Fuster, V.; Sanz, J. RV dysfunction in pulmonary hypertension is independently related to pulmonary artery stiffness. JACC Cardiovasc. Imaging 2012, 5, 378–387. [Google Scholar] [CrossRef]
- Nemes, A.; Forster, T. Evaluation of pulmonary arterial stiffness using routine clinical imaging methods. Orv. Hetil. 2013, 154, 1931–1933. [Google Scholar] [CrossRef]
- Kang, K.W.; Chang, H.J.; Kim, Y.J.; Choi, B.W.; Lee, H.S.; Yang, W.I.; Shim, C.Y.; Ha, J.; Chung, N. Cardiac magnetic resonance imaging-derived pulmonary artery distensibility index correlates with pulmonary artery stiffness and predicts functional capacity in patients with pulmonary arterial hypertension. Circ. J. 2011, 75, 2244–2251. [Google Scholar] [CrossRef]
- Tong, X.; Poon, J.; Li, A.; Kit, C.; Yamada, A.; Shiino, K.; Ling, L.; Choe, Y.; Chan, J.; Lau, Y.K. Validation of cardiac magnetic resonance tissue tracking in the rapid assessment of RV function: A comparative study to echocardiography. Clin. Radiol. 2018, 73, 324.e9–324.e18. [Google Scholar] [CrossRef]
- Ozkececi, G.; Ulasli, S.S.; Akci, O.; Dural, İ.E.; Avsar, A.; Unlu, M.; Onrat, E. Assessment of pulmonary arterial stiffness in obstructive sleep apnea. Int. J. Card. Imaging 2016, 32, 799–805. [Google Scholar] [CrossRef]
- Cerik, I.B.; Meric, M.; Gulel, O.; Ozturk-Cerik, H.; Coksevim, M.; Soylu, K.; Deveci, A.; Sahin, M. Echocardiographic assessment of pulmonary arterial stiffness in human immunodeficiency virus-infected patients. Echocardiography 2019, 36, 1123–1131. [Google Scholar] [CrossRef]
- Yenerçağ, M.; Arslan, U.; Dereli, S.; Coksevim, M.; Doğduş, M.; Kaya, A. Effects of angiotensin receptor neprilysin inhibition on pulmonary arterial stiffness in heart failure with reduced ejection fraction. Int. J. Card. Imaging 2021, 37, 165–173. [Google Scholar] [CrossRef]
- Wiviott, S.D.; Raz, I.; Bonaca, M.P.; Mosenzon, O.; Kato, E.T.; Cahn, A.; Silverman, M.G.; Zelniker, T.A.; Kuder, J.F.; Murphy, S.A. Dapagliflozin and cardiovascular outcomes in type 2 diabetes. N. Engl. J. Med. 2019, 380, 347–357. [Google Scholar] [CrossRef]
- Zinman, B.; Wanner, C.; Lachin, J.M.; Fitchett, D.; Bluhmki, E.; Hantel, S.; Mattheus, M.; Devins, T.; Johansen, O.E.; Woerle, H.J. Empagliflozin, cardiovascular outcomes, and mortality in type 2 diabetes. N. Engl. J. Med. 2015, 373, 2117–2128. [Google Scholar] [CrossRef]
- Neal, B.; Perkovic, V.; Mahaffey, K.W.; De Zeeuw, D.; Fulcher, G.; Erondu, N.; Shaw, W.; Law, G.; Desai, M.; Matthews, D.R. Canagliflozin and cardiovascular and renal events in type 2 diabetes. N. Engl. J. Med. 2017, 377, 644–657. [Google Scholar] [CrossRef]
- Hayward, R.A.; Reaven, P.D.; Wiitala, W.L.; Bahn, G.D.; Reda, D.J.; Ge, L.; McCarren, M.; Duckworth, W.C.; Emanuele, N.V. Follow-up of glycemic control and cardiovascular outcomes in type 2 diabetes. N. Engl. J. Med. 2015, 372, 2197–2206. [Google Scholar] [CrossRef]
- Santos-Gallego, C.G.; Vargas-Delgado, A.P.; Requena-Ibanez, J.A.; Garcia-Ropero, A.; Mancini, D.; Pinney, S.; Macaluso, F.; Sartori, S.; Roque, M.; Sabatel-Perez, F. Randomized trial of empagliflozin in nondiabetic patients with heart failure and reduced ejection fraction. J. Am. Coll. Cardiol. 2021, 77, 243–255. [Google Scholar] [CrossRef]
- Chilton, R.; Tikkanen, I.; Cannon, C.; Crowe, S.; Woerle, H.; Broedl, U.; Johansen, O.E. Effects of empagliflozin on blood pressure and markers of arterial stiffness and vascular resistance in patients with type 2 diabetes. Diabetes Obes. Metab. 2015, 17, 1180–1193. [Google Scholar] [CrossRef] [PubMed]
- Filippatos, T.D.; Liontos, A.; Papakitsou, I.; Elisaf, M.S. SGLT2 inhibitors and cardioprotection: A matter of debate and multiple hypotheses. Postgrad. Med. 2019, 131, 82–88. [Google Scholar] [CrossRef]
- Lopaschuk, G.D.; Verma, S. Mechanisms of cardiovascular benefits of sodium glucose co-transporter 2 (SGLT2) inhibitors: A state-of-the-art review. JACC Basic Transl. Sci. 2020, 5, 632–644. [Google Scholar] [CrossRef] [PubMed]
- Verma, S.; McMurray, J.J. SGLT2 inhibitors and mechanisms of cardiovascular benefit: A state-of-the-art review. Diabetologia 2018, 61, 2108–2117. [Google Scholar] [CrossRef] [PubMed]
- Staels, B. Cardiovascular protection by sodium glucose cotransporter 2 inhibitors: Potential mechanisms. Am. J. Cardiol. 2017, 120, S28–S36. [Google Scholar] [CrossRef] [PubMed]
- Durante, W.; Behnammanesh, G.; Peyton, K.J. Effects of Sodium-Glucose Co-Transporter 2 Inhibitors on Vascular Cell Function and Arterial Remodeling. Int. J. Mol. Sci. 2021, 22, 8786. [Google Scholar] [CrossRef] [PubMed]
- Juni, R.P.; Kuster, D.W.; Goebel, M.; Helmes, M.; Musters, R.J.; van der Velden, J.; Koolwijk, P.; Paulus, W.J.; van Hinsbergh, V.W. Cardiac microvascular endothelial enhancement of cardiomyocyte function is impaired by inflammation and restored by empagliflozin. JACC Basic Transl. Sci. 2019, 4, 575–591. [Google Scholar] [CrossRef]
- Gaspari, T.; Spizzo, I.; Liu, H.; Hu, Y.; Simpson, R.W.; Widdop, R.E.; Dear, A.E. Dapagliflozin attenuates human vascular endothelial cell activation and induces vasorelaxation: A potential mechanism for inhibition of atherogenesis. Diab. Vasc. Dis. Res. 2018, 15, 64–73. [Google Scholar] [CrossRef]
- Mancini, S.J.; Boyd, D.; Katwan, O.J.; Strembitska, A.; Almabrouk, T.A.; Kennedy, S.; Palmer, T.M.; Salt, I.P. Canagliflozin inhibits interleukin-1β-stimulated cytokine and chemokine secretion in vascular endothelial cells by AMP-activated protein kinase-dependent and-independent mechanisms. Sci. Rep. 2018, 8, 5276. [Google Scholar] [CrossRef]
- Patel, A.R.; Kuvin, J.T.; Pandian, N.G.; Smith, J.J.; Udelson, J.E.; Mendelsohn, M.E.; Konstam, M.A.; Karas, R.H. Heart failure etiology affects peripheral vascular endothelial function after cardiac transplantation. J. Am. Coll. Cardiol. 2001, 37, 195–200. [Google Scholar] [CrossRef]
- Landolfo, M.; Piani, F.; Degli-Esposti, D.; Cosentino, E.; Bacchelli, S.; Dormi, A.; Borghi, C. Effects of sacubitril valsartan on clinical and echocardiographic parameters of outpatients with heart failure and reduced ejection fraction. IJC Heart Vasc. 2020, 31, 100656. [Google Scholar] [CrossRef]
- Correale, M.; Mallardi, A.; Mazzeo, P.; Tricarico, L.; Diella, C.; Romano, V.; Ferraretti, A.; Leopizzi, A.; Merolla, G.; Di Biase, M. Sacubitril/valsartan improves right ventricular function in a real-life population of patients with chronic heart failure: The Daunia Heart Failure Registry. IJC Heart Vasc. 2020, 27, 100486. [Google Scholar] [CrossRef]


| Parameters | Baseline (n = 168) | ||
|---|---|---|---|
| Age (years) | 62.7 ± 11.4 | ||
| Gender: female, n (%) | 38 (22.6%) | ||
| Ischemic heart failure, n (%) | 98 (58.3%) | ||
| Hypertension, n (%) | 107 (63.7%) | ||
| Diabetes mellitus, n (%) | 54 (32.1%) | ||
| Coronary artery disease, n (%) | 114 (67.8%) | ||
| Dyslipidemia n (%) | 84 (50%) | ||
| COPD n (%) | 38 (22.6%) | ||
| Atrial fibrillation | 37 (22%) | ||
| β-Blocker use, n (%) | 156 (92.8%) | ||
| ACE inhibitor use, n (%) | 87 (51.7%) | ||
| Sacubitril/valsartan use, n (%) | 71 (42.2%) | ||
| Spironolactone use, n (%) | 106 (63.1%) | ||
| Statin use, n (%) | 37 (22%) | ||
| Ivabradine use, n (%) | 59 (35.1%) | ||
| Diuretic use, n (%) | 156 (92.8%) | ||
| Digoxin use, n (%) | 28 (16.6%) | ||
| Baseline | Follow-Up | p-Value | |
| BMI (kg/m2) | 26.9 ± 4.2 | 26.7 ± 4.7 | 0.524 |
| Weight (kg) | 74.6 ± 13. | 75.1 ± 12. | 0.654 |
| SBP (mmHg) | 125.4 ± 22 | 124.8 ± 23 | 0.257 |
| DBP (mmHg) | 68.2 ± 11 | 66.9 ± 11 | 0.328 |
| Sodium (mmol/L) | 138.6 ± 4.56 | 138.5 ± 4.34 | 0.265 |
| Potassium (mmol/L) | 4.4 (3.2–5.8) | 4.5 (3.3–5.8) | 0.446 |
| Hematocrit (%) | 38.9 ± 4.5 | 39.1 ± 4.7 | 0.266 |
| eGFR (mL/min/1.73 m2) | 66.9 ± 14.4 | 67.6 ± 14.6 | 0.289 |
| Total cholesterol (mg/dL) | 162.16 ± 11.56 | 164.32 ± 12.16 | 0.346 |
| LDL (mg/dL) | 108 (52–140) | 109 (56–148) | 0.418 |
| CRP (mg/L) | 4.8 (2.5–12.1) | 4.9 (2.9–10.9) | 0.186 |
| HbA1c (%) | 6.9 ± 1.5 | 6.7 ± 1.5 | 0.322 |
| Albumin (g/dL) | 4.1 ± 0.5 | 4.9 ± 0.6 | 0.022 |
| NT-proBNP (pg/mL) | 2876 ± 401 | 1034 ± 361 | <0.001 |
| NYHA class | <0.001 | ||
| Class I, n (%) | 0 | 39 (23.2%) | |
| Class II, n (%) | 69 (41.1%) | 93 (55.4%) | |
| Class III, n (%) | 87 (51.8%) | 36 (21.4%) | |
| Class IV, n (%) | 12 (7.1%) | 0 | |
| MLWHFQ score | 32.4 ± 6.2 | 24.6 ± 4.4 | <0.001 |
| Heart rate (bpm) | 74.1 ± 4.8 | 73.8 ± 4.4 | 0.412 |
| QRS (ms) | 122.4 ± 8.9 | 124.1 ± 9.2 | 0.162 |
| Parameters | Baseline | Follow-Up | p-Value |
|---|---|---|---|
| LVEF (%) | 27.5 ± 4.7 | 29.2 ± 4.2 | <0.001 |
| LVEDd (mm) | 61 (58–63) | 58 (56–61) | 0.002 |
| LVESd (mm) | 48 ± 8.4 | 46 ± 8.6 | 0.008 |
| LVEDV (mL) | 157.5 ± 31.2 | 147.4 ± 29.8 | <0.001 |
| LVESV (mL) | 104.2 ± 24.8 | 94.8 ±23.1 | 0.001 |
| Mitral regurgitation, ≥Grade II, (%) | 72 (42.8) | 68 (40.4) | 0.128 |
| Tricuspid regurgitation, ≥Grade II, (%) | 129 (76.7) | 122 (72.6) | 0.283 |
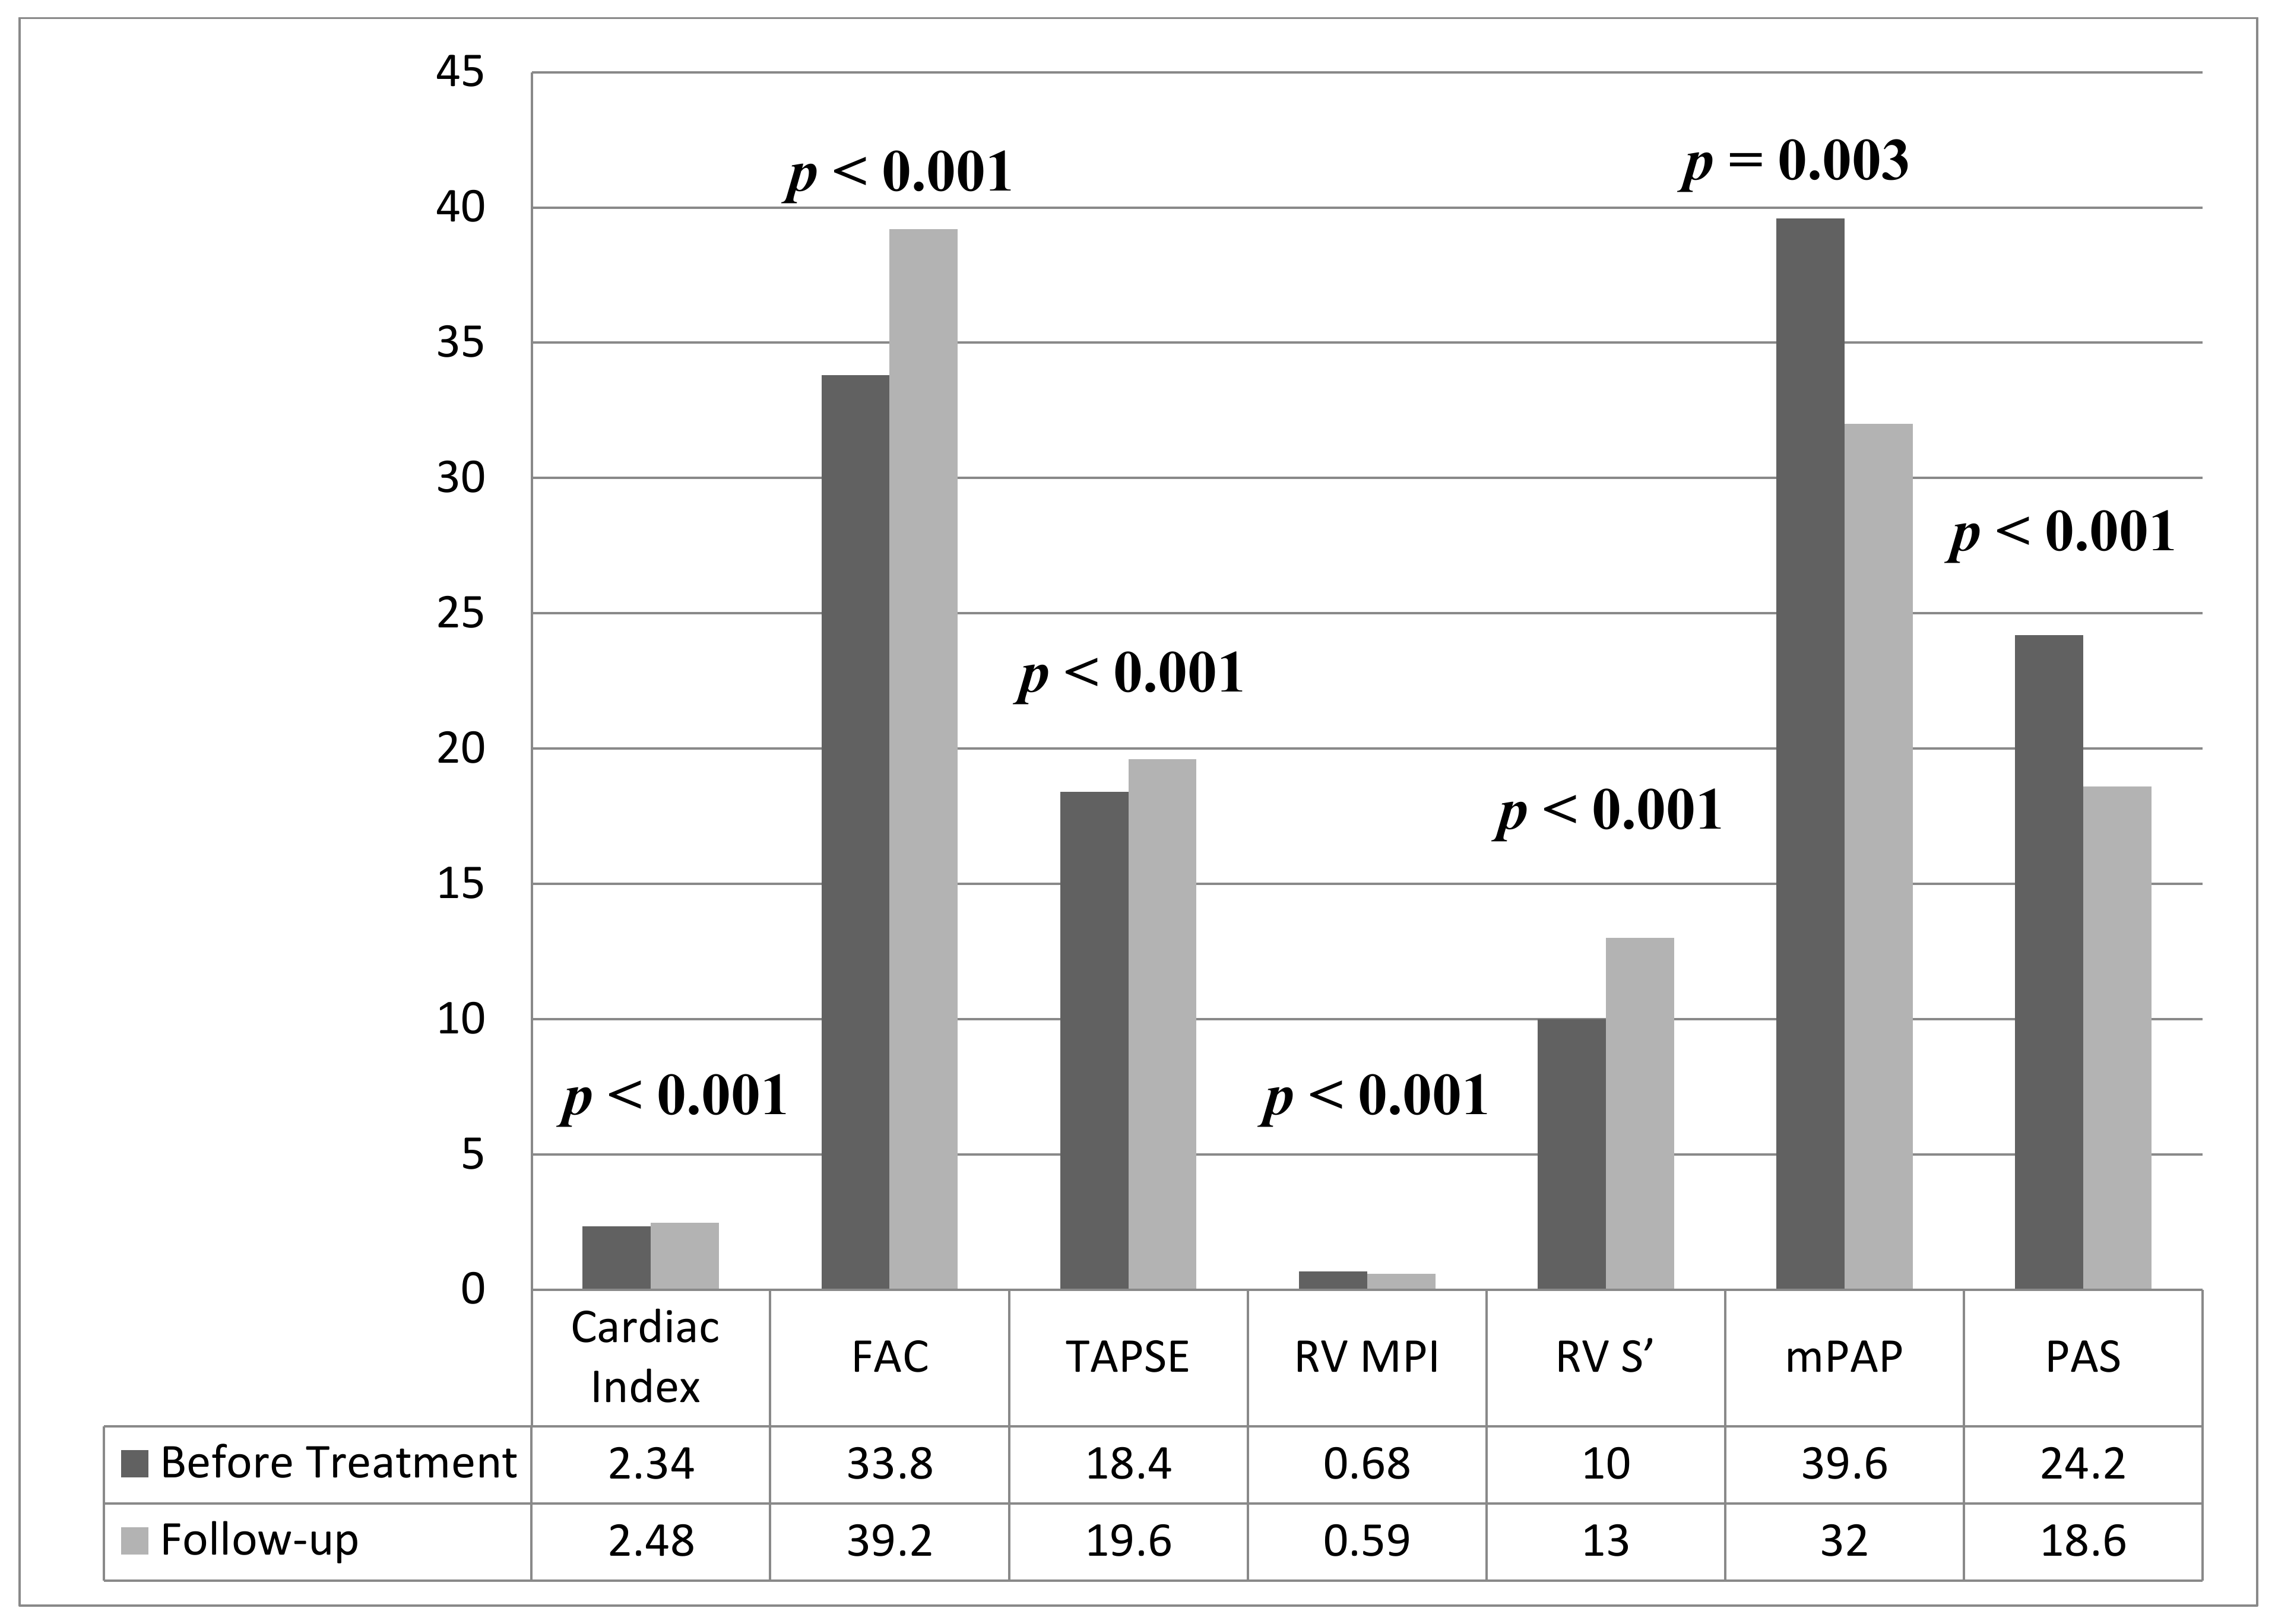
| Cardiac index (L/min/m2) | 2.34 ± 0.46 | 2.48 ± 0.42 | <0.001 |
| RV mid-diameter (mm) | 33 (31–36) | 34 (31–37) | 0.089 |
| RV basal-diameter (mm) | 30 (28–33) | 29 (26–31) | 0.009 |
| RV FAC, (%) | 33.8 ± 6.4 | 39.2 ± 7.3 | <0.001 |
| TAPSE (mm) | 18.4 ± 3.8 | 19.6 ± 3.6 | <0.001 |
| RV MPI | 0.68 ± 0.12 | 0.59 ± 0.11 | <0.001 |
| RV S’ (cm/s) | 10 (8–13) | 13 (10–16) | <0.001 |
| mPAP (mmHg) | 39.6 ± 7.8 | 32 ± 6.8 | 0.003 |
| PAS (kHz/ms) | 24.2 ± 4.6 | 18.6 ± 3.1 | <0.001 |
| MLWHFQ Score | NYHA Class | NT-proBNP | ||||
|---|---|---|---|---|---|---|
| r | p-Value | r | p-Value | r | p-Value | |
| LVEF | −0.268 | 0.002 | −0.284 | 0.001 | −0.306 | <0.001 |
| LVEDd | 0.122 | 0.238 | 0.101 | 0.252 | 0.224 | 0.024 |
| LVESd | 0.186 | 0.306 | 0.221 | 0.032 | 0.252 | 0.011 |
| LVEDV | 0.248 | 0.009 | 0.206 | 0.398 | 0.236 | 0.346 |
| LVESV | 0.212 | 0.502 | 0.258 | 0.009 | 0.269 | 0.007 |
| Cardiac index | −0.356 | <0.001 | −0.362 | <0.001 | −0.388 | <0.001 |
| RV mid-diameter | −0.101 | 0.682 | −0.096 | 0.861 | −0.142 | 0.509 |
| RV basal-diameter | 0.208 | 0.526 | 0.169 | 0.564 | 0.194 | 0.428 |
| RV FAC | −0.398 | <0.001 | −0.402 | <0.001 | −0.392 | <0.001 |
| TAPSE | −0.424 | <0.001 | −0.418 | <0.001 | −0.486 | <0.001 |
| RV MPI | 0.468 | <0.001 | 0.456 | <0.001 | 0.480 | <0.001 |
| RV S’ | −0.398 | <0.001 | −0.427 | <0.001 | −0.419 | <0.001 |
| mPAP | 0.242 | 0.082 | 0206 | 0.199 | 0.292 | 0.001 |
| PAS | 0.496 | <0.001 | 0.484 | <0.001 | 0.492 | <0.001 |
Publisher’s Note: MDPI stays neutral with regard to jurisdictional claims in published maps and institutional affiliations. |
© 2022 by the authors. Licensee MDPI, Basel, Switzerland. This article is an open access article distributed under the terms and conditions of the Creative Commons Attribution (CC BY) license (https://creativecommons.org/licenses/by/4.0/).
Share and Cite
Çamcı, S.; Yılmaz, E. Effects of Sodium-Glucose Co-Transporter-2 Inhibition on Pulmonary Arterial Stiffness and Right Ventricular Function in Heart Failure with Reduced Ejection Fraction. Medicina 2022, 58, 1128. https://doi.org/10.3390/medicina58081128
Çamcı S, Yılmaz E. Effects of Sodium-Glucose Co-Transporter-2 Inhibition on Pulmonary Arterial Stiffness and Right Ventricular Function in Heart Failure with Reduced Ejection Fraction. Medicina. 2022; 58(8):1128. https://doi.org/10.3390/medicina58081128
Chicago/Turabian StyleÇamcı, Sencer, and Emre Yılmaz. 2022. "Effects of Sodium-Glucose Co-Transporter-2 Inhibition on Pulmonary Arterial Stiffness and Right Ventricular Function in Heart Failure with Reduced Ejection Fraction" Medicina 58, no. 8: 1128. https://doi.org/10.3390/medicina58081128
APA StyleÇamcı, S., & Yılmaz, E. (2022). Effects of Sodium-Glucose Co-Transporter-2 Inhibition on Pulmonary Arterial Stiffness and Right Ventricular Function in Heart Failure with Reduced Ejection Fraction. Medicina, 58(8), 1128. https://doi.org/10.3390/medicina58081128