
Predictors of Epicardial Fat Volume Decrease after Dapagliflozin Treatment in Patients with Type 2 Diabetes

 , ,
, ,
Abstract
:1. Introduction
2. Materials and Methods
2.1. Study Design and Patients
2.2. Ethics Statement
2.3. Methods
2.4. Statistical Analysis
3. Results
4. Discussion
Limitations
5. Conclusions
Author Contributions
Funding
Institutional Review Board Statement
Informed Consent Statement
Acknowledgments
Conflicts of Interest
References
- Fedorov, A.; Beichel, R.; Kalpathy-Cramer, J.; Finet, J.; Fillion-Robin, J.-C.; Pujol, S.; Bauer, C.; Jennings, D.; Fennessy, F.; Sonka, M.; et al. 3D Slicer as an Image Computing Platform for the Quantitative Imaging Network. Magn. Reson. Imaging 2012, 30, 1323–1341. [Google Scholar] [CrossRef] [PubMed] [Green Version]
- Saeedi, P.; Petersohn, I.; Salpea, P.; Malanda, B.; Karuranga, S.; Unwin, N.; Colagiuri, S.; Guariguata, L.; Motala, A.A.; Ogurtsova, K.; et al. Global and regional diabetes prevalence estimates for 2019 and projections for 2030 and 2045: Results from the International Diabetes Federation Diabetes Atlas, 9. Diabetes Res. Clin. Pract. 2019, 157, 107843. [Google Scholar] [CrossRef] [PubMed] [Green Version]
- Low Wang, C.C.; Hess, C.N.; Hiatt, W.R.; Goldfine, A.B. Clinical Update: Cardiovascular Disease in Diabetes Mellitus: Atherosclerotic Cardiovascular Disease and Heart Failure in Type 2 Diabetes Mellitus—Mechanisms, Management, and Clinical Considerations. Circulation 2016, 133, 2459–2502. [Google Scholar] [CrossRef]
- Kannel, W.B.; Hjortland, M.; Castelli, W.P. Role of diabetes in congestive heart failure: The Framingham study. Am. J. Cardiol. 1974, 34, 29–34. [Google Scholar] [CrossRef]
- Kannel, W.B.; McGee, D.L. Diabetes and Cardiovascular Disease: The Framingham Study. JAMA 1979, 241, 2035–2038. [Google Scholar] [CrossRef]
- Boudina, S.; Abel, E.D. Diabetic cardiomyopathy, causes and effects. Rev. Endocr. Metab. Disord. 2010, 11, 31–39. [Google Scholar] [CrossRef] [PubMed] [Green Version]
- DeFronzo, R.A. Insulin resistance, lipotoxicity, type 2 diabetes and atherosclerosis: The missing links. The Claude Bernard Lecture 2009. Diabetologia 2010, 53, 1270–1287. [Google Scholar] [CrossRef] [Green Version]
- Neeland, I.J.; Ross, R.; Després, J.-P.; Matsuzawa, Y.; Yamashita, S.; Shai, I.; Seidell, J.; Magni, P.; Santos, R.D.; Arsenault, B.; et al. Visceral and ectopic fat, atherosclerosis, and cardiometabolic disease: A position statement. Lancet Diabetes Endocrinol. 2019, 7, 715–725. [Google Scholar] [CrossRef]
- Kim, S.H.; Després, J.-P.; Koh, K.K. Obesity and cardiovascular disease: Friend or foe? Eur. Heart J. 2016, 37, 3560–3568. [Google Scholar] [CrossRef] [Green Version]
- Tchkonia, T.; Thomou, T.; Zhu, Y.; Karagiannides, I.; Pothoulakis, C.; Jensen, M.D.; Kirkland, J.L. Mechanisms and Metabolic Implications of Regional Differences among Fat Depots. Cell Metab. 2013, 17, 644–656. [Google Scholar] [CrossRef] [Green Version]
- Packer, M. Critical role of the epicardium in mediating cardiac inflammation and fibrosis in patients with type 2 diabetes. Diabetes Obes. Metab. 2019, 21, 1765–1768. [Google Scholar] [CrossRef] [PubMed]
- Packer, M. Epicardial Adipose Tissue May Mediate Deleterious Effects of Obesity and Inflammation on the Myocardium. J. Am. Coll. Cardiol. 2018, 71, 2360–2372. [Google Scholar] [CrossRef]
- Noyes, A.M.; Dua, K.; Devadoss, R.; Chhabra, L. Cardiac adipose tissue and its relationship to diabetes mellitus and cardiovascular disease. World J. Diabetes 2014, 5, 868–876. [Google Scholar] [CrossRef]
- Li, Y.; Liu, B.; Jing, X.; Deng, S.; Yan, Y.; She, Q. Epicardial fat tissue in patients with diabetes mellitus: A systematic review and meta-analysis. Cardiovasc. Diabetol. 2019, 18, 3. [Google Scholar] [CrossRef] [Green Version]
- Christensen, R.H.; Von Scholten, B.J.; Hansen, C.S.; Heywood, S.E.; Rosenmeier, J.B.; Andersen, U.B.; Hovind, P.; Reinhard, H.; Parving, H.H.; Pedersen, B.K.; et al. Epicardial, pericardial and total cardiac fat and cardiovascular disease in type 2 diabetic patients with elevated urinary albumin excretion rate. Eur. J. Prev. Cardiol. 2017, 24, 1517–1524. [Google Scholar] [CrossRef]
- Christensen, R.H.; Hansen, C.S.; von Scholten, B.J.; Jensen, M.T.; Pedersen, B.K.; Schnohr, P.; Vilsbøll, T.; Rossing, P.; Jørgensen, P.G. Epicardial and pericardial adipose tissues are associated with reduced diastolic and systolic function in type 2 diabetes. Diabetes Obes. Metab. 2019, 21, 2006–2011. [Google Scholar] [CrossRef]
- Christensen, R.H.; von Scholten, B.J.; Hansen, C.S.; Jensen, M.T.; Vilsbøll, T.; Rossing, P.; Jørgensen, P.G. Epicardial adipose tissue predicts incident cardiovascular disease and mortality in patients with type 2 diabetes. Cardiovasc. Diabetol. 2019, 18, 114. [Google Scholar] [CrossRef] [Green Version]
- Association, A.D. 9. Pharmacologic Approaches to Glycemic Treatment. Diabetes Care 2019, 42 (Suppl. 1), S90–S102. [Google Scholar] [CrossRef] [PubMed] [Green Version]
- Braha, A.; Albai, A.; Timar, R.; Diaconu, L.; Vasiluță, L.; Cipu, D.; Timar, B.; Sima, A. Factors Associated with the Remission of Type 1 Diastolic Dysfunction after Dapagliflozin Treatment in Patients with Type 2 Diabetes. J. Clin. Med. 2020, 9, 3779. [Google Scholar] [CrossRef] [PubMed]
- da Silva, A.; Caldas, A.P.S.; Rocha, D.M.U.P.; Bressan, J. Triglyceride-glucose index predicts independently type 2 diabetes mellitus risk: A systematic review and meta-analysis of cohort studies. Prim. Care Diabetes 2020, 14, 584–593. [Google Scholar] [CrossRef] [PubMed]
- Braha, A.; Timar, B.; Diaconu, L.; Lupusoru, R.; Vasiluta, L.; Sima, A.; Vlad, A.; Munteanu, M.; Albai, A.; Cipu, D.; et al. Dynamics of Epicardiac Fat and Heart Function in Type 2 Diabetic Patients Initiated with SGLT-2 Inhibitors. Diabetes Metab. Syndr. Obes. 2019, 12, 2559–2566. [Google Scholar] [CrossRef] [PubMed] [Green Version]
- Xu, L.; Xu, Y.; Coulden, R.; Sonnex, E.; Hrybouski, S.; Paterson, I.; Butler, C. Comparison of epicardial adipose tissue radiodensity threshold between contrast and non-contrast enhanced computed tomography scans: A cohort study of derivation and validation. Atherosclerosis 2018, 275, 74–79. [Google Scholar] [CrossRef] [PubMed]
- Du Bois, D.; Du Bois, E.F. A formula to estimate the approximate surface area if height and weight be known. 1916. Nutrition 1989, 5, 303–311; discussion 312–313. [Google Scholar] [PubMed]
- Valdez, R. A simple model-based index of abdominal adiposity. J. Clin. Epidemiol. 1991, 44, 955–956. [Google Scholar] [CrossRef]
- Dobiásová, M.; Frohlich, J. The new atherogenic plasma index reflects the triglyceride and HDL-cholesterol ratio, the lipoprotein particle size and the cholesterol esterification rate: Changes during lipanor therapy. Vnitr. Lek. 2000, 46, 152–156. [Google Scholar] [PubMed]
- Millán, J.; Pintó, X.; Muñoz, A.; Zúñiga, M.; Rubiés-Prat, J.; Pallardo, L.F.; Masana, L.; Mangas, A.; Mijares, A.H.; González-Santos, P.; et al. Lipoprotein ratios: Physiological significance and clinical usefulness in cardiovascular prevention. Vasc. Health Risk Manag. 2009, 5, 757–765. [Google Scholar]
- Simental-Mendía, L.E.; Rodríguez-Morán, M.; Guerrero-Romero, F. The product of fasting glucose and triglycerides as surrogate for identifying insulin resistance in apparently healthy subjects. Metab. Syndr. Relat. Disord. 2008, 6, 299–304. [Google Scholar] [CrossRef]
- Amato, M.C.; Giordano, C.; Galia, M.; Criscimanna, A.; Vitabile, S.; Midiri, M.; Galluzzo, A. Visceral Adiposity Index: A reliable indicator of visceral fat function associated with cardiometabolic risk. Diabetes Care 2010, 33, 920–922. [Google Scholar] [CrossRef] [Green Version]
- Singh, M.; Pathak, M.S.; Paul, A. A Study on Atherogenic Indices of Pregnancy Induced Hypertension Patients as Compared to Normal Pregnant Women. J. Clin. Diagn. Res. 2015, 9, BC05–BC08. [Google Scholar] [CrossRef]
- Gaborit, B.; Ancel, P.; Abdullah, A.E.; Maurice, F.; Abdesselam, I.; Calen, A.; Soghomonian, A.; Houssays, M.; Varlet, I.; Eisinger, M.; et al. Effect of empagliflozin on ectopic fat stores and myocardial energetics in type 2 diabetes: The EMPACEF study. Cardiovasc. Diabetol. 2021, 20, 57. [Google Scholar] [CrossRef]
- Sasaki, T.; Sugawara, M.; Fukuda, M. Sodium-glucose co-transporter 2 inhibitor-induced changes in body composition and simultaneous changes in metabolic profile: 52-week prospective LIGHT (Luseogliflozin: The Components of Weight Loss in Japanese Patients with Type 2 Diabetes Mellitus) Study. J. Diabetes Investig. 2019, 10, 108–117. [Google Scholar] [CrossRef] [PubMed]
- Yagi, S.; Hirata, Y.; Ise, T.; Kusunose, K.; Yamada, H.; Fukuda, D.; Salim, H.M.; Maimaituxun, G.; Nishio, S.; Takagawa, Y.; et al. Canagliflozin reduces epicardial fat in patients with type 2 diabetes mellitus. Diabetol. Metab. Syndr. 2017, 9, 78. [Google Scholar] [CrossRef] [PubMed] [Green Version]
- Bouchi, R.; Terashima, M.; Sasahara, Y.; Asakawa, M.; Fukuda, T.; Takeuchi, T.; Nakano, Y.; Murakami, M.; Minami, I.; Izumiyama, H.; et al. Luseogliflozin reduces epicardial fat accumulation in patients with type 2 diabetes: A pilot study. Cardiovasc. Diabetol. 2017, 16, 32. [Google Scholar] [CrossRef] [PubMed] [Green Version]
- Fukuda, T.; Bouchi, R.; Terashima, M.; Sasahara, Y.; Asakawa, M.; Takeuchi, T.; Nakano, Y.; Murakami, M.; Minami, I.; Izumiyama, H.; et al. Ipragliflozin Reduces Epicardial Fat Accumulation in Non-Obese Type 2 Diabetic Patients with Visceral Obesity: A Pilot Study. Diabetes Ther. 2017, 8, 851–861. [Google Scholar] [CrossRef]
- Díaz-Rodríguez, E.; Agra, R.M.; Fernández, A.L.; Adrio, B.; García-Caballero, T.; Juanatey, J.R.G.; Eiras, S. Effects of dapagliflozin on human epicardial adipose tissue: Modulation of insulin resistance, inflammatory chemokine production, and differentiation ability. Cardiovasc. Res. 2018, 114, 336–346. [Google Scholar] [CrossRef] [Green Version]
- González-Muniesa, P.; Mártinez-González, M.A.; Hu, F.B.; Després, J.P.; Matsuzawa, Y.; Loos, R.J.F.; Moreno, L.A.; Bray, G.A.; Martinez, J.A. Obesity. Nat. Rev. Dis. Primers 2017, 3, 17034. [Google Scholar] [CrossRef]
- Hiuge-Shimizu, A.; Kishida, K.; Funahashi, T.; Ishizaka, Y.; Oka, R.; Okada, M.; Suzuki, S.; Takaya, N.; Nakagawa, T.; Fukui, T.; et al. Absolute value of visceral fat area measured on computed tomography scans and obesity-related cardiovascular risk factors in large-scale Japanese general population (the VACATION-J study). Ann. Med. 2012, 44, 82–92. [Google Scholar] [CrossRef]
- Lemieux, I.; Pascot, A.; Couillard, C.; Lamarche, B.; Tchernof, A.; Alméras, N.; Bergeron, J.; Gaudet, D.; Tremblay, G.; Prud’homme, D.; et al. Hypertriglyceridemic waist: A marker of the atherogenic metabolic triad (hyperinsulinemia; hyperapolipoprotein B; small, dense LDL) in men? Circulation 2000, 102, 179–184. [Google Scholar] [CrossRef] [Green Version]
- Lemieux, I.; Poirier, P.; Bergeron, J.; Alméras, N.; Lamarche, B.; Cantin, B.; Dagenais, G.R.; Després, J.P. Hypertriglyceridemic waist: A useful screening phenotype in preventive cardiology? Can. J. Cardiol. 2007, 23 (Suppl. B), 23b–31b. [Google Scholar] [CrossRef] [Green Version]
- Zhou, K.; Qin, Z.; Tian, J.; Cui, K.; Yan, Y.; Lyu, S. The Atherogenic Index of Plasma: A Powerful and Reliable Predictor for Coronary Artery Disease in Patients with Type 2 Diabetes. Angiology 2021, 72, 33197211012129. [Google Scholar] [CrossRef]
- Park, K.; Ahn, C.W.; Lee, S.B.; Kang, S.; Nam, J.S.; Lee, B.K.; Kim, J.H.; Park, J.S. Elevated TyG Index Predicts Progression of Coronary Artery Calcification. Diabetes Care 2019, 42, 1569–1573. [Google Scholar] [CrossRef] [PubMed]
- Wen, J.; Wang, A.; Liu, G.; Wang, M.; Zuo, Y.; Li, W.; Zhai, Q.; Mu, Y.; Gaisano, H.Y.; He, Y.; et al. Elevated triglyceride-glucose (TyG) index predicts incidence of Prediabetes: A prospective cohort study in China. Lipids Health Dis. 2020, 19, 226. [Google Scholar] [CrossRef] [PubMed]

| Parameter | Baseline Values | Changes after 6 Months | Δ* | p-Value |
|---|---|---|---|---|
| Weight (kg) | 99.15 ± 16.07 | 94.13 ± 14.81 | −5 | <0.001 * |
| BMI (kg/m2) | 34.55 ± 4.79 | 32.85 ± 4.76 | −1.7 | <0.001 * |
| Waist (cm) | ||||
| Men | 115.03 ± 12.30 | 112.93 ± 11.71 | −2.1 | 0.02 * |
| Women | 115.05 ± 10.03 | 114.75 ± 11.23 | - | 0.92 |
| TC (mg/dL) | 192.58 ± 61.68 | 184.43 ± 46.45 | - | 0.45 |
| TG (mg/dL) | 171 (55; 887) | 143 (58; 1397) | - | 0.29 |
| HDLc (mg/dL) | ||||
| Men | 38 (17; 89) | 42 (19; 90) | +4 | 0.01 * |
| Women | 39.90 ± 12.14 | 45.15 ± 12.82 | - | 0.19 |
| LDLc (mg/dL) | 107 (50; 262) | 96 (33; 202) | - | 0.18 |
| Uric acid (mg/dL) | 5.16 ± 1.28 | 4.72 ± 1.11 | - | 0.07 |
| Glycemia (mg/dL) | 197 (93; 438) | 155 (74; 294) | −42 | <0.001 * |
| HbA1c (%) | 8.66 ± 1.18 | 7.86 ± 1.26 | −0.8 | 0.001 * |
| EFV (cm3) | 37.80 ± 17.22 | 20.73 ± 7.09 | −17.1 | <0.001 * |
| L4VFV (cm3) | 39.18 ± 29.17 | 43.27 ± 18.43 | - | 0.39 |
| AIP | 0.28 ± 0.33 | 0.20 ± 0.34 | −0.08 | 0.04 * |
| CRR | 4.77 (2.27; 13.08) | 3.89 (2.03; 11.47) | −0.9 | 0.04 * |
| AC | 3.77 (1.27; 12.08) | 2.89 (1.03; 10.47) | −0.9 | 0.04 * |
| TyG index | 5.24 ± 0.39 | 5.03 ± 0.37 | −0.2 | 0.01 * |
| VAI | ||||
| Women | 3.32 (1.27; 14.69) | 3.15 (1.14; 29.34) | - | 0.44 |
| Men | 2.81 (0.96; 22.58) | 2.21 (0.47; 43.90) | - | 0.20 |
| Conicity index | 1.38 ± 0.08 | 1.40 ± 0.07 | +0.1 | 0.03 * |
| CAP (Db/m) | 361 (240; 400) | 310 (190; 400) | −51 | <0. 001 * |
| Fibroscan (kPa) | 6.95 (3.50; 43.80) | 6.40 (3.30; 15.30) | - | 0.09 |
| Variable | Correlation Coefficient, Significance Level | AIP | CRR | TyG | VAI Women | VAI Men |
|---|---|---|---|---|---|---|
| Weight (kg) | r | −0.03 | −0.01 | −0.03 | 0.04 | −0.10 |
| p | 0.80 | 0.9 | 0.79 | 0.85 | 0.56 | |
| Waist (cm) | r | −0.08 | 0.75 | −0.07 | 0.09 | −0.02 |
| p | 0.55 | <0.001 * | 0.62 | 0.68 | 0.88 | |
| BMI (kg/m2) | r | −0.12 | −0.04 | −0.11 | 0.02 | −0.01 |
| p | 0.40 | 0.76 | 0.42 | 0.92 | 0.94 | |
| Age (years) | r | −0.08 | −0.24 | −0.01 | −0.23 | 0.10 |
| p | 0.57 | 0.08 | 0.91 | 0.32 | 0.58 | |
| Diabetes duration (years) | r | −0.04 | −0.21 | −0.06 | −0.28 | 0.07 |
| p | 0.76 | 0.12 | 0.66 | 0.22 | 0.68 | |
| TC (mg/dL) | r | 0.35 | 0.66 | 0.49 | 0.28 | 0.28 |
| p | 0.01 * | <0.001 * | <0.001 * | 0.22 | 0.11 | |
| TG (mg/dL) | ρ | 0.90 | 0.58 | 0.92 | 0.93 | 0.89 |
| p | <0.001 * | <0.001 * | <0.001 * | <0.001 * | <0.001 * | |
| HDLc (mg/dL) | ρ | −0.63 | −0.61 | −0.24 | −0.70 | −0.54 |
| p | <0.001 * | <0.001 * | 0.08 | <0.001 * | 0.001 * | |
| LDLc (mg/dL) | ρ | 0.13 | 0.59 | 0.21 | 0.27 | −0.07 |
| p | 0.35 | <0.001 * | 0.13 | 0.24 | 0.67 | |
| Glycemia (mg/dL) | ρ | 0.33 | 0.19 | 0.62 | 0.20 | 0.31 |
| p | 0.01 * | 0.16 | <0.001 * | 0.40 | 0.08 | |
| HbA1c (%) | r | 0.41 | 0.31 | 0.45 | 0.37 | 0.33 |
| p | 0.003 * | 0.02 * | <0.001 * | 0.10 | 0.06 | |
| Uric acid (mg/dL) | r | −0.08 | −0.25 | −0.05 | −0.19 | −0.16 |
| p | 0.56 | 0.09 | 0.71 | 0.45 | 0.38 | |
| EFV decrease (%) | r | 0.28 | 0.28 | 0.32 | 0.32 | 0.16 |
| p | 0.04 * | 0.04 * | 0.01 * | 0.16 | 0.38 | |
| EFV (cm3) | r | 0.08 | 0.11 | 0.10 | 0.14 | −0.12 |
| p | 0.57 | 0.43 | 0.45 | 0.55 | 0.50 | |
| L4VFV (cm3) | r | 0.10 | 0.58 | 0.15 | −0.05 | 0.19 |
| p | 0.48 | <0.001 * | 0.28 | 0.82 | 0.29 | |
| L4VFV decrease (%) | ρ | −0.03 | −0.04 | −0.06 | −0.24 | 0.06 |
| p | 0.81 | 0.77 | 0.65 | 0.29 | 0.73 | |
| CAP (dB/m) | ρ | 0.21 | 0.09 | 0.24 | 0.33 | 0.14 |
| p | 0.13 | 0.53 | 0.09 | 0.16 | 0.46 | |
| Fibroscan (kPa) | ρ | 0.07 | 0.14 | 0.16 | 0.30 | −0.04 |
| p | 0.62 | 0.34 | 0.29 | 0.21 | 0.81 |
| Coefficients for EFV Decrease (%). | |||||
|---|---|---|---|---|---|
| Baseline Independent Variables | Unstandardized Coefficients | Standardized Coefficients | t | p | |
| B | Std. Error | Beta | |||
| Age | −0.27 | 0.45 | −0.09 | −0.61 | 0.54 |
| Diabetes duration | 0.08 | 0.88 | 0.01 | 0.09 | 0.93 |
| Weight | −0.07 | 0.29 | −0.04 | −0.26 | 0.79 |
| BMI | −0.29 | 0.97 | −0.04 | −0.30 | 0.76 |
| Waist | −0.58 | 0.40 | −0.20 | −1.45 | 0.15 |
| TC | 0.10 | 0.08 | 0.19 | 1.35 | 0.18 |
| TG | 0.04 | 0.03 | 0.22 | 1.55 | 0.12 |
| HDLc | 0.41 | 0.38 | −0.15 | −1.07 | 0.28 |
| LDLc | 0.14 | 0.10 | 0.20 | 1.40 | 0.16 |
| Uric acid | −5.90 | 4 | −0.22 | −1.47 | 0.14 |
| CRR | 4.35 | 2.13 | 0.28 | 2.04 | 0.04 * |
| AIP | 28.54 | 13.78 | 0.29 | 2.07 | 0.04 * |
| Conicity index | −119.26 | 55.2 | −0.29 | −2.16 | 0.03 * |
| TyG index | 27.38 | 11.35 | 0.33 | 2.41 | 0.02 * |
| VAI | |||||
| Women | 0.89 | 1.95 | 0.11 | 0.46 | 0.65 |
| Men | 1.70 | 1.32 | 0.23 | 1.29 | 0.20 |
| Glycemia | 0.10 | 0.07 | 0.22 | 1.59 | 0.11 |
| HbA1c | 3.96 | 3.86 | 0.14 | 1.03 | 0.31 |
| EFV | 1.38 | 0.18 | 0.73 | 7.50 | <0.001 * |
| L4VFV | −0.36 | 0.15 | −0.32 | −2.38 | 0.02 * |
| L4VFV decrease (%) | −0.04 | 0.02 | −0.31 | −2.31 | 0.02 * |
| Left atrium volume | −0.97 | 0.32 | −0.40 | −3.08 | 0.003 * |
| Right ventricle diameter | −48.72 | 22.90 | −0.33 | −2.13 | 0.04 * |
| CAP | 0.05 | 0.10 | 0.07 | 0.48 | 0.63 |
| Fibroscan | 0.04 | 0.70 | 0.01 | 0.05 | 0.95 |
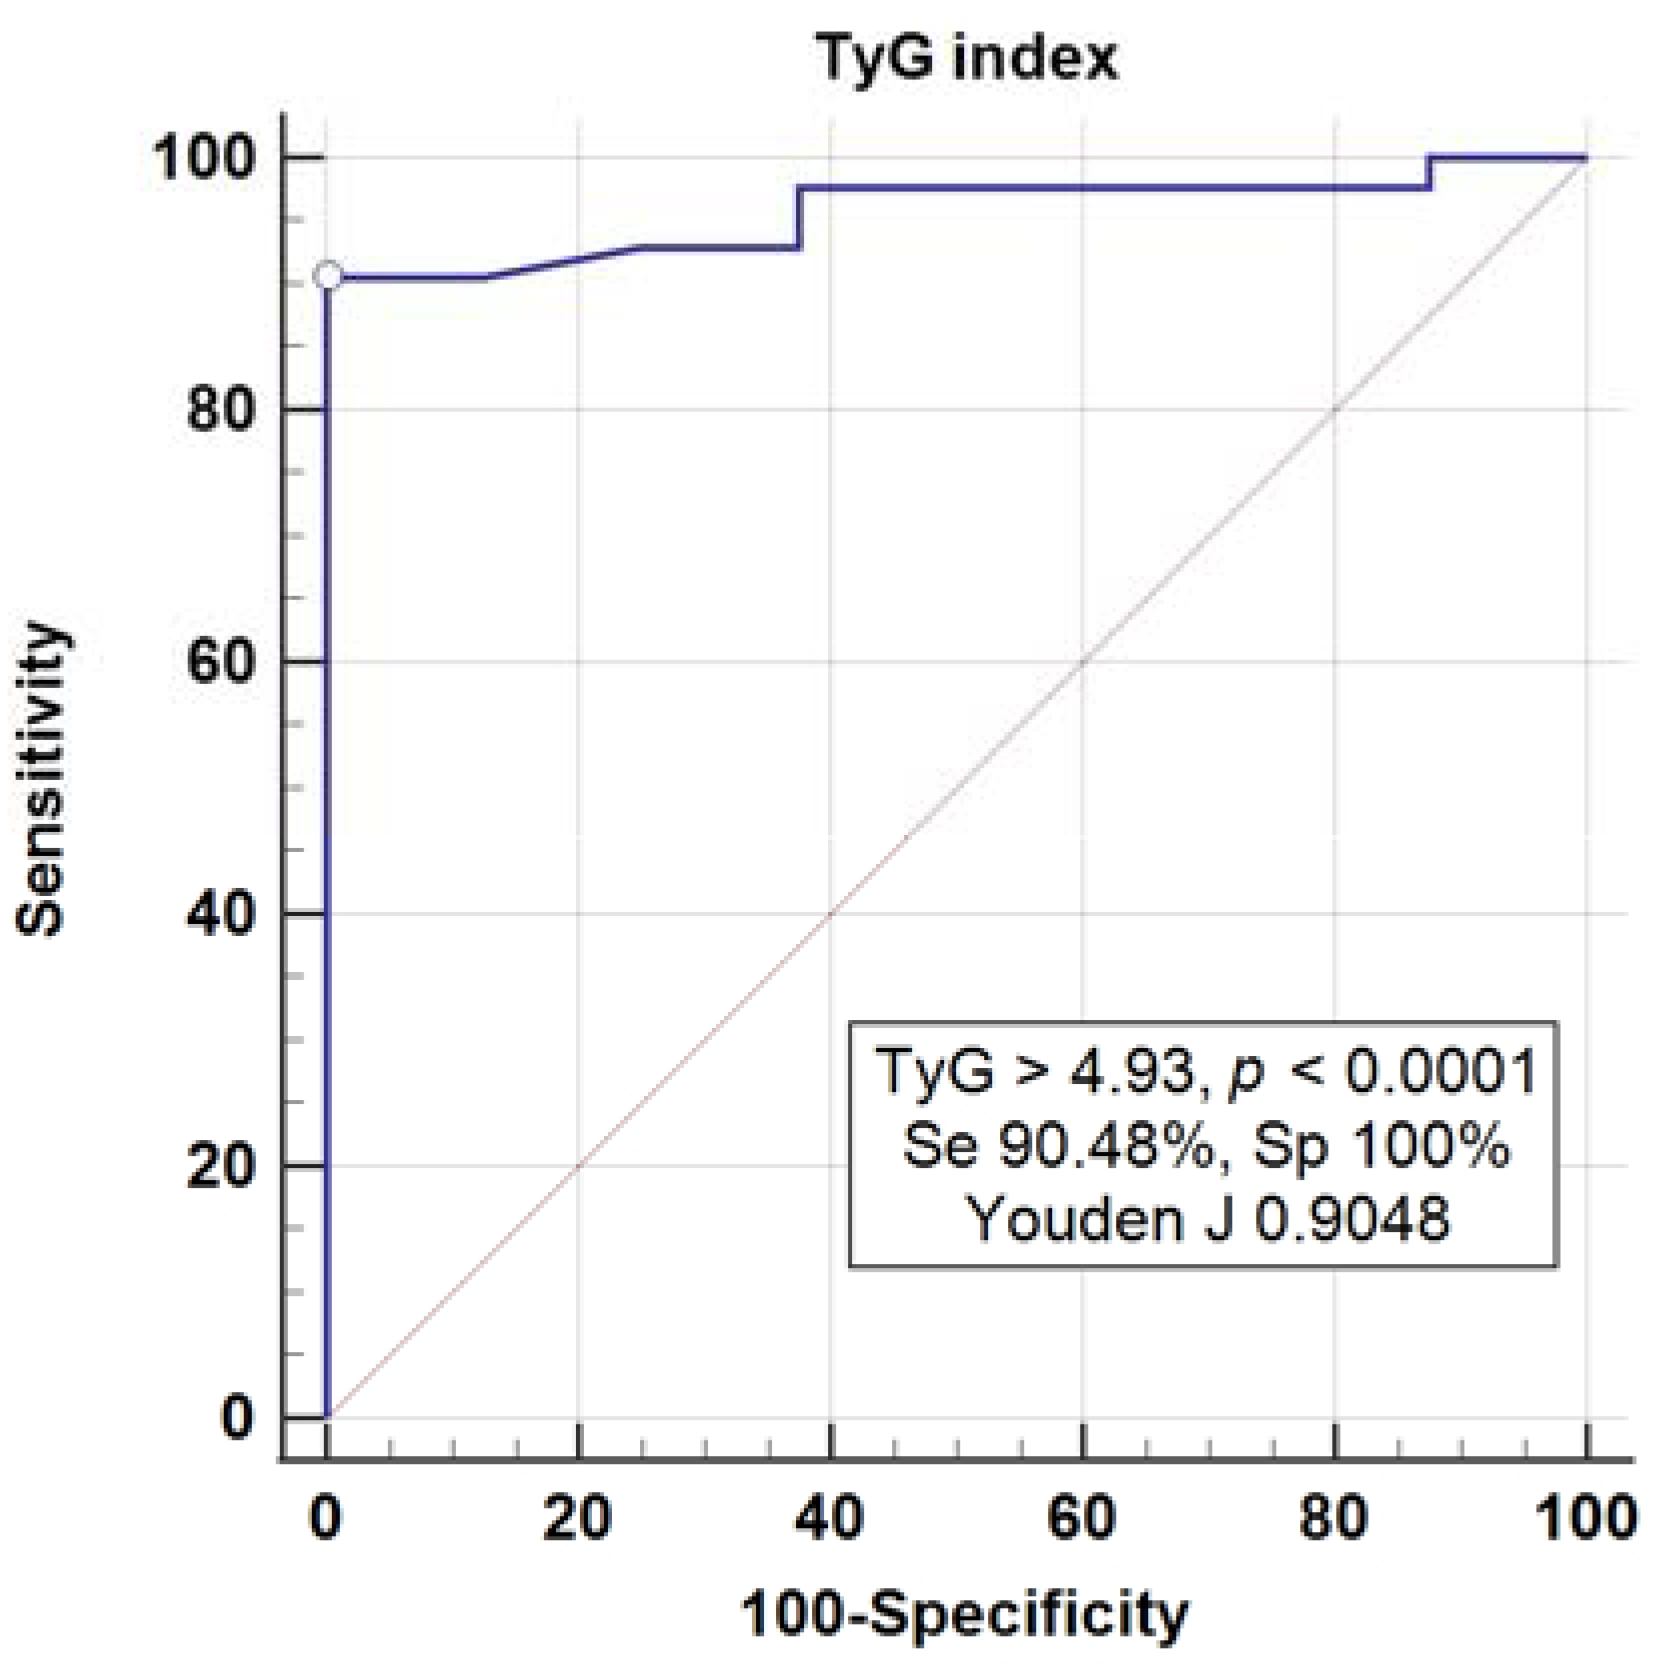
| Characteristics | AIP | CRR | TyG Index | VAI |
|---|---|---|---|---|
| Area under ROC | 0.903 | 0.772 | 0.957 | 0.898 |
| p value | <0.001 | 0.004 | <0.001 | <0.001 |
| Youden index J | 0.732 | 0.595 | 0.904 | 0.712 |
| Associated criterion | >0.02 | >4.03 | >4.93 | >1.98 |
| Sensitivity | 85.71% | 72.09% | 90.48% | 83.72% |
| Specificity | 87.50% | 87.50% | 100% | 87.50% |
Publisher’s Note: MDPI stays neutral with regard to jurisdictional claims in published maps and institutional affiliations. |
© 2021 by the authors. Licensee MDPI, Basel, Switzerland. This article is an open access article distributed under the terms and conditions of the Creative Commons Attribution (CC BY) license (https://creativecommons.org/licenses/by/4.0/).
Share and Cite
Braha, A.; Albai, A.; Timar, B.; Cipu, D.; Vasiluță, L.; Potre, O.; Timar, R. Predictors of Epicardial Fat Volume Decrease after Dapagliflozin Treatment in Patients with Type 2 Diabetes. Medicina 2022, 58, 21. https://doi.org/10.3390/medicina58010021
Braha A, Albai A, Timar B, Cipu D, Vasiluță L, Potre O, Timar R. Predictors of Epicardial Fat Volume Decrease after Dapagliflozin Treatment in Patients with Type 2 Diabetes. Medicina. 2022; 58(1):21. https://doi.org/10.3390/medicina58010021
Chicago/Turabian StyleBraha, Adina, Alin Albai, Bogdan Timar, Daniela Cipu, Lucian Vasiluță, Ovidiu Potre, and Romulus Timar. 2022. "Predictors of Epicardial Fat Volume Decrease after Dapagliflozin Treatment in Patients with Type 2 Diabetes" Medicina 58, no. 1: 21. https://doi.org/10.3390/medicina58010021
APA StyleBraha, A., Albai, A., Timar, B., Cipu, D., Vasiluță, L., Potre, O., & Timar, R. (2022). Predictors of Epicardial Fat Volume Decrease after Dapagliflozin Treatment in Patients with Type 2 Diabetes. Medicina, 58(1), 21. https://doi.org/10.3390/medicina58010021