1. Introduction
Urinary E3G (estrone-3-glucuronide) and PDG (pregnanediol-3-glucuronide) levels to assess the time of cycle are now available for fertility assessment methods (FAMs) and natural family planning (NFP) [
1,
2,
3,
4,
5,
6,
7,
8,
9,
10]. The devices for home measurement of E3G [
4,
5,
8,
9,
10] until recently provided only qualitative results to indicate fertility. Two newly marketed devices, the Mira
TM and Inito
TM, now show the actual E3G, PDG, and luteinizing hormone (LH) levels [
9,
10]. The algorithms to identify the fertile phase using E3G, PDG, and LH are proprietary and remain unpublished, although it is probable that thresholds, magnitudes of increase, and hormonal averages over several cycles for a specific patient are utilized in the devices. In general, these home meters are not programmed to avoid pregnancy for FAMs/NFP, and with this application they have a relatively high failure rate [
4,
5].
Urinary PDG test strips are now available with thresholds of 5 μg/mL and 7 μg/mL [
6,
7]. The concept of PDG threshold to signal the luteal phase and the safe days for FAMs/NFP is straight-forward, but with the 5 μg/mL and 7 μg/mL strips, Bouchard et al. [
6] reported only 82.4% and 59% of the cycles had a positive PDG test, respectively. When using at least one positive PDG result following a urine LH positive or peak mucus sign, the average number of safe luteal days was 8.8 days [
7]. The combined use of E3G and PDG with a home monitor to avoid pregnancy by NFP/FAMs is still in development.
We hypothesized that an algorithm using both E3G and PDG levels—a ratio which avoids variability due to urinary concentrations at home/point-of-care testing—could be more sensitive and specific in signaling time of cycle. We initially aimed for an algorithm that did not depend on a threshold, but rather a rate of change function. Furthermore, available for this development was a large data set of day-specific E3G and PDG levels from 25 women, 78 cycles. We found a computation using as variables the area under the curve for E3G and PDG, E3G-AUC and PDG-AUC, respectively, as the cycle progresses reliably signaled the transition to the luteal phase. Furthermore, we show this algorithm could be used as an indicator for the start of the luteal safe days for NFP.
2. Materials and Methods
2.1. Urinary LH, E3G, and PDG Day-Specific Levels
Day-specific levels of urinary LH, E3G, and PDG throughout 78 ovulatory cycles from 25 women were from a secondary analysis of data from a multicentre World Health Organization (WHO) sponsored study (HRP#87904, approved locally, 21 September 1998). Alliende et al. [
11], used in-house non-competitive radioimmunoassays (reagents and assay protocols supplied by Matched Reagents Programme of the WHO) to measure urinary LH, E3G, and PDG. Day 0, the day of putative ovulation, was indexed to the day after the urinary LH rise adjusted for excretion rate (i.e., urine time interval and volume). The E3G and PDG data used herein were not adjusted for excretion rate.
2.2. Area under the Curve Computations for Day-Specific E3G and PDG Levels
For any given day, D, of the cycle, the area under the curves for E3G and PDG were computed using Microsoft Excel or GraphPad Prism version 9.2 for Windows, GraphPad software, San Diego, CA, USA (
www.graphpad.com accessed on 2 January 2022), which give identical results. E3G-AUC, PDG-AUC, and the corresponding Delta values (see below) are dependent on the initial day (i.e., start day) for the computation.
2.3. Computations of the Delta Values: Delta5, Delta6, Delta7
The ratio, E3G-AUC/PDG-AUC, is computed for day, D-1, of the cycle, and similarly calculated for the subsequent day, D. The Delta value for day, D, is then the difference:
For Delta value computations, Delta5 (‘D5’), AUC calculations begin on Day 6 of the cycle, for Delta6 (‘D6’) on Day 7, and for Delta7 (‘D7’) on Day 8. That is, urinary E3G and PDG levels are used starting on calendar Day 6, Day 7, and Day 8 for D5, D6, and D7, respectively. The Delta5 nomenclature was assigned since the first five days of urinary hormone levels were not used in the D5 computation, and in a similar fashion for D6 and D7. Therefore, the first D5 value was recorded on calendar Day 7 since it is a difference of the E3G-AUC/PDG-AUC ratio between Day D and Day D-1, and similarly the first D6 and D7 values were recorded on calendar Days 8 and 9, respectively. In this manner, day-specific D5, D6, and D7 values were generated.
2.4. The D5D6D7 Convolution
D5, D6, and D7 values were determined for all the cycles. The signs of these Delta values were considered together—a convolution called D5D6D7—which served as an improved indicator for time of cycle. The D5D6D7 value is a sign determination: a sign of positive (denoted as ‘0’) is assigned on a cycle day, if any of the D5, D6, D7 values are positive and a sign of negative (denoted as ‘1’) only if D5, D6, and D7 values are all negative. Consequently, for every day of the cycle D5D6D7 is mapped to a ‘0’ or ‘1’ starting on calendar Day 9, which was the first day of combined D5, D6, and D7 values.
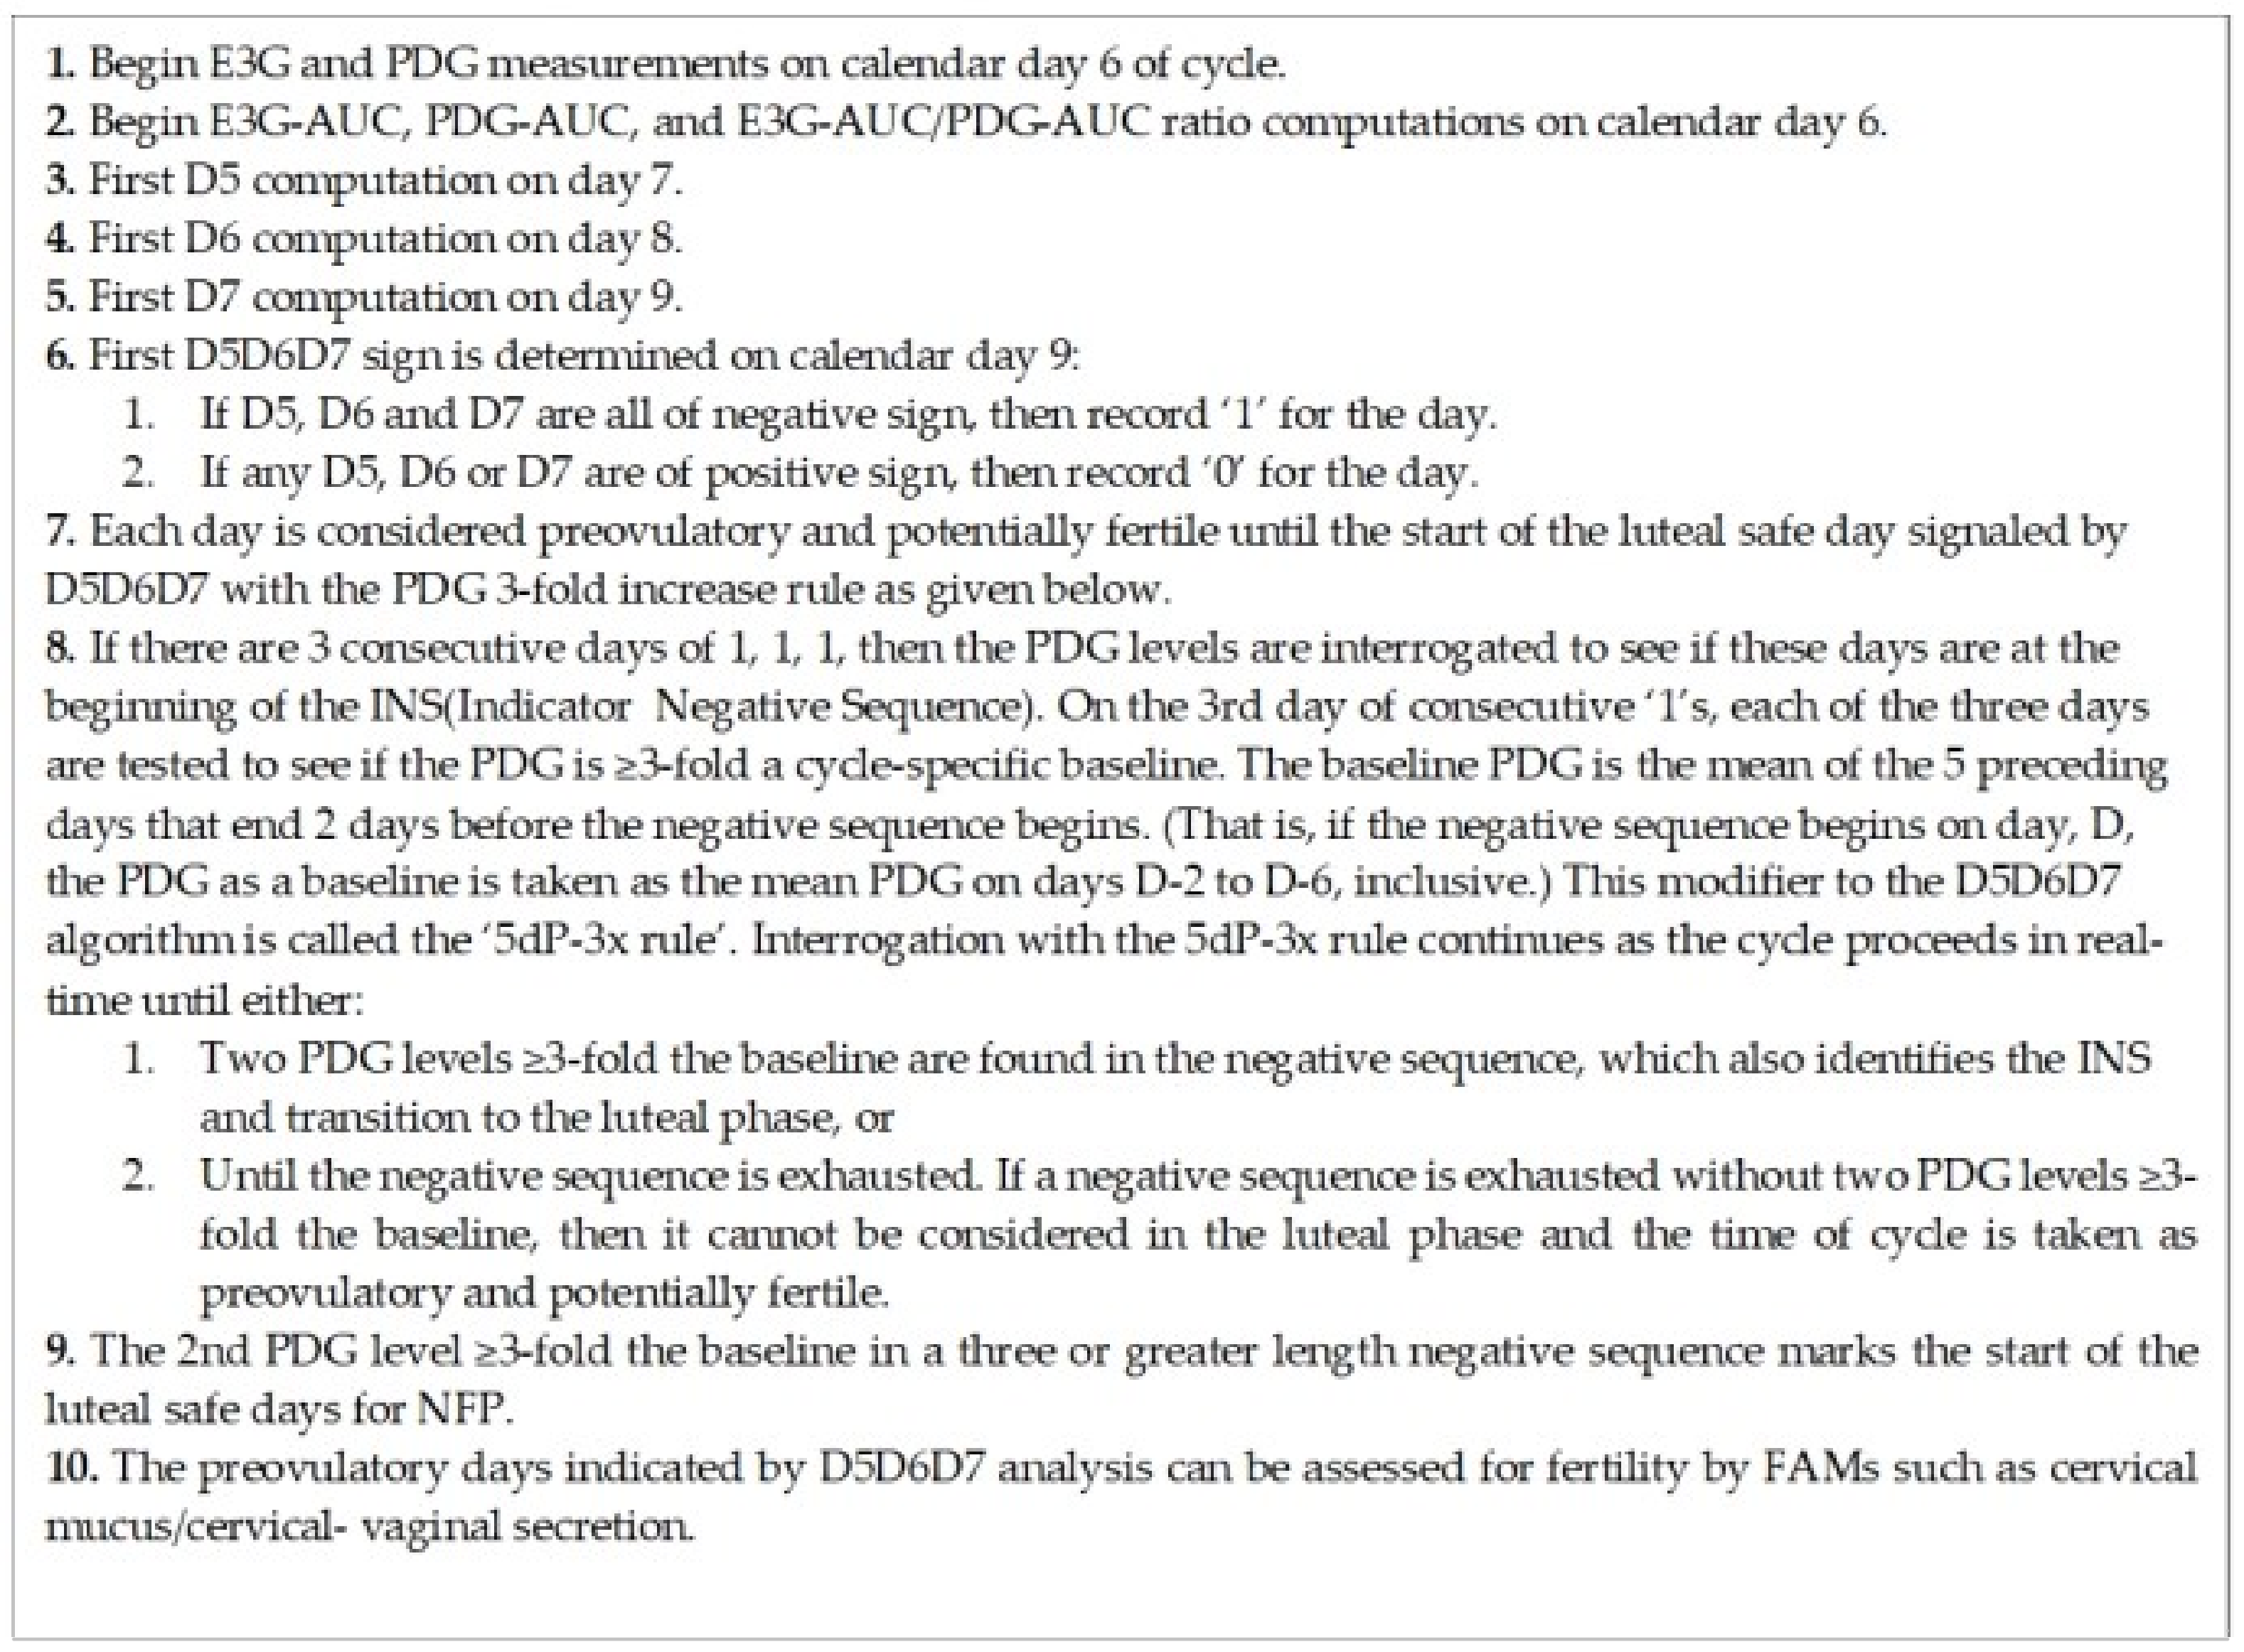
2.5. The D5D6D7 Convolution with PDG Modifier to Signal the Start of the Luteal Phase Safe Days
To improve specificity in identification of the luteal transition and practicality of the algorithm for marking the start of the luteal safe days, a cycle-specific PDG increase from baseline was derived and added to the D5D6D7 analysis. The PDG modifier was only applied in a sequence of negative D5D6D7 values (‘1’s) of three or greater length. The PDG modifier—called the ‘5dP-3x’ rule—is applied starting on the third day of any sequence of ‘1’s for D5D6D7 values. For any negative D5D6D7 sequence starting on Day D, and progressing D + 1, D + 2, etc., a cycle-specific baseline is calculated as the mean PDG for the five days ending two days before the start of the negative sequence. In other words: if Day D, is the start of the negative sequence, then the mean PDG is computed for days D-2 to D-6, inclusive. A positive PDG modifier signal occurs if a PDG level is 3-fold or above this baseline on any days D, D + 1, D + 2, etc., of the negative sequence. This interrogation begins with the 3rd day of any negative D5D6D7 sequence (sequence of ‘1’s) and continues as the cycle progresses in real-time until two positive PDG modifier signals occur. The start of the safe luteal days is set for the day of the 2nd positive PDG modifier signal. The PDG modifier interrogation of a negative sequence continues until the sequence turns positive (a ‘1’ to a ‘0’) or until the 2nd positive PDG modifier.
2.6. Statistical Evaluation of the Algorithms
In the
p-value calculations that assess the probability of a particular event (say, Event A) occurring by chance alone (the null hypothesis), our reference model for the null in any given cycle is a random binary sequence with equal probabilities of success or failure (a coin toss, or equally weighted independent Bernoulli trials). The window of opportunity for Event A to happen is always taken to be the time span of Day −2 to Day +10 (the common time period for all cycles). If Event A happens in n out of N cycles, then the overall probability constituting the final
p-value, is simply modeled as a binomial random variable [
12].
3. Results
3.1. The Delta Function Signals the Transition to the Luteal Phase by an Indicator Negative Sequence
A novel method was discovered that marked the periovulatory transition interval. This was developed from day-specific urinary E3G and PDG levels from 25 women, 78 cycles with a range of cycle lengths, 23 to 35 days (mean 28.5 ± 2.5 (SD)), and a mean calendar day for ovulation of 15.5 ± 2.4 (SD). The E3G and PDG data, as E3G-AUC/PDG-AUC ratios, were used to compute the day-specific D5, D6, D7 values. In all 78 cycles, an extended, uninterrupted sequence of negative D5, D6, and D7 values—nine or greater in length—began in the ovulatory to luteal transition interval (
Supplementary Data, Table S1). This extended negative sequence of Delta values, called the indicator negative sequence (INS) identified the luteal phase in all 78 cycles. An example of the INS for D5, D6, and D7, is shown in
Table 1 for cycle 20.1.
3.2. Convolution of Delta5, Delta6, and Delta7- ‘D5D6D7’—As an Improved Indicator of the Transition to the Luteal Phase
The D5, D6, and D7 values always underwent an extended sequence of nine negative values or more to mark the luteal phase. However, negative sequences of lesser length occurred in the preovulatory phase in some of the cycles which would confound early identification of the start of the safe days (see
Supplementary Data, Table S1 and
Table 1). Therefore, a further methodology was sought with the Delta function to reduce the occurrence of these lesser negative sequences.
It is known that there can be preovulatory LH surges and unsustained estrogen rises [
13,
14,
15,
16,
17]. We speculated these hormonal variations cause some of the early preovulatory negative D5, D6, and D7 values. To reduce the signal from non-ovulatory fluctuations, it was hypothesized that the D5, D6, and D7 computations could be combined—a convolution called D5D6D7—generating a positive or negative sign which was given a ‘0’ or ‘1’ value, respectively. Consequently, given that the ratio E3G/PDG should generally increase with follicular development until the periovulatory interval, a true negative D5D6D7 was scored only if D5, D6 and D7 were all negative (‘1’). If either D5 or D6 or D7 were positive—that is, not all of negative sign—then D5D6D7 was scored as positive (‘0’). In this way, it was thought that the signal from early unsustained follicular development in an extended cycle mimicking high then low estrogen levels would be suppressed by absence of complete D5, D6, and D7 negative signs. In summary, the sign assignment by the D5D6D7 convolution analysis—the mapping of D5, D6, and D7 to either a ‘0’ or ‘1’—was dedicated to signaling the transition to the luteal phase. The extended sequence of negative D5D6D7 values, as a sequence of nine ‘1’s or more, was also called the INS.
With D5D6D7 convolution analysis, E3G and PDG urine samples begin on calendar Day 6, but D5D6D7 signs are not considered for scoring until calendar Day 9, when D5, D6 and D7 values are all available. To better see the assignment of the D5D6D7 value (‘1’ if D5, D6, D7 all negative, ‘0’ if any D5, D6, D7 positive), an example of this convolution analysis for cycle 20.1 is provided in
Table 1.
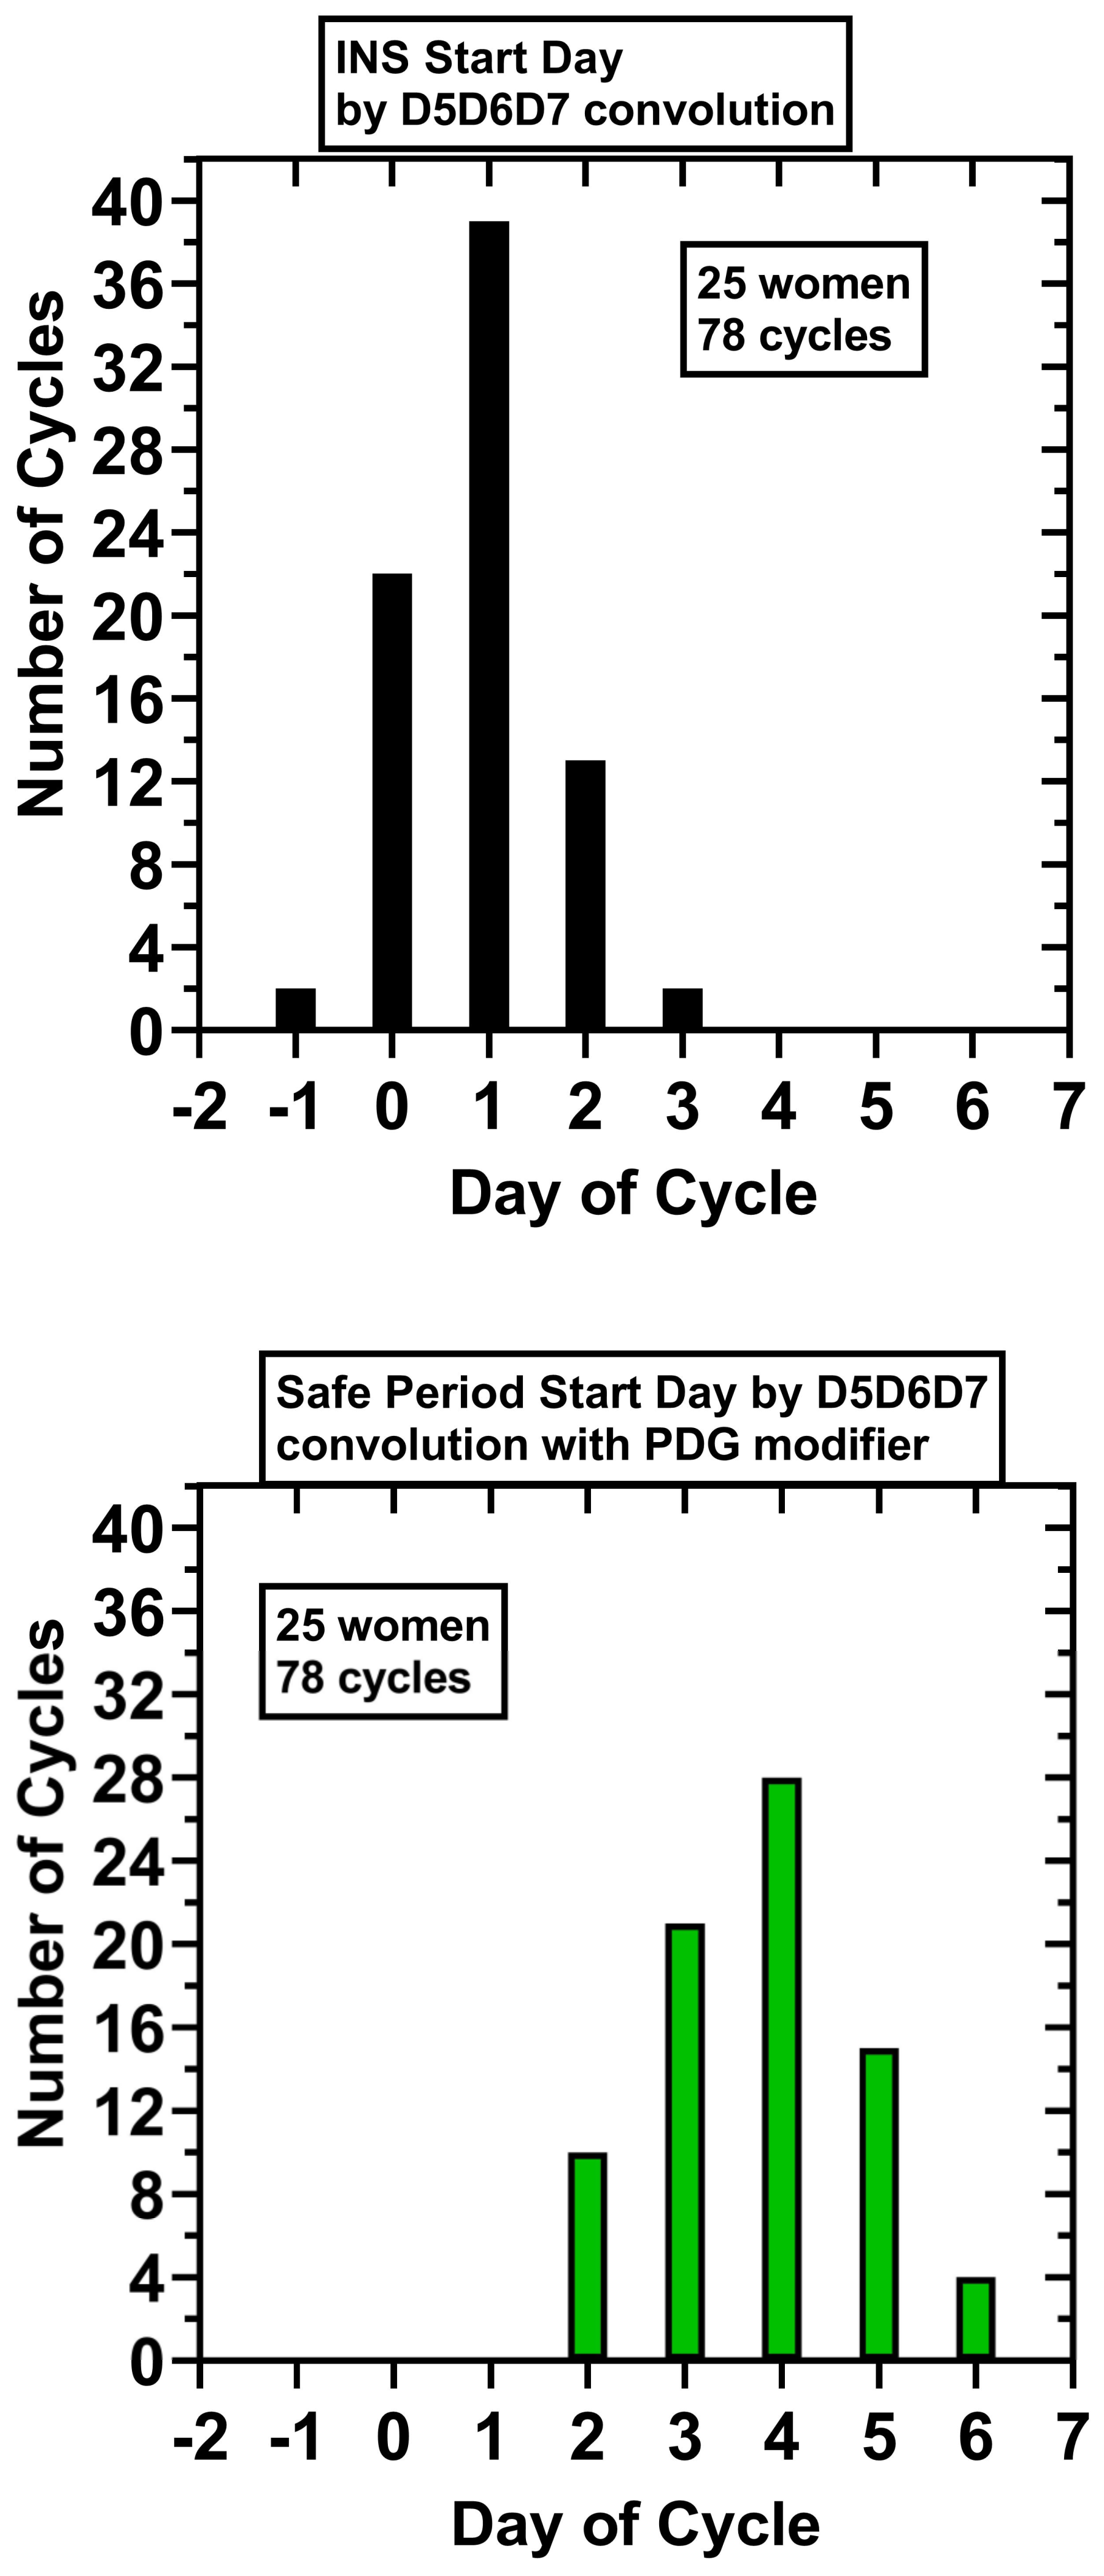
D5D6D7 analysis did filter out many of the negative values in the preovulatory phase, but some remained that were up to 6 days in length (5/78 cycles). A single INS, a sequence of ‘1’s which was 9 or longer in length starting in the periovulatory interval and continuing into the luteal phase, was maintained by D5D6D7 analysis; an INS of 9–17 length was found in 78/78 cycles. The first day of the INS was: Day −1, 2 cycles (2.6%); Day 0, 22 cycles (28.2%), Day +1, 39 cycles (50%), Day +2, 13 cycles (16.6%), Day +3, 2 cycles (2.6%) (
Figure 1). Using as reference background for the null hypothesis a binary sequence of ‘0’ or ‘1’ having equal probabilities (0.5), the probability of a true INS (a consecutive sequence of all ‘1’ of length ≥9) starting on Day −1 by chance in 78/78 cycles is <0.01.
3.3. A PDG Modifier with D5D6D7 to Optimize Identification of the Start of the Safe Days
However, one important aim of the algorithm was not only to identify by INS the luteal phase, but also to establish the start of the safe luteal period for FAMs/NFP as soon as possible, not requiring a nine day wait. To accomplish this aim, an additional step was incorporated into the D5D6D7 convolution analysis called the ‘5dP-3xrule’ (five-day baseline, at least three-fold PDG increase). This algorithmic step included a start of the safe luteal period signal of at least a three-fold increase in PDG from a cycle-specific baseline during days of extended sequences (three or greater) of negative D5D6D7.
The cycle-specific five-day PDG baseline levels preceding negative sequences, the INS and any preovulatory sequences three or greater in length, with the corresponding PDG levels for the start of the luteal safe period are provided in the
Supplementary Data, Table S2. The mean five-day PDG baseline for the INS sequences was 1.2 μmol/L ± 0.6 (SD), range 0.2–2.6 μmol/L, and the mean safe day start PDG level was 7.6 μmol/L ± 5.0 (SD), range 1.9–31.4 μmol/L. The start of the luteal safe days for the 78 cycles are shown in
Supplementary Data, Table S2 and for cycle 20.1 in
Figure 1. The 5dP-3x rule correctly identified a post-ovulatory, ‘safe start day’ in 78/78 cycles:
Day + 2, 10 cycles (12.8%); Day + 3, 21 cycles (26.9%); Day + 4, 28 cycles (35.9%).
Day + 5, 15 cycles (19.2%); Day + 6, 4 cycles (5.1%). Using as reference background for the null hypothesis a random binary sequence with equal probabilities (0.5), the probability of a true post-ovulatory day occurring on Day + 2 or later by chance in 78/78 cycles is <0.01.
For these 25 women, 78 cycles: the mean INS start day was Day 0.9 ± 0.8 (SD); mean INS length in days, 12.6 ± 1.5 (SD); mean start day for the luteal safe period, Day 3.8 ± 1.1 (SD); and mean number of safe luteal days, 10.3 ± 1.3 (
Figure 1).
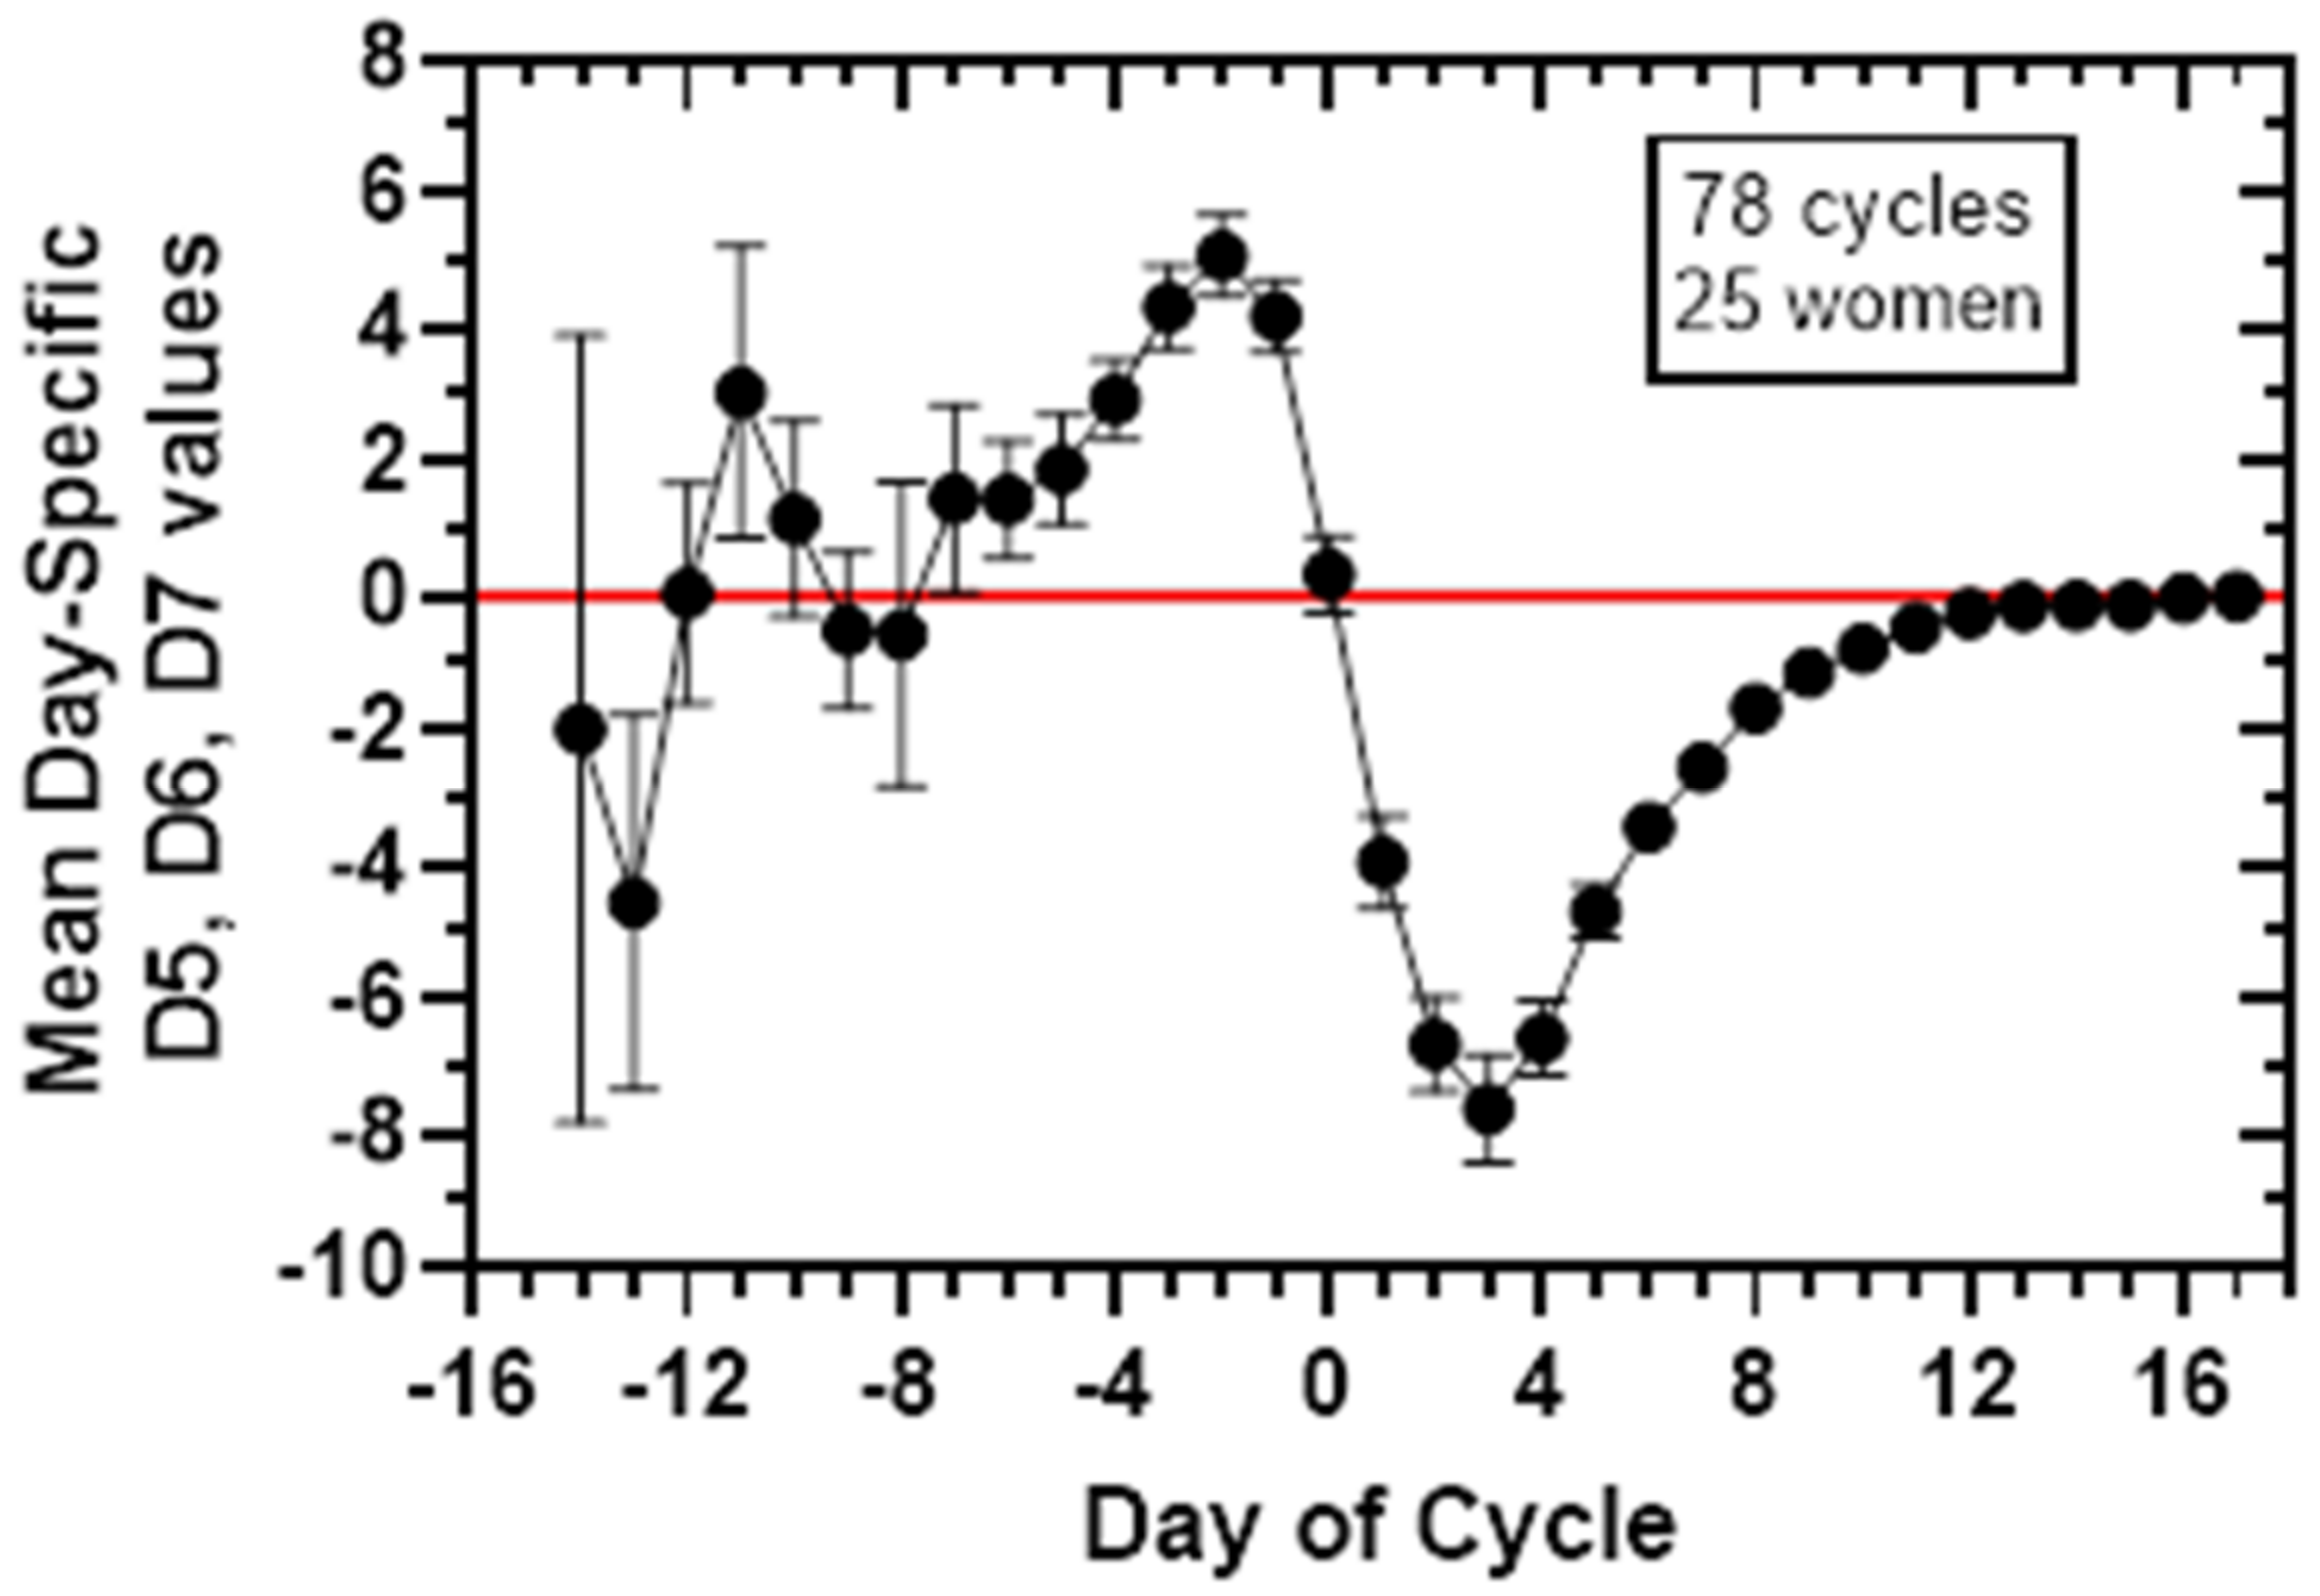
3.4. Signature of Delta Function Plots
The D5D6D7 convolution is not an averaging of the magnitudes, however a plot of the mean day-specific D5, D6 and D7 values starting from calendar Day 9 is informative and presented in
Figure 2, showing a characteristic signature for the Delta function.
4. Discussion
The rationale of this work was to develop an algorithm with the new technology of urinary E3G and PDG measurements for identifying time of cycle for NFP purposes. An algorithm refers to a step-by-step method for performing some action [
18]. For an algorithm one frequently uses a sequence of instructions repeatedly, until an objective is reached. As simply put by Lewis Carroll in
Alice’s Adventures in Wonderland: ‘Begin at the beginning…and go on till you come to the end: then stop’ [
19].
Given biological fluctuations, the development of a highly sensitive and specific algorithm to determine the phase of cycle for an individual woman is more difficult than for the ‘average’ cycle using mean hormonal data [
20,
21]. To accomplish such an algorithm, computations with urinary E3G and PDG levels from 78 cycles from 25 women using real-time AUCs as variables were created to establish methods to signal the transition from the preovulatory to the luteal phase. This algorithm utilized a D5D6D7 convolution, which generated a sequence of negative signs greater than nine in length, denoted as a sequence of ‘1s’ and called the INS, to identify the luteal phase. The D5D6D7 method does not require a threshold or percentage reduction from a peak and a E3G/PDG based algorithm avoids fluctuations in urinary concentration at home/point of care testing. However, one main objective was to create a practical method for NFP, and therefore, an increase above a three-fold threshold of a cycle-specific PDG baseline was incorporated into the D5D6D7 algorithm. It should be noted that in regularly menstruating women there is variability in the luteinization process reflected in the rate and level of the PDG rise, making it difficult to use a universal PDG threshold to identify the early post-ovulatory time [
22]. One strength of this three-fold PDG modifier is that it is calculable in every cycle, independent of any past cycle data, and less likely to err since it is only employed on negative D5D6D7 days (i.e., ‘candidate’ luteal days).
A format to program D5D6D7 convolution analysis with PDG modifier into a home meter to signal the luteal transition and the start of the luteal safe days is outlined in
Figure 3. With the algorithm the luteal transition interval was identified in all 78 cycles. In addition, the mean number of derived safe luteal days for NFP was 10.3 ± 1.3 (SD), and the luteal phase predicted by Day + 4 in 75.6% and by Day + 6 in 100% of cycles. Although this study was not a clinical trial and therefore cannot be directly compared with other NFP publications [
5,
6,
7], the results indicate possible improvement in timing the start of the luteal phase and shortening the days of abstinence. The D5D6D7-PDG modifier algorithm could be incorporated into home monitors with proprietary E3G, PDG, and LH algorithms to improve signaling of the luteal phase.
The algorithm as presently construed lacks the capability to indicate the start of the preovulatory fertile period. Given this limitation, until detection of the INS by a device, a woman would need to consider the time of cycle as preovulatory. For NFP other FAMs such as cervical-vaginal mucus signs could be used to indicate preovulatory fertile days or perhaps with other methodologies yet to come.
D5D6D7 convolution analysis could potentially provide information on abnormal cycles such as in polycystic ovary syndrome. In 5 of 78 cycles (6.4% of cycles), there was a preovulatory negative D5D6D7 sequence, ‘1’s of 3–6 length. These cycles were of longer length (30–35 days) and later ovulation (calendar Days 15–23). As mentioned earlier, it is possible that these preovulatory days represented attempts of early ovulation which did not progress [
13,
14,
15,
16,
17]; it would be interesting in future studies to link data of daily serum or urinary LH levels with D5D6D7 analysis. In addition, it will be important to test the D5D6D7 method with PCOS and breast-feeding cycles to determine if it can identify both an extended preovulatory state and a post-ovulatory, luteal state. Furthermore, the precise length of the INS may have implications in terms of the health of the luteal phase. It is hoped that D5D6D7 convolution with PDG modifier could be applied as a tool for both NFP/FAMs and the study of dysfunctional ovulation and inadequate luteal phase PDG levels.
5. Conclusions
An algorithm using a progressive negative change in the daily ratio of the area under the curve for E3G and PDG, E3G-AUC/PDG-AUC along with a three-fold increase in PDG from a cycle-specific baseline provides a sensitive and specific signal for the transition to the luteal phase in ovulatory cycles. In addition, the start of the safe period for NFP/FAMs can be identified. Since E3G and PDG levels from available home fertility monitors can be input into the algorithm, it may be of use for women interested in understanding their luteal phase and in planning abstinence for NFP.
Supplementary Materials
The following supporting information can be downloaded at:
https://www.mdpi.com/article/10.3390/medicina58010119/s1, Table S1: Delta7, Delta6, and Delta5 values for 78 cycles from 25 women, Table S2: data for 78 cycles, 25 women: D5D6D7 values (0 or 1), and five-day PDG mean baseline levels preceding negative sequences, the INS and any preovulatory sequences three or greater in length, with the corresponding PDG levels for the start of the luteal safe period.
Author Contributions
Conceptualization, S.J.U., M.E.A. and A.A.T.; methodology, S.J.U. and M.E.A.; software, S.J.U., M.E.A. and A.A.T.; validation, S.J.U., M.E.A. and A.A.T.; formal analysis, S.J.U., M.E.A. and A.A.T.; investigation, S.J.U. and M.E.A.; resources, M.E.A., S.J.U. and A.A.T.; data curation, M.E.A.; writing—original draft preparation, S.J.U.; writing—review and editing, S.J.U., M.E.A. and A.A.T.; visualization, S.J.U., M.E.A. and A.A.T.; supervision, S.J.U. and M.E.A.; project administration, S.J.U. and M.E.A.; funding acquisition, M.E.A. All authors have read and agreed to the published version of the manuscript.
Funding
This research received no external funding.
Institutional Review Board Statement
The Alliende urinary E3G, PDG, and LH levels are from a secondary analysis of data from a multicentre World Health Organization (WHO) sponsored study (HRP#87904, approved locally, 21 September 1988).
Informed Consent Statement
Not applicable.
Data Availability Statement
Conflicts of Interest
The authors declare no conflict of interest.
References
- Bouchard, T.P.; Genuis, S.J. Personal fertility monitors for contraception. Can. Med. Assoc. J. 2010, 183, 73–76. [Google Scholar] [CrossRef] [PubMed][Green Version]
- Fehring, R.J.; Schneider, M.; Barron, M.L. Efficacy of the Marquette Method of natural family planning. MCN Am. J. Matern. Nurs. 2008, 33, 348–354. [Google Scholar] [CrossRef] [PubMed][Green Version]
- Blackwell, L.F.; Vigil, P.; Gross, B.; d’Arcangues, C.; Cooke, D.G.; Brown, J.B. Monitoring of ovarian activity by measurement of urinary excretion rates of estrone glucuronide and pregnanediol glucuronide using the Ovarian Monitor, Part II: Reliability of home testing. Hum. Reprod. 2011, 27, 550–557. [Google Scholar] [CrossRef] [PubMed]
- Freundl, G.; Godehardt, E.; Kern, P.A.; Frank-Herrmann, P.; Koubenec, H.J.; Gnoth, C. Estimated maximum failure rates of cycle monitors using daily conception probabilites in the menstrual cycle. Hum. Reprod. 2003, 18, 2628–2633. [Google Scholar] [CrossRef] [PubMed]
- Tanabe, K.; Susumu, N.; Hand, K.; Nishii, K.; Ishikawa, I.; Nozawa, S. Prediction of the potentially fertile period by urinary hormone measurements using a new home-use monitor: Comparison with laboratory hormone analyses. Hum. Reprod. 2001, 16, 1619–1624. [Google Scholar] [CrossRef] [PubMed]
- Bouchard, T.P.; Fehring, R.J.; Schneider, M. Pilot Evaluation of a New Urine Progesterone Test to Confirm Ovulation in Women Using a Fertility Monitor. Front. Public Health 2018, 7, 184. [Google Scholar] [CrossRef] [PubMed]
- Leiva, R.; McNamara-Kilian, M.; Niezgoda, H.; Ecochard, R.; Bouchard, T. Pilot observational prospective cohort study on the use of a novel home-based urinary pregnanediol 3-glucuronide (PDG) test to confirm ovulation when used as adjunct to fertility awareness methods (FAMs) stage 1. BMJ Open 2018, 9, e028496. [Google Scholar] [CrossRef] [PubMed]
- Clearblue Fertility MonitorTM, Geneva, Switzerland. Available online: https://www.clearblue.com/healthcare-professionals/ovulation-tests/fertility-monitor-with-touch-screen (accessed on 1 November 2021).
- Mira Fertility TrackerTM, Pleasanton, CA, USA. Available online: https://www.miracare.com (accessed on 1 November 2021).
- Inito Fertility MonitorTM, San Francisco, CA, USA. Available online: https://www.inito.com (accessed on 1 November 2021).
- Alliende, M.E.; Arraztoa, J.A.; Guajardo, U.; Mellado, F. Towards the Clinical Evaluation of the Luteal Phase in Fertile Women: A Preliminary Study of Normative Urinary Hormone Profiles. Front. Public Health 2018, 6, 147. [Google Scholar] [CrossRef] [PubMed]
- Casella, G.; Berger, R.L. Common families of distributions. In Statistical Inference, 2nd ed.; Casella, G., Berger, R.L., Eds.; Duxbury: Pacific Grove, CA, USA, 2002; pp. 85–98. [Google Scholar]
- Alliende, M.E. Mean versus individual hormonal profiles in the menstrual cycle. Fertil. Steril. 2002, 78, 90–95. [Google Scholar] [CrossRef]
- Alliende, M.E. Luteinizing hormone surge in normally ovulating women. Fertil. Steril. 2013, 99, e14–e15. [Google Scholar] [CrossRef] [PubMed]
- Direito, A.; Bailly, S.; Mariani, A.; Ecochard, R. Relationships between the luteinizing hormone surge and other characteristics of the menstrual cycle in normally ovulating women. Fertil. Steril. 2013, 99, 279–285.e3. [Google Scholar] [CrossRef] [PubMed]
- Park, S.J.; Goldsmith, L.T.; Skurnick, J.H.; Wojtczuk, A.; Weiss, G. Characteristics of the urinary luteinizing hormone surge in young ovulatory women. Fertil. Steril. 2007, 88, 684–690. [Google Scholar] [CrossRef] [PubMed]
- Blackwell, L.F.; Vigil, P.; Cooke, D.G.; d’Arcangues, C.; Brown, J.B. Monitoring of ovarian activity by daily measurement of urinary excretion rates of oestrone glucuronide and pregnanediol glucuronide using the Ovarian Monitor, Part III: Variability of normal menstrual cycle profiles. Hum. Reprod. 2013, 28, 3306–3315. [Google Scholar] [CrossRef] [PubMed]
- Epp, S.S. (Ed.) Application algorithms. In Discrete Mathematic with Applications, 5th ed.; Cengage: Boston, MA, USA, 2020; p. 244. [Google Scholar]
- Lewis, C. Alice’s Adventures in Wonderland; William Morrow & Co., Inc: New York, NY, USA, 1866; p. 182. [Google Scholar]
- Usala, S.J.; Trindade, A.A. A Novel Fertility Indicator Equation Using Estradiol Levels for Assessment of Phase of the Menstrual Cycle. Medicina 2020, 56, 555. [Google Scholar] [CrossRef] [PubMed]
- Usala, S.J.; Alliende, M.E.; Trindade, A.A. The Fertility Indicator Equation Using Serum Progesterone and Urinary Pregnanediol-3-Glucuronide for Assessment of Ovulatory to Luteal Phase Transition. Medicina 2021, 57, 134. [Google Scholar] [CrossRef] [PubMed]
- Ecochard, R.; Bouchard, T.; Leiva, R.; Abdulla, S.; Dupuis, O.; Duterque, O.; Garmier Billard, M.; Boehringer, H.; Genolini, C. Characterization of hormonal profiles during the luteal phase in regularly menstruating women. Fertil. Steril. 2017, 108, 175. [Google Scholar] [CrossRef] [PubMed]
| Publisher’s Note: MDPI stays neutral with regard to jurisdictional claims in published maps and institutional affiliations. |
© 2022 by the authors. Licensee MDPI, Basel, Switzerland. This article is an open access article distributed under the terms and conditions of the Creative Commons Attribution (CC BY) license (https://creativecommons.org/licenses/by/4.0/).


