
A Simple Predictive Marker in Cardiac Resynchronization Therapy Recipients: Prominent S-Wave in Right Precordial Leads


Abstract
:1. Introduction
2. Methods
2.1. Study Population
2.2. Clinical Characteristics
2.3. Standard 12-Lead Electrocardiograms
2.4. Echocardiograms and CRT Responder (Primary Endpoint)
2.5. Clinical Outcomes (Secondary Endpoint)
2.6. Statistical Analysis
3. Results
3.1. Patient Characteristics
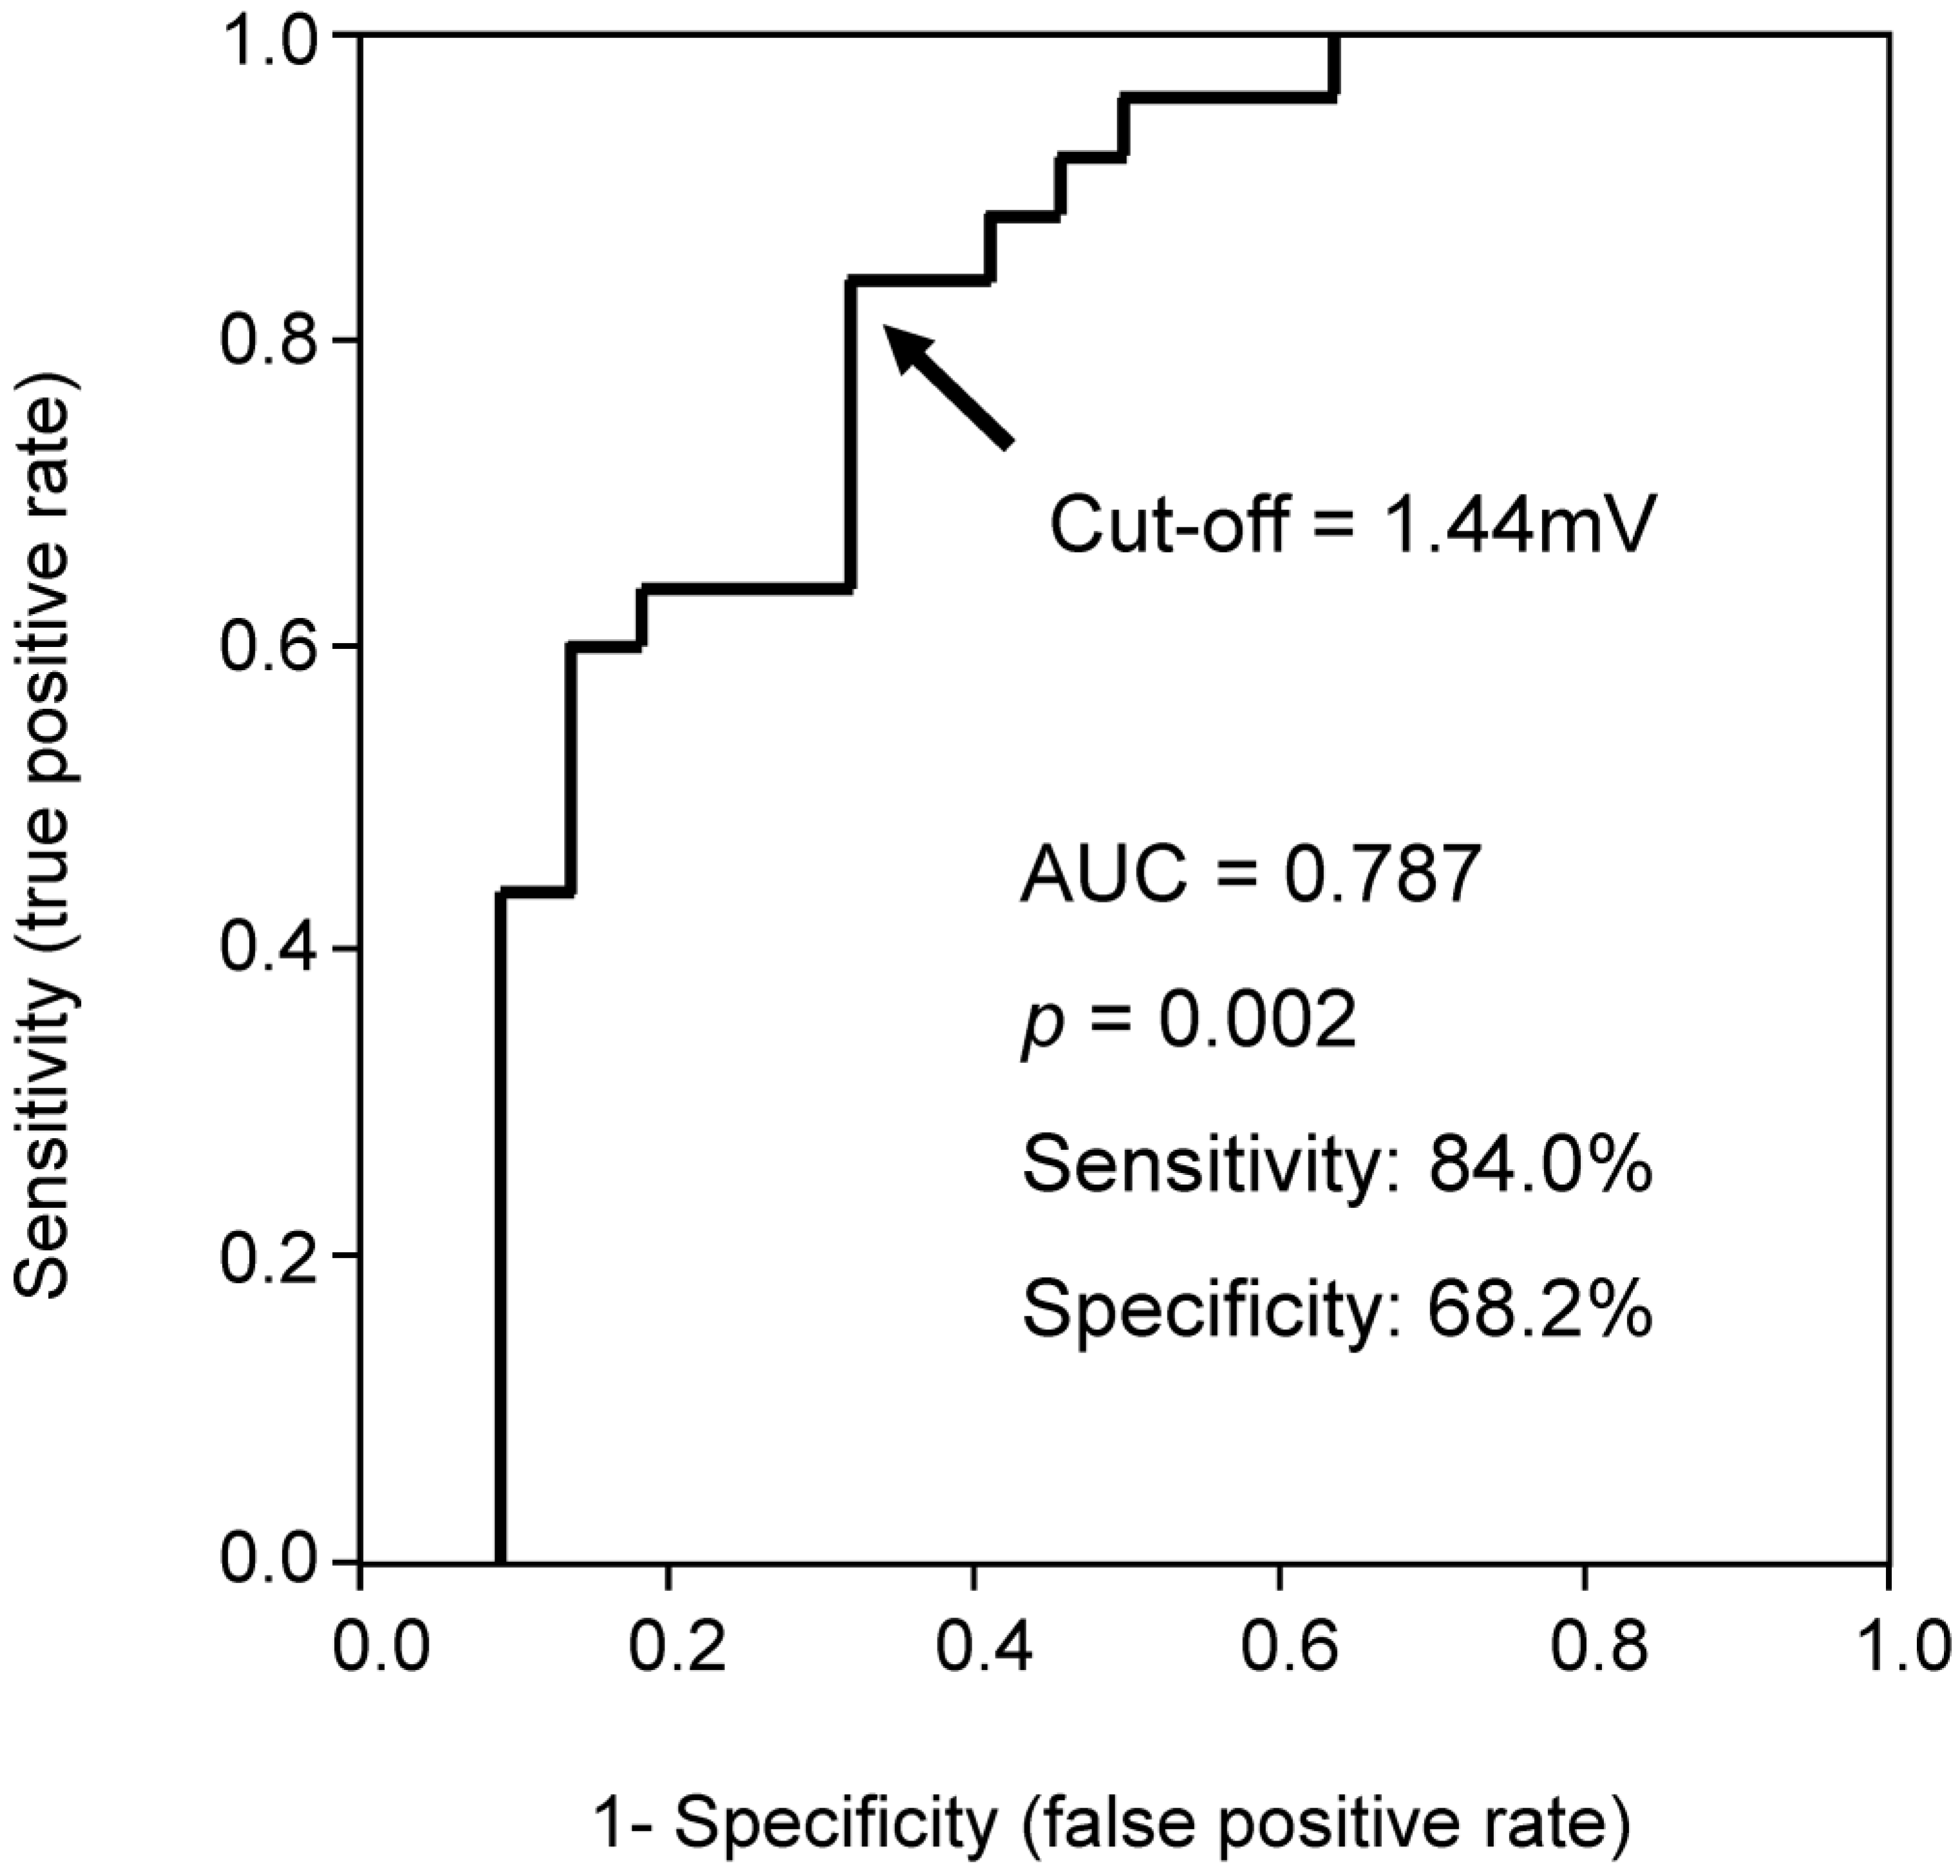
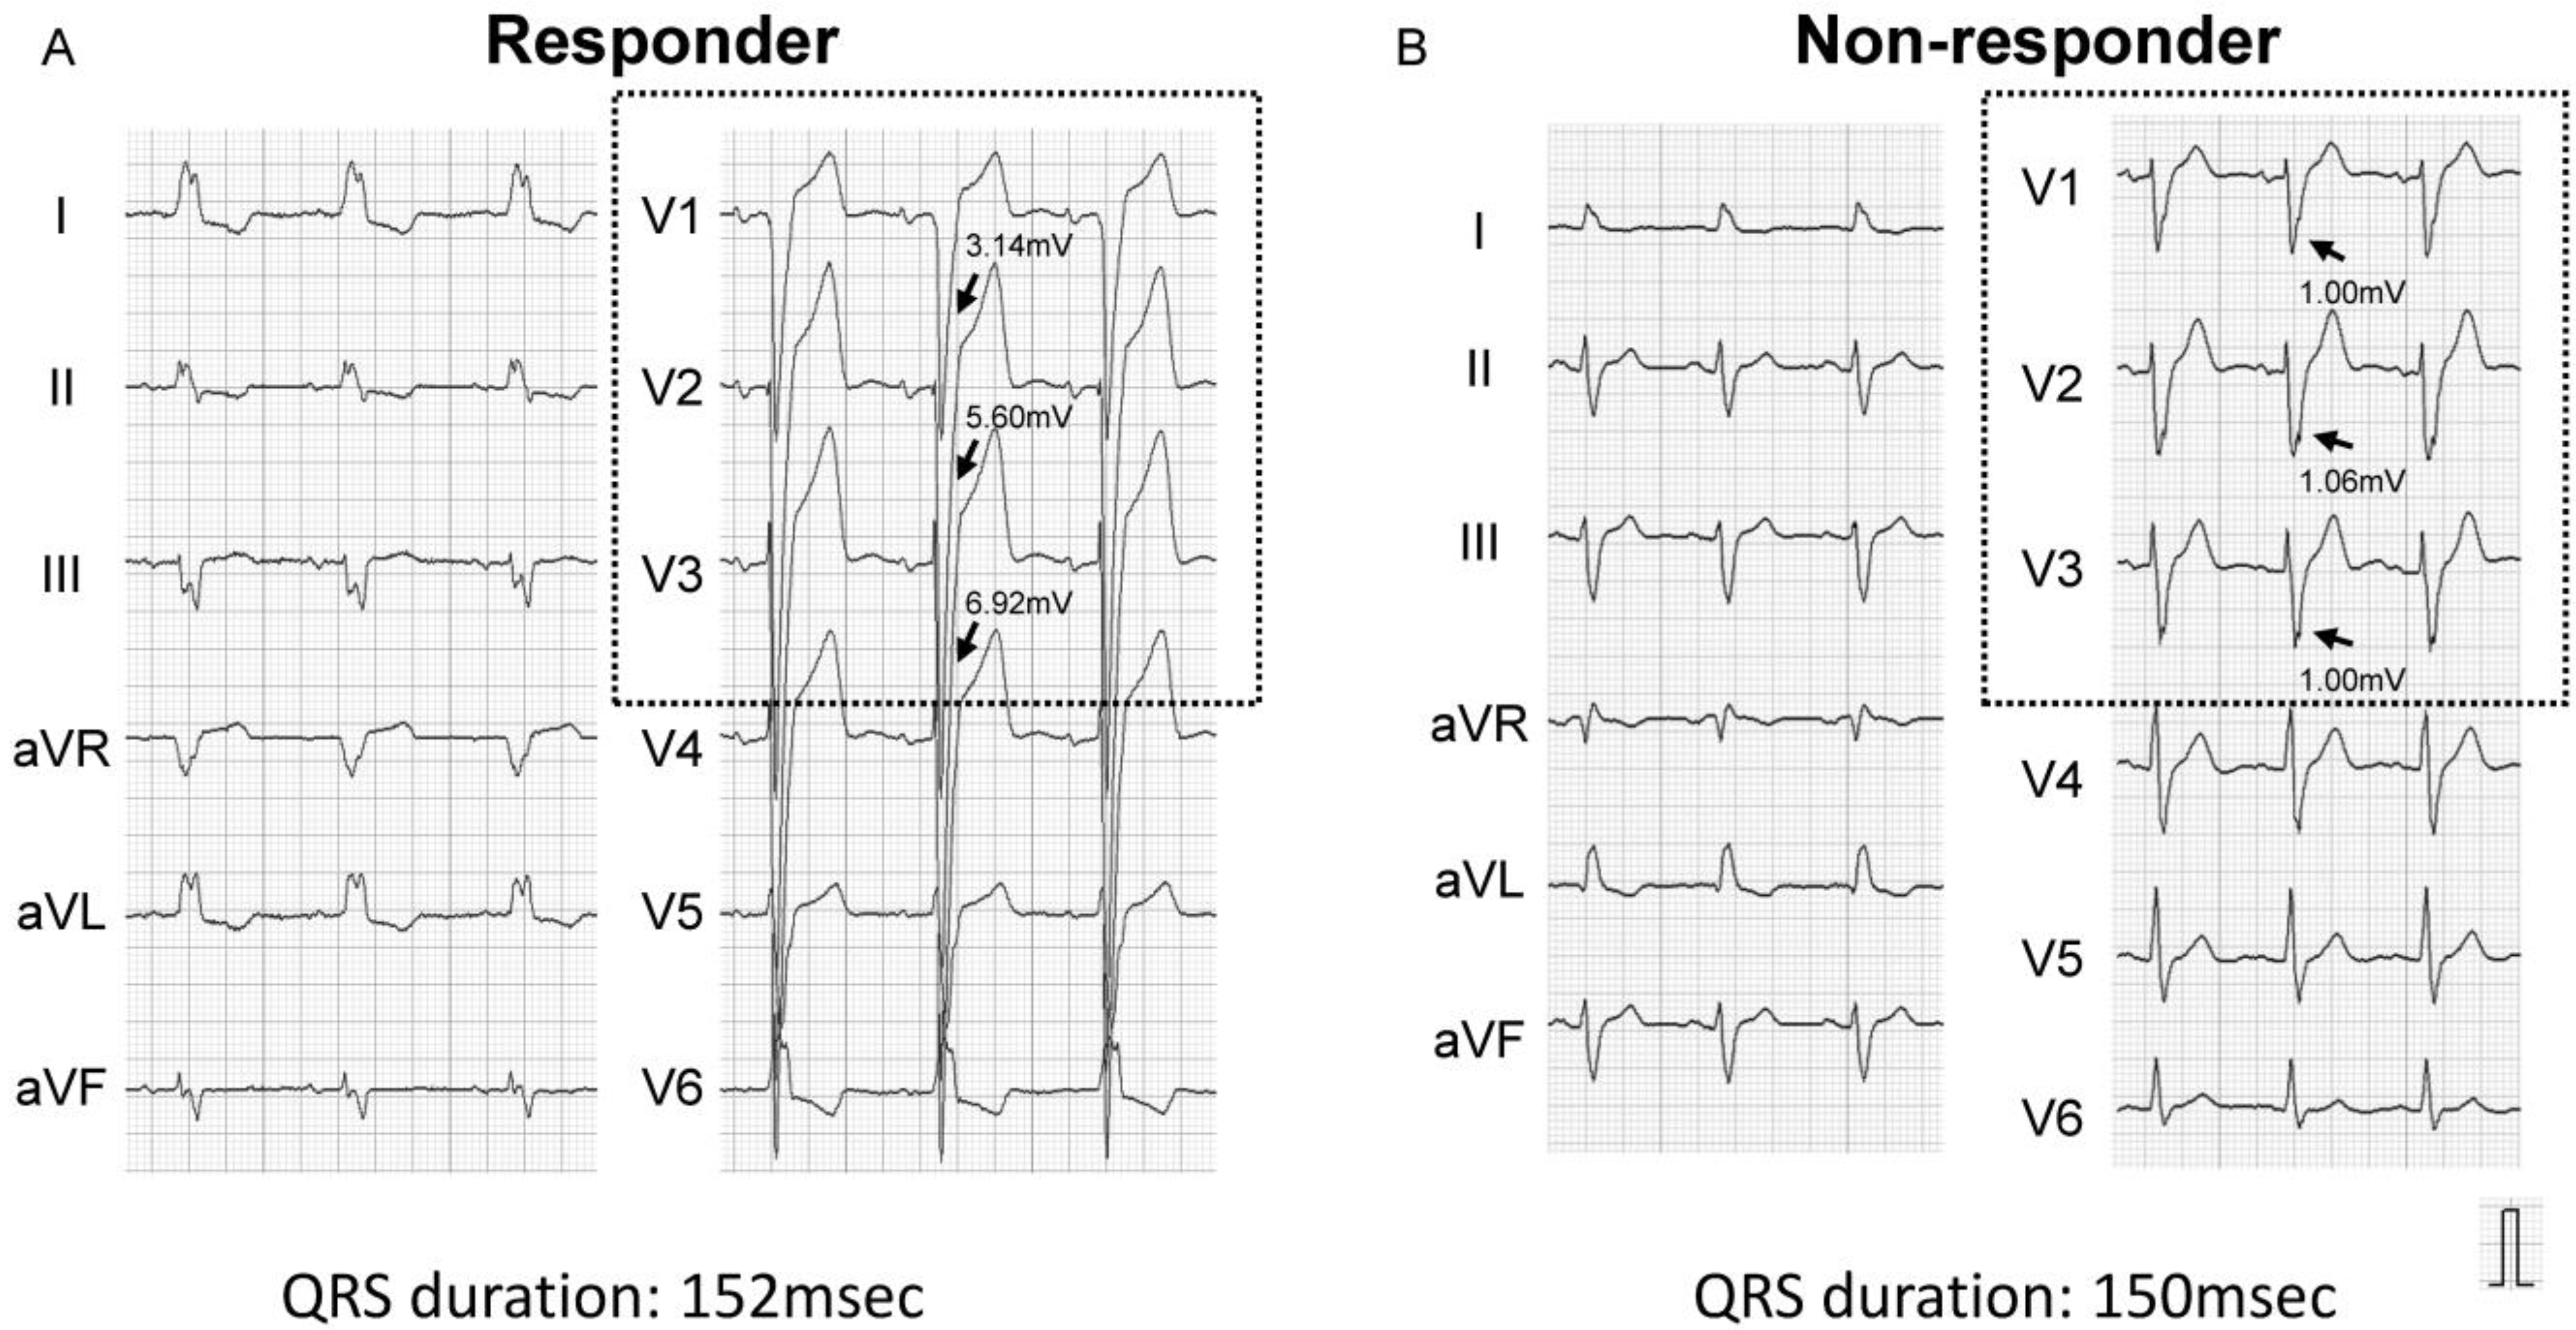
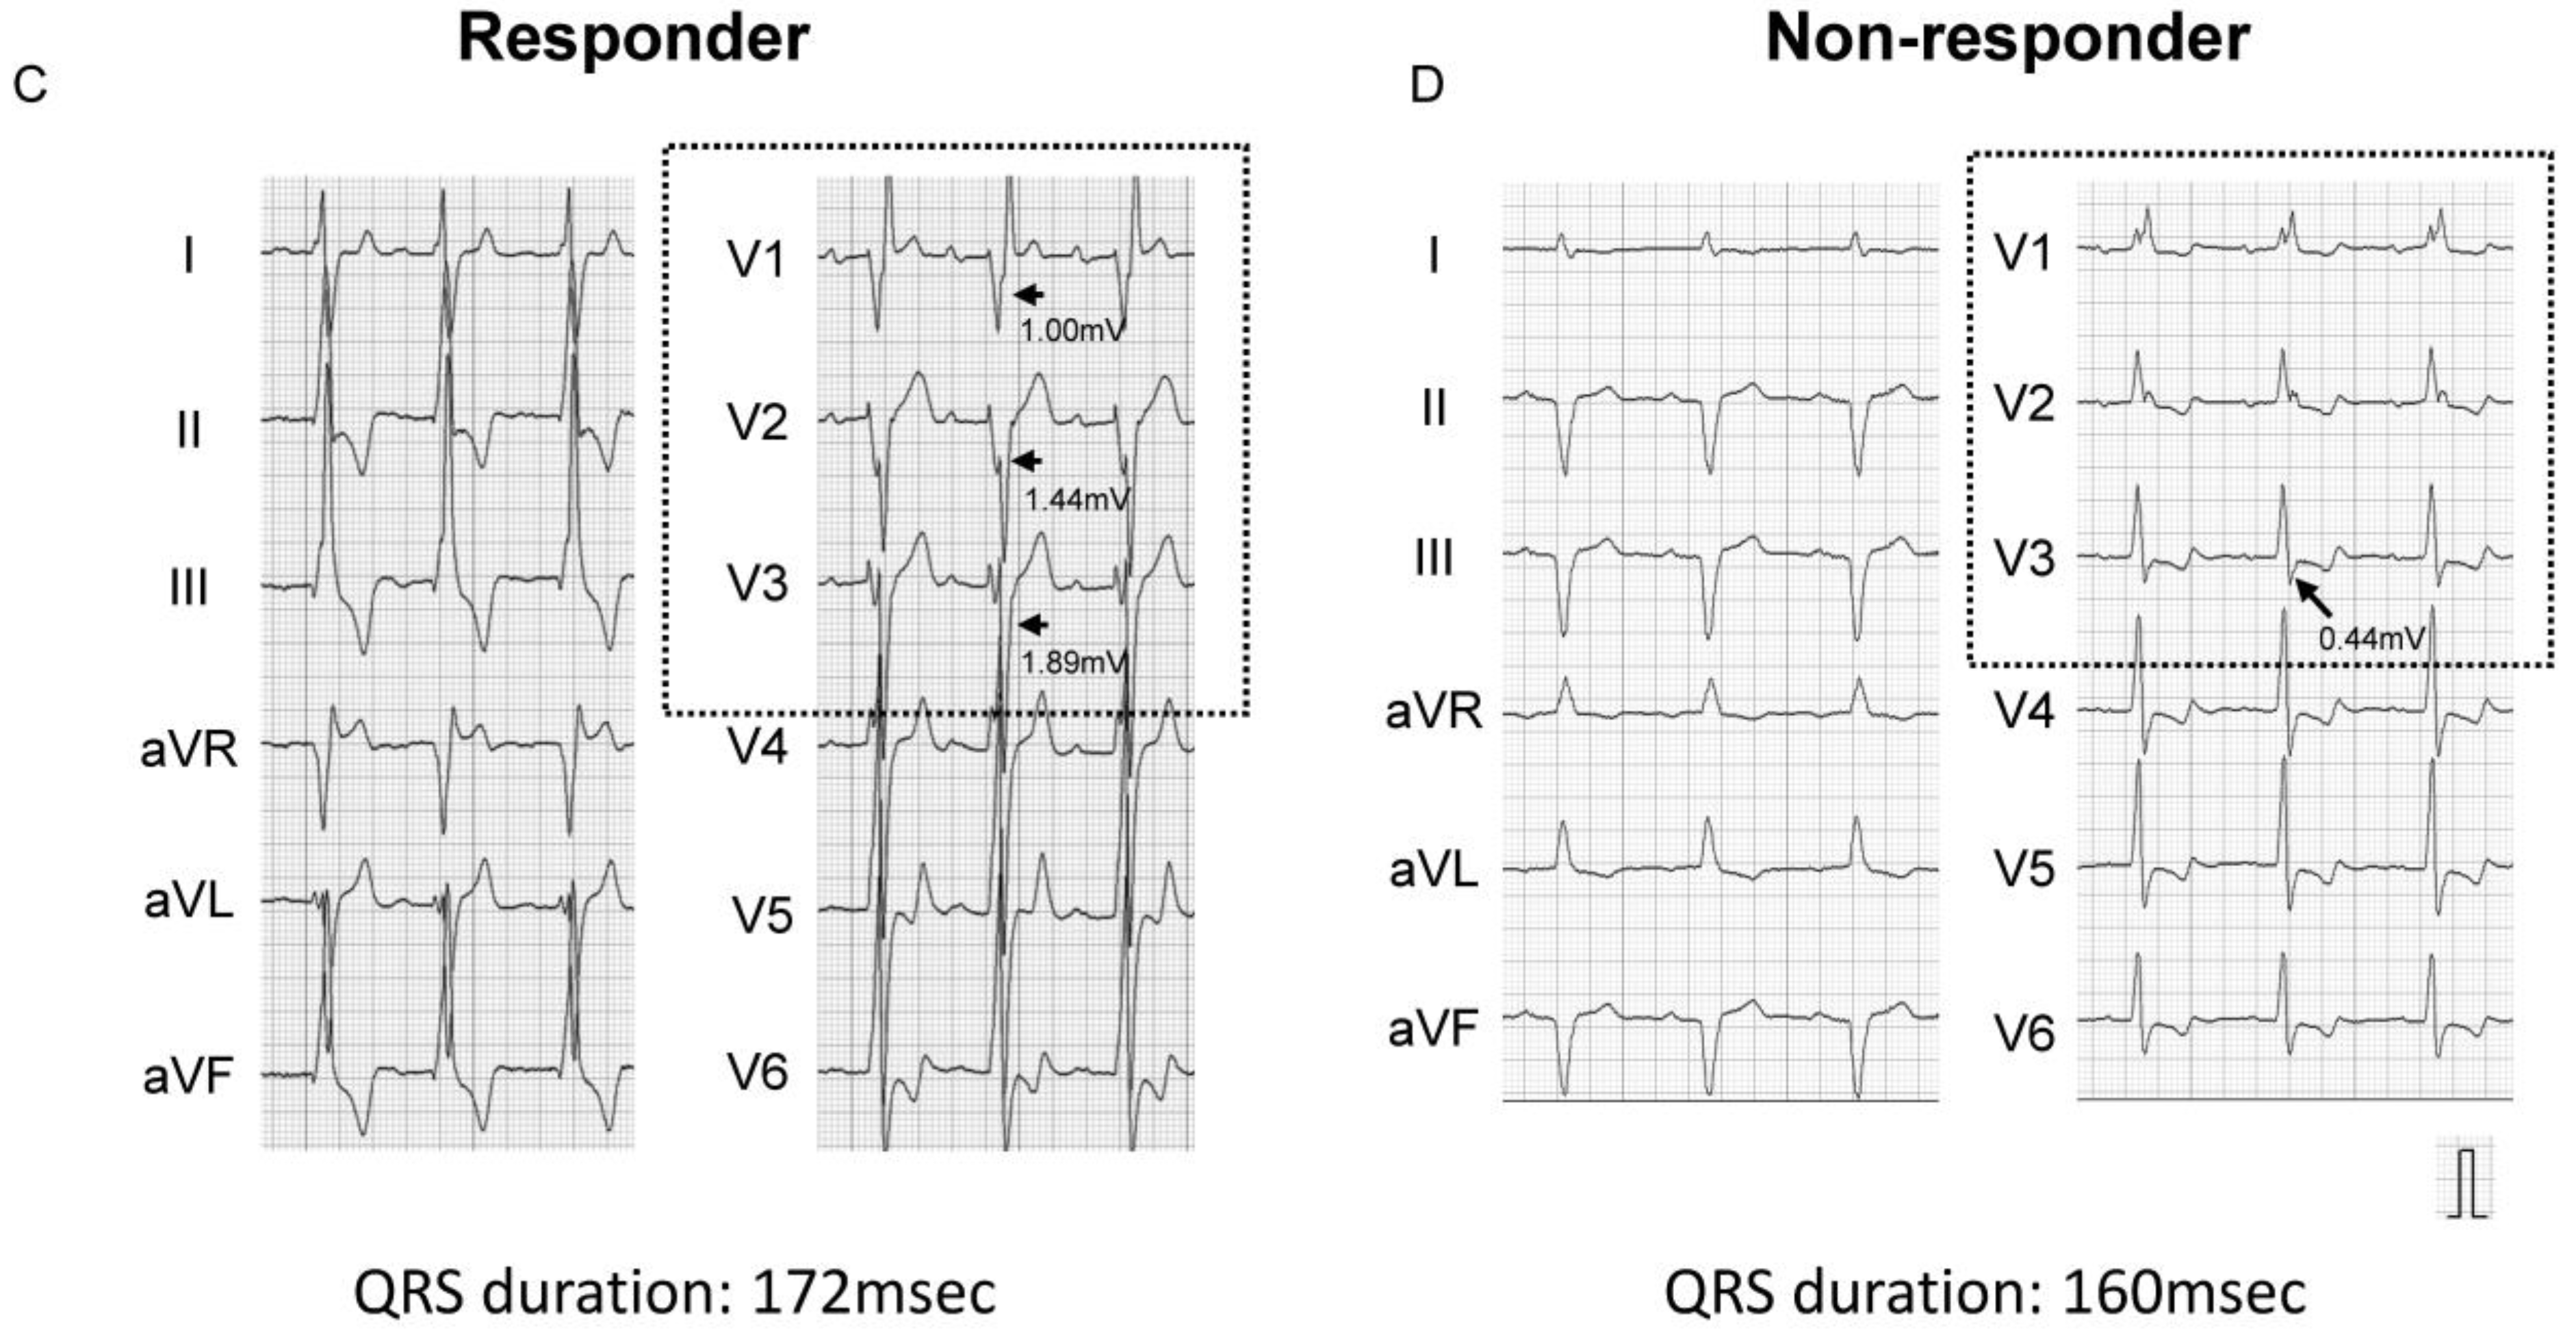
3.2. Impact of QRS Amplitude on CRT Response
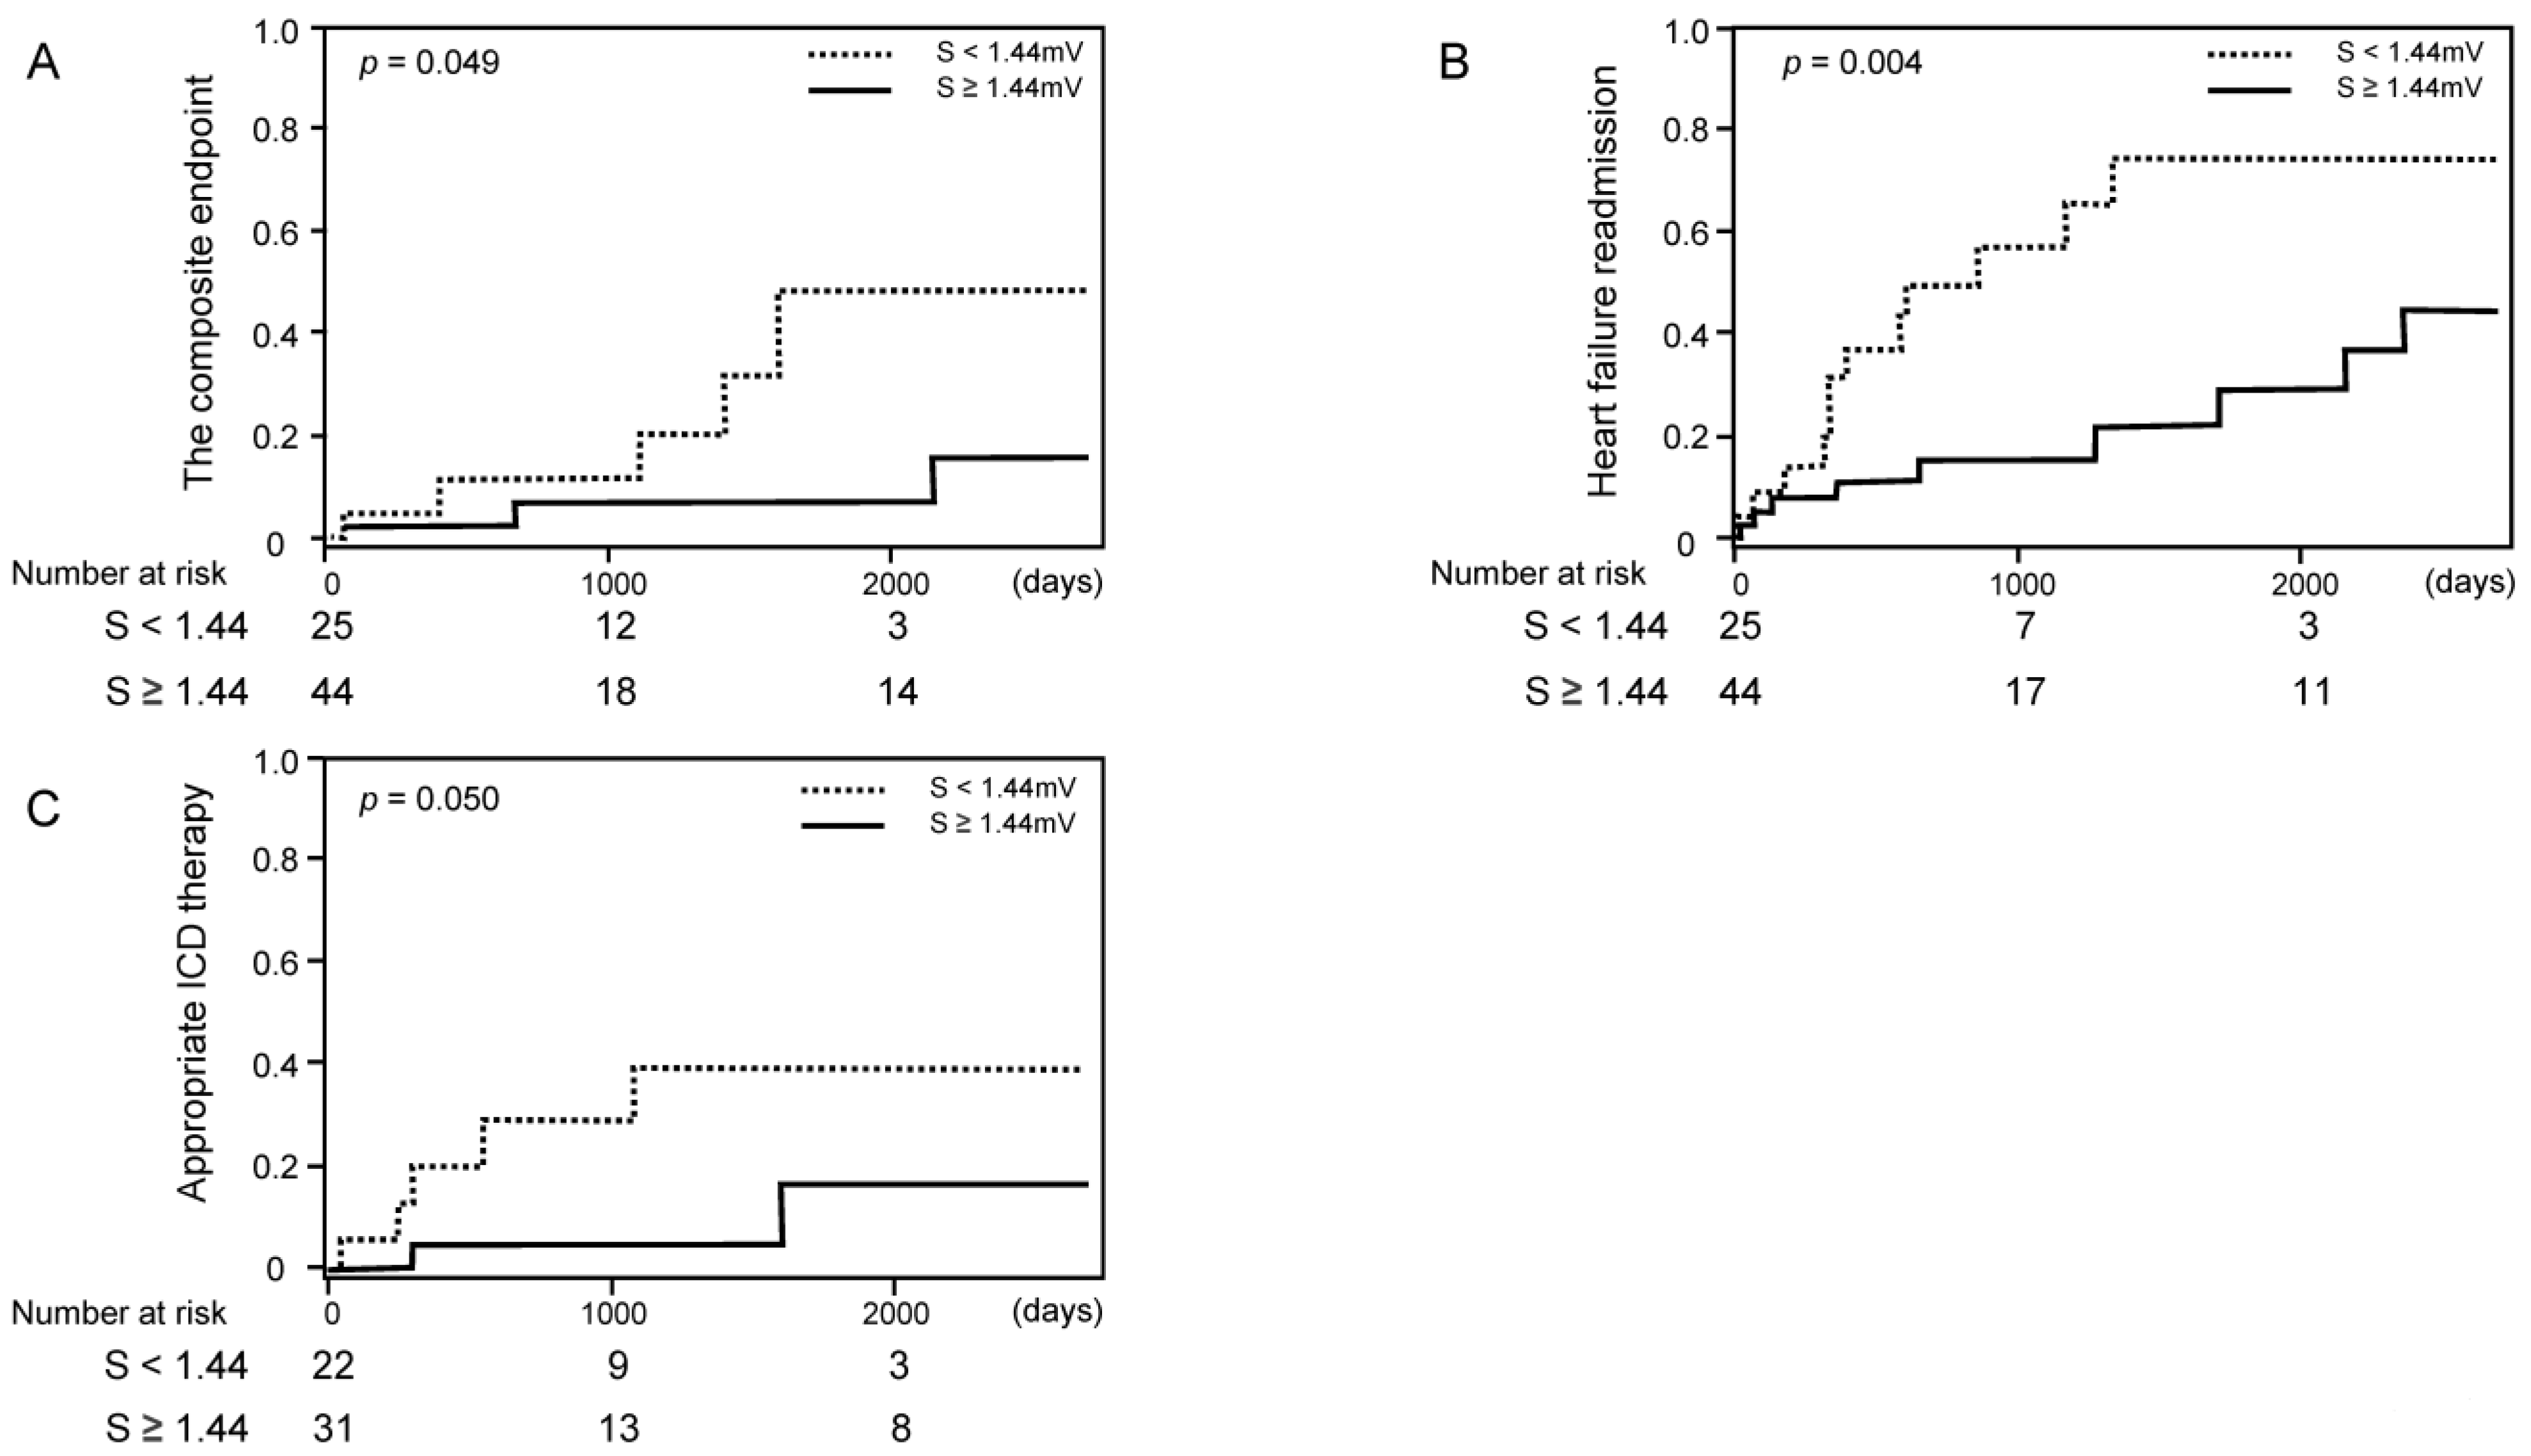
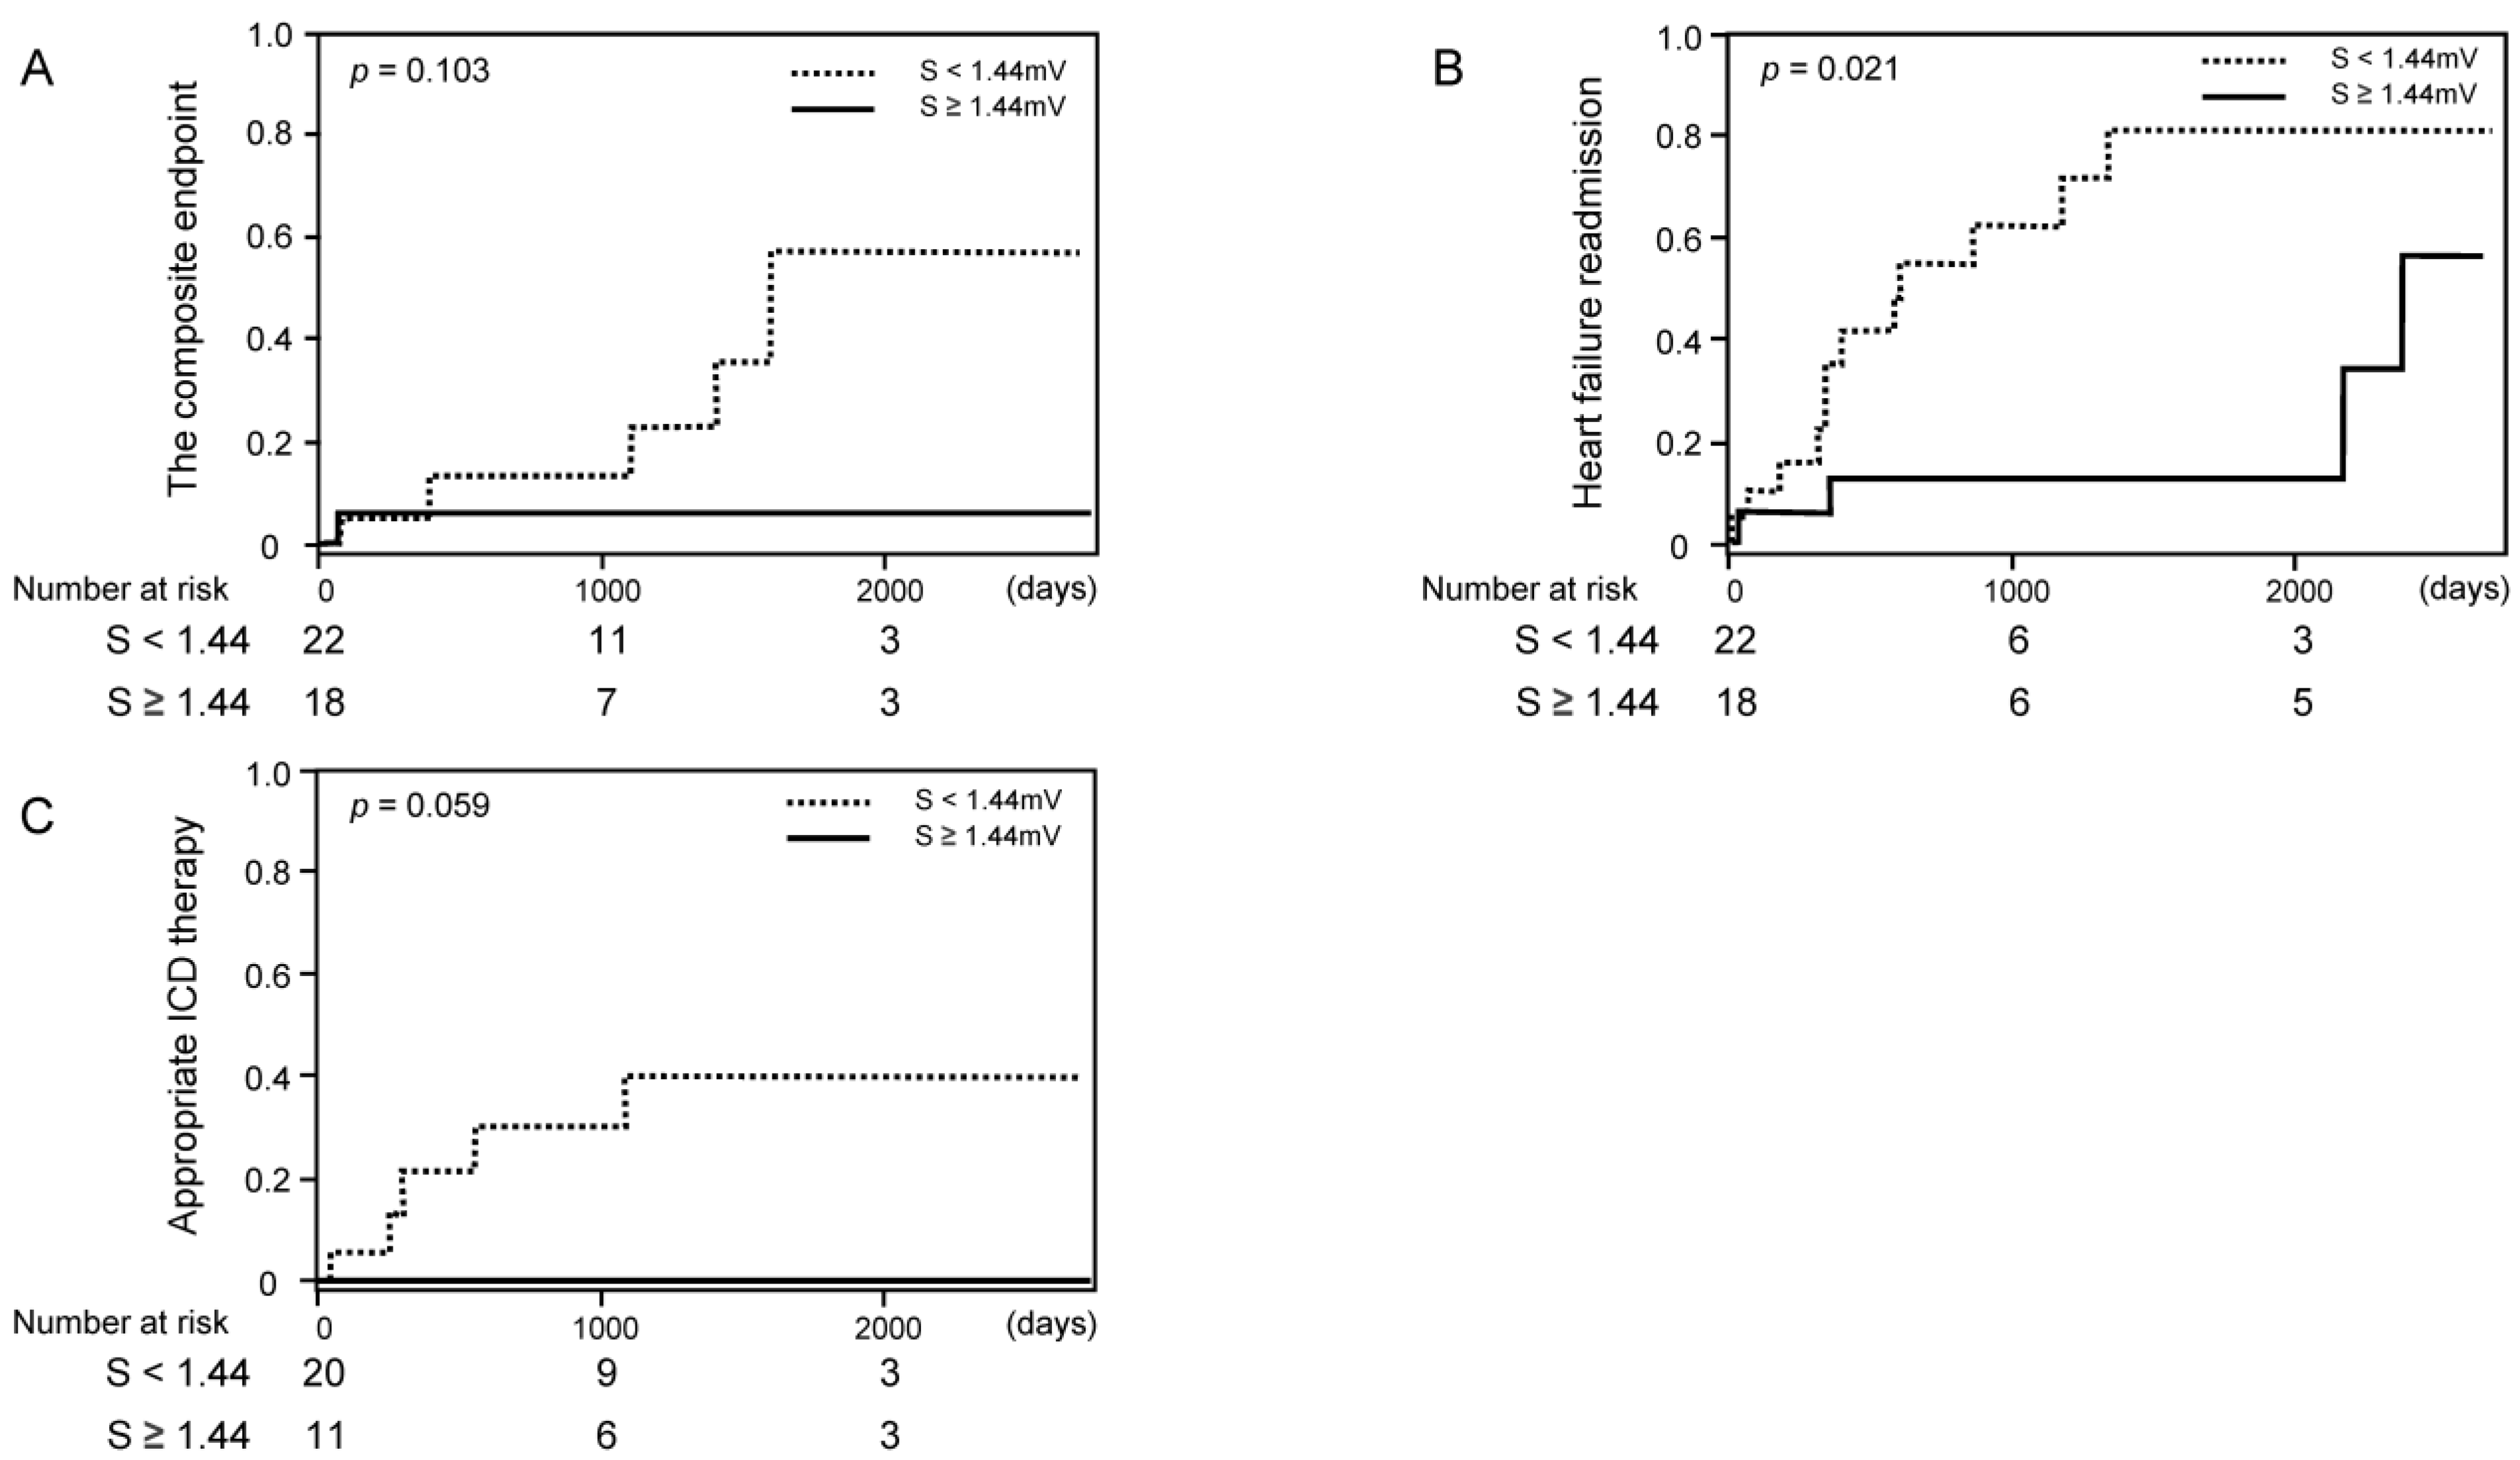
3.3. Impact of S-Wave Amplitude in Right Precordial Leads on Clinical Outcomes
4. Discussion
4.1. CRT Responders
4.2. Implication of S-Wave Amplitude in Right Precordial Leads
4.3. Optimal Patient Selection for the Favorable Responses to CRT
4.4. Study Limitations
5. Conclusions
Supplementary Materials
Author Contributions
Funding
Institutional Review Board Statement
Informed Consent Statement
Data Availability Statement
Conflicts of Interest
Abbreviations
| CRT | cardiac resynchronization therapy |
| ECG | electrocardiogram |
| ICD | implantable cardioverter defibrillator |
| LBBB | left bundle branch block |
| LVEF | left ventricular ejection fraction |
| LVESV | left ventricular end-systolic volume |
References
- Yancy, C.W.; Jessup, M.; Bozkurt, B.; Butler, J.; Casey, D.E., Jr.; Drazner, M.H.; Fonarow, G.C.; Geraci, S.A.; Horwich, T.; Januzzi, J.L.; et al. American College of Cardiology Foundation. 2013 ACCF/AHA guideline for the management of heart failure: A report of the American College of Cardiology Foundation/American Heart Association Task Force on practice guidelines. J. Am. Coll. Cardiol. 2013, 62, e147–e239. [Google Scholar] [CrossRef] [Green Version]
- Ponikowski, P.; Voors, A.A.; Anker, S.D.; Bueno, H.; Cleland, J.G.F.; Coats, A.J.S.; Falk, V.; González-Juanatey, J.R.; Harjola, V.-P.; Jankowska, E.A.; et al. ESC Scientific Document Group. 2016 ESC Guidelines for the diagnosis and treatment of acute and chronic heart failure: The Task Force for the diagnosis and treatment of acute and chronic heart failure of the European Society of Cardiology (ESC) developed with the special contribution of the Heart Failure Association (HFA) of the ESC. Eur. Heart J. 2016, 37, 2129–2200. [Google Scholar] [PubMed]
- Ezekowitz, J.A.; O’Meara, E.; McDonald, M.A.; Abrams, H.; Chan, M.; Ducharme, A.; Giannetti, N.; Grzeslo, A.; Hamilton, P.G.; Heckman, G.A.; et al. 2017 Comprehensive Update of the Canadian Cardiovascular Society Guidelines for the Management of Heart Failure. Can. J. Cardiol. 2017, 33, 1342–1433. [Google Scholar] [CrossRef] [PubMed] [Green Version]
- Stockburger, M.; Moss, A.J.; Klein, H.U.; Zareba, W.; Goldenberg, I.; Biton, Y.; McNitt, S.; Kutyifa, V. Sustained clinical benefit of cardiac resynchronization therapy in non-LBBB patients with prolonged PR-interval: MADIT-CRT long-term follow-up. Clin. Res. Cardiol. 2016, 105, 944–952. [Google Scholar] [CrossRef]
- Steffel, J.; Robertson, M.; Singh, J.P.; Abraham, W.T.; Bax, J.J.; Borer, J.S.; Dickstein, K.; Ford, I.; Gorcsan, J.; Gras, D.; et al. The effect of QRS duration on cardiac resynchronization therapy in patients with a narrow QRS complex: A subgroup analysis of the EchoCRT trial. Eur. Heart J. 2015, 36, 1983–1989. [Google Scholar] [CrossRef] [PubMed] [Green Version]
- Gasparini, M.; Leclercq, C.; Yu, C.M.; Auricchio, A.; Steinberg, J.S.; Lamp, B.; Klersy, C.; Leyva, F. Absolute survival after cardiac resynchronization therapy according to baseline QRS duration: A multinational 10-year experience: Data from the Multicenter International CRT Study. Am. Heart J. 2014, 167, 203–209. [Google Scholar] [CrossRef]
- Brenyo, A.; Rao, M.; Barsheshet, A.; Cannom, D.; Quesada, A.; McNitt, S.; Huang, D.T.; Moss, A.J.; Zareba, W. QRS Axis and the Benefit of Cardiac Resynchronization Therapy in Patients with Mildly Symptomatic Heart Failure Enrolled in MADIT-CRT. J. Cardiovasc. Electrophysiol. 2013, 24, 442–448. [Google Scholar] [CrossRef] [PubMed]
- Végh, E.M.; Kandala, J.; Januszkiewicz, L.; Ren, J.; Miller, A.; Orencole, M.; Blendea, D.; Merkely, B.; Gellér, L.; Singh, J.P.; et al. A new simplified electrocardiographic score predicts clinical outcome in patients treated with CRT. EP Eur. 2017, 20, 492–500. [Google Scholar] [CrossRef] [Green Version]
- Kamath, S.A.; Neto, J.D.P.M.; Canham, R.M.; Uddin, F.; Toto, K.H.; Nelson, L.L.; Kaiser, P.A.; De Lemos, J.A.; Drazner, M.H. Low voltage on the electrocardiogram is a marker of disease severity and a risk factor for adverse outcomes in patients with heart failure due to systolic dysfunction. Am. Heart J. 2006, 152, 355–361. [Google Scholar] [CrossRef]
- Roberts, W.C.; Kondapalli, N.; Hall, S.A. Usefulness of total 12-lead QRS voltage for diagnosis of arrhythmogenic right ventricular cardiomyopathy in patients with heart failure severe enough to warrant orthotopic heart transplantation and morphologic illustration of its cardiac diversity. Am. J. Cardiol. 2018, 122, 1051–1061. [Google Scholar] [CrossRef]
- Roberts, W.C.; Becker, T.M.; Hall, S.A. Usefulness of total 12-lead QRS voltage as a clue to diagnosis of patients with cardiac sarcoidosis severe enough to warrant orthotopic heart transplant. JAMA Cardiol. 2018, 3, 64–68. [Google Scholar] [CrossRef]
- Nagase, S.; Kamakura, T.; Kataoka, N.; Wada, M.; Yamagata, K.; Ishibashi, K.; Inoue, Y.Y.; Miyamoto, K.; Noda, T.; Aiba, T.; et al. Low-Voltage Type 1 ECG Is Associated with Fatal Ventricular Tachyarrhythmia in Brugada Syndrome. J. Am. Heart Assoc. 2018, 7, e009713. [Google Scholar] [CrossRef] [Green Version]
- Gerber, B.L.; Rousseau, M.F.; Ahn, S.A.; Waroux, J.-B.L.P.D.; Pouleur, A.-C.; Phlips, T.; Vancraeynest, D.; Pasquet, A.; Vanoverschelde, J.-L. Prognostic Value of Myocardial Viability by Delayed-Enhanced Magnetic Resonance in Patients with Coronary Artery Disease and Low Ejection Fraction: Impact of Revascularization Therapy. J. Am. Coll. Cardiol. 2012, 59, 825–835. [Google Scholar] [CrossRef] [Green Version]
- Höke, U.; Khidir, M.J.; van der Geest, R.J.; Schalij, M.J.; Bax, J.J.; Delgado, V.; Marsan, N.A. Relation of myocardial contrast-enhanced T1 mapping by cadiac magnetic resonance to left ventricular reverse remodeling after cardiac resynchronization therapy in patients with nonishchemic cardiomyopathy. Am. J. Cardiol. 2017, 119, 1456–1462. [Google Scholar] [CrossRef] [PubMed]
- Chen, Z.; Sohal, M.; Sammut, E.; Child, N.; Jackson, T.; Claridge, S.; Cooklin, M.; O’neill, M.; Wright, M.; Gill, J.; et al. Focal but not diffuse myocardial fibrosis burden quantification using cardiac mgnetic resonance imaging predicts left ventricular reverse modeling following cardiac resynchronization therapy. J. Cardiovasc. Electrophysiol. 2016, 27, 203–209. [Google Scholar] [CrossRef] [PubMed]
- Stellbrink, C.; Breithardt, O.-A.; Franke, A.; Sack, S.; Bakker, P.; Auricchio, A.; Pochet, T.; Salo, R.; Kramer, A.; Spinelli, J. Impact of cardiac resynchronization therapy using hemodynamically optimized pacing on left ventricular remodeling in patients with congestive heart failure and ventricular conduction disturbances. J. Am. Coll. Cardiol. 2001, 38, 1957–1965. [Google Scholar] [CrossRef] [Green Version]
- Bašinskas, P.; Stoškutė, N.; Gerulytė, A.; Abramavičiūtė, A.; Puodžiukynas, A.; Kazakevičius, T. Prognostication of Poor Survival after Cardiac Resynchronization Therapy. Medicina 2020, 56, 19. [Google Scholar] [CrossRef] [PubMed] [Green Version]
- Sipahi, I.; Chou, J.C.; Hyden, M.; Rowland, D.Y.; Simon, D.I.; Fang, J.C. Effect of QRS morphology on clinical event reduction with cardiac resynchronization therapy: Meta-analysis of randomized controlled trials. Am. Heart J. 2012, 163, 260–267. [Google Scholar] [CrossRef] [Green Version]
- Ypenburg, C.; van Bommel, R.; Borleffs, C.J.W.; Bleeker, G.B.; Boersma, E.; Schalij, M.J.; Bax, J.J. Long-Term Prognosis After Cardiac Resynchronization Therapy Is Related to the Extent of Left Ventricular Reverse Remodeling at Midterm Follow-Up. J. Am. Coll. Cardiol. 2009, 53, 483–490. [Google Scholar] [CrossRef] [Green Version]
- Sipahi, I.; Carrigan, T.P.; Rowland, D.Y.; Stambler, B.S.; Fang, J.C. Impact of QRS duration on clinical event reduction with cardiac resynchronization therapy: Meta-analysis of randomized controlled trials. Arch. Intern. Med. 2011, 171, 1454–1462. [Google Scholar] [CrossRef] [Green Version]
- Stavrakis, S.; Lazzara, R.; Thadani, U. The benefit of cardiac resynchronization therapy and QRS duration: A meta-analysis. J. Cardiovasc. Electrophysiol. 2012, 23, 163–168. [Google Scholar] [CrossRef] [PubMed]
- Kutyifa, V.; Stockburger, M.; Daubert, J.P.; Holmqvist, F.; Olshansky, B.; Schuger, C.; Klein, H.; Goldenberg, I.; Brenyo, A.; McNitt, S.; et al. PR interval identifies clinical response in patients with non-left bundle branch block: A Multicenter Automatic Defibrillator Implantation Trial-Cardiac Resynchronization Therapy substudy. Circ. Arrhythm. Electrophysiol. 2014, 7, 645–651. [Google Scholar] [CrossRef] [PubMed] [Green Version]
- D’Andrea, A.; Caso, P.; Romano, S.; Scarafile, R.; Riegler, L.; Salerno, G.; Limongelli, G.; Di Salvo, G.; Calabrò, P.; Del Viscovo, L.; et al. Different effects of cardiac resynchronization therapy on left atrial function in patients with either idiopathic or ischaemic dilated cardiomyopathy: A two-dimensional speckle strain study. Eur. Heart J. 2007, 28, 2738–2748. [Google Scholar] [CrossRef] [PubMed]
- Badran, H.A.; Abdelhamid, M.A.; Ibrahim, M.T.; Abdelmoteleb, A.M.; Zarif, J.K. Left atrium in cardiac resynchronization therapy: Active participant or innocent bystander. J. Saudi Heart Assoc. 2017, 29, 259–269. [Google Scholar] [CrossRef] [PubMed]
- Perrotta, L.; Kandala, J.; Di Biase, L.; Valleggi, A.; Michelotti, F.; Pieragnoli, P.; Ricciardi, G.; Mascioli, G.; Lakkireddy, D.; Pillarisetti, J.; et al. Prognostic Impact of QRS Axis Deviation in Patients Treated with Cardiac Resynchronization Therapy. J. Cardiovasc. Electrophysiol. 2016, 27, 315–320. [Google Scholar] [CrossRef]
- Fabiszak, T.; Łach, P.; Ratajczak, J.; Koziński, M.; Krupa, W.; Kubica, J. Influence of QRS duration and axis on response to cardiac resynchronization therapy in chronic heart failure with reduced left ventricular ejection fraction: A single center study including patients with left bundle branch block. Cardiol. J. 2020, 27, 575–582. [Google Scholar] [CrossRef] [PubMed] [Green Version]


| Variable | Overall (N = 47) | Non-Responders (N = 22) | Responders (N = 25) | p-Value |
|---|---|---|---|---|
| Demographics | ||||
| Age, years | 71 (62–78) | 68 (61–76) | 69 (56–79) | 0.845 |
| Male (%) | 28 (60) | 14 (64) | 14 (56) | 0.595 |
| Body mass index, kg/m2 | 20.7 (18.3–24.3) | 20.7 (19.3–23.8) | 22.1 (17.8–26.1) | 0.468 |
| Ischemic etiology (%) | 3 (6) | 3 (14) | 0 (0) | 0.056 |
| Persistent atrial fibrillation (%) | 9 (19) | 4 (18) | 5 (20) | 0.874 |
| CRT-P (%) | 8 (17) | 3 (14) | 5 (20) | 0.562 |
| Comorbidity | ||||
| Chronic kidney disease (%) | 14 (30) | 7 (32) | 7 (28) | 0.775 |
| Diabetes mellitus (%) | 7 (15) | 6 (27) | 1 (4) | 0.020 |
| NYHA functional classification IV (%) | 5 (11) | 4 (18) | 1 (4) | 0.116 |
| Pre-implantation vital signs | ||||
| Heart rate, bpm | 70.8 ± 14.7 | 71.2 ± 14.9 | 73.6 ± 16.0 | 0.615 |
| Systolic blood pressure, mmHg | 109.5 ± 19.2 | 102.8 ± 13.2 | 113.8 ± 22.6 | 0.051 |
| Diastolic blood pressure, mmHg | 62.0 (57.0–74.0) | 62.0 (59.8–75.0) | 66.0 (58.0–76.0) | 0.991 |
| Medications | ||||
| ACE-I or ARB (%) | 40 (85) | 17 (77) | 23 (92) | 0.157 |
| Beta-blockers (%) | 33 (70) | 12 (55) | 21 (84) | 0.028 |
| Diuretics (%) | 37 (79) | 17 (77) | 20 (80) | 0.820 |
| Digitalis (%) | 2 (4) | 0 (0) | 2 (8) | 0.175 |
| Inotropes (%) | 5 (11) | 4 (18) | 1 (4) | 0.116 |
| Amiodarone (%) | 18 (38) | 10 (45) | 8 (32) | 0.344 |
| Statins (%) | 14 (30) | 8 (36) | 6 (24) | 0.355 |
| Laboratory data | ||||
| Albumin, g/dL | 3.8 (3.5–4.1) | 3.8 (3.7–4.0) | 3.9 (3.6–4.1) | 0.917 |
| Total bilirubin, mg/dL | 0.6 (0.4–0.9) | 0.6 (0.4–1.0) | 0.6 (0.4–0.8) | 0.167 |
| Creatinine, mg/dL | 1.0 (0.8–1.4) | 1.1 (0.8–1.4) | 0.9 (0.8–1.3) | 0.312 |
| Estimated GFR, mL/min/1.73 m2 | 48.8 ± 18.9 | 46.7 ± 19.3 | 52.3 ± 18.3 | 0.398 |
| Sodium, mEq/L | 138 (135–140) | 138 (135–140) | 139 (135–141) | 0.433 |
| Hemoglobin, g/dL | 13.0 ± 2.1 | 12.8 ± 1.9 | 13.2 ± 2.1 | 0.567 |
| B-type natriuretic peptide, pg/mL | 313 (144–701) | 382 (126–1051) | 236 (147–657) | 0.290 |
| Echocardiographic parameters before CRT implantation | ||||
| Left atrial dimension, mm | 43.8 ± 9.1 | 47.9 ± 8.0 | 44.0 ± 9.9 | 0.157 |
| Left ventricular end-diastolic dimension, mm | 60.0 (55.5–66.0) | 62.5 (58.0–66.0) | 62.0 (55.0–73.5) | 0.918 |
| Left ventricular end-systolic dimension, mm | 51.0 (45.0–58.5) | 53.5 (46.8–59.9) | 51.0 (45.5–66.5) | 0.742 |
| Left ventricular end-systolic volume, mL | 127 (92–172) | 138 (101–173) | 124 (95–227) | 0.848 |
| Left ventricular ejection fraction, % | 29.0 (21.0–36.0) | 24.0 (19.8–35.3) | 30.0 (17.0–33.5) | 0.781 |
| Electrocardiographic parameters before CRT implantation | ||||
| QRS morphology | 0.052 | |||
| Left bundle branch block (%) | 16 (34) | 5 (23) | 11 (44) | 0.125 |
| Right bundle branch block (%) | 8 (17) | 7 (32) | 1 (4) | 0.011 |
| Intraventricular conduction disturbance (%) | 7 (15) | 4 (18) | 3 (12) | 0.553 |
| Right ventricular pacing (%) | 16 (34) | 6 (27) | 10 (40) | 0.844 |
| Axis, degree | 0 (−61–0) | −24 (−77–0) | 0 (−21–19) | 0.040 |
| QRS duration in II, ms | 165.9 ± 28.8 | 162.6 ± 28.3 | 176.8 ± 30.4 | 0.106 |
| Averaged QRS amplitude in V1–3, mV | 2.1 (1.4–3.2) | 1.5 (1.1–2.3) | 2.4 (1.7–3.4) | 0.023 |
| Averaged initial R-wave amplitude in V1-3, mV | 0.2 (0.1–0.4) | 0.3 (0.1–0.5) | 0.2 (0.1–0.4) | 0.081 |
| Averaged S-wave amplitude in V1-3, mV | 1.9 ± 1.2 | 1.3 ± 1.3 | 2.3 ± 0.9 | 0.003 |
| Averaged QRS amplitude in V4–6, mV | 1.5 (1.2–2.0) | 1.4 (1.0–2.0) | 1.6 (1.2–2.0) | 0.278 |
| Averaged initial R-wave amplitude in V4–6, mV | 0.5 (0.3–1.0) | 0.7 (0.4–1.2) | 0.5 (0.2–0.7) | 0.324 |
| Averaged S-wave amplitude in V4–6, mV | 0.8 (0.5–1.3) | 0.5 (0.4–1.3) | 1.1 (0.7–1.5) | 0.027 |
| Parameters following CRT implantation | ||||
| Left ventricular end-systolic volume, mL | 124 (70–167) | 144 (95–180) | 79 (47–167) | 0.027 |
| Reduction rate of left ventricular end-systolic volume, % | 18 ± 29 | −5 ± 21 | 37 ± 19 | < 0.001 |
| Left ventricular ejection fraction, % | 34.0 (26.0–46.0) | 28.5 (23.8–34.8) | 39.0 (28.0–47.0) | 0.025 |
| Improvement rate of left ventricular ejection fraction, % | 27 (9–49) | 13 (−5–24) | 47 (27–79) | < 0.001 |
| QRS duration in II, ms | 146.9 ± 23.3 | 151.3 ± 22.1 | 148.7 ± 23.4 | 0.694 |
| Variables | Univariable | Adjusted for BB | Adjusted for BB and SBP | Adjusted for BB, SBP, and QRS Axis |
|---|---|---|---|---|
| OR (95%CI) p-Value | OR (95%CI) p-Value | OR (95%CI) p-Value | OR (95%CI) p-Value | |
| Non-ischemic etiology | <0.001 (0–<0.001) 0.999 | |||
| Diabetes mellitus | 0.111 (0.012–1.012) 0.051 | |||
| Beta-blockers | 4.375 (1.123–17.033) 0.033 | |||
| Systolic blood pressure | 1.033 (0.999–1.069) 0.045 | |||
| QRS axis | 1.012 (1.000–1.024) 0.034 | |||
| QRS amplitude | ||||
| Averaged QRS amplitude in V1-3 | 2.039 (1.064–3.908) 0.019 | 1.977 (1.042–3.750) 0.037 | 2.028 (1.076–4.316) 0.041 | 1.861 (0.932–3.717) 0.078 |
| Averaged S-wave amplitude in V1-3 | 2.043 (1.274–4.635) 0.002 | 2.038 (1.248–4.539) 0.009 | 2.341 (1.197–4.577) 0.013 | 2.181 (1.078–4.414) 0.030 |
| Averaged S-wave amplitude in V4-6 | 3.339 (1.076–10.358) 0.022 | 5.449 (1.422–20.883) 0.013 | 4.162 (1.197–19.415) 0.040 | 3.830 (0.938–15.635) 0.061 |
| Variable | S < 1.44 mV (N = 25) | S ≥ 1.44 mV (N = 44) | p-Value |
|---|---|---|---|
| Demographics | |||
| Age, years | 70 (61–78) | 72 (62–79) | 0.500 |
| Male (%) | 17 (68) | 27 (61) | 0.582 |
| Body mass index, kg/m2 | 20.7 (18.4–23.1) | 20.6 (18.3–24.5) | 0.694 |
| Ischemic etiology (%) | 4 (16) | 3 (7) | 0.225 |
| Persistent atrial fibrillation (%) | 5 (20) | 7 (16) | 0.667 |
| History of ventricular tachyarrhythmias (%) | 8 (32) | 7 (16) | 0.119 |
| CRT-P (%) | 3 (12) | 13 (30) | 0.097 |
| Comorbidity | |||
| Chronic kidney disease (%) | 9 (36) | 17 (39) | 0.828 |
| Diabetes mellitus (%) | 4 (16) | 6 (14) | 0.789 |
| NYHA functional classification IV (%) | 2 (8) | 4 (9) | 0.877 |
| Pre-implantation vital signs | |||
| Heart rate, bpm | 68.1 ± 12.1 | 72.4 ± 15.9 | 0.252 |
| Systolic blood pressure, mmHg | 105.6 ± 15.9 | 111.7 ± 20.8 | 0.211 |
| Diastolic blood pressure, mmHg | 66.0 (56.5–75.5) | 61.0 (57.0–67.8) | 0.442 |
| Medications | |||
| ACE-I or ARB (%) | 21 (84) | 39 (89) | 0.583 |
| Beta-blockers (%) | 17 (68) | 36 (82) | 0.191 |
| Diuretics (%) | 21 (84) | 35 (80) | 0.649 |
| Digitalis (%) | 1 (4) | 3 (7) | 0.630 |
| Inotropes (%) | 5 (20) | 6 (14) | 0.488 |
| Amiodarone (%) | 10 (40) | 15 (34) | 0.624 |
| Statins (%) | 7 (28) | 14 (32) | 0.740 |
| Laboratory data | |||
| Albumin, g/dL | 3.8 (3.6–4.1) | 3.9 (3.5–4.1) | 0.935 |
| Total bilirubin, mg/dL | 0.6 (0.5–1.0) | 0.6 (0.4–0.8) | 0.184 |
| Creatinine, mg/dL | 1.0 (0.8–1.4) | 1.0 (0.7–1.4) | 0.524 |
| Estimated GFR, mL/min/1.73 m2 | 48.4 ± 19.6 | 49.0 ± 18.7 | 0.915 |
| Sodium, mEq/L | 138 (134–140) | 139 (135–141) | 0.633 |
| Hemoglobin, g/dL | 12.8 ± 1.6 | 13.1 ± 2.3 | 0.539 |
| B-type natriuretic peptide, pg/mL | 363 (152–823) | 236 (141–650) | 0.668 |
| Echocardiographic parameters | |||
| Left atrial dimension, mm | 47.0 ± 8.4 | 41.8 ± 8.9 | 0.021 |
| Left ventricular end-diastolic dimension, mm | 63.0 (56.0–66.0) | 59.0 (55.0–66.0) | 0.446 |
| Left ventricular end-systolic dimension, mm | 52.0 (47.0–58.5) | 49.0 (44.0–58.8) | 0.308 |
| Left ventricular ejection fraction, % | 27.0 (19.5–35.5) | 30.0 (21.3–36.0) | 0.536 |
| Electrocardiographic parameters | |||
| Left bundle branch block (%) | 2 (8) | 26 (59) | <0.001 |
| Right bundle branch block (%) | 9 (36) | 1 (2) | <0.001 |
| Intraventricular conduction disturbance (%) | 6 (24) | 4 (9) | 0.152 |
| Right ventricular pacing (%) | 8 (32) | 13 (30) | 0.831 |
| Axis, degree | −41 (−80–0) | 0 (−53–17) | 0.005 |
| QRS duration in II, ms | 165.6 ± 32.8 | 166.1 ± 26.6 | 0.946 |
| Variables | The Composite Endpoint | Heart Failure Readmission | Appropriate Electrical Defibrillation |
|---|---|---|---|
| OR (95%CI) p-Value | OR (95%CI) p-Value | OR (95%CI) p-Value | |
| Age | 0.946 (0.866–1.008) 0.086 | 0.998 (0.960–1.045) 0.929 | 0.861 (0.680–0.987) 0.030 |
| Male | 1.138 (0.163–10.015) 0.896 | 0.807 (0.289–2.454) 0.692 | 0.147 (0.006–1.455) 0.103 |
| Non-ischemic etiology | 0.467 (0.028–12.658) 0.601 | 1.065 (0.201–4.411) 0.935 | 0.017 (<0.001–0.984) 0.049 |
| LVEF | 0.997 (0.874–1.150) 0.966 | 0.979 (0.923–1.037) 0.477 | 0.140 (<0.001–50.128) 0.530 |
| B-type natriuretic peptide | 1.001 (1.000–1.002) 0.211 | 1.000 (1.000–1.001) 0.388 | 0.001 (<0.001–0.518) 0.023 |
| LBBB | 0.894 (0.034–14.018) 0.939 | 1.810 (0.453–6.795) 0.388 | 7.082 (0.330–338.284) 0.215 |
| Averaged S-wave amplitude in right precordial leads | 0.351 (0.007–1.138) 0.085 | 0.328 (0.157–0.615) <0.001 | 0.021 (<0.001–0.340) 0.001 |
Publisher’s Note: MDPI stays neutral with regard to jurisdictional claims in published maps and institutional affiliations. |
© 2021 by the authors. Licensee MDPI, Basel, Switzerland. This article is an open access article distributed under the terms and conditions of the Creative Commons Attribution (CC BY) license (https://creativecommons.org/licenses/by/4.0/).
Share and Cite
Kataoka, N.; Imamura, T.; Koi, T.; Uchida, K.; Kinugawa, K. A Simple Predictive Marker in Cardiac Resynchronization Therapy Recipients: Prominent S-Wave in Right Precordial Leads. Medicina 2021, 57, 815. https://doi.org/10.3390/medicina57080815
Kataoka N, Imamura T, Koi T, Uchida K, Kinugawa K. A Simple Predictive Marker in Cardiac Resynchronization Therapy Recipients: Prominent S-Wave in Right Precordial Leads. Medicina. 2021; 57(8):815. https://doi.org/10.3390/medicina57080815
Chicago/Turabian StyleKataoka, Naoya, Teruhiko Imamura, Takahisa Koi, Keisuke Uchida, and Koichiro Kinugawa. 2021. "A Simple Predictive Marker in Cardiac Resynchronization Therapy Recipients: Prominent S-Wave in Right Precordial Leads" Medicina 57, no. 8: 815. https://doi.org/10.3390/medicina57080815
APA StyleKataoka, N., Imamura, T., Koi, T., Uchida, K., & Kinugawa, K. (2021). A Simple Predictive Marker in Cardiac Resynchronization Therapy Recipients: Prominent S-Wave in Right Precordial Leads. Medicina, 57(8), 815. https://doi.org/10.3390/medicina57080815