Article

Mortality Related to Cold Temperatures in Two Capitals of the Baltics: Tallinn and Riga

1
Division of Sustainable Health, Umeå University, 901 87 Umeå, Sweden
2
Institute of Family Medicine and Public Health, University of Tartu, Ravila 19, 50411 Tartu, Estonia
3
Physiotherapy and Environmental Health Department, Tartu Health Care College, Nooruse 5, 50411 Tartu, Estonia
4
Institute of Occupational Safety and Environmental Health, Riga Stradinš University, Dzirciema 16, LV-1007 Riga, Latvia
*
Author to whom correspondence should be addressed.
Medicina 2019, 55(8), 429; https://doi.org/10.3390/medicina55080429
Submission received: 28 June 2019 / Revised: 24 July 2019 / Accepted: 1 August 2019 / Published: 2 August 2019

Abstract

:
Background and objectives: Despite global warming, the climate in Northern Europe is generally cold, and the large number of deaths due to non-optimal temperatures is likely due to cold temperatures. The aim of the current study is to investigate the association between cold temperatures and all-cause mortality, as well as cause-specific mortality, in Tallinn and Riga in North-Eastern Europe. Materials and Methods: We used daily information on deaths from state death registries and minimum temperatures from November to March over the period 1997–2015 in Tallinn and 2009–2015 in Riga. The relationship between the daily minimum temperature and mortality was investigated using the Poisson regression, combined with a distributed lag non-linear model considering lag times of up to 21 days. Results: We found significantly higher all-cause mortality owing to cold temperatures both in Tallinn (Relative Risk (RR) = 1.28, 95% Confidence Interval (CI) 1.01–1.62) and in Riga (RR = 1.41, 95% CI 1.11–1.79). In addition, significantly increased mortality due to cold temperatures was observed in the 75+ age group (RR = 1.64, 95% CI 1.17–2.31) and in cardiovascular mortality (RR = 1.83, 95% CI 1.31–2.55) in Tallinn and in the under 75 age group in Riga (RR = 1.58, 95% CI 1.12–2.22). In this study, we found no statistically significant relationship between mortality due to respiratory or external causes and cold days. The cold-related attributable fraction (AF) was 7.4% (95% CI -3.7–17.5) in Tallinn and 8.3% (95% CI -0.5–16.3) in Riga. This indicates that a relatively large proportion of deaths in cold periods can be related to cold in North-Eastern Europe, where winters are relatively harsh.

1. Introduction

With ongoing climate change, the health effects of heat waves and high temperatures have been thoroughly documented throughout the world [1], in Europe [2,3,4], and specifically in Estonia [5]. Even though it is likely that more frequent heat waves will occur in the future, the climate in the Baltics is generally cold, and the majority of deaths due to non-optimal temperatures in these areas are likely due to cold temperatures, as has been reported for neighboring countries like Sweden [6] and Finland [3]. The impact of cold temperatures on mortality is a phenomenon that is not exclusive to northern countries. It has also been reported across different temperature zones, where recent studies have shown that more temperature-attributable deaths are caused by cold than by heat [7,8,9], and effect estimates (relative risks—RRs) for cold are higher than those for heat [10,11].
The main adverse health effects that are associated with cold temperatures are cardiovascular and respiratory diseases [12,13]. Cold air has been observed to trigger vasoconstriction and bronchoconstriction, change endothelial function, and to increase blood viscosity, blood pressure and cardiac oxygen demand, leading to increased cardiovascular and respiratory hospitalization and mortality [12,14,15,16,17,18]. Estimated associations between cold days and mortality are stronger for older people [12,13,19]. Specifically in the region, Orru and Åström [20] revealed that deaths due to external causes (traffic accidents, assaults, fires) increase during extremely cold periods.
More detailed information about the effects of cold temperatures on mortality is essential for planning interventions to prevent cold-related deaths in the Baltic countries. As mentioned, the effect of temperature on mortality can vary substantially by geographical location because of the different climactic conditions, socioeconomic conditions and demographic characteristics of the population [7,10,11,12,13,21]. However, knowledge about the impact of cold temperatures on mortality in Estonia and Latvia is lacking.
Thus, the main aim of the current study is to investigate the association between cold temperatures and all-cause, as well as cause-specific, mortality in two capitals in the Baltics and to investigate if advanced age (75+) modifies the relationship. In addition, we will calculate mortality attributable to non-optimal temperatures during the cold season.

2. Materials and Methods
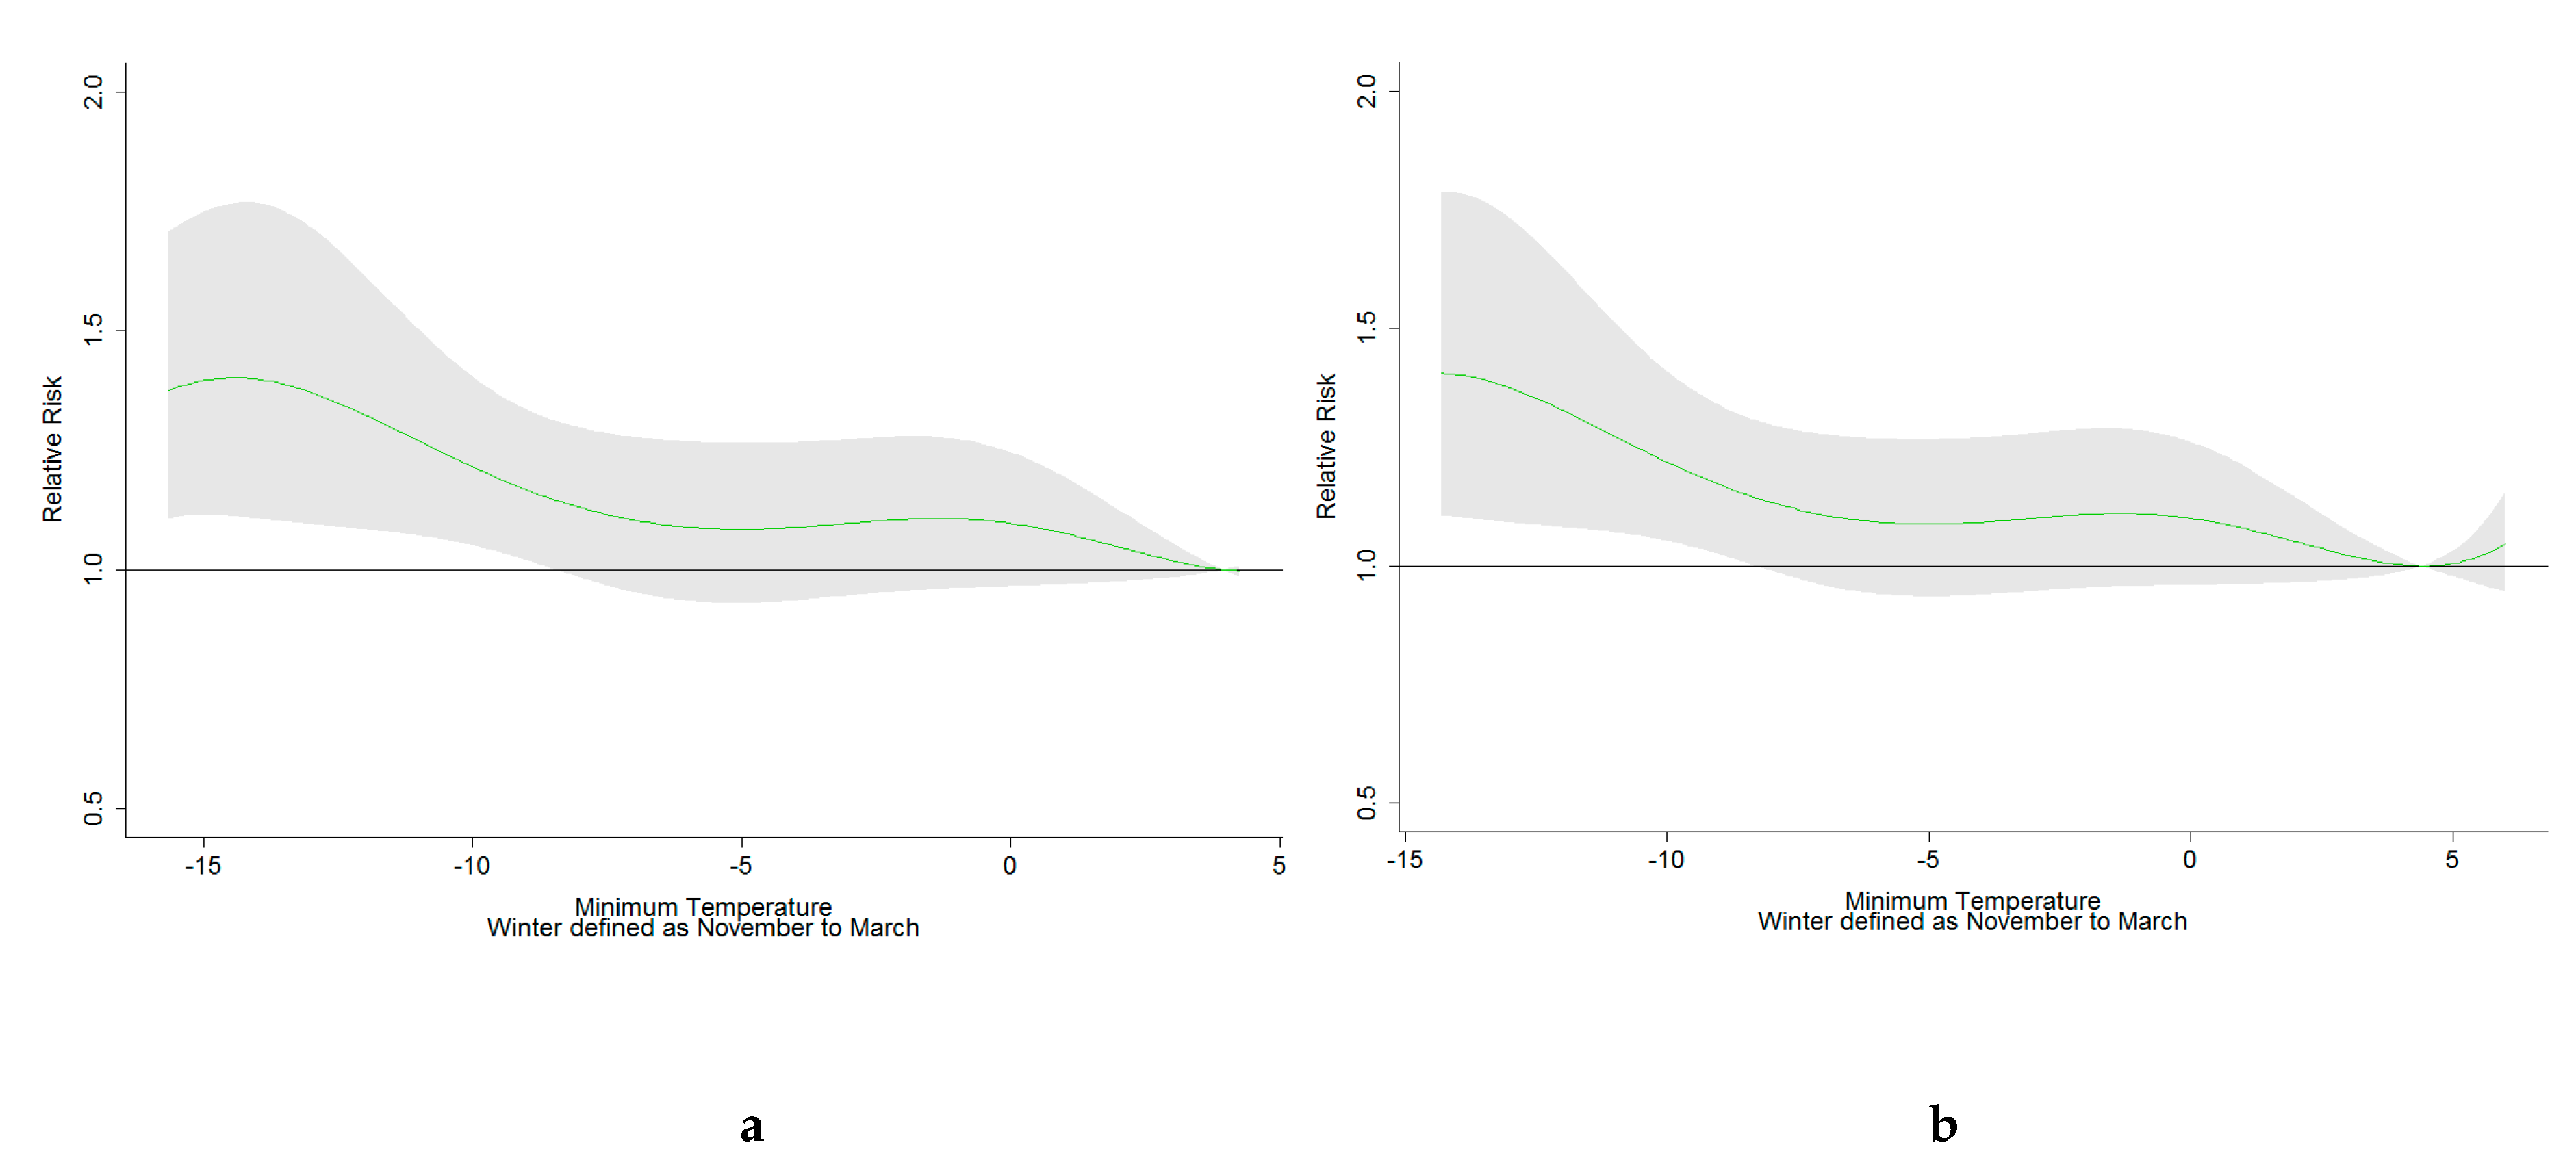
Estonia and Latvia are situated in North-Eastern Europe and are bordered by the Baltic Sea, Finland, the Russian Federation and Lithuania. These countries are in the northern part of the temperate climate zone and in a transition zone between maritime and continental climates. According to the Köppen-Geiger [22] classification of climatic zones, the area constitutes deciduous broadleaf forest (Dbf). In this study, we collected data from the capital of Estonia, Tallinn, and the capital of Latvia, Riga (Figure 1).
Daily temperature data were acquired from the Estonian Weather Service (Tallinn, Estonia) and the Latvian Environment, Geology and Meteorology Centre (Riga, Latvia) for the five winter months (from November to March) for the periods of 1997–2015 (Tallinn, Estonia) and 2009–2015 (Riga, Latvia). We used the minimum daily temperature as the exposure variable. Temperature data were complete for both meteorological stations.
We collected daily all-cause mortality data for the same periods for the two cities respectively. Data on deaths were acquired from the Estonian Causes of Death Register and the Latvian Register of Causes of Death. The study period was selected based on the availability of digital data in registries. We used all-cause mortality in the main analysis, since cold temperatures have been shown to have significant impacts on external-cause mortality in the region, and excluding it may thus underestimate the total effect of cold temperatures on mortality [20]. Furthermore, we collected daily respiratory (ICD 10 J00–J99), cardiovascular (ICD 10 I00–I99) and external-cause (ICD 10 V00–Y99) mortality counts.
We analyzed the short-term association between temperature and mortality using an overdispersed Poisson regression model. Poisson regression models with a stratum variable for date have been shown to yield identical results to those from a conditional logistic regression, which are used in a case-crossover study [23,24]. We additionally controlled for national public holidays.
To allow for the effects of temperature on mortality that are delayed in time as well as non-linear, we used a distributed lag non-linear model (DLNM) [25]. We used lag structures of up to 21 days, allowing for delayed effects on mortality [7].
For temperature and time lag, we fit a quadratic B-spline and a natural cubic spline, respectively. For temperature, two equally spaced internal knots were used and two equally spaced knots were placed on the log-scale on the time scale.
The cold season was defined as 1 November to 31 March. The results are presented for the cold season as a percentage increase in mortality using the minimum mortality temperature (MMT)—i.e., the temperature associated with the lowest rate of mortality—as a reference. To limit the influence of extreme temperatures on the MMT, we restricted the MMT to be found between the 5th and 95th percentiles of the seasonal (November to March) temperature distribution.
We calculated the total attributable fraction (AF) of mortality due to non-optimal temperatures for Tallinn and Riga and quantified the contribution of cold to mortality below the MMT. We also calculated the AF of mortality due to modestly and extremely cold days. Modestly cold days were considered to be temperatures between the MMT and the 2.5th percentile and extremely cold days were those below the 2.5th percentile [6,7].
We performed model checks by the visual inspection of normally distributed residuals. All analyses were performed with R version 3.4.0, and we used the DLNM package [26]. The study was conducted in accordance with the Declaration of Helsinki, and the initial protocol was approved by the Research Ethics Committee of the University of Tartu (197T-9), approved on 18th of October, 2010.

3. Results

As Tallinn and Riga are situated 280 km from each other on the coast of the Baltic Sea, the meteorological data show fairly similar temperatures between the two capitals (Table 1). In general, the minimum temperature was 5 degrees lower and the mean temperature 1.9 degrees lower in Tallinn as compared to Riga. During the study period, the coldest month was February (min/mean temperatures −27.3/−6.5 °C in Tallinn and −24.4/−4.9 °C in Riga), followed by January (−29.4/−5.9 °C and −23.1/−5.8 °C). The warmest months were November (−13.5/0.2 °C and −13.8/2.9 °C) and March (−21.2/−4.2 °C and −11.7/−1.0 °C). In December, the min/mean temperatures were −24.3/−3.4 °C in Tallinn and −15.3/−1.9 °C in Riga.
In total, there were 36,645 deaths in Tallinn and 27,495 deaths in Riga during the study period (Table 2).
The MMT was similar in Tallinn and Riga at 4.0 °C and 4.4 °C, respectively (Table 3). The MMT was found at the 94.2th and 89.6th percentiles of the cold season temperature distribution in Tallinn and Riga, respectively. We present the results as the cumulative relative risk (RR) over lags of 0 to 21 days, at the 5th percentile of the city-specific temperature distribution, using the city-specific MMT as a reference.
In our analyses, we could see that cold temperatures significantly increased all-cause mortality both in Tallinn and in Riga. In Tallinn, all-cause mortality increased by 28% (95% Confidence Intervals (CI): 1–62%), and, in Riga, mortality increased by 41% (95% CI: 11–79%) (Table 3). All-cause mortality increased slowly below the seasonal MMT in both cities. Due to the choice of the function used to describe mortality, the increase is not entirely linear with similar effects between 0 and −5 °C (Figure 2). In addition, significantly increased mortality due to cold temperatures was observed in the 75+ age group and among cardiovascular mortality in Tallinn and in the under 75 age group in Riga. Respiratory and external-cause mortality increased as well, but not to a significant extent.
Most of the cold mortality burden occurred during modestly cold days rather than extremely cold days. The total mortalities attributable to temperatures below the MMT were 7.4% (95% CI -3.7–17.5) in Tallinn and 8.3% (95% CI -0.5–16.3) in Riga. The AFs for modestly cold temperatures were 6.9% (95% CI -4.1–16.3) and 7.8% (95% CI -0.5–15.1) and, for extremely cold temperatures, they were 0.6% (95% CI -0.2–1.2) and 0.6% (95% CI -0.3–1.4), in Tallinn and Riga respectively.

4. Discussion

In our analysis, we could see a substantial effect of cold temperatures on mortality. Colder temperatures than the MMT during the cold season significantly increased all-cause mortality, both in Tallinn and in Riga. The all-cause mortality relative risks in Tallinn (RR = 1.28, 95% CI 1.01–1.62) are consistent with relative risk assessments in a neighboring country, Finland, where researchers identified all-cause mortality risks (RR = 1.26 and RR = 1.20) in two investigated districts [3]. In Riga, the all-cause mortality risk during the 21-day period (RR = 1.41, 95% CI 1.11–1.79) was higher than in Tallinn and in Finland, albeit not to a statistically significant extent.
Several modifiers to cold-related mortality have been suggested: macroeconomic factors (gross domestic product (GDP)); socioeconomic conditions (income poverty, income inequality, multiple deprivation, fuel poverty); household thermal efficiency; public health expenditure as a proportion of per capita GDP; education level; and influenza immunization status [19,27]. The observed differences in point estimates between Riga and Tallinn are probably not due to climate, because climate conditions in these neighboring countries are similar, and both cities are near the sea. However, the life expectancy, GDP and the share of current health expenditure in GDP during the study period were lower in Latvia than in Estonia [28]. The role of other risk factors (e.g., stress, alcohol use, access to health care and social guarantees) might be somewhat higher there, as large health inequalities still exist in Latvia [29], and the effect of cold might not be that prevalent.
Among cause-specific mortalities, this study confirms that cold temperature is associated with cardiovascular mortality, but this effect was demonstrated only in Tallinn and not to a significant extent in Riga. Cold stress promotes an increase in blood pressure and cardiac oxygen demand. Both of these causes may lead to an increase in the number of deaths due to cardiovascular reasons [12,15,16,18]. The finding of increased mortality during cold days due to cardiovascular diseases is shown in several studies (e.g., meta-analysis of cold spells by Ryti et al. [12]). Among cardiovascular diseases, acute myocardial infarctions and strokes are often related to cold temperatures [16,30]. In general, cardio-vascular mortality is very high in both cities, being somewhat higher in Riga than in Tallinn (3.3 and 2.5 cases per 1000 inhabitants during the winter period, respectively).
Contrary to previous studies, which have suggested an increase in mortality due to respiratory diseases during and after cold days [8,11,12,13,18], this study has been unable to demonstrate temperature associations with respiratory mortality in Tallinn and in Riga. In both cities, respiratory mortality increased during and after the cold, but we could not see any statistically significant effects. In the winter season, in this climate zone, a seasonal increase in respiratory tract infections prevalence has been described [28]. A possible explanation for this might be that, in general, the standardized mortality rates of respiratory diseases are much smaller in Estonia and Latvia compared to southern areas of Europe [31]. Similar results were found in Vilnius (Lithuania), where most cold-related mortality is due to circulatory rather than respiratory causes. Researchers explain that the population of Vilnius is well adapted to low temperatures, as opposed to residents of hot regions with lower physical, social and behavioral adaptation to low temperatures [32].
We did not find any statistically significant association between cold temperatures and external causes of death. Previously, Orru and Åström [20] reported that cold temperatures were associated with an increased risk of external-cause mortality. However, cold in that study was defined based on year-round data and not only on the winter months, as in the current study. In addition, a much longer lag structure was used in the current analysis, which may have impacted the results, since mortality due to external causes is not expected to have such a delayed effect. In general, in Latvia and Estonia, deaths due to external causes (traffic accidents, assault, fires) are the third largest cause of mortality after cardiovascular diseases and cancer, and thus any effect on external causes would have significant impacts on public health [28]. The effect of cold on external causes was also modified by an accident in Riga on 21 November, 2013, when the roof of a shopping mall collapsed, and 54 people died. It increased dispersion in the group of external causes and especially in the 0–74 age group.
The results in Tallinn support evidence from previous observations that cold risks are highest in the oldest age group (75+ years or sometimes also starting from 65+ years) [12,19,33,34,35,36,37]. In Riga, however, the relative risk is higher in the younger age group (0–74 years, RR = 1.58 95% CI 1.12–2.22), and no statistically significant association was found in older age groups (Table 3). However, the difference between the estimates for the two age groups did not reach statistical significance in either city. When we compared the mortality rates during the winter period in Tallinn and Riga (Table 2), they were higher in the younger age group in Riga (3.2 vs. 2.6 cases per 1000 inhabitants) and higher in the older age group in Tallinn (45.7 vs. 35.1 cases per 1000 inhabitants). This indicates that there might be relatively more vulnerable people in Riga in the younger age group that die earlier because of cold temperatures. Nevertheless, stronger cold temperature associations for those younger than 65 years old have also been found in seven cities in the United States [38].
The attributable fraction of mortality that is due to cold temperatures is in line with what has previously been reported in neighboring Stockholm, Sweden, where, during the period 2000–2013, approximately 5.4% of all-cause mortality could be attributed to non-optimal cold temperatures [6]. Åström et al. [6] used year-round data, contrary to our focus on the cold season, which would imply that our estimates of the AF of cold temperatures may actually be conservative.
As was already shown in previous studies [6,7], modestly cold days affect the attributable fraction more than extremely cold days. Temperatures below the 2.5th percentile (in Tallinn −18.3 °C and in Riga −16.5 °C) were responsible for 0.6% of cold-related deaths both in Riga and in Tallinn. Although the relative risk increases with increasingly cold temperatures, most cold-related deaths occur during days with modestly cold temperatures (MMT to 2.5th percentile).
Another mortality modifying factor related to extreme temperatures is air pollution, which might have synergistic effects with ambient temperatures [39,40]. With colder weather, air pollution is often increased by extensive heating, which can modify the cold mortality results [41,42]. Chen et al. observed higher cold-related mortality risks in European urban areas experiencing high air pollution levels, with a significant modification of the effect caused by the particle number concentration (PNC) (the ultrafine range (≤100 nm) or total PNC ≤3000 nm, as a proxy for ultrafine particles) [43]. Some studies indicate that lower temperatures, in conjunction with black smoke concentrations, increase respiratory mortality [18], but, in a study of nine European cities during the cold period, no evidence for synergy with particulate matter (PM10), ozone (O3), and nitrogen dioxide (NO2) pollution was found [39]. As in the current study, no air pollution data was available, but this effect could be analyzed in further studies.
We were not able to run sex-specific analyses to investigate if sex modified the relationships, but earlier studies have identified that temperature-mortality effects do not differ according to sex [12,38].
One might also question how climate change may alter cold-related mortality in the future. Due to climate warming, long-term projections of temperature-related mortality in Europe predict a decrease in cold-related mortality and anticipate that this decrease will start to compensate for a rise in heat-related mortality during the second half of the 21st century [44,45]. Nevertheless, Åström et al. [6] found that, despite climate warming, the cold-related attributable fraction remained stable over time during the period 1901–2013, whereas the heat-related AF decreased in Stockholm, Sweden.
Despite the climate warming that has appeared in recent decades in Estonia [46], the cold still has a considerable effect on mortality in Estonia and Latvia, and the subject should be a constant focus of public health. During the winter period, we should pay more attention to older people because they are more vulnerable during cold days (temperatures below 4 °C). Also, we have to contribute to cardiovascular disease prevention. For prevention of cold-related health effects, the proper heating and isolation of rooms have been shown to be important [47]. Arbuthnott et al. [48] showed that comfortable indoor temperatures at night are crucial to preventing cardiovascular diseases. For preventing cold-related mortality, clothing standards for outdoor workers and home energy assistance programs for low-income households are suggested. It has been shown that policies keeping people physically active have a generally positive effect on health, and they also reduce people’s vulnerability to cold weather [47,48].

5. Conclusions

Cold temperatures are a serious public health concern in Riga and Tallinn. The minimum mortality temperatures during winter months in Tallinn and Riga are 4.0 °C and 4.4 °C, respectively, and, below those temperatures, mortality starts to increase. The total mortality attributable to non-optimal cold temperatures is 7.4% in Tallinn and 8.3% in Riga. It is also important to recognize that more people die during modestly cold days than extremely cold days. A significantly increased total mortality due to cold temperatures was observed in the 75+ age group, as well as due to cardiovascular mortality in Tallinn and in the below 75 age group in Riga.

Author Contributions

D.O.A. and H.O. planned the study; H.O. and Ž.M. requested the data; D.O.A. and T.V. analyzed the data; D.K., E.I. and A.O. critically reviewed the results; D.O.A., T.V., Ž.M., D.K., E.I., A.O. and H.O. wrote the paper.

Funding

This research was supported Estonian Ministry of Education and Research, grants IUT34-17 and ETF8523.

Acknowledgments

We would like to thank the National Institute for Health Development (especially Gleb Denissov) and the Estonian Environment Agency for providing the data.

Conflicts of Interest

The authors declare no conflict of interest.

References

  1. Guo, Y.; Gasparrini, A.; Armstrong, B.G.; Tawatsupa, B.; Tobias, A.; Lavigne, E.; de Sousa Zanotti Stagliorio Coelho, M.; Pan, X.; Kim, H.; Hashizume, M.; et al. Heat Wave and Mortality: A Multicountry, Multicommunity Study. Environ. Health Perspect. 2017, 125, 087006. [Google Scholar] [CrossRef] [PubMed] [Green Version]
  2. Åström, D.O.; Åström, C.; Forsberg, B.; Vicedo-Cabrera, A.M.; Gasparrini, A.; Oudin, A.; Sundquist, K. Heat wave–related mortality in Sweden: A case-crossover study investigating effect modification by neighbourhood deprivation. Scand. J. Public Health 2018. [CrossRef]
  3. Ruuhela, R.; Hyvärinen, O.; Jylhä, K.; Ruuhela, R.; Hyvärinen, O.; Jylhä, K. Regional Assessment of Temperature-Related Mortality in Finland. Int. J. Environ. Res. Public Health 2018, 15, 406. [Google Scholar] [CrossRef] [PubMed]
  4. Graczyk, D.; Kundzewicz, Z.W.; Choryński, A.; Førland, E.J.; Pińskwar, I.; Szwed, M. Heat-related mortality during hot summers in Polish cities. Theor. Appl. Climatol. 2019, 136, 1259–1273. [Google Scholar] [CrossRef]
  5. Åström, D.O.; Åström, C.; Rekker, K.; Indermitte, E.; Orru, H. High Summer Temperatures and Mortality in Estonia. PLoS ONE 2016, 11, e0155045. [Google Scholar]
  6. Åström, D.O.; Ebi, K.L.; Vicedo-Cabrera, A.M.; Gasparrini, A. Investigating changes in mortality attributable to heat and cold in Stockholm, Sweden. Int. J. Biometeorol. 2018, 62, 1777–1780. [Google Scholar] [CrossRef] [PubMed] [Green Version]
  7. Gasparrini, A.; Guo, Y.; Hashizume, M.; Lavigne, E.; Zanobetti, A.; Schwartz, J.; Tobias, A.; Tong, S.; Rocklöv, J.; Forsberg, B.; et al. Mortality risk attributable to high and low ambient temperature: A multicountry observational study. Lancet 2015, 386, 369–375. [Google Scholar] [CrossRef]
  8. Cui, Y.; Yin, F.; Deng, Y.; Volinn, E.; Chen, F.; Ji, K.; Zeng, J.; Zhao, X.; Li, X. Heat or Cold: Which One Exerts Greater Deleterious Effects on Health in a Basin Climate City? Impact of Ambient Temperature on Mortality in Chengdu, China. Int. J. Environ. Res. Public Health 2016, 13, 1225. [Google Scholar]
  9. Gronlund, C.J.; Sullivan, K.P.; Kefelegn, Y.; Cameron, L.; O’Neill, M.S. Climate change and temperature extremes: A review of heat- and cold-related morbidity and mortality concerns of municipalities. Maturitas 2018, 114, 54–59. [Google Scholar] [CrossRef]
  10. Guo, Y.; Gasparrini, A.; Armstrong, B.; Li, S.; Tawatsupa, B.; Tobias, A.; Lavigne, E.; de Sousa Zanotti Stagliorio Coelho, M.; Leone, M.; Pan, X.; et al. Global variation in the effects of ambient temperature on mortality: A systematic evaluation. Epidemiology 2014, 25, 781–789. [Google Scholar] [CrossRef]
  11. Wang, C.; Zhang, Z.; Zhou, M.; Zhang, L.; Yin, P.; Ye, W.; Chen, Y. Nonlinear relationship between extreme temperature and mortality in different temperature zones: A systematic study of 122 communities across the mainland of China. Sci. Total Environ. 2017, 586, 96–106. [Google Scholar] [CrossRef]
  12. Ryti, N.R.I.; Guo, Y.; Jaakkola, J.J.K. Global Association of Cold Spells and Adverse Health Effects: A Systematic Review and Meta-Analysis. Environ. Health Perspect. 2016, 124, 12–22. [Google Scholar] [CrossRef]
  13. Chen, T.H.; Li, X.; Zhao, J.; Zhang, K. Impacts of cold weather on all-cause and cause-specific mortality in Texas, 1990–2011. Environ. Pollut. 2017, 225, 244–251. [Google Scholar] [CrossRef]
  14. Bai, L.; Li, Q.; Wang, J.; Lavigne, E.; Gasparrini, A.; Copes, R.; Yagouti, A.; Burnett, R.T.; Goldberg, M.S.; Cakmak, S.; et al. Increased coronary heart disease and stroke hospitalisations from ambient temperatures in Ontario. Heart 2018, 104, 673–679. [Google Scholar] [CrossRef]
  15. Ryti, N.R.I.; Mäkikyrö, E.M.S.; Antikainen, H.; Junttila, M.J.; Hookana, E.; Ikäheimo, T.M.; Kortelainen, M.-L.; Huikuri, H.V.; Jaakkola, J.J.K. Cold spells and ischaemic sudden cardiac death: Effect modification by prior diagnosis of ischaemic heart disease and cardioprotective medication. Sci. Rep. 2017, 7, 41060. [Google Scholar] [CrossRef]
  16. Sun, Z.; Chen, C.; Xu, D.; Li, T. Effects of ambient temperature on myocardial infarction: A systematic review and meta-analysis. Environ. Pollut. 2018, 241, 1106–1114. [Google Scholar] [CrossRef]
  17. Mohammad, M.A.; Koul, S.; Rylance, R.; Fröbert, O.; Alfredsson, J.; Sahlén, A.; Witt, N.; Jernberg, T.; Muller, J.; Erlinge, D. Association of Weather With Day-to-Day Incidence of Myocardial Infarction. JAMA Cardiol. 2018, 3, 1081. [Google Scholar] [CrossRef]
  18. D’Amato, M.; Molino, A.; Calabrese, G.; Cecchi, L.; Annesi-Maesano, I.; D’Amato, G. The impact of cold on the respiratory tract and its consequences to respiratory health. Clin. Transl. Allergy 2018, 8, 1–8. [Google Scholar] [CrossRef] [Green Version]
  19. Marí-Dell’Olmo, M.; Tobías, A.; Gómez-Gutiérrez, A.; Rodríguez-Sanz, M.; de Olalla, P.G.; Camprubí, E.; Gasparrini, A.; Borrell, C. Social inequalities in the association between temperature and mortality in a South European context. Int. J. Public Health 2019, 64, 27–37. [Google Scholar] [CrossRef]
  20. Orru, H.; Åström, D.O. Increases in external cause mortality due to high and low temperatures: Evidence from northeastern Europe. Int. J. Biometeorol. 2017, 61, 963–966. [Google Scholar] [CrossRef]
  21. Carmona, R.; Díaz, J.; Mirón, I.J.; Ortíz, C.; León, I.; Linares, C. Geographical variation in relative risks associated with cold waves in Spain: The need for a cold wave prevention plan. Environ. Int. 2016, 88, 103–111. [Google Scholar] [CrossRef]
  22. Peel, M.C.; Finlayson, B.L.; McMahon, T.A. Updated world map of the Köppen-Geiger climate classification. Hydrol. Earth Syst. Sci. 2007, 11, 1633–1644. [Google Scholar] [CrossRef]
  23. Lu, Y.; Zeger, S.L. On the equivalence of case-crossover and time series methods in environmental epidemiology. Biostatistics 2007, 8, 337–344. [Google Scholar] [CrossRef]
  24. Armstrong, B.G.; Gasparrini, A.; Tobias, A. Conditional Poisson models: A flexible alternative to conditional logistic case cross-over analysis. BMC Med. Res. Methodol. 2014, 14, 122. [Google Scholar] [CrossRef]
  25. Gasparrini, A.; Armstrong, B.; Kenward, M.G. Distributed lag non-linear models. Stat. Med. 2010, 29, 2224–2234. [Google Scholar] [CrossRef] [Green Version]
  26. Gasparrini, A. Distributed Lag Linear and Non-Linear Models in R: The Package dlnm. J. Stat. Softw. 2011, 43, 1–20. [Google Scholar] [CrossRef]
  27. Healy, J.D. Excess winter mortality in Europe: A cross country analysis identifying key risk factors. J. Epidemiol. Commun. Health 2003, 57, 784–789. [Google Scholar] [CrossRef]
  28. Health in the Baltic Countries. 2015. Available online: http://rahvatervis.ut.ee/handle/1/6850 (accessed on 11 June 2019).
  29. Berķe-Berga, A.; Paul, P.; Valtonen, H. Examining Health Inequalities in Latvia: A Decade of Association between Socioeconomic Position and Perceived Health Status. Biomed. Res. Int. 2017, 2017, 7541416. [Google Scholar] [CrossRef]
  30. Yang, J.; Yin, P.; Zhou, M.; Ou, C.-Q.; Li, M.; Li, J.; Liu, X.; Gao, J.; Liu, Y.; Qin, R.; et al. The burden of stroke mortality attributable to cold and hot ambient temperatures: Epidemiological evidence from China. Environ. Int. 2016, 92, 232–238. [Google Scholar] [CrossRef]
  31. Respiratory diseases statistics—Statistics Explained. Available online: https://ec.europa.eu/eurostat/statistics-explained/index.php/Respiratory_diseases_statistics#Deaths_from_diseases_of_the_respiratory_system (accessed on 13 May 2019).
  32. Martinez, G.S.; Diaz, J.; Hooyberghs, H.; Lauwaet, D.; De Ridder, K.; Linares, C.; Carmona, R.; Ortiz, C.; Kendrovski, V.; Adamonyte, D. Cold-related mortality vs. heat-related mortality in a changing climate: A case study in Vilnius (Lithuania). Environ. Res. 2018, 166, 384–393. [Google Scholar]
  33. Murage, P.; Hajat, S.; Bone, A.; Murage, P.; Hajat, S.; Bone, A. Variation in Cold-Related Mortality in England Since the Introduction of the Cold Weather Plan: Which Areas Have the Greatest Unmet Needs? Int. J. Environ. Res. Public Health 2018, 15, 2588. [Google Scholar] [CrossRef]
  34. Ruuhela, R.; Jylhä, K.; Lanki, T.; Tiittanen, P.; Matzarakis, A. Biometeorological Assessment of Mortality Related to Extreme Temperatures in Helsinki Region, Finland, 1972–2014. Int. J. Environ. Res. Public Health 2017, 14, 944. [Google Scholar] [CrossRef]
  35. Analitis, A.; Katsouyanni, K.; Biggeri, A.; Baccini, M.; Forsberg, B.; Bisanti, L.; Kirchmayer, U.; Ballester, F.; Cadum, E.; Goodman, P.G.; et al. Effects of Cold Weather on Mortality: Results From 15 European Cities Within the PHEWE Project. Am. J. Epidemiol. 2008, 168, 1397–1408. [Google Scholar] [CrossRef] [Green Version]
  36. Hu, K.; Guo, Y.; Hochrainer-Stigler, S.; Liu, W.; See, L.; Yang, X.; Zhong, J.; Fei, F.; Chen, F.; Zhang, Y.; et al. Evidence for Urban–Rural Disparity in Temperature–Mortality Relationships in Zhejiang Province, China. Environ. Health Perspect. 2019, 127, 037001. [Google Scholar] [CrossRef]
  37. Donaldson, G.C.; Witt, C.; Näyhä, S. Changes in cold-related mortalities between 1995 and 2016 in South East England. Public Health 2019, 169, 36–40. [Google Scholar] [CrossRef]
  38. O’Neill, M.S.; Zanobetti, A.; Schwartz, J. Modifiers of the Temperature and Mortality Association in Seven US Cities. Am. J. Epidemiol. 2003, 157, 1074–1082. [Google Scholar] [CrossRef] [Green Version]
  39. Analitis, A.; de’ Donato, F.; Scortichini, M.; Lanki, T.; Basagana, X.; Ballester, F.; Astrom, C.; Paldy, A.; Pascal, M.; Gasparrini, A.; et al. Synergistic Effects of Ambient Temperature and Air Pollution on Health in Europe: Results from the PHASE Project. Int. J. Environ. Res. Public Health 2018, 15, 1856. [Google Scholar] [CrossRef]
  40. Cheng, Y.; Kan, H. Effect of the interaction between outdoor air pollution and extreme temperature on daily mortality in Shanghai, China. J. Epidemiol. 2012, 22, 28–36. [Google Scholar] [CrossRef]
  41. Olstrup, H.; Johansson, C.; Forsberg, B.; Åström, C.; Olstrup, H.; Johansson, C.; Forsberg, B.; Åström, C. Association between Mortality and Short-Term Exposure to Particles, Ozone and Nitrogen Dioxide in Stockholm, Sweden. Int. J. Environ. Res. Public Health 2019, 16, 1028. [Google Scholar] [CrossRef]
  42. Shah, V.; Jaeglé, L.; Thornton, J.A.; Lopez-Hilfiker, F.D.; Lee, B.H.; Schroder, J.C.; Campuzano-Jost, P.; Jimenez, J.L.; Guo, H.; Sullivan, A.P.; et al. Chemical feedbacks weaken the wintertime response of particulate sulfate and nitrate to emissions reductions over the eastern United States. Proc. Natl. Acad. Sci. USA. 2018, 115, 8110–8115. [Google Scholar] [CrossRef] [Green Version]
  43. Chen, K.; Wolf, K.; Breitner, S.; Gasparrini, A.; Stafoggia, M.; Samoli, E.; Andersen, Z.J.; Bero-Bedada, G.; Bellander, T.; Hennig, F.; et al. Two-way effect modifications of air pollution and air temperature on total natural and cardiovascular mortality in eight European urban areas. Environ. Int. 2018, 116, 186–196. [Google Scholar] [CrossRef]
  44. Ballester, J.; Robine, J.-M.; Herrmann, F.R.; Rodó, X. Long-term projections and acclimatization scenarios of temperature-related mortality in Europe. Nat. Commun. 2011, 2, 358. [Google Scholar] [CrossRef] [Green Version]
  45. Vicedo-Cabrera, A.M.; Guo, Y.; Sera, F.; Huber, V.; Schleussner, C.-F.; Mitchell, D.; Tong, S.; de Sousa Zanotti Stagliorio Coelho, M.; Saldiva, P.H.N.; Lavigne, E.; et al. Temperature-related mortality impacts under and beyond Paris Agreement climate change scenarios. Clim. Change 2018, 150, 391–402. [Google Scholar] [CrossRef] [Green Version]
  46. Jaagus, J.; Briede, A.; Rimkus, E.; Remm, K. Variability and trends in daily minimum and maximum temperatures and in the diurnal temperature range in Lithuania, Latvia and Estonia in 1951–2010. Theor. Appl. Climatol. 2014, 118, 57–68. [Google Scholar] [CrossRef]
  47. Conlon, K.C.; Rajkovich, N.B.; White-Newsome, J.L.; Larsen, L.; O’Neill, M.S. Preventing cold-related morbidity and mortality in a changing climate. Maturitas 2011, 69, 197–202. [Google Scholar] [CrossRef] [Green Version]
  48. Arbuthnott, K.; Hajat, S.; Heaviside, C.; Vardoulakis, S. What is cold-related mortality? A multi-disciplinary perspective to inform climate change impact assessments. Environ. Int. 2018, 121, 119–129. [Google Scholar]
Figure 1. The study area and neighboring countries.
Medicina 55 00429 g001
Figure 2. Cumulative effect over lags of between 0 and 21 days for the winter months (November to March) in Tallinn (a) and Riga (b) (shading 95% CI).
Medicina 55 00429 g002
Table 1. Daily minimum temperatures (°C) for the winter months 1 over the study period for Tallinn 2 and Riga 3.
Min2.5th Percentile5th PercentileMedianMeanSD *95th PercentileMax
Tallinn−29.4−18.3−15.7−2.6−4.06.14.39.6
Riga−24.4−16.5−14.3−0.4−2.16.168.8
1 Winter is defined as the period from 1 November to 31 March. 2 The Tallinn measurements are for the period from 1 January 1997 to 31 December 2015. 3 The Riga measurements are for the period from 1 January 2009 to 31 December 2015. * SD: Standard deviation.
Table 2. Average mortality data for the period 1997–2015 in Tallinn and 2009–2015 in Riga.
Cause of Mortality or Age GroupAverage Size of Population during the YearsNumber of Deaths or People in Age Group during the Whole Study PeriodAnnual Winter Mortality Rate (per 1000 Inhabitants)Daily Number of Deaths
MeanSD *MedianMinMax
Tallinn
Total402,25036,6454.812.84.112229
Cardiovascular 18,9412.56.62.76020
Respiratory 11800.20.40.6005
External 30960.41.11.2108
0–74 18,3202.66.42.76019
75+ 18,32545.76.42.96024
Riga
Total656,87727,4956.026.05.5261079
Cardiovascular 15,0903.314.33.914328
Respiratory 8000.20.80.9107
External 16730.41.62.11054
0–74 13,3323.212.63.912365
75+ 14,16335.113.43.813326
Table 3. Cumulative Relative Risks over lags of 0 to 21 days, with 95% confidence intervals.
TallinnRiga
Cause of Mortality or Age GroupRR * (95% CI)MMT (°C)RR (95% CI)MMT (°C)
Total1.28 (1.01–1.62)4.01.41 (1.11–1.79)4.4
Cardiovascular1.83 (1.31–2.55)4.31.13 (0.86–1.49)−0.9
Respiratory2.50 (0.79–7.86)3.31.37 (0.74–2.54)−11.5
External causes1.38 (0.63–3.02)−1.01.96 (0.77–4.96)3.2
0–741.08 (0.79–1.47)2.71.58 (1.12–2.22)4.5
75+1.64 (1.17–2.31)4.31.25 (0.90–1.73)4.3
* RRs marked in bold indicate a statistically significant effect (p < 0.05).

