Article

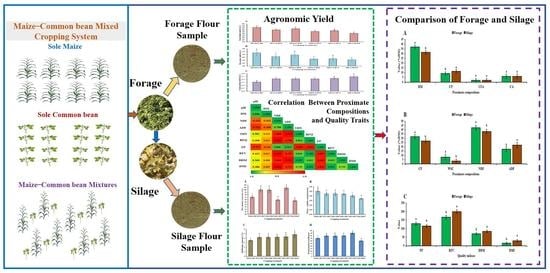
Legume Integration Augments the Forage Productivity and Quality in Maize-Based System in the Loess Plateau Region

1
State Key Laboratory of Crop Stress Biology for Arid Areas, College of Agronomy, Northwest A&F University, Yangling District, Xianyang 712100, China
2
Rice Bio Park Research Section, Post-Harvest Technology and Food Science Research Division, Department of Agricultural Research, Yezin, Nay Pyi Taw 15013, Myanmar
3
State Key Laboratory of Crop Stress Biology in Arid Areas, College of Horticulture, Northwest A&F University, Yangling District, Xianyang 712100, China
4
Key Laboratory of Plant Nutrition and the Agri-Environment in Northwest China, College of Natural Resource and Environment, Northwest A&F University, Yangling District, Xianyang 712100, China
*
Author to whom correspondence should be addressed.
Sustainability 2022, 14(10), 6022; https://doi.org/10.3390/su14106022
Submission received: 28 March 2022 / Revised: 29 April 2022 / Accepted: 10 May 2022 / Published: 16 May 2022
(This article belongs to the Special Issue Agrifood Production and Conservation Agriculture)

Abstract

:
The changing climate, inadequate water supply, insufficient agricultural inputs, decreasing in agricultural arable land areas under forage crops of Northwestern Loess Plateau region, expanding livestock population, increasing demands for meat and milk production, and food and feed security concerns all insist on a necessary requirement in forage quality production. Cereal–legume mixed-cropping is a biological approach to enhancing herbage yield and quality of upgraded animal feed (forage and silage). However, little information exists about the appropriate mixing seeding ratios and its impacts on yield and quality. Therefore, this study was conducted to examine the forage yield and nutritional quality of maize (Zea mays L.) and common bean (Phaseolus vulgaris L.) in mono-and mixed-cropping approaches at the seeding proportions of 100:0, 75:25, 50:50, 45:55, 25:75, and 0:100 in 2019 and 2020 in Northwestern Loess Plateau region. A randomized complete block design with four replicates was used in this experiment. The results indicated that forage quality was significantly affected by the mixture ratios. The land equivalent ratio (LER) of all mixed-cropping treatments greater than 1.0, in which maize–common bean at the 50:50 seeding ratio achieved higher LER (1.46) than that of other treatments, showing that mixed-cropping combination systems are better users of land resources. Laboratory forage quality analysis and Pearson correlation analysis showed that the relative feed value had highly positive correlation with total digestible nutrients and relative forage quality in mixed-cropping treatments. Our results showed that fresh forage yield and dry matter yield were higher in monocropped maize forage than in other intercropped forages, whereas crude protein yield was lower compared with other mixed cropping forages. After 60 days of ensiling, the highest organic acid profile and ammonia-nitrogen were observed in M25:CB75 silage compared with other silages. The highest ensilability of fermentation coefficient was also found in M50:CB50 compared with other intercropped silages. Regarding forage preservation, silage showed higher contents of crude protein, relative feed value and lower crude fiber, water-soluble carbohydrate neutral detergent fiber, and acid detergent fiber contents than forage. This study determined that the ratios of maize–common bean 25:75 and 50:50 were the most desirable mixture ratios among mixed-cropped forage and silage based on chemical composition and quality analysis for livestock feeding.

Graphical Abstract

1. Introduction

At present, cereal–legume cropping system-based forage cultivation mitigates the impact of greenhouse gases such as CO2, CH4, and N2O [1]. The effects of climate change such as dry spells, floods, erosion, and land degradation heavily impact agriculture, particularly smallholder systems on the Northwestern Loess Plateau region of China [1,2]. A mixed cropping system, which consists of cereal and legume mixtures, can perform a potential plant-to-plant interaction to improve the sustainability of grain and forage crop production on the Plateau. Among forage cereals, maize is the most widely cultivated economic feed crop hybrid maize in China. Based on the database of the Food and Agriculture Organization, grain maize has been abundant for the past 10 years, but the amounts of imported forage have increased in China [3]. In China, less than 3% of the overall maize acreage of 37 mi hectare (ha) was harvested for silage making in 2016 [4]. Silage maize is an important feed source for high-quality milk production not only in Inner Mongolia and Heilongjiang but also throughout the world [5,6]. Therefore, the Chinese government has driven and focused on the production of good-quality maize forage and silage since 2015. By comparing monocultures, cereal–legume mixtures have increased economic grain yield and quality forage production [6], enhanced soil fertility maintenance, increased land use efficiency, and promoted good utilization of natural resources to forage growers [7]. The cereal–legume mixed cropping system has become popular among the advances in agricultural farming systems for nature, organic, and low-input farming systems in developing countries [8]. The insufficient quality of forage crops because of low-input supply in forage production may result in constraints and serious challenges not only for forage growers but small also for ruminants. The decreasing in agricultural arable land areas due to human settlements, insufficient inputs for agricultural crop production, low diversity in cropping systems, and the persistently changing climate are further detrimental to forage production [9].
To date, most forage growers widely use cereal–legume mixed cropping patterns to achieve high-quality products of crop yield and feed on a per unit area basis. In addition, legumes are a rich protein source, which have low water-soluble carbohydrate (WSC) and dry matter (DM) and high buffering capacity (BC) [10]. Maize has high fiber and energy content [10]. Cereal, which is a heavy feeder crop, absorbs nutrients from soil by competing with companion legume crops and obtains additional N through N-fixation by the legume, whereas in the case of deficient situations, N is added by legumes in the soil through cereal–legume combinations [11]. Moreover, cereal–legume mixed cropping of small and marginal farmers in developing countries utilizes natural resources, thereby reducing incidence of pests and diseases, suppressing weed growth, maintaining soil moisture loss, enhancing soil conservation, and improving farm economy [11].
Furthermore, the cultivation of cereal–legume mixtures utilizes natural resources (water, light, soil organics, etc.) and returns to individual crop species, thereby increasing the total yields and stability of yield [12]. At present, the cereal–legume mixed cropping system has emerged as a biologically viable and economically attractive option for herbage production in arid regions. The suitable crops/varieties for a region obtain the highest fresh biomass yield from cereal and legume mixtures in the mixed cropping system [11]. However, the total biomass yield of mixtures and crop nutritional quality mainly depend on the selected companion crop species and their relative ratios in mixed grown crops. The seeding ratios of barley and pea in 50:50 and 25:75 ratios showed 50% higher biomass yield than monocultures, owing to better ability to capture and utilize resources during the growing season than those of monoculture system [13]. Sorghum-mixed seeding with lima bean in an 80:20 ratio obtained higher biomass yield by suppressing weeds and conserving nutrient losses from soil [14]. It was also inferred that mixed seeding persisted more effectively in transferring of N to cereal than row or relay intercropping systems [15]. Research on seed blending of barley and faba bean in 70:30 ratios has recorded 52% higher herbage [16]. By contrast, sorghum–cowpea intercropping in a 100:100 seed ratio produces 18% higher biomass yield than other seed mixing ratios [17]. Soufan and Al-Suhaibani [13] also reported that the ratio of barley and pea with 50:50 and 25:75 produced higher herbage yield and the best quality of forage. However, Iqbal et al. [18] stated that intercropping of cereals with legumes at a seeding ratio of 100:50 had greater herbage yield and nutritional quality than other seeding ratios because of the low competition among the members of different crop species for its growth resources. The seed mixing ratio of sorghum and rice bean (70:30) has recorded higher forage yield and greater nutritional quality than other seed mixing ratios [19]. Therefore, seeding ratios of mixture cropping of cereals with legumes must be enhanced to overcome inter-and intraspecific competition for natural environment and crop growth resources. Previous studies have also investigated cereal crop mixed cropping with several legumes to improve the chemical composition and crude protein (CP), upgrade the quality, and increase the biomass yield of maize forage and silage [20]. Maize silage quality can be upgraded by using different silage additives, inoculants, and organic and inorganic chemicals [21]. These different types of additives not only can stimulate microbial activities in making good-quality silage but also can enhance silage preservation [22]. However, obtaining additives to improve silage quality for ruminant feed is difficult, especially for small holder livestock feeding systems. Therefore, optimal silage additives and conflicting findings on seeding ratios of cereal–legume mixed cropping systems require more studies, particularly in arid and marginal regions of China, where natural resources for agriculture are insufficient.
It was hypothesized that mixed cropping of maize and common bean might exhibit varying impacts on the herbage yield of companion crops and on the nutritional quality of preserved fodder such as forage and silage under the Loess Plateau region. Therefore, the present study was conducted to investigate the impacts of seed mixture ratios of maize (Zea mays L.) and common bean (Phaseolus vulgaris L.) on the produced forage biomass yield and nutritional quality. This study also aimed to find the suitable productive mixture ratio to enhance the biomass yield and nutritional values in prolific animal feeding of forage and silage for animal growers in Loess Plateau region.

2. Materials and Methods

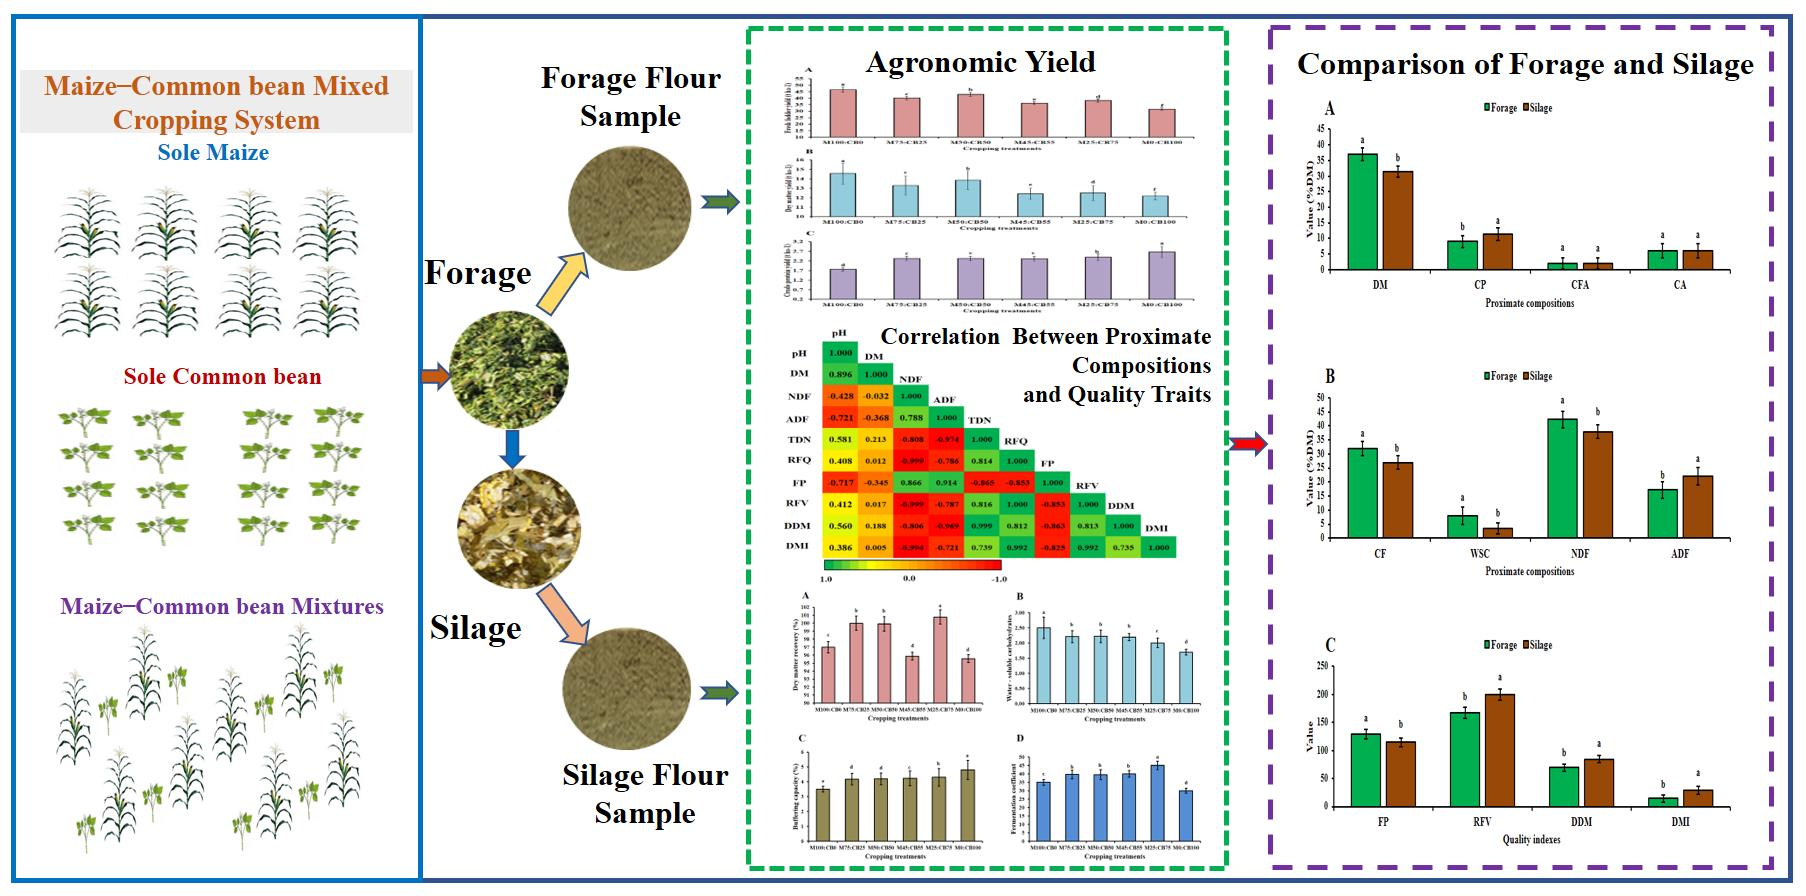
2.1. Experimental Location, Treatments, and Design

This experiment was conducted at the North campus experimental area (108°5′ E, 34°18′ N) of the Northwest Agriculture and Forestry University, Yangling, Shaanxi Province, China. Yangling was characterized by a semi humid climate type. The average temperatures during the growing seasons were 33.5 °C and 36.0 °C in 2019 and 2020, respectively (Figure 1). Precipitation that occurred at the study site during the growing season in 2019 (6.5 mm) and in 2020 (10.3 mm) was included. The experimental soil of Yangling was Loess soil [23]. Soil chemical analysis was performed according to the method described by Piper [24]. The soil had a pH of 8.30, organic matter of 13.34 g kg−1, total nitrogen of 0.63 g kg−1, available phosphorus of 5.49 mg kg−1, and available potassium of 108.32 mg kg−1 in the topsoil layer (0–40 cm). Winter wheat was the previous crop in both growing seasons, which was harvested on 17 May of each year. Afterward, wheat straw and debris were removed from the experimental field.
Summer hybrid maize (cv. Zheng Dan 958) and a local and annual variety common bean (var. Jin Jia Dou) were applied in this study. The maturity dates of maize and common bean were 90 to 110 days and 65–70 days, respectively. The experimental seeds of maize and common bean were supplied by the Northwest Agriculture and Forestry University. This experiment consisted of six mixing ratios of maize (M) and common bean (CB) viz., 100% maize, 75% maize: 25% common bean, 50% maize: 50% common bean, 45% maize: 55% common bean, 25% maize: 75% common bean, and 100% common bean. The plot size of each treatment was 12 m × 5 m. The sowing seed rates of maize and common bean monocrops were 20 and 85 kg/ha, respectively. These rates were within the recommended seeding rates for forage production in Loess Plateau regions. However, the optimum seeding rates of maize and common bean in a mixture remain unknown. Therefore, we used different ratios of seed mixtures of each crop based on their seed weights. A randomized complete block design replicated four times was used in this experiment from 2019 to 2020.

2.2. Planting, Forage Production, and Yield Calculation

After removing winter wheat debris, the experimental field was tilled two times using a disc plow before planting in both years. Based on the soil analysis results, all plots were fertilized using the recommended fertilizer (N, P, and K) before planting and soil incorporated at 60, 70, and 70 kg ha−1 in 2019 and 70, 70, and 70 kg ha−1 in 2020. Both maize and common bean were seeded on 12 June 2019 and on 11 June 2020. The seeds of maize and common bean were grown to a depth of approximately 7 and 5 cm, respectively, by hand in both years. None of the common bean seeds was treated with commercial Rhizobium before planting. Weeds were managed by hand, and neither herbicides nor pesticides were used. Irrigation was applied as needed according to soil moisture and rainfall. The trials were irrigated almost every week. The field capacity was reached in each irrigation. A sickle was used to harvest fresh forages in both growing seasons; maize reached the milk (R3) stage of maturity, whereas common bean was at the pod formation stage. At the maize reproductive stage of R3, 1 m2 in three sampling areas of each plot was harvested for the determination of chemical composition and forage and silage quality analyses.
The harvested maize and common bean fodder were cut using a power chaff cutter (JB 400, Gujarat, India) with a theoretical cut length of 2–3 cm and weighed separately using a digital balance. After total fresh weight was recorded, common bean was separated from maize (in maize–common bean mixed treatments) and weighed separately. Then, a subsample of 500 g of fresh forage was collected from each harvested plot for each species, weighed, and dried in an oven (GZX-9140MBE, Shanghai Boxun Co., Ltd., Shanghai, China) for 48 h at 80 °C and then at 65 °C until the weight became constant. Dry and fresh weights were used to estimate fresh fodder yield (t ha−1), DM percentage, and DM yield (t ha−1) [13,25]. Dry samples were ground using a sample grinder (FW-200, Beijing Zhong Xing Wei Ye Instrument Co., Ltd., Beijing, China) to pass through a 1 mm screen for further chemical and quality analysis. The CP content was analyzed using an automatic Kjeldahl nitrogen apparatus (Kjeltec 2300 Auto-Analyzer, FOSS Analytical AB, Hoganas, Sweden) in accordance with the method described by the Association of Official Analytical Chemists procedures (AOAC 2000). The calculated data of CP percent were used for converting into t ha−1. Land equivalent ratio (LER) was calculated using the following equation: LER = (intercrop 1/monocrop 1) + (intercrop 2/monocrop 2) [26]. The resulting data is a ratio that shows the amount of land needed to grow both component crops together compared to the amount of land needed to grow sole crop of each. A LER of 1.0 indicates that the two intercropped species make alike demands on the same limiting resources. A LER more than 1.0 reveals an intercropping advantage or a demonstration that interspecific facilitation is higher than interspecific competition so that intercropping results in greater land-use efficiency. A LER under 1.0 reveals mutual antagonism in the intercropping system. As a result, a LER less than 1.0 has no intercropping advantage and indicates that interspecific facilitation in the intercropping system [26].

2.3. Silage Preparation and Ensiling of Samples

The sub-samples of each chopped plant (3 kg) were immediately collected and packed in fermentation polythene bags with a dimension size of 0.6 m × 0.3 m. The samples without silage additive or inoculant were manually pressed into polythene bags during silage preparation. The compacted sample plastic bags were vacuum sealed and allowed to ferment at room temperature (~25 °C) for 60 days. After the ensiling period, 500 g of well-preserved silage was collected from the center of each plastic bag for further determination of chemical compositions. The silage samples were then dried in a forced-air drier at 105 °C for 24 h. Finally, the well-dried samples were ground to pass through a 1 mm sieve for further silage chemical composition and quality analysis.

2.4. Determination of Chemical Compositions of Fresh Fodder and Silage

A subsample of 30 g of samples was placed in a blender (FS-2, Changzhou Xinhang Instrument Industry, Jiangsu, China), diluted with 300 mL of distilled water, and well homogenized for 2 min. Then, the samples were passed through a four-layer cheesecloth. The extracted aqueous solution of pH was analyzed using an electrode meter (Five Easy Plus FE28, Mettler Toledo Co., Ltd., Shanghai, China). Then, 20 mL of the filtrate was kept at 20 °C for further analyses. Crude ash (CA) content was determined using a muffle furnace (Nabertherm, Lilienthal, Germany) at 550 °C for 2 h in accordance with the method reported by Matsoukis et al. [27]. Crude fat (CFA) and crude fiber (CF) were determined via a standard method of AOAC [28]. Neutral detergent fiber (NDF), acid detergent fiber (ADF), and acid detergent lignin (ADL) were determined in accordance with the method described by Van Soest et al. [29] using an Ankom fiber analyzer (A220, ANKOM Technology, Macedon, NY, USA).

2.5. Calculations and Laboratory Quality Analysis of Forage and Silage

The percentage of total digestible nutrients (TDN) for forage was estimated in accordance with the recommended NRC 2001 system using the following equation: TDN% = 87.84 − (0.70 × ADF%). Relative forage quality (RFQ) was calculated as reported by Undersander [30]. The following equation was used to calculate RFQ: RFQ = (TDN, % of DM × DMI, % of BW)/1.23, where the divisor (1.23) represents the mean and range values of the relative feed value (RFV). Water-soluble carbohydrate (WSC) was determined by using enthrone sulfuric acid colorimetry [31]. Buffering capacity (BC) was determined using the method of Wang et al. [32]. The fermentation coefficient (FC) of an ensiling sample was calculated using the following equation: FC = DM (%) + 8 WSC/BC, and a score value showed the ensilability of a sample (≥45, good; >45 > 35, medium; ≤35, weak) [33]. Flieg’s point (FP) score has been widely used for the determination of forage and silage quality. FP was calculated using the following formula: FP = (220 + [(2 × %DM) − 15] − 40 × pH), and FP scores of a sample, including >80, 61–80, 41–60, 21–40, and 0–20, represent excellent, good, medium, weak, and poor silage quality, respectively [34]. Digestible dry matter (DDM) and dry matter intake (DMI) were calculated using the following formula: DDM = 88.9 − (0.779 × ADF%), and DMI (% of body weight) = 120/(NDF%), respectively [35]. The following formula was used in calculating the RFV value index: RFV = (DDM × DMI)/1.29. Dry matter recovery (DMR) was determined in accordance with the procedure previously described by Kızılşımşek et al. [36].

2.6. Organic Acid Profiles of Silage

The profiles of organic acids, including lactic acid (LA), acetic acid (AA), propionic acid (PA), and butyric acid (BA), were analyzed using high-performance liquid chromatography as previously reported [37]. The ratio of LA:AA was obtained by dividing LA by AA. Ammonia nitrogen (AN) concentration was determined using the method developed by Broderick and Kang [38].

2.7. Statistical Analysis

The yield data, chemical composition, and quality analysis of forage and silage were analyzed using one-way-ANOVA on SPSS version 22.00 (IBM Co., Chicago, IL, USA). Duncan’s multiple range test was performed to compare the treatment means. Repeated measurements were used during the study within each experimental treatment to assess the chemical composition and quality analysis. Difference at p < 0.05 was considered significant.

3. Results and Discussion

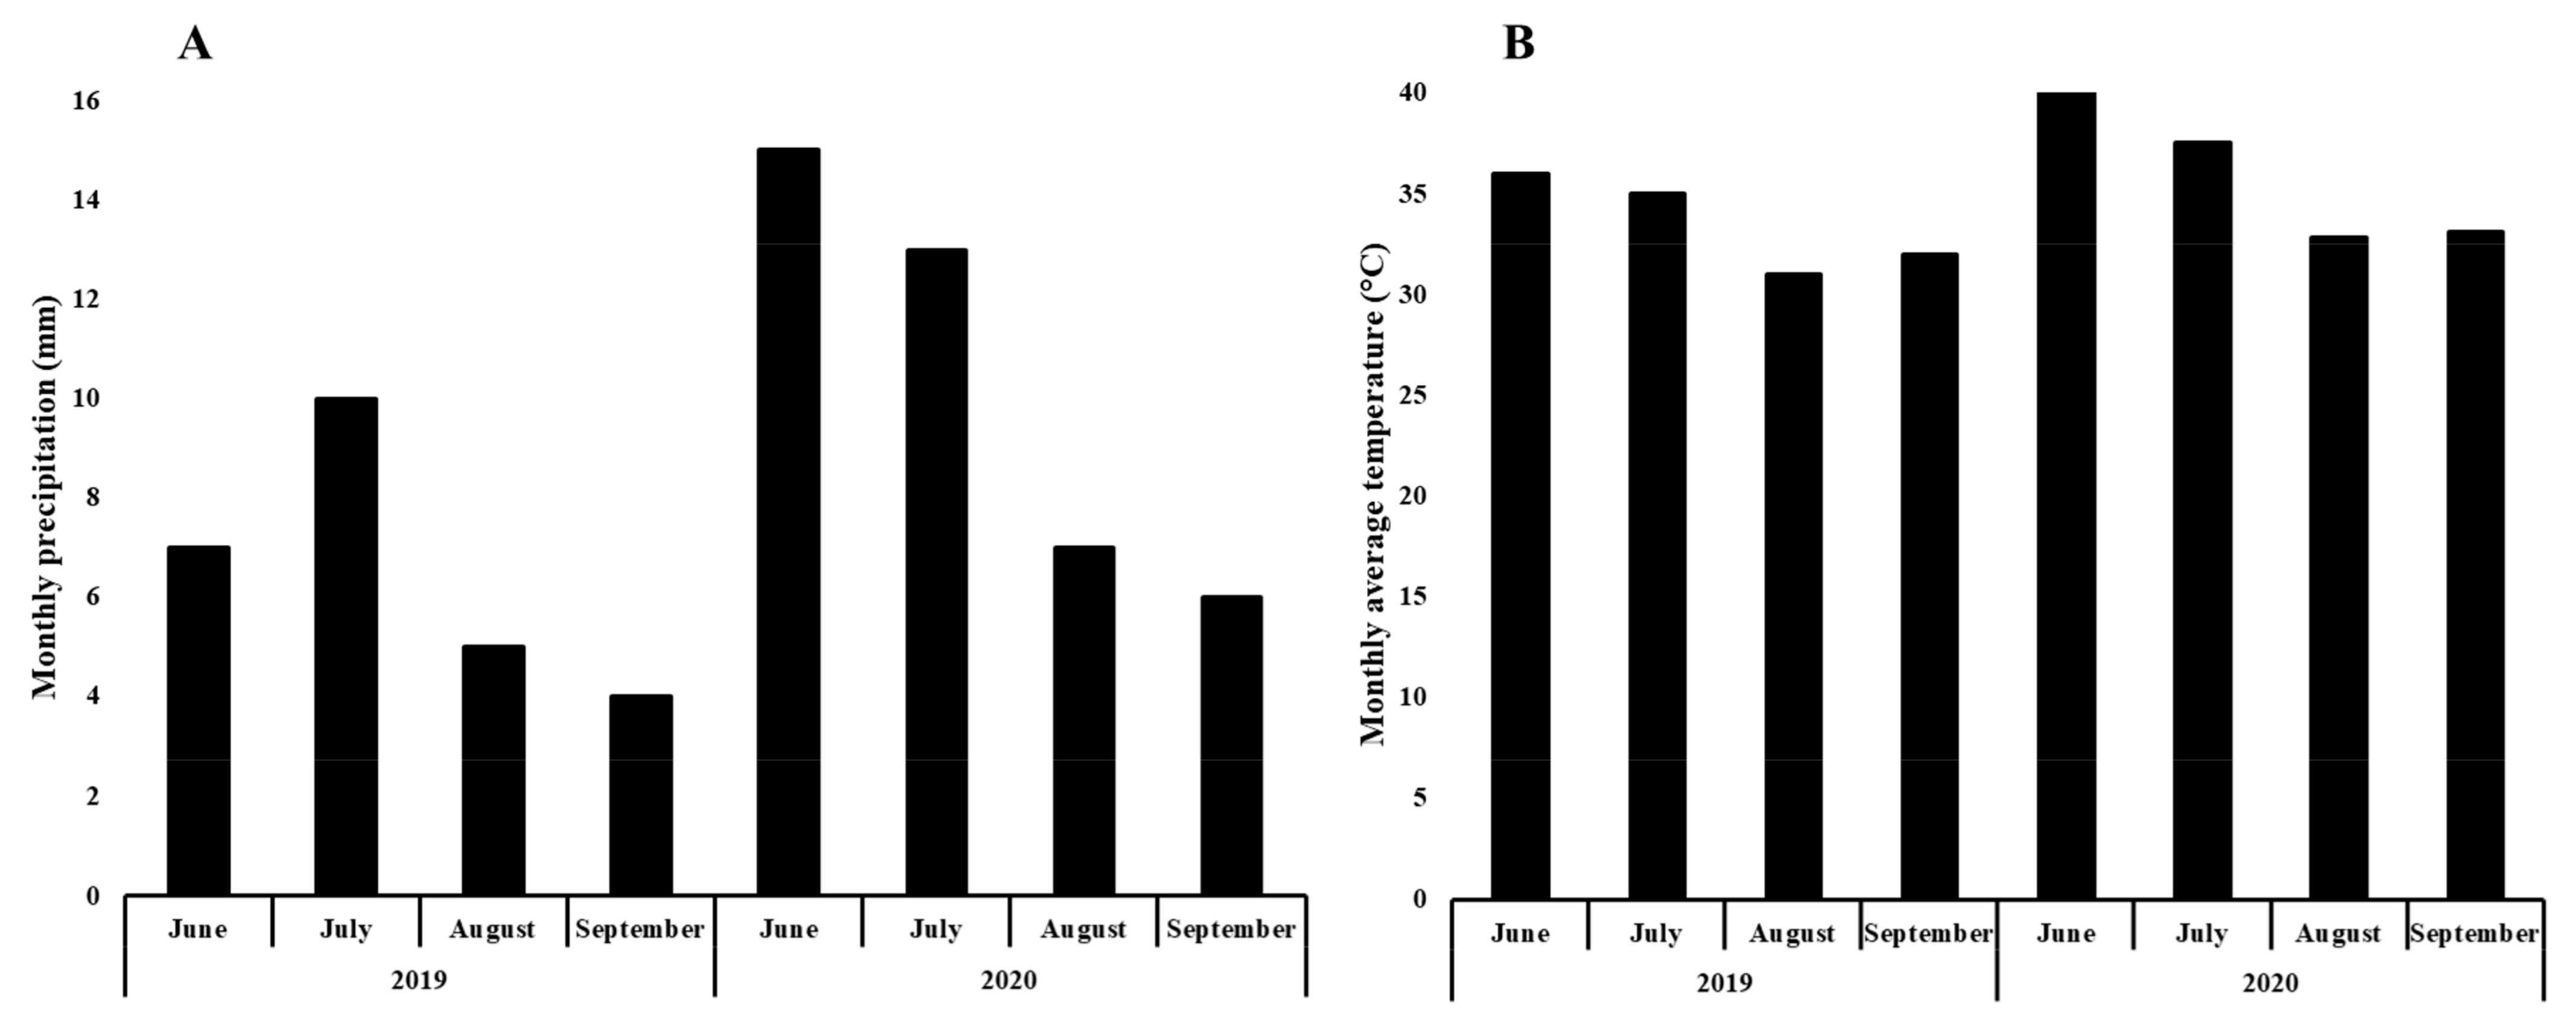
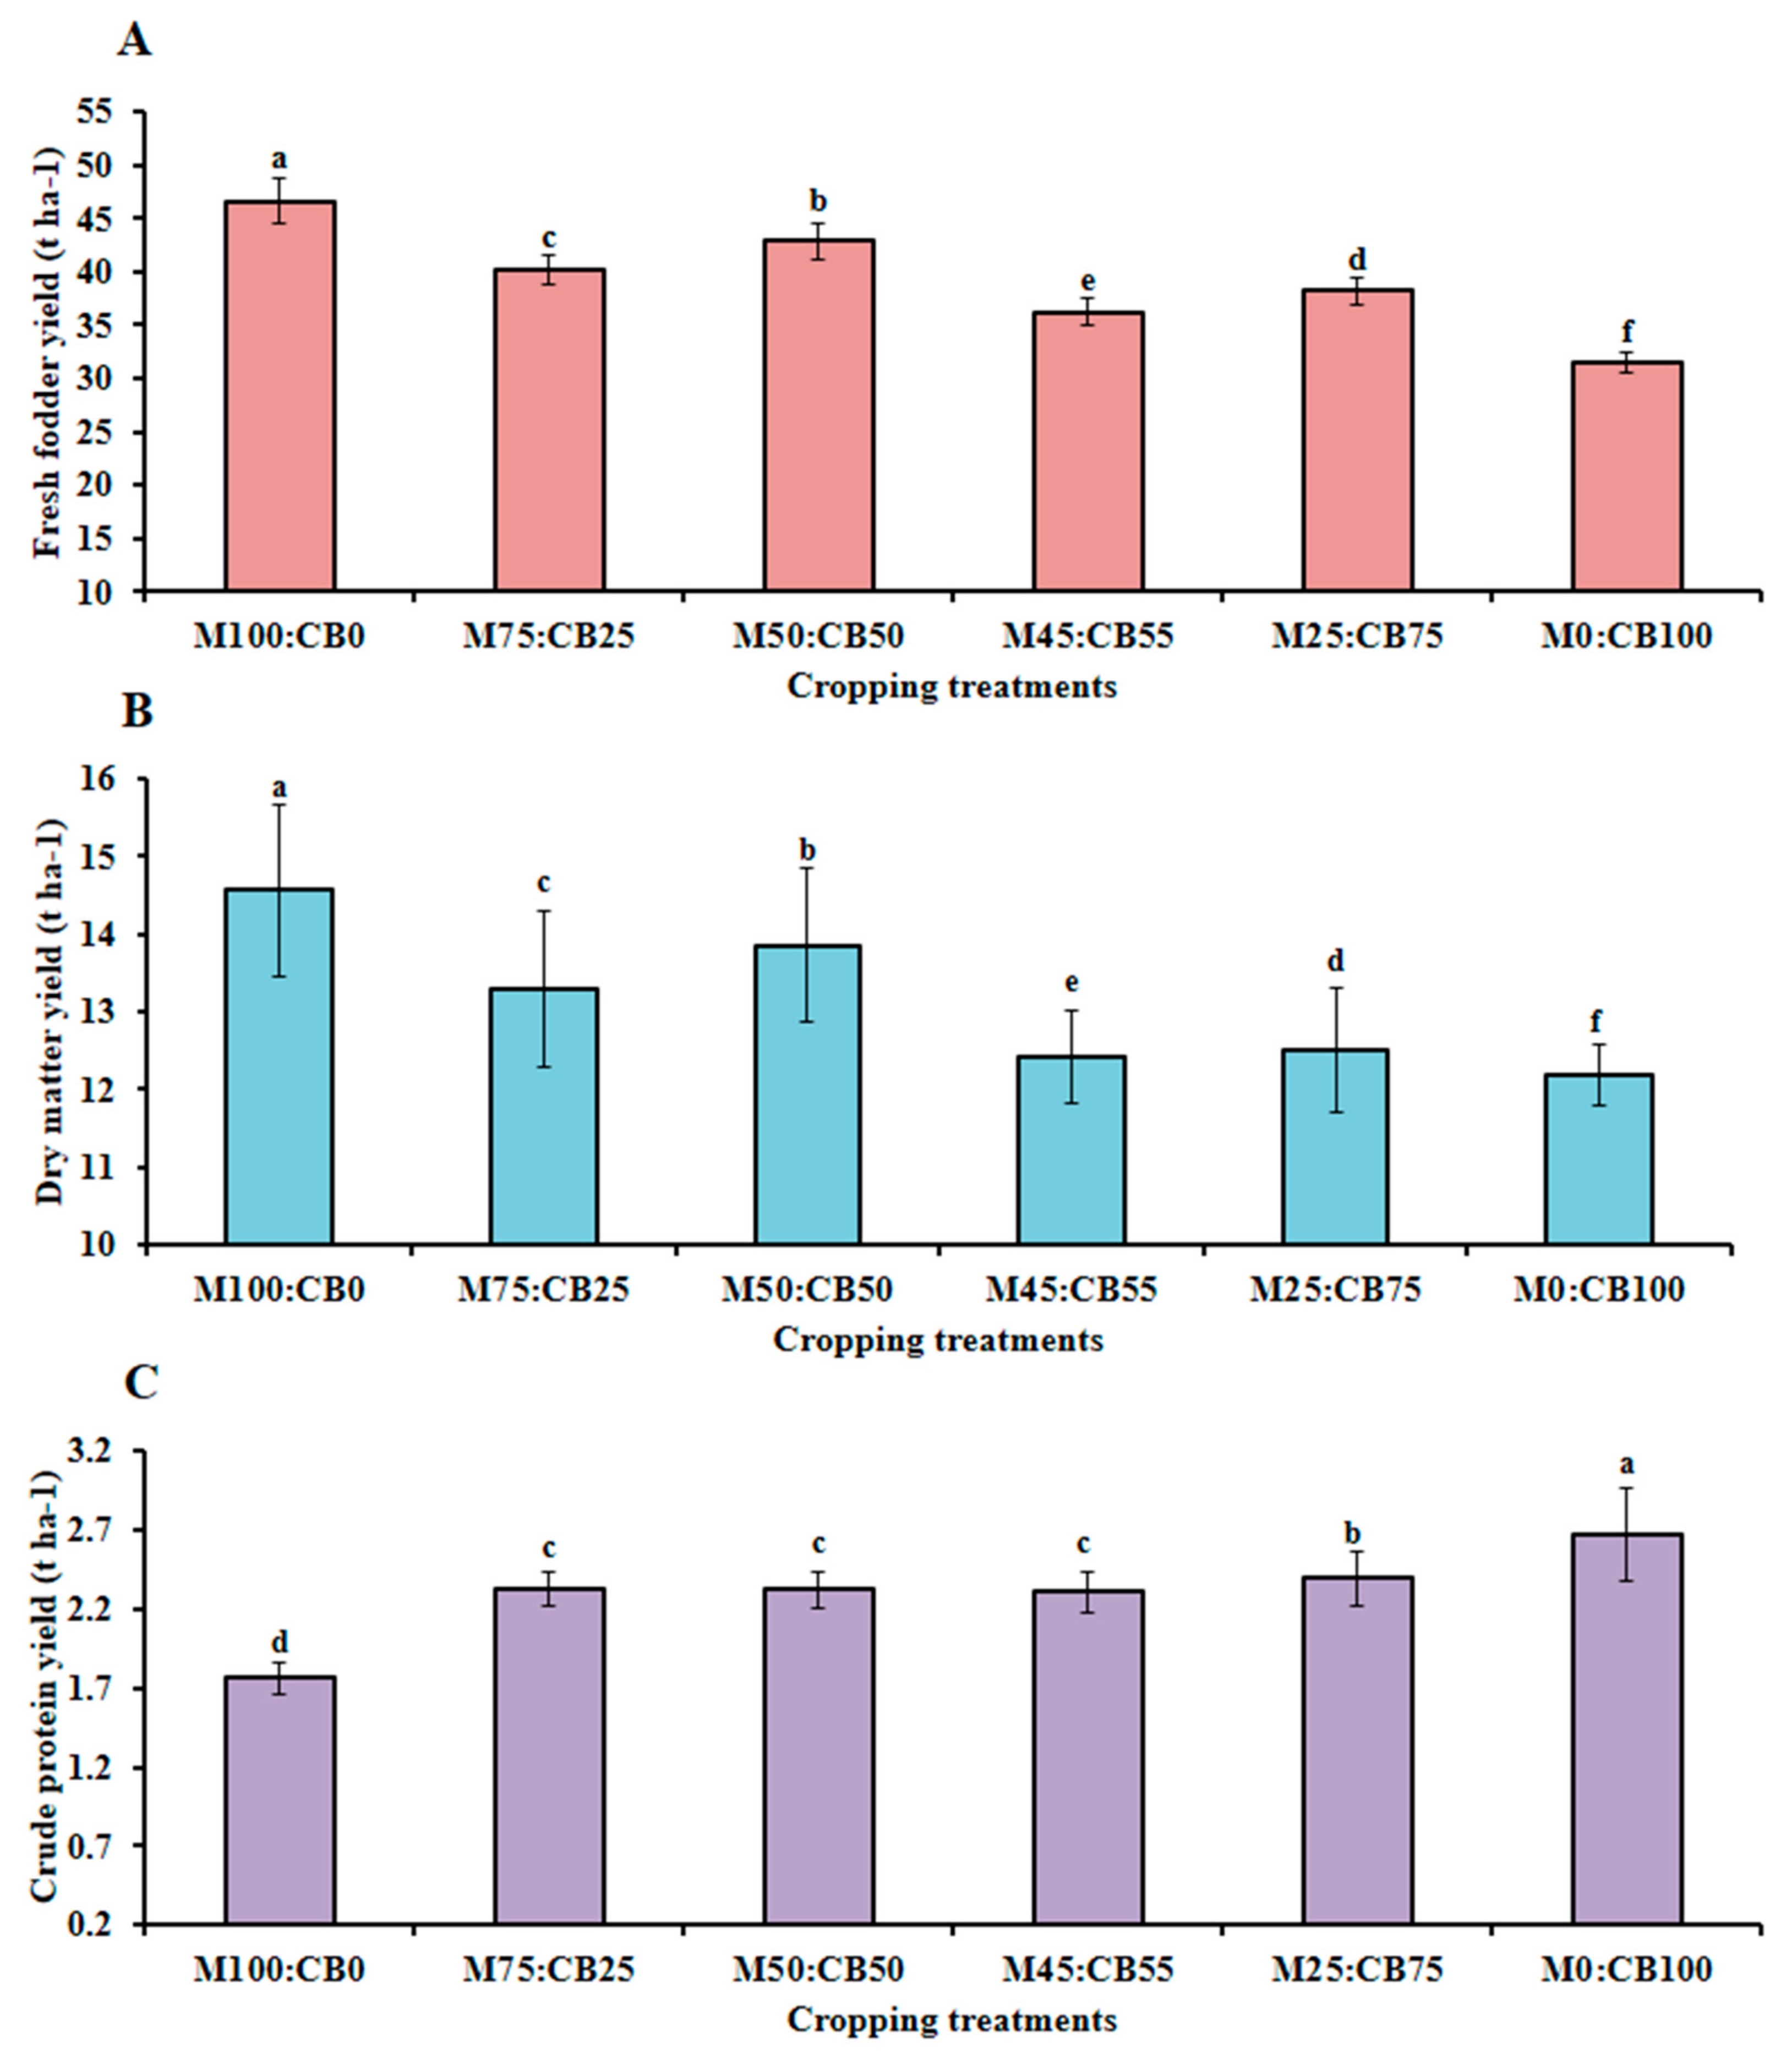
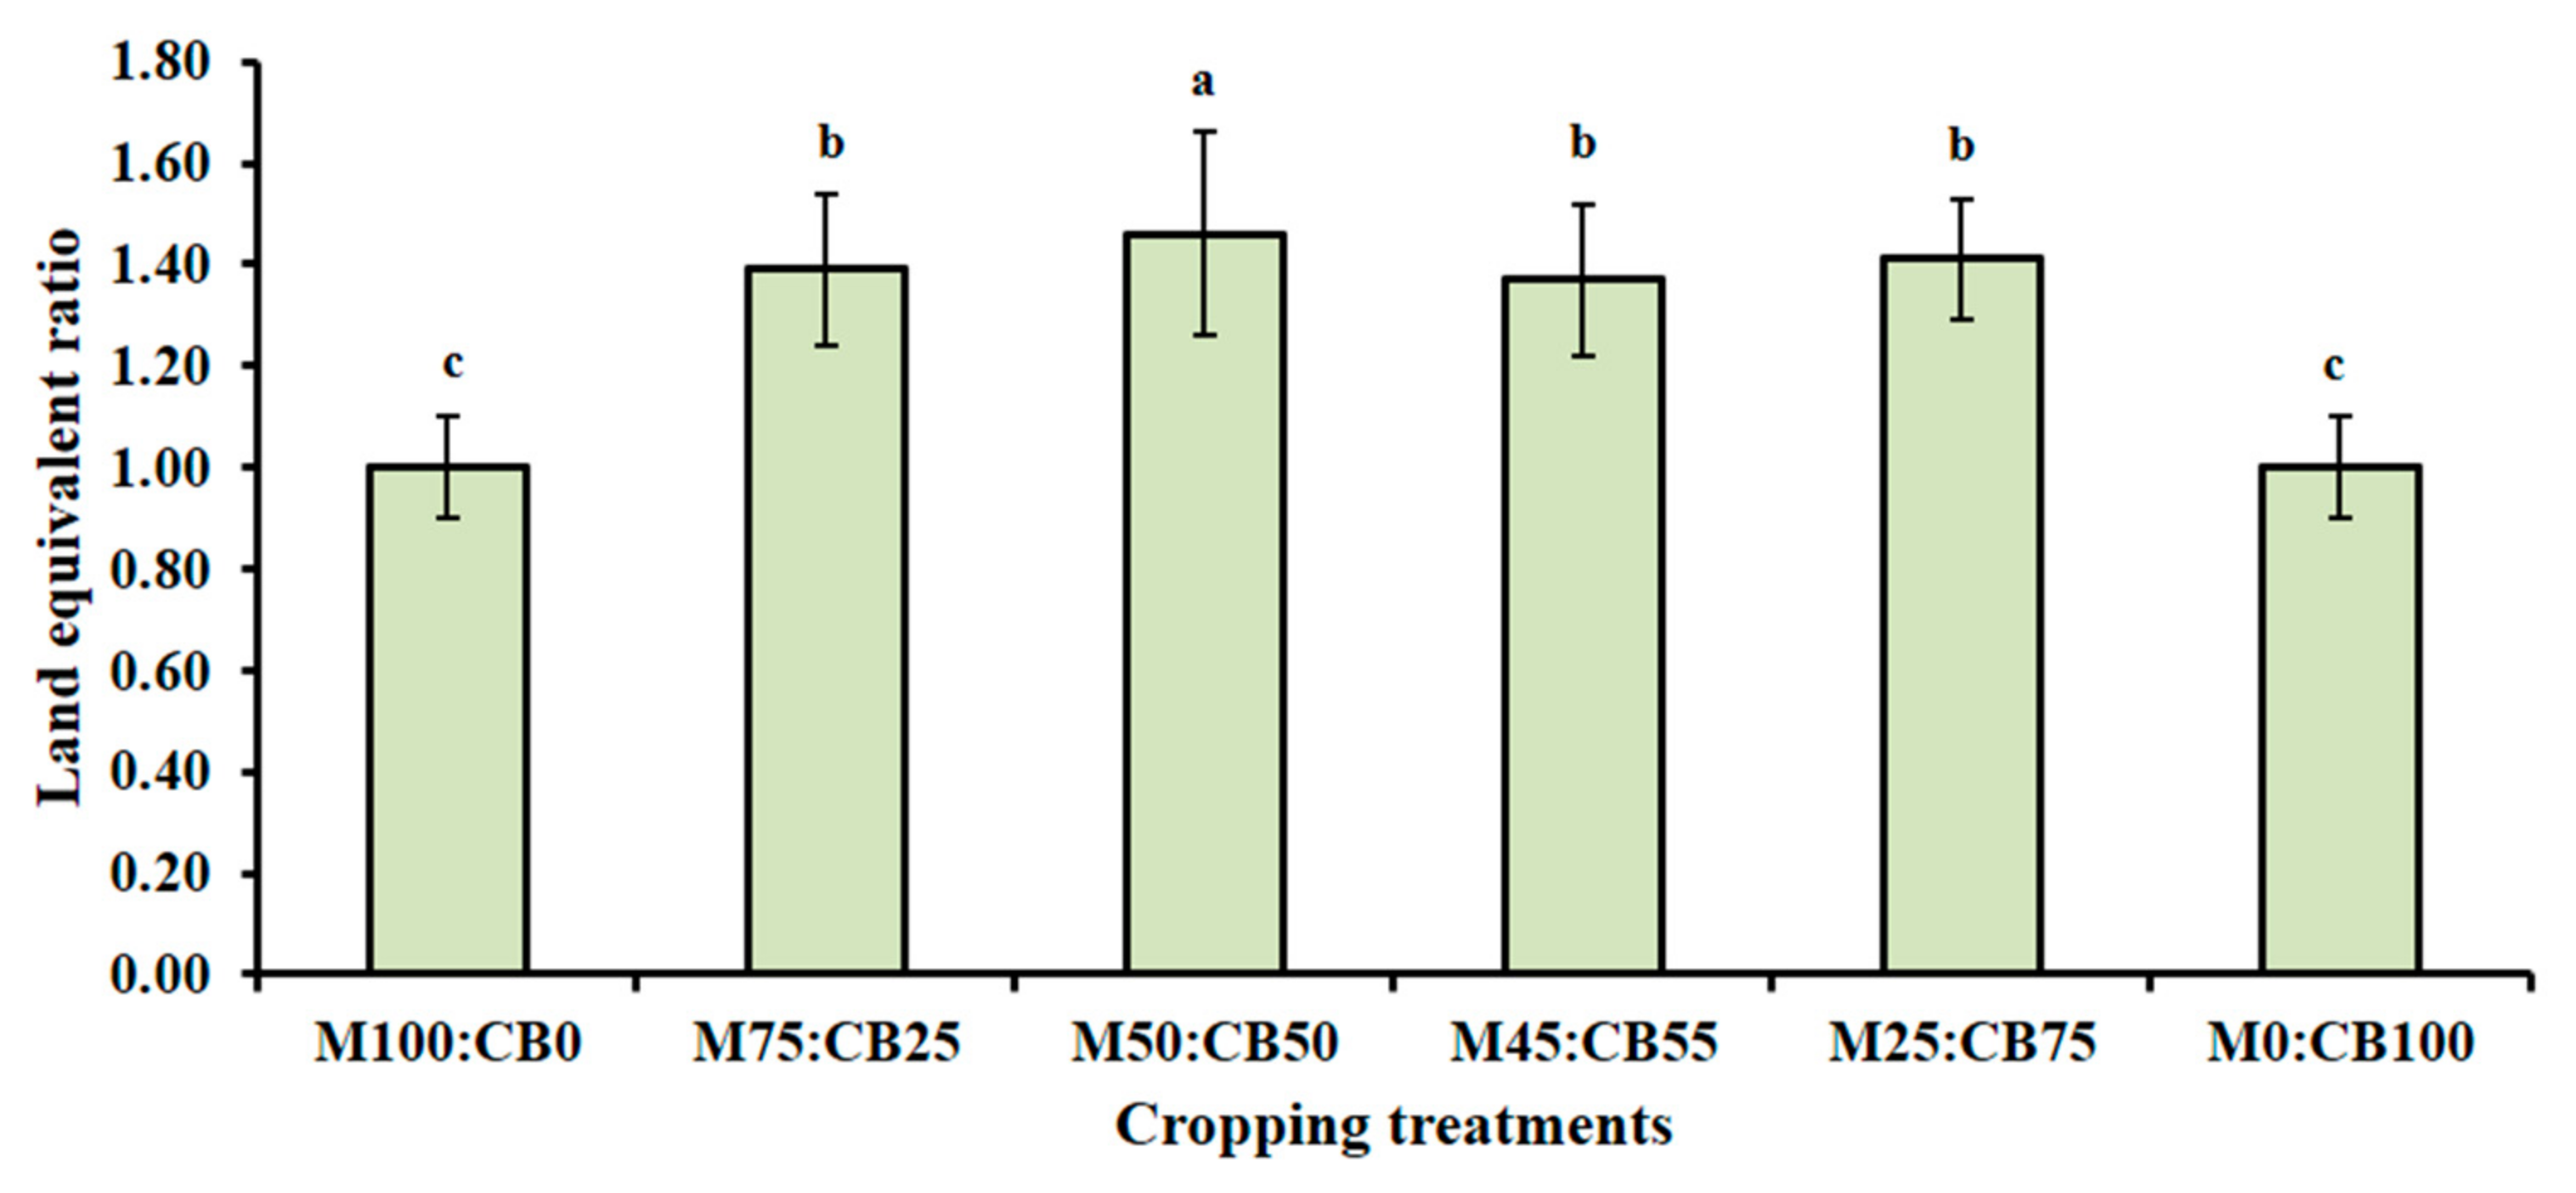
3.1. Fresh Forage Yield, Dry Matter Yield, Crude Protein Yield, and Land Equivalent Ratio

The averaged over years of fresh forage, DM, and CP yields of maize–common bean treatments are shown in Figure 2. Fresh forage yields were significantly different among cropping treatments (ranging from 31.42 to 46.61 t ha−1). The highest FFY (46.61 t ha−1) was recorded in maize–common bean cropping treatment (at 100:0 seeding ratio), whereas the lowest value was observed in the monocrop common bean treatment (31.42 t ha−1) as shown in Figure 2A. DMY is an important parameter for the determination of forage quality [39]. The DMY of maize–common bean mixed-cropping treatments ranged from 12.19 t ha−1 to 14.56 t ha−1. The highest DMY (14.56 t ha−1) was found in sole maize (100:0 seeding ratio) compared with the other mixed forages in Figure 2B. This difference in DMY contents may be due to the effect of the harvesting stage of maturity [40]. Sole maize produced higher FFY and DMY than maize intercropped with soybean [40] and cowpea [41]. The high FFY in sole maize might be due to its tall plant height and leafy component, which resulted in a shading effect on the intercropped legume crops [42]. Figure 2C shows mono common bean had the highest CPY (2.67 t ha−1) compared with other treatments. Maize–common bean mixture cropping had higher CPY than sole maize. This result was consistent with that of Amole et al. [43], who reported that CPY increased in maize intercropped with climbing bean and lablab bean forages compared with monoculture maize.
Land equivalent ratio was significantly affected by cropping treatments. LER, averaged over years, ranged from 1.0 (monocropped species) to 1.46 (maize–common bean mixed cropping treatments, Figure 3). The highest LER value was found in a 50:50 maize–common bean mixed cropping treatment as compared with monocropped maize and other mixed cropping treatments. In the current study, LER values greater than 1.0 indicated the higher productivity of land for mixed cropping (maize–common bean) compared with monocrop treatments. Abera et al. [44] reported the high yield and economic advantages of maize mixed with common bean cropping with LER values ranging from 1.40 to 2.41. Our findings are in contrast to the above-mentioned result of LER values, which could be correlated with the different growing conditions. The high LER indicates a production in conjunction with the improvement of crop population densities and natural resources used as compared with the component of each monocropped species.

3.2. Chemical Composition of Forages

In the present study, we found that the chemical composition of forage was significantly affected by planting different mixture ratios (Table 1). However, the highest values of CF (28.80%), WSC (8.00%), NDF (43.19%), and ADF (24.20%) were recorded in the maize–common bean ratio of 100:00, and the values decreased significantly by reducing maize level and increasing the common bean ratios. The lowest values of these chemical compositions were observed in 0:100 maize–common bean mixed cropping treatment. On the other hand, these values were increased with the decreasing density of maize. Moreover, 0:100 maize–common bean ratio showed the best results for CP (12.86%) and ADL (5.28%) as compared with other treatments. Strydhorst et al. [45] reported that legume–cereal mixtures have been increased through CP yield, relative to sole cereal crops. Our results indicated that the mixed cropping of maize with legumes increased the CP of forage. Proper CP levels are essential in forages for many types of livestock that rely on them for nutrition [40]. The CFA and CA contents did not significantly differ (p > 0.05) among the maize–common bean mixture ratios, which were consistent with our results [40].

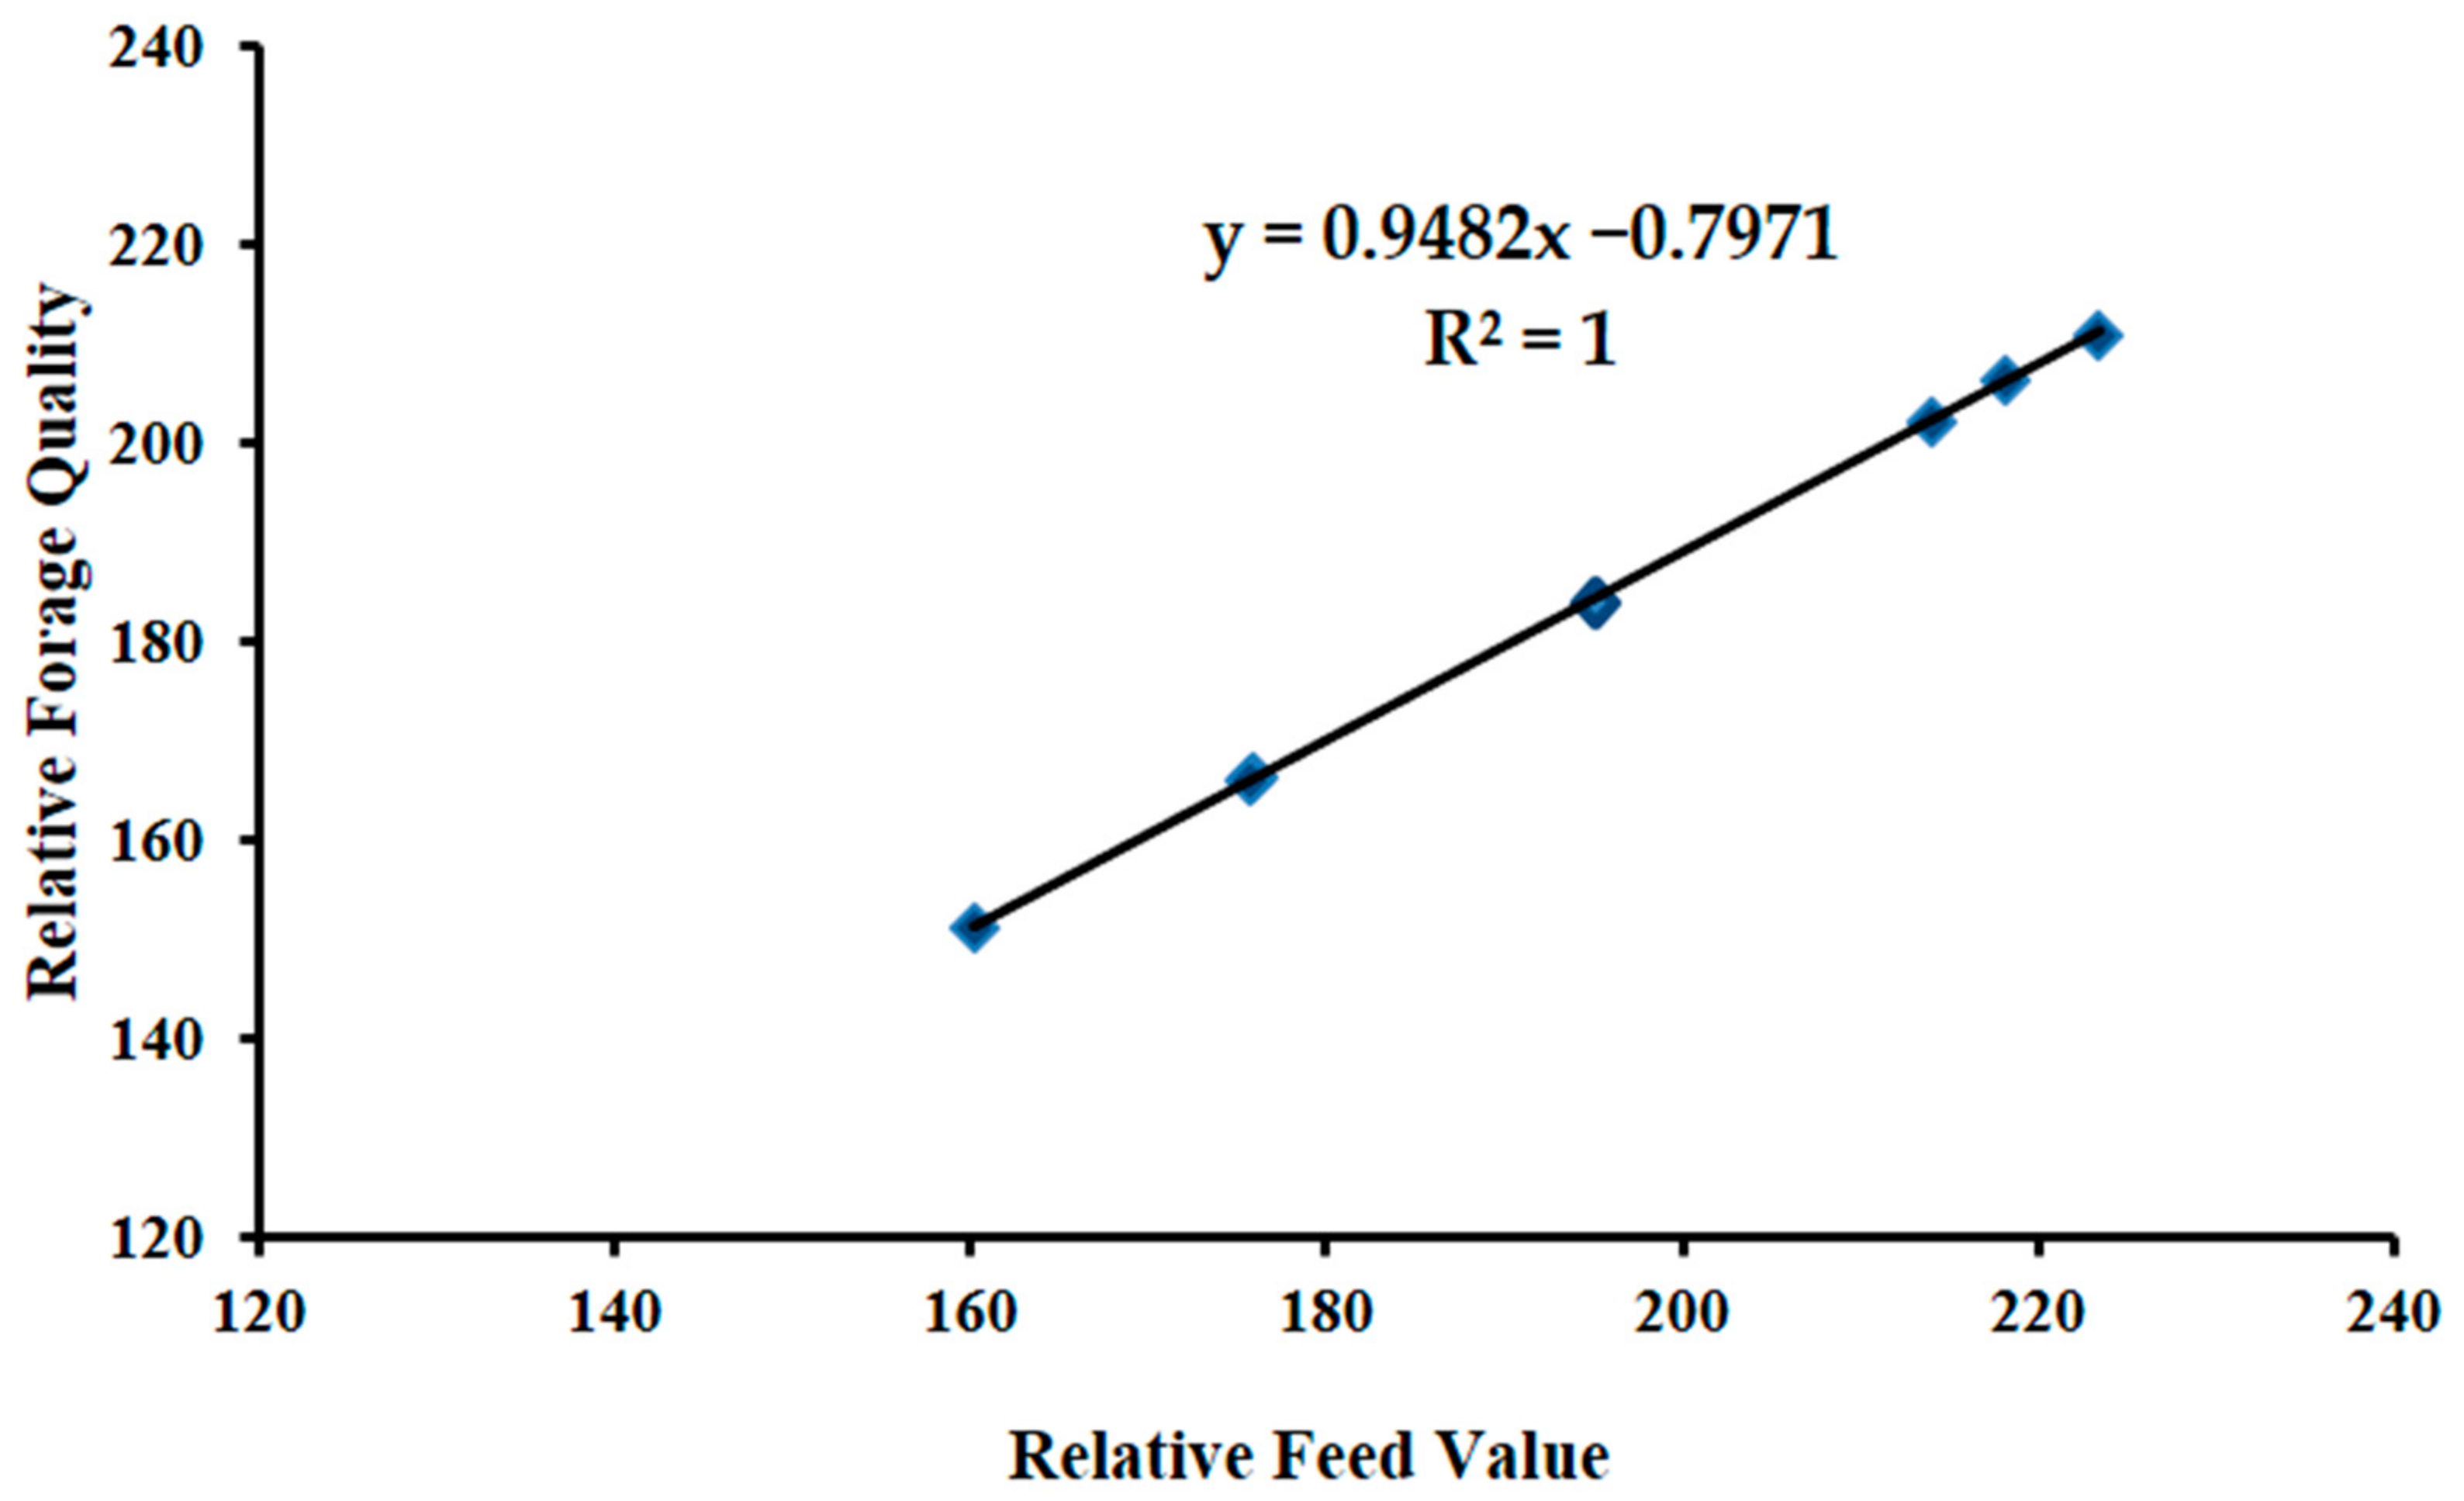
3.3. Laboratory Forage Quality Analysis

Laboratory quality analysis of maize–common bean forages at different mixture ratios is summarized in Table 2. The highest values of pH (4.00%), TDN (73.66%), RFQ (223.37), RFV (209.02), and DMI (3.73) were recorded in the maize–common bean ratio of 25:75. Monocropped maize (100:0) had lower pH (3.60%), RFQ (165.28), RFV (150.94), DDM (70.04), and DMI (2.78) than other monocropped common bean and mixture treatments. However, these values decreased with the decrease of ratios of common bean in mixtures. DM and pH were used in the determination of the FP index in forage quality analysis. In our current study, monocropped maize (100:0 seeding ratio) had a higher FP value (121.20) than other treatments. Our results showed TDN that was greater than 70% was supreme for forage quality. RFQ values of 100:0, 75:50, and 50:50 ratios of maize–common bean were fall in 100–200, which was the recommended quality of forage livestock feeding, particularly for 18–24 months, of mature female cattle or dry cow [46].

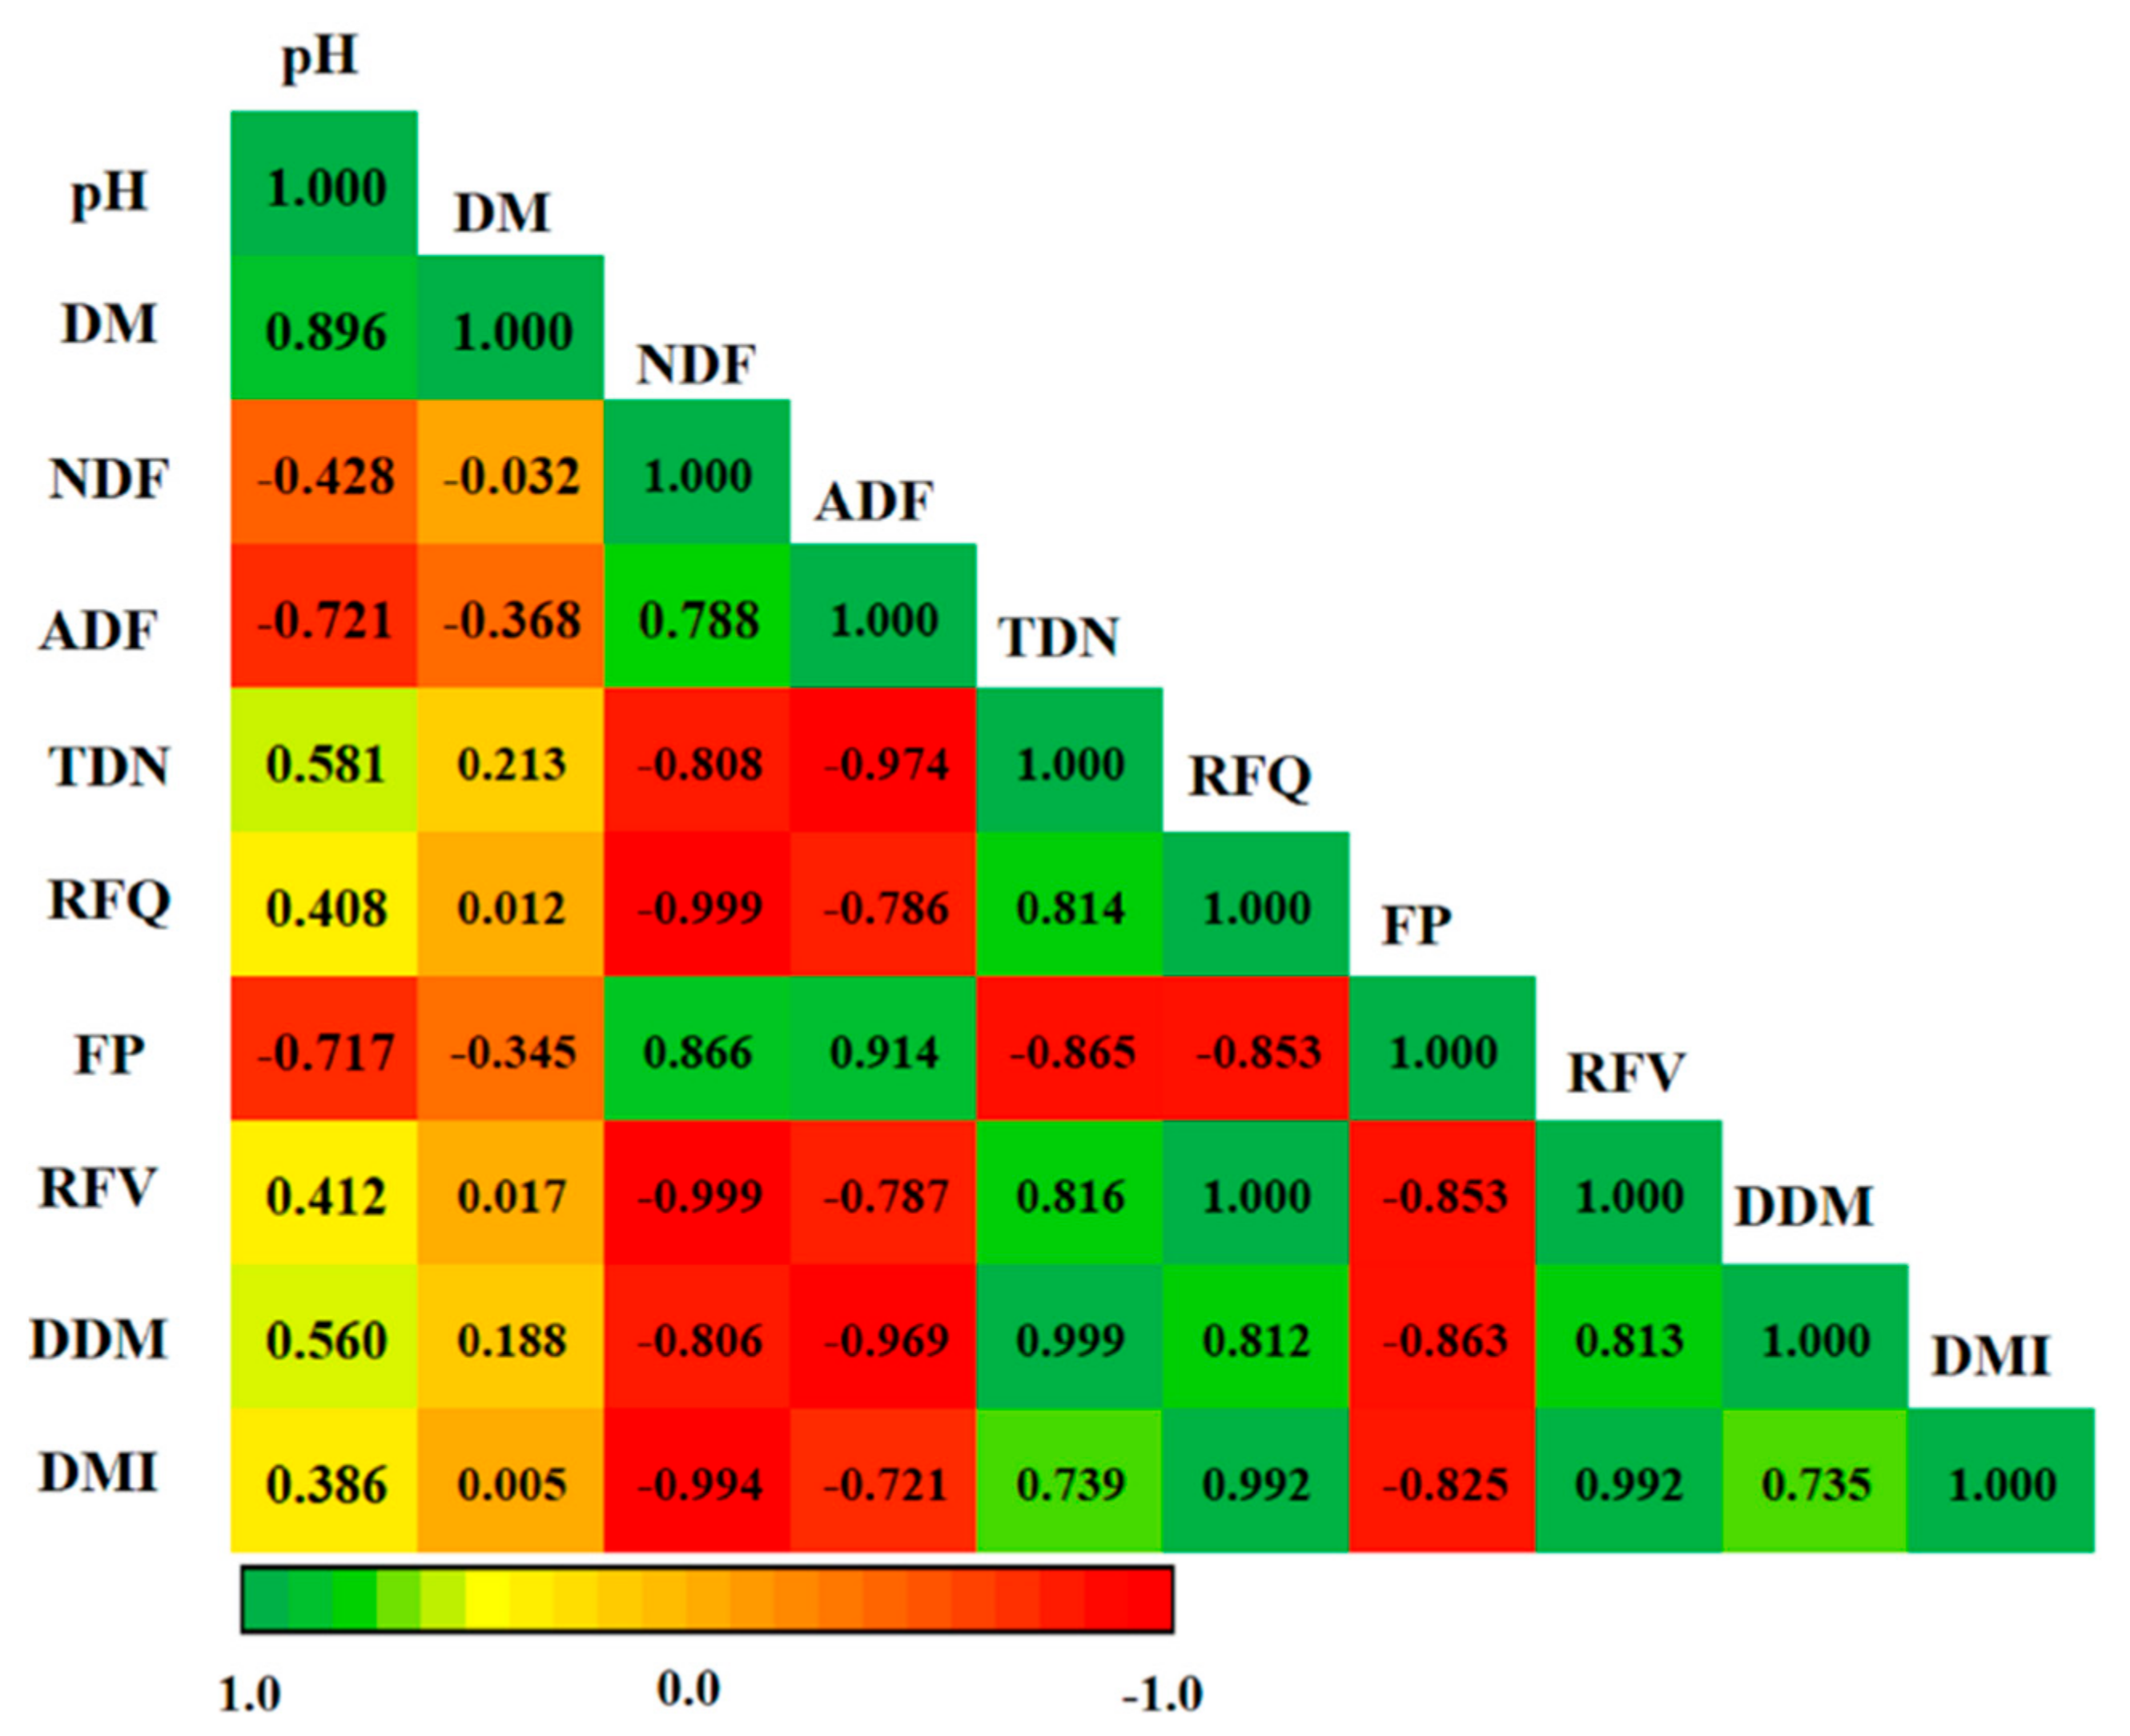
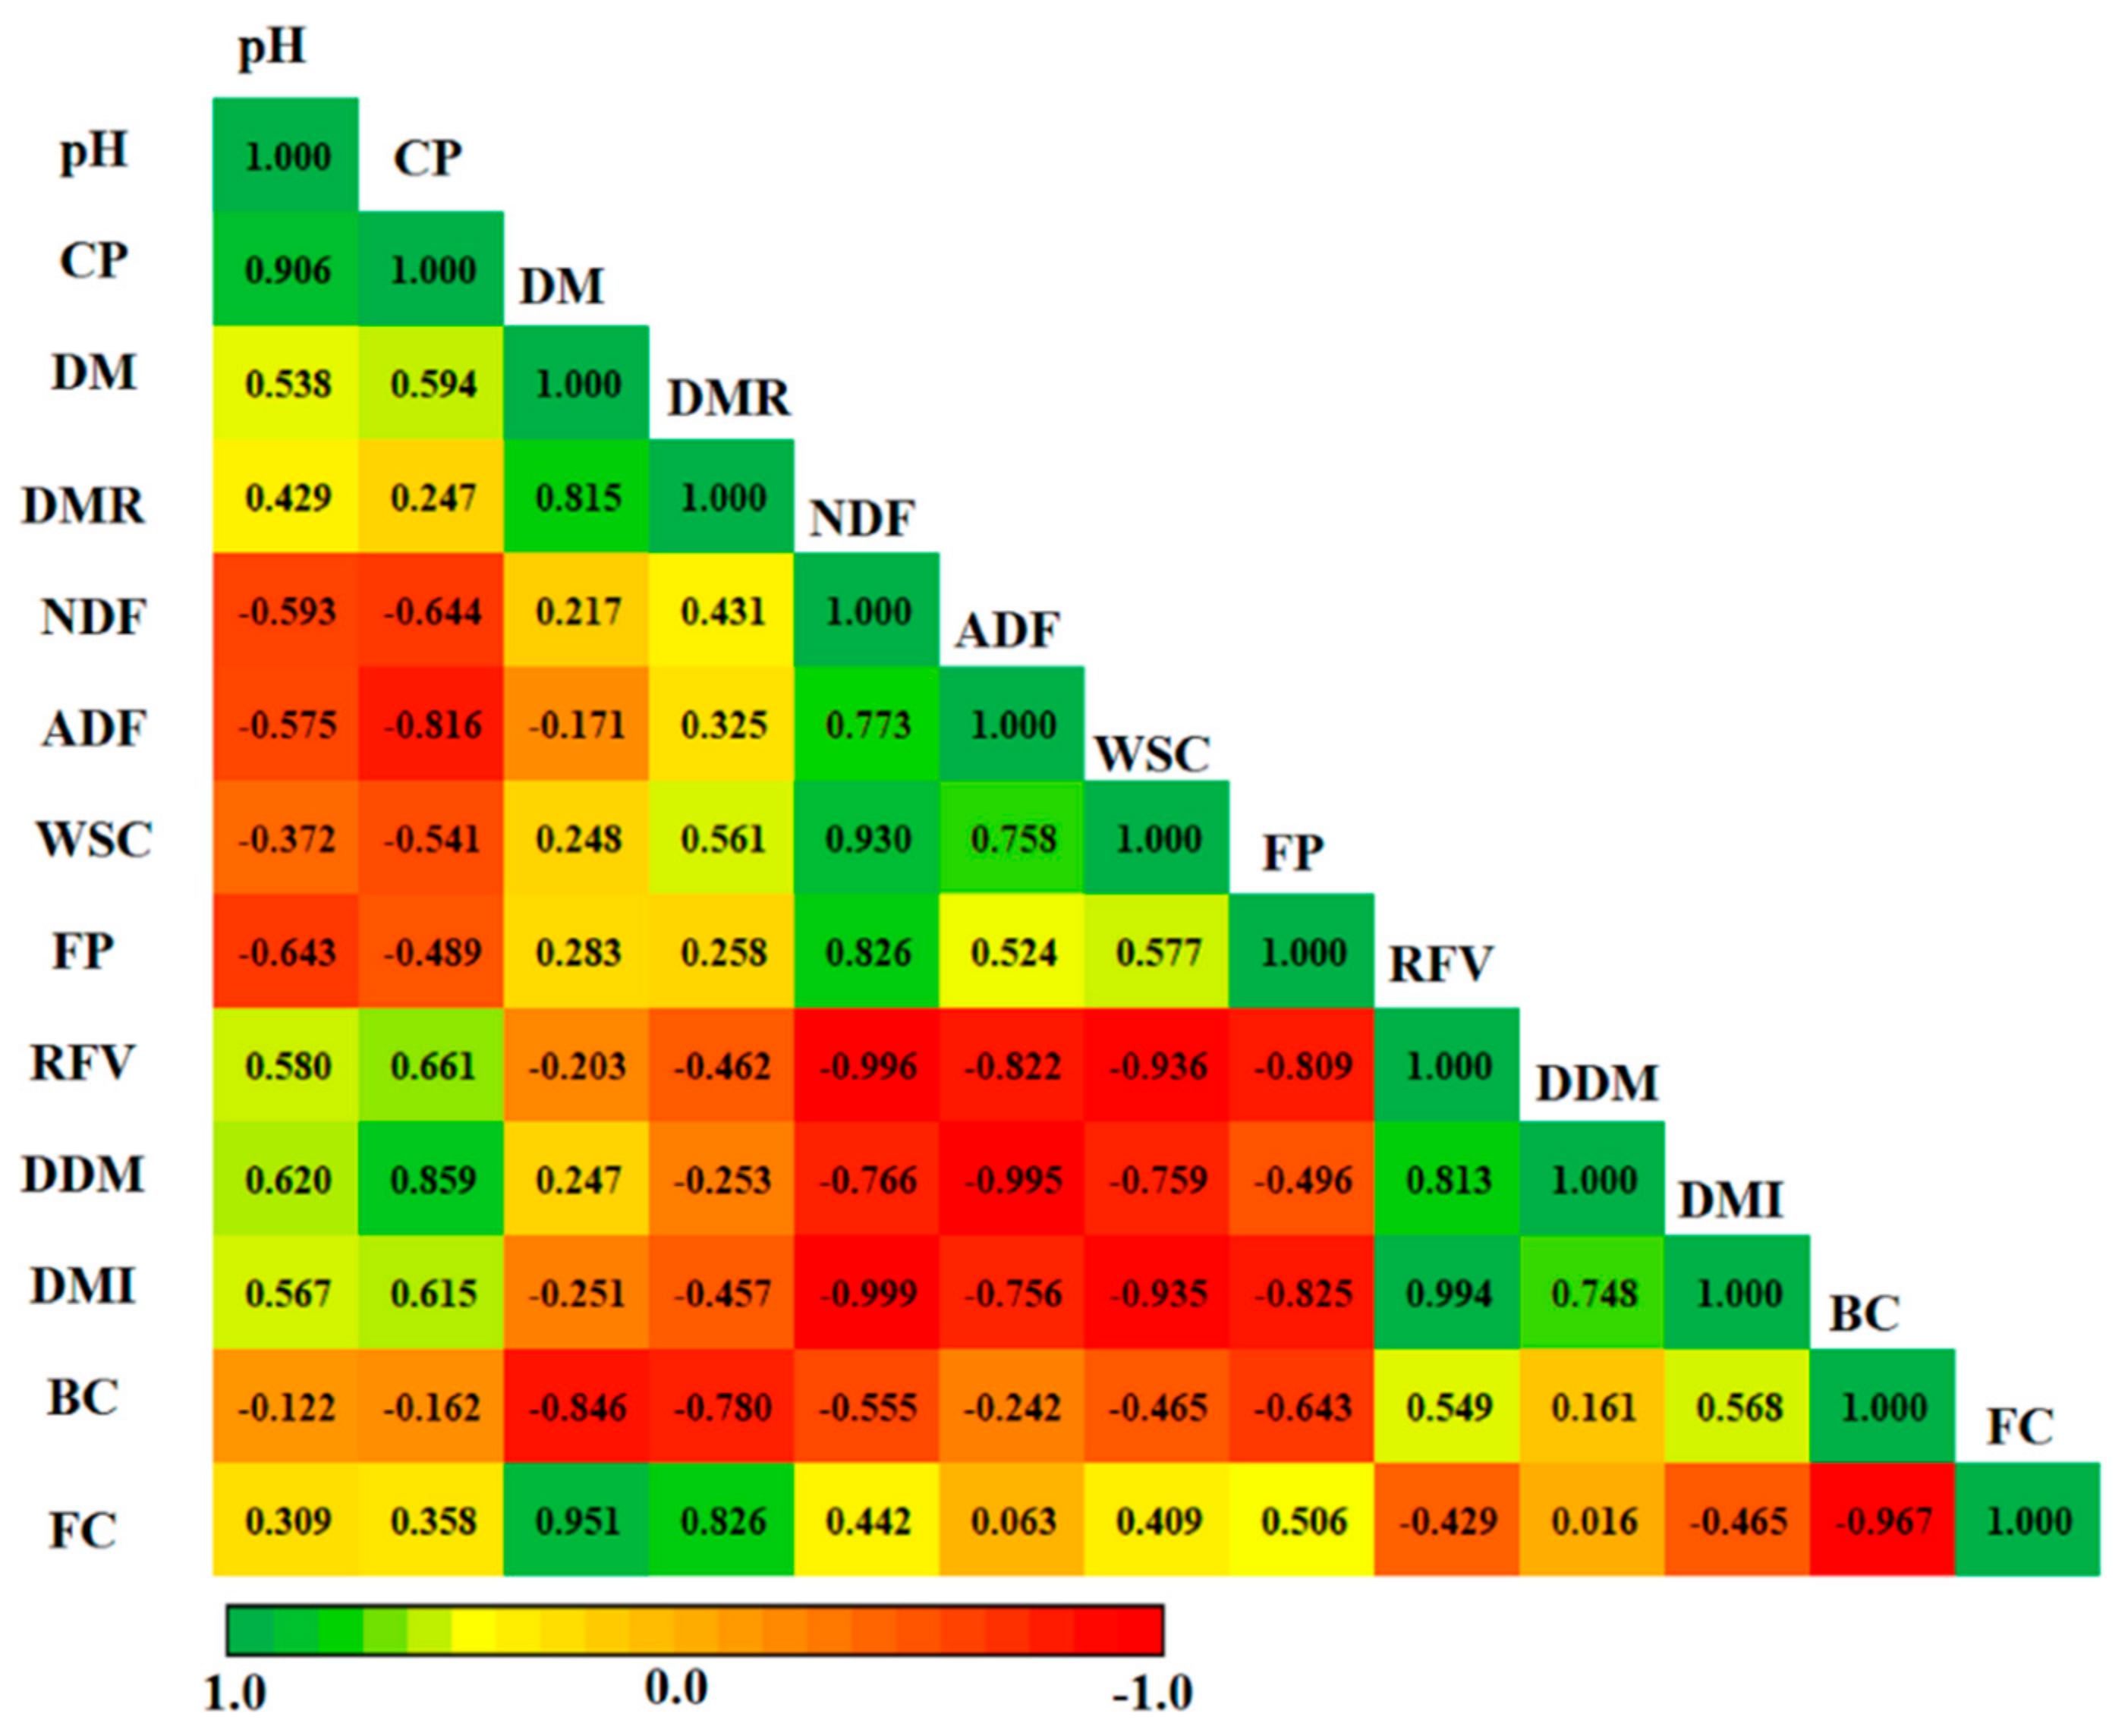
3.4. Correlation between Proximate Composition and Quality Traits of Fodder

The Pearson correlation results between proximate composition and quality traits of maize fodder are shown in Figure 4. The DM content was positively correlated with pH (r = 0.896). TDN had a highly negative correlation with ADF (r = −0.974). RFQ is an updated version of RFV, which was developed by the University of Wisconsin and measured for fiber digestibility and quantity analyses [46]. The RFQ had a strong negative correlation with NDF (r = −0.999) and a highly positive association with TDN (r = 0.814). FP showed a highly positive correlation with NDF (r = 0.866) and ADF (r = 0.914) and highly negative association with TDN (r = −0.865) and RFQ (r = −0.853). RFV was strongly and negatively correlated with NDF (r = −0.999). Furthermore, RFV had a strongly significant positive correlation with RFQ (r = 1.000) (Figure 5). The DDM was strongly and negatively associated with ADF (r = −0.968). In addition, the DDM had a positive relationship with RFV, and it showed a negative correlation with ADF, which was consistent with other studies [30]. In the present study, DDM also showed a strong and positive correlation with TDN (r = 0.999). The DMI showed a significant negative correlation with NDF (r = −0.994). Moreover, DMI had a strong and significant positive correlation with RFQ (r = 0.992) and RFV (r = 0.992).

3.5. Organic Acid Profile of Silages

The organic acid profiles were also significantly influenced by the maize–common bean mixture ratios after 60 days of fermentation in our study (Table 3). Organic acids could not only promote silage aerobic stability but also decreased the development of molds and yeast in ensiled forages [47]. Based on the overall organic acid profile analysis, the highest values of pH (4.39%), LA (7.33%), AA (1.52%), BA (2.21%), and AN (10.58%) were recorded in the maize–common bean ratio of 25:75. On the contrary, pH, LA, AA, and AN were decreased in monocropped maize with decreasing ratios of common bean in mixtures. Different mixture ratios also affected the ratio of LA:AA, and the highest LA:AA ratio (16.86) was found at the monocropped maize treatment of 100:0 compared with other mixed cropping silages.

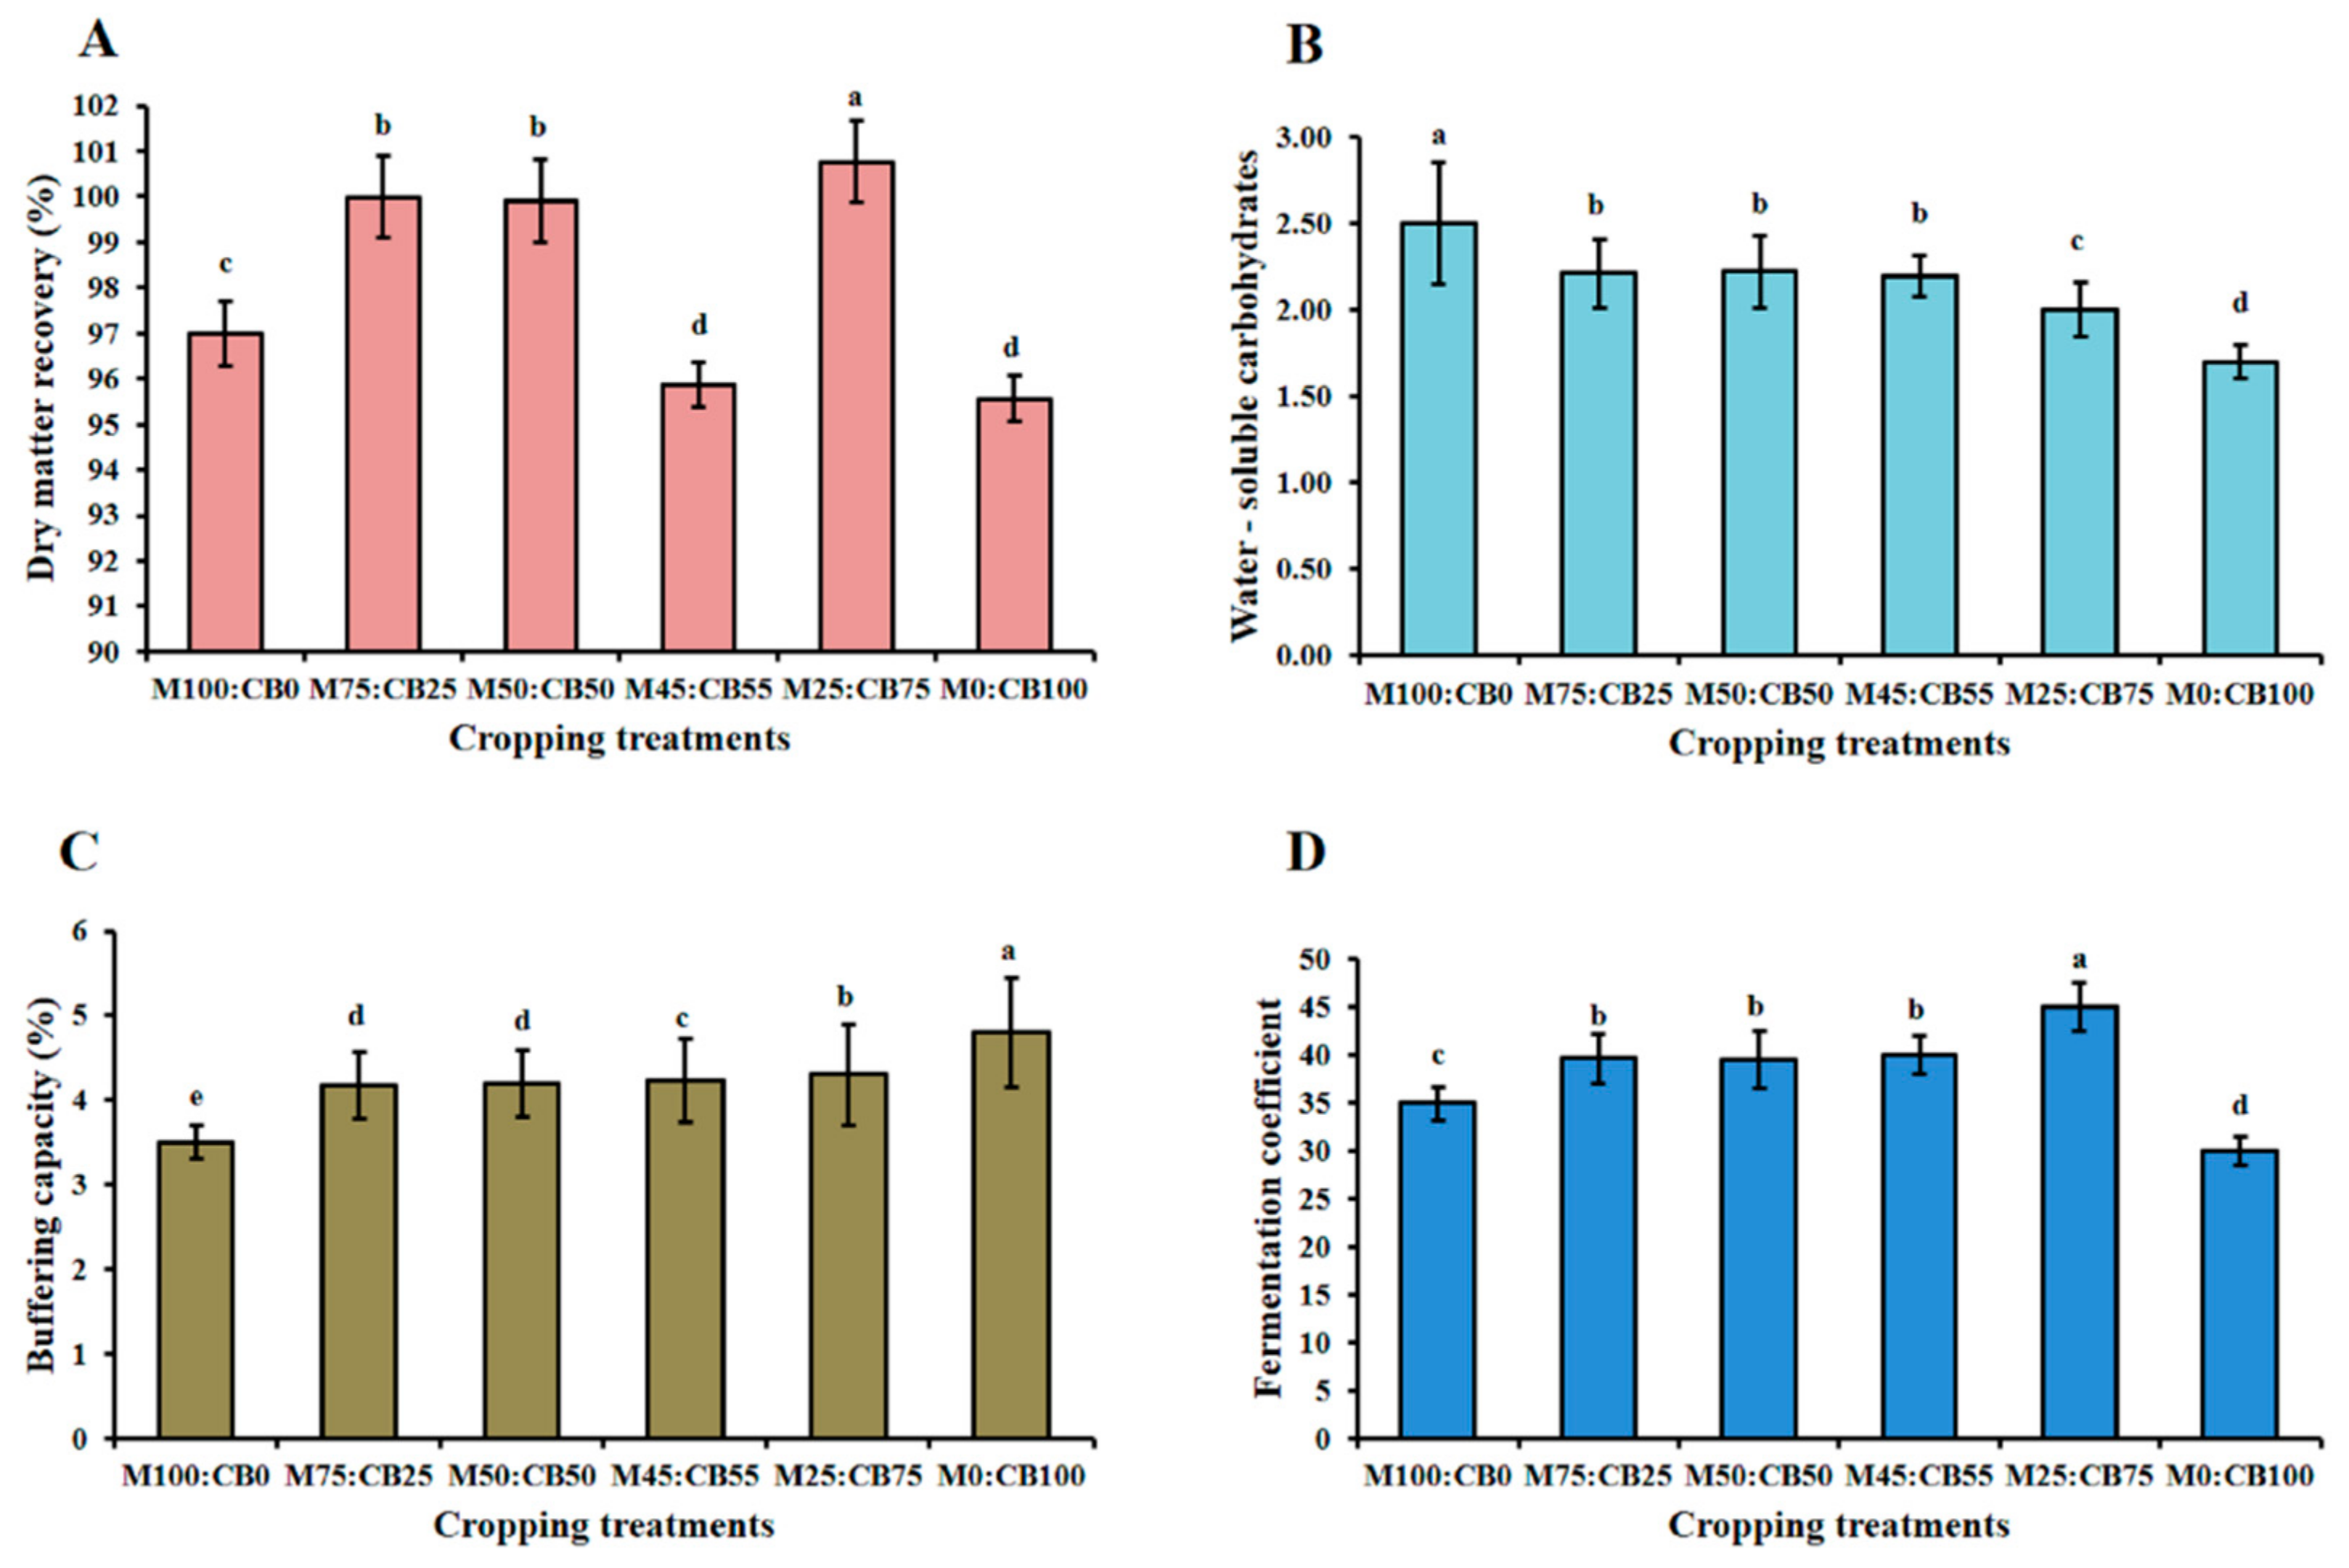
3.6. Fermentation Quality Traits of Silage

The results of fermentation quality of maize–common bean mixed cropping silages are listed in Table 4. In the present study, all the treatments of FP values were higher than 80, which was preferable for silage quality in feeding ruminants [34]. RFV values of 100:0, 75:25, and 50:50 ratio of maize–common bean were 165.42, 176.09, and 174.61, respectively; the results were recommended for quality silage for feeding of 18–24 months female cattle or dry cow [46].
The DMR was used to determine the increase of silage feed quality for ruminants by intercropping with several legumes [22]. The highest DMR content was found in 25:75 of maize–common bean ratio (100.76%, Figure 6A). The WSC content is important not only for the preservation of forage in the form of silage but also for good fermentation quality of silage [22]. The WSC content of different silages ranged from 1.91% to 2.50% after fermentation, and the monocropped maize showed the highest WSC content (2.50%) compared with other treatments (Figure 6B). This result was similar to that of Liu et al. [11], who reported that silage-specific maize had the highest WSC content. As shown in Figure 6C, BC content was higher in monocropped common bean (4.80%), whereas monocropped maize had the lowest content of BC (3.50%). Artabandhu et al. [48] reported that legumes with high content of BC and low level of WSC intercropped with maize for silages. In our current study, the percentage of FC content was preferable by mixed-cropping of maize with common bean to upgrade the fermentation quality of silage. The 25:75 seed ratio of maize–common bean treatment had the highest FC (45.61%) content, and the monocropped common bean had the lowest FC (30.35%) content (Figure 6D). Several studies have reported that mixed-intercropping of maize with legumes for silage was crucial for improving FC and other chemical compositions in silages [8,49].

3.7. Chemical Composition of Maize–Common Bean Mixtures of Silages

The different seed mixtures showed significant influences on silage chemical compositions (Table 5). The chemical traits of silage followed the nutritional traits of forage, due to the interaction effects of maize and common bean as mixtures and sole crop. The highest values of CP (14.69%) and ADL (3.36%) were found at 0:100 of maize–common ratio, but the values decreased with the increase in maize ratio in the mixture. On the other hand, the CF (%), NDF (%), and ADF (%) values were increased with the increase in maize proportions in the mixture. The highest values were found at 100:0 of maize–common ratio (sole maize). In contrast, the values of those nutritional traits were decreased with the increased common bean ratio in the mixtures, and the lowest values were at 0:100 of maize–common ratio. Fischer et al. [50] and Sohail et al. [51] reported that the legumes increased the yields of CP of cereal–legume mixtures, and they produced high quality CP content. On the contrary, the increase in legume ratios caused a reduction in NDF and ADF contents for the cereal–legume mixtures [52]. In this experiment, a significant difference (p > 0.05) was not found in the percentage of CFA and CA contents among different silages. These results were consistent with that of Nurk et al. [53], who reported that such contents were not significantly different in the research of maize intercropped with bean. Consequently, maize–common bean mixed-cropping silages were also favorable to meet the nutrient requirement for dairy feeding, which may provide alternative quality silage for the livestock industry.

3.8. Analysis of Pearson Correlation between Proximate Compositions and Quality Traits in Cereal–Legume Mixtures of Silages

In examining the relationship between proximate compositions and silage quality traits, Pearson correlation analysis was performed (Figure 7). Based on correlation analysis, a highly positive correlation between pH and CP was found (r = 0.906). The NDF content had a strongly positive correlation with WSC (r = 0.930) and highly positive correlation with FP (r = 0.826). FP, which is an excellent quality index, was determined to evaluate the fermentation characteristics of maize and legume silage [54]. FP also had a negative correlation with CP (r = −0.489), which was consistent in different carbohydrate sources of alfalfa silage at different fermentation periods [55]. The results indicated that RFV had a strongly negative correlation with NDF (r = −0.996) and WSC (r = −0.936) and highly negative correlation with ADF (r = −0.822). The DDM content had a highly positive correlation with CP (r = 0.859) and RFV (r = 0.813). On the contrary, DDM was strongly and negatively correlated with ADF (r = −0.995). DMI was strongly and negatively correlated with NDF (r = −0.999) and WSC (r = −0.935). Moreover, the DMI was strongly and positively correlated with RFV (r = 0.994). The result was similar to that of Kızılşımşek et al. [36], who reported that DDM and DMI were positively correlated with silage feed quality of maize intercropped with some legume crops. The BC tended to be negatively correlated with DM (r = −0.846). The FC value had a strongly positive correlation with DM (r = 0.951) and strongly negative association with BC (r = −0.967). This result was similar to that reported by Knicky and Spörndly et al. [33]. Furthermore, DM had a positive relationship with FC in studying the effects of different additives on the quality of silages fermented from various animal forage crops [56].

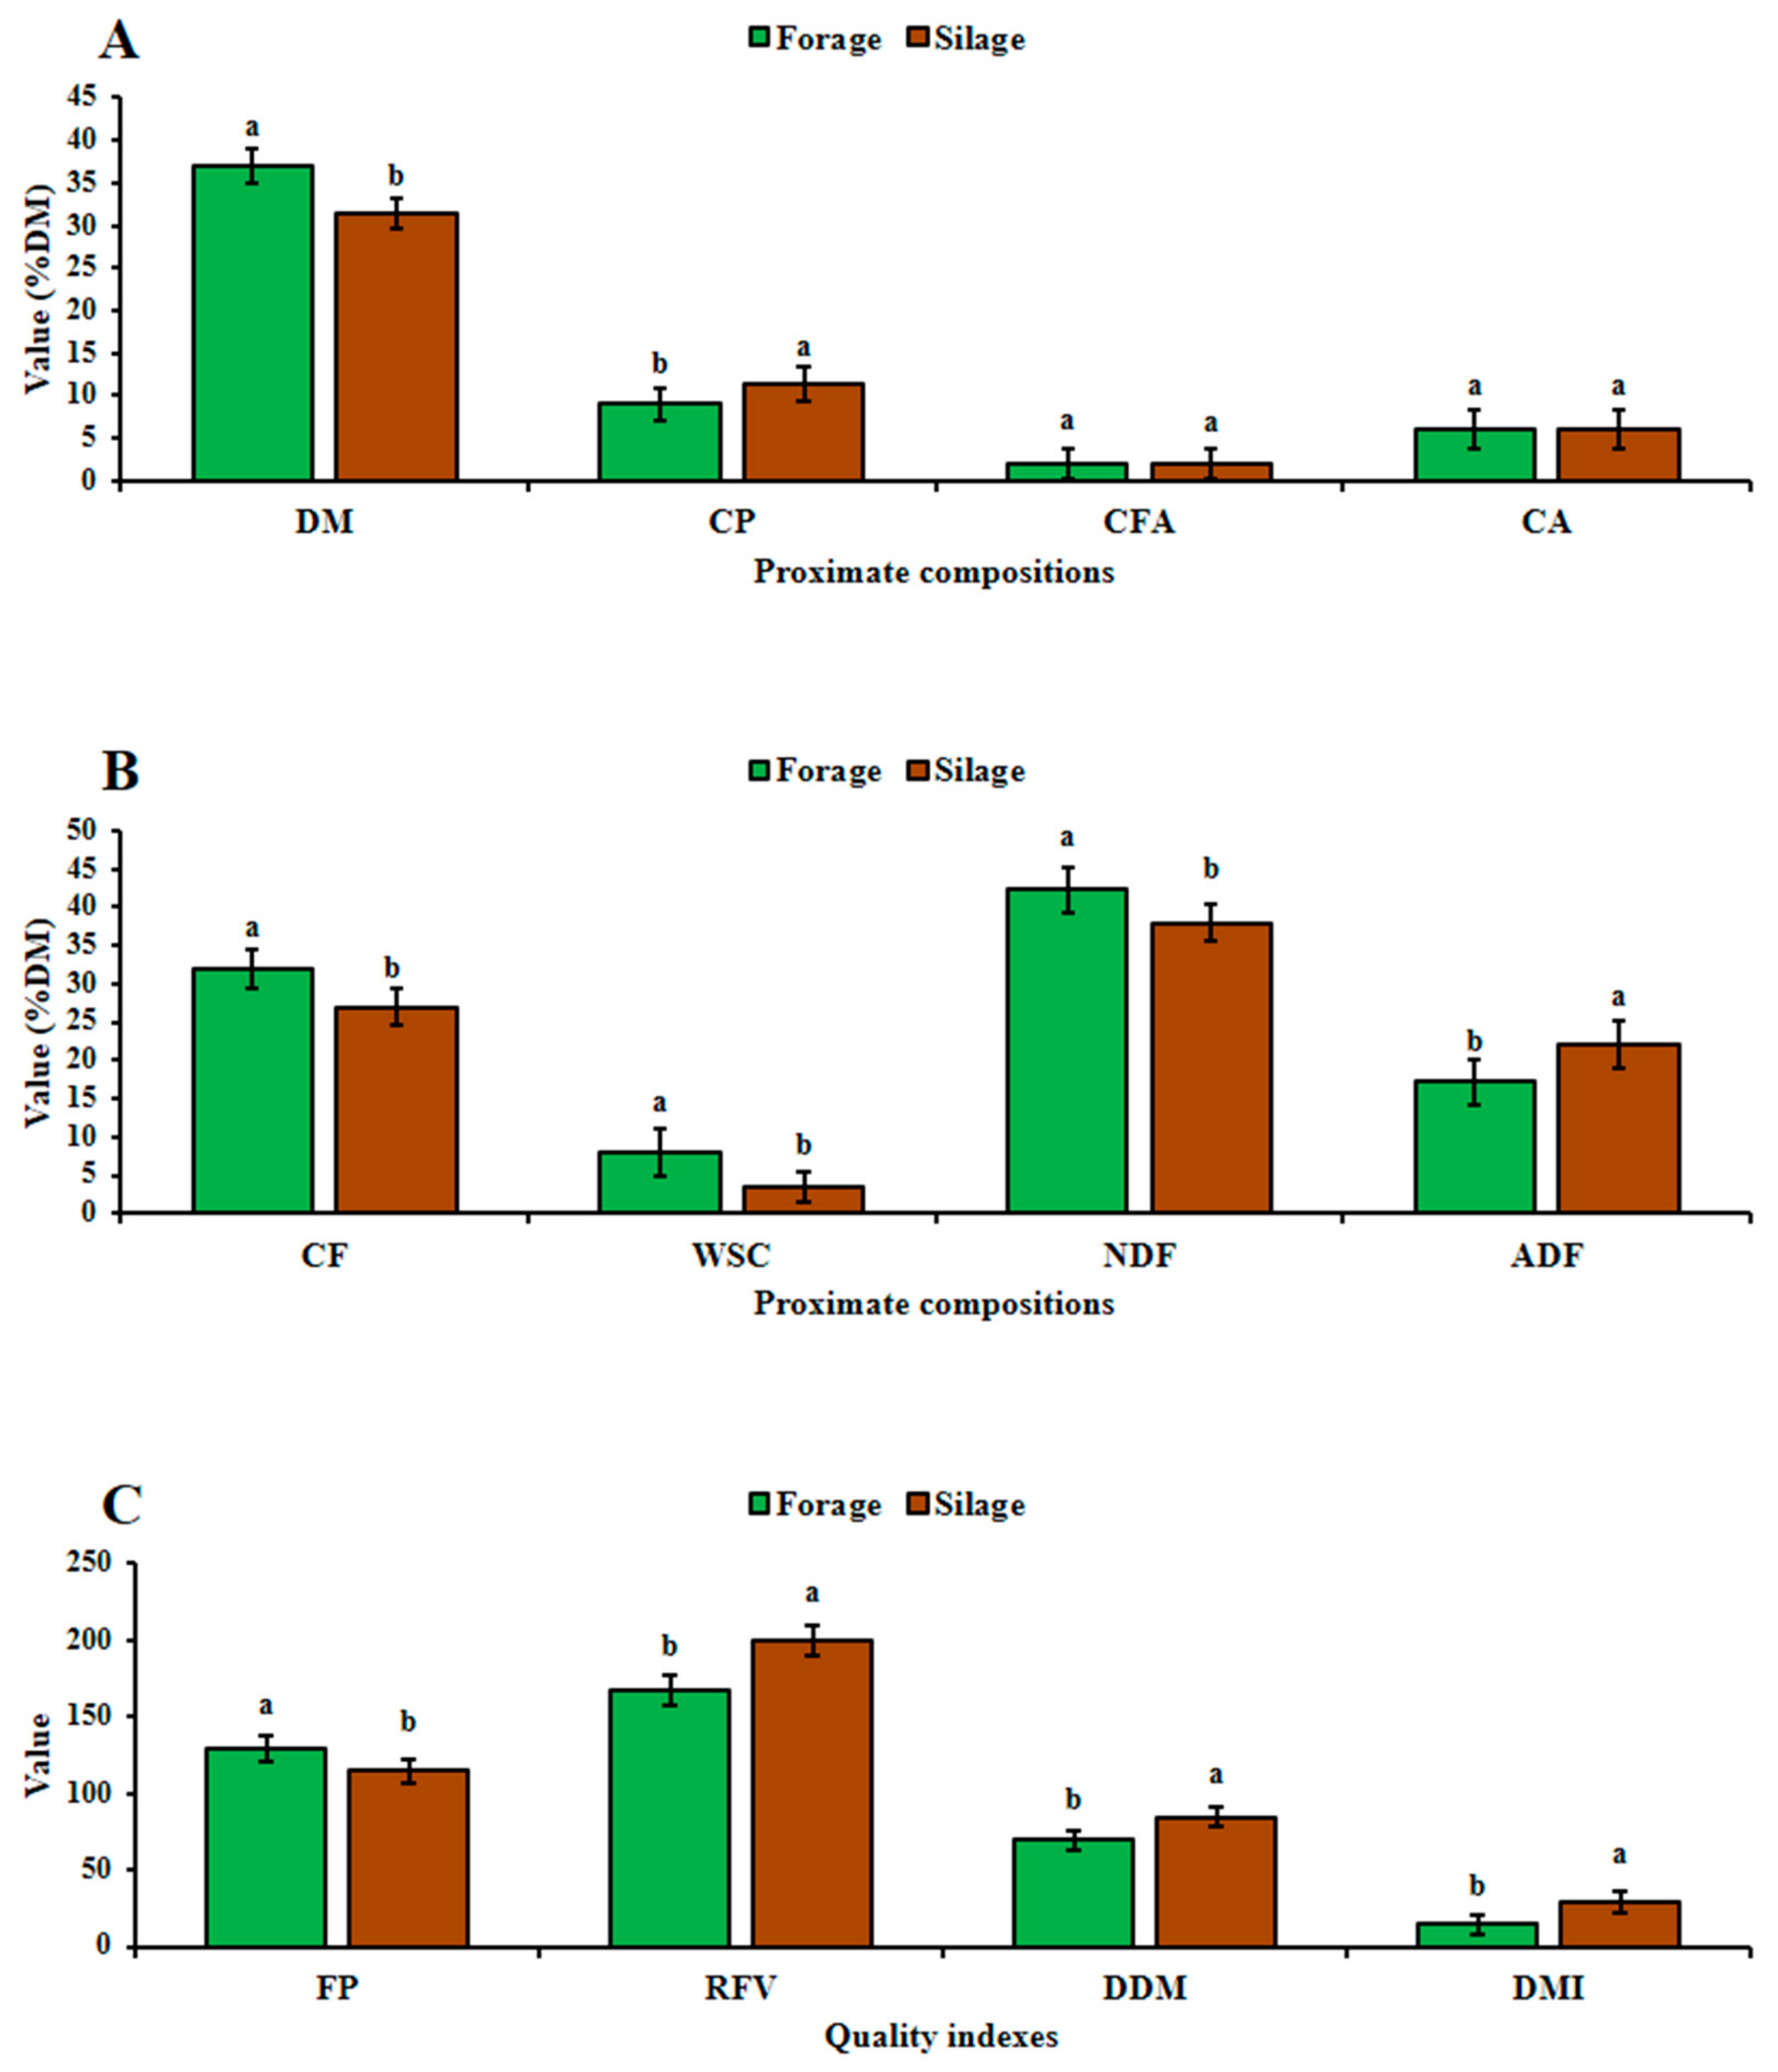
3.9. Comparisons of Chemical Compositions and Quality Parameters of Forage and Silage

It was found that the DM (35.2%), CF (32.60%), WSC (8.0%), and NDF (42.33%) content were higher (p < 0.01) in forage than in silage based on the results (Figure 8A,B), which were consistent with previous studies in the determination of mixed-cropping of maize with legume forage [8,57]. The CP (11.41%) and ADF (22.00%) contents were higher in silage than forage (Figure 8A,B). CFA and CA contents between the forage and silage did not significantly differ in our findings, and this result was consistent with other findings in the research of maize intercropped with bean and soybean [40,58]. With regard to laboratory quality parameter analysis, the FP value (130) was higher in forage than in silage (Figure 8C). The results showed that RFV (200.04), DDM (85.00%), and DMI (30.00%) contents were higher in silage than in forage, which were consistent with several studies reporting that the RFV, DDM, and DMI values of silage were significantly different from those of forage [36,59]. After comparing the forage and silage of mixed-cropped maize–common bean between chemical compositions and quality parameter analysis, silage had a higher CP content and forage quality index.

4. Conclusions

The results of this study indicated that mixed cropping of maize and common bean at the seeding ratios of 100:0, 75:25, 50:50, 45:55, 25:75, and 0:100 affects the forage yield and quality, chemical composition, and fermentation quality traits of forage and silage in Northwestern Loess Plateau region. This crop combination can be used as a nutritionally rich source of feed for ruminants. Pearson correlation analysis indicated the strong positive correlation of RFV with RFQ in maize–common bean mixed-cropping fodders. In mixtures, the common bean supports more improved quality proteins than maize. By contrast, maize increased the fresh biomass productions, water-soluble carbohydrate, and fiber contents. The results showed that a mixture of maize with common bean at a ratio of 25:75 and 50:50 was superior in forage and silage quality traits. Therefore, mixed cropping of maize and common bean at 25:75 and 50:50 seeding ratios is recommended to obtain the nutritional composition and quality trait of forage and silage. These results can provide important additional information and benefit for livestock farmers or small holders growing forage in Loess Plateau region in making silage without using silage additives and inoculants. The current research work should be extended to different agro-climatic zones in Loess Plateau region to verify whether or not 25:75 and 50:50 are the suitable mixture ratios for proximate composition, nutrient contents, and fermentation quality traits of forage and silage in the livestock industry. In addition, feeding experiments are required to verify the above-mentioned conclusion in combination with the good nutritional quality of forage and silage production and animal performance.

Author Contributions

Conceptualization, M.N.S.H. and B.F.; Formal analysis, M.N.S.H.; Investigation, M.N.S.H. and H.W.; Methodology, M.N.S.H.; Project administration, B.F.; Writing—original draft, M.N.S.H.; Writing—review and editing, M.N.S.H., V.Y. and T.S. All authors have read and agreed to the published version of the manuscript.

Funding

This work was supported by the National Key Research and Development Program of China (Nos. 2019YFD1000700 and 2019YFD1000702), the National Natural Science Foundation of China (31371529), the National Science and Technology Supporting Plan (2014BAD07B03), the Shaanxi Province Key Research and Development Project (2018TSCXL-NY-03-01), and the Shaanxi Agricultural Collaborative Innovation and Extension Alliance Project (LMZD201803).

Institutional Review Board Statement

Not applicable.

Informed Consent Statement

Not applicable.

Data Availability Statement

All obtained data is enclosed with this manuscript.

Acknowledgments

The authors express their special gratitude to all the funding sources for the financial assistance and also thankful to the anonymous reviewers for their constructive and valuable comments on earlier versions of this research article.

Conflicts of Interest

The authors declare that they have no conflict of interest.

References

  1. Alhassan, A.M.; Yang, C.; Ma, W.; Li, G. Influence of conservation tillage on Greenhouse gas fluxes and crop productivity in spring-wheat agroecosystems on the Loess Plateau of China. PeerJ 2021, 9, e11064. [Google Scholar] [CrossRef] [PubMed]
  2. Yu, Y.; Zhao, W.; Juan, F.; Martinez-Murillo Pereira, P. Loess Plateau: From degradation to restoration. Sci. Total Environ. 2020, 738, 140206. [Google Scholar] [CrossRef] [PubMed]
  3. FAO (Food and Agriculture Organization). Online Statistical Database: Food Balance. 2017. Available online: http://www.fao.org/statistics.amis-outlook.org/data/index.html (accessed on 3 April 2017).
  4. Gerrit, K. Growing Silage Corn in China: Three Key Reference Points in Silage Corn Assessment Energy Yield, Energy Density and Starch Yield. Agropages, Seed Special. 2017. Available online: https://news.agropages.com/News/NewsDetail---21994-e.htm (accessed on 4 May 2017).
  5. NBCS (National Bureau of Statistics of China). China’s Economy Realized a Moderate but Stable and Sound Growth. 2016. Available online: http://gov.cn/english/pressrelease/201601/t20161306072.html (accessed on 19 January 2016).
  6. Bilal, A.K.; Adnan, M.; Rehman, F.U.; Hasnain, A.; Usman, M.; Javed, M.S.; Aziz, A.; Ahmad, R. Role of silage in agriculture: A Review. Green Rep. 2021, 2, 9–12. [Google Scholar]
  7. Babu, S.; Singh, R.; Yadav, D.; Rathore, S.S.; Raj, R.; Avasthe, R.; Yadav, S.K.; Das, A.; Yadav, V.; Yadav, B.; et al. Nanofertilizers for agricultural and environmental sustainability. Chemosphere 2022, 292, 133451. [Google Scholar] [CrossRef]
  8. Javanmard, A.; Machiani, M.A.; Lithourgidis, A.; Morshedloo, M.R.; Ostadi, A. Intercropping of maize with legumes: A cleaner strategy for improving the quantity and quality of forage. Clean. Eng. Technol. 2020, 1, 100003. [Google Scholar] [CrossRef]
  9. Nasar, J.; Alam, A.; Nasar, A.; Khan, M.Z. Intercropping induce changes in above and below ground plant compartments in mixed cropping system. Biomed. J. Sci. Tech. Res. 2019, 17, 13043–13050. [Google Scholar] [CrossRef]
  10. Álvarez, S.; Méndez, P.; Martínez-Fernández, A. Silage fermentation and chemical composition of Chamaecitysus proliferus var. Palmensis (Tagasaste) and Pennisetum sp. (Maralfalfa) using different additives. J. Anim. Plant. Sci. 2020, 31, 929–936. [Google Scholar]
  11. Liu, Y.; Wang, G.; Wu, H.; Meng, Q.; Khan, M.Z.; Zhou, Z. Effect of hybrid type on fermentation and nutritional parameters of whole plant corn silage. Animals 2021, 11, 1587. [Google Scholar] [CrossRef]
  12. Panwar, A.S.; Shamim, M.; Babu, S.; Ravishankar, N.; Prusty, A.K.; Alam, N.M.; Singh, D.K.; Bindhu, J.S.; Kaur, J.; Dashora, L.N.; et al. Enhancement in productivity, nutrients use efficiency and economics of rice-wheat cropping systems in India through Farmer’s participatory approach. Sustainability 2019, 11, 122. [Google Scholar] [CrossRef] [Green Version]
  13. Soufan, W.; Al-Suhaibani, N.A. Optimizing yield and quality of silage and hay for pea-bearly mixtures ratio under irrigated arid environments. Sustainability 2021, 13, 13621. [Google Scholar] [CrossRef]
  14. Yadav, G.S.; Babu, S.; Das, A.; Mohapatra, K.P.; Singh, R.; Avasthe, R.K.; Roy, S. No till and mulching enhance energy use efficiency and reduce carbon footprint of a direct-seeded upland rice production system. J. Clean. Prod. 2020, 271, 122700. [Google Scholar] [CrossRef]
  15. Klima, K.; Synowiec, A.; Puła, J.; Chowaniak, M.; Puzy’nska, K.; Gala-Czekaj, D.; Kliszcz, A.; Galbas, P.; Jop, B.; Dabkowska, T. Long-term productive, competitive, and economic aspects of spring cereal mixtures in integrated and organic crop rotations. Agriculture 2020, 10, 231. [Google Scholar] [CrossRef]
  16. Akdeniz, H.; Hosafliŏglu, I.; Koç, A.; Hossain, A.; Islam, M.S.; IqbaL, M.A.; Imtiaz, H.; Gharib, H.; El Sabagh, A. Evaluation of herbage yield and nutritive value of eight forage crop species. Appl. Ecol. Environ. Res. 2019, 17, 5571–5581. [Google Scholar] [CrossRef]
  17. Agegnehu, G.; Ghizaw, A.; Sinebo, W. Yield performance and land-use efficiency of barley and faba bean mixed cropping in Ethiopian highlands. Eur. J. Agron. 2006, 25, 202207. [Google Scholar] [CrossRef]
  18. Iqbal, M.A.; Hamid, A.; Ahmad, T.; Siddiqui, M.H.; Hussain, I.; Ali, S.; Ali, A.; Ahmad, Z. Forage sorghum-legumes intercropping: Effect on growth, yields, nutritional quality and economics returns. Bragantia 2018, 78, 82–95. [Google Scholar] [CrossRef]
  19. Malhi, S.S. Improving crop yield, N uptake and economic returns by intercropping barley or canola with pea. Agric. Sci. 2012, 3, 1023–1033. [Google Scholar] [CrossRef] [Green Version]
  20. Yadav, G.S.; Das, A.; Kandpal, B.K.; Babu, S.; Lal, R.; Datta, M.; Das, B.; Singh, R.; Singh, V.K.; Mohapatra, K.P.; et al. The food-energy-water-carbon nexus in a maize-maize-mustard cropping sequence of the Indian Himalayas: An impact of tillage-cum-live mulching. Renew. Sust. Energ. Rev. 2021, 151, 111602. [Google Scholar] [CrossRef]
  21. Vicente ER, S.; Kuwahara, F.A.; Feba, L.T.; Silva PC, G.; Moro, E. Yield of sorghum silage intercropped with pigeon pea and marandu grass in two spacings and chemical composition before and after ensiling. Aust. J. Crop Sci. 2019, 13, 1416–1421. [Google Scholar] [CrossRef]
  22. Muck, R.E.; Nadeau EM, G.; McAllister, T.A.; Contreras-Govea, F.E.; Santos, M.C.; Kung, L. Silage review: Recent advances and future uses of silages additives. J. Dairy Sci. 2018, 101, 3980–4000. [Google Scholar] [CrossRef]
  23. Kashif, A.; Wang, W.Y.; Ahmad, K.; Ren, G.X.; Sajjad, Z.; Tanveer, A.S.; Feng, Y.Z.; Yang, G.H. Straw mulching with fertilizer nitrogen: An approach for improving crop yield, soil nutrients and enzyme activities. Soil Use Manag. 2019, 35, 526–535. [Google Scholar]
  24. Piper, C.S. Soil and Plant Analysis; Scientific Publishers: Jodhpur, India, 2017; Available online: https://www.abebooks.com/book-search/title/soil and plant analysis /author/ piper-c-s (accessed on 22 January 2017).
  25. Begna, S.; Angadi, S.; Mesbah, A.; Umesh, R.M.; Stamm, M. Forage yield and quality of winter canola-pea mixed cropping system. Sustainability 2021, 13, 2122. [Google Scholar] [CrossRef]
  26. Stamm, M.; Berrada, A.; Buck, J.; Cabot, P.; Claassen, M.; Cramer, G.; Dooley, S.J.; Godsey, C.; Heer, W.; Holman, J. Registration of Riley winter canola. J. Plant Reg. 2012, 6, 243–245. [Google Scholar] [CrossRef]
  27. Matsoukis, A.D.; Chronopoulou-Sereli, G. Environmental conditions and drenched-applied paclobutrazol effects on lantana specific leaf area and N, P, K and Mg content. Chil. J. Agric. Res. 2014, 74, 117–122. [Google Scholar] [CrossRef] [Green Version]
  28. AOAC. Official Methods of Analysis, 17th ed.; Association of Official Analytical Chemists: Gaithersburg, MD, USA, 2000. [Google Scholar]
  29. Van Soest, P.J.; Robertson, J.B.; Lewis, B.A. Methods for dietary fiber, neutral detergent fiber and nonstarch polysaccharides in relation to animal nutrition. J. Dairy. Sci. 1991, 74, 3583–3597. [Google Scholar] [CrossRef]
  30. Undersander, D. The new relative forage quality index-concepts and use. In World’s Forage Superbowl Contest; University of Wisconsin-Extension: Madison, WI, USA, 2003. [Google Scholar]
  31. Murphy, R.P. A method for the extraction of plant samples and the determination of total soluble carbohydrates. J. Sci. Food Agric. 1958, 9, 714–717. [Google Scholar] [CrossRef]
  32. Wang, Z.; Bao, X.; Li, X.; Jin, X.; Zhao, J.; Sun, J.; Christie, P. Intercropping maintains soil fertility in terms of chemical properties and enzyme activities on a timescale of one decade. Plant Soil 2015, 391, 265–282. [Google Scholar] [CrossRef]
  33. Knicky, M.; Spörndly, R. The ensiling capability of a mixture of sodium benzoate, potassium sorbate, and sodium nitrite. J. Dairy Sci. 2011, 94, 824–831. [Google Scholar] [CrossRef] [Green Version]
  34. Kilic, A. Silo Feed (Instruction, Education and Application Proposals); Bilgehan Press: Lzmir, Turkey, 1986; p. 327. [Google Scholar]
  35. Jeranyama, P.; Garcia, A.D. Understanding Relative Feed Value (RFV) and Relative Forage Quality (RFQ); SDSU: Brookings, SD, USA, 2004; Available online: http://openprairie.sdstate.edu/extension_extra/352 (accessed on 1 August 2004).
  36. Kızılşımşek, M.; Günaydın, T.; Aslan, A.; Keklikve, K.; Açıkgöz, H. Improving silage feed quality of maize intercropped with some legumes. Türk Tarım Doğa Bilimleri Derg. 2020, 7, 165–169. [Google Scholar] [CrossRef] [Green Version]
  37. He, L.; Zhou, W.; Wang, Y.; Wang, C.; Chen, X.; Zhang, Q. Effect of applying lactic acid bacteria and cellulose on the fermentation quality, nutritive value, tannins profile and in vitro digestibility of Neolamarckia cadamba leaves silage. J. Anim. Physiol. Anim. Nutr. 2018, 102, 1429–1436. [Google Scholar] [CrossRef]
  38. Broderick, G.A.; Kang, J.H. Automated simultaneous determination of ammonia and total amino acids in ruminal fluid and in vitro media. J. Dairy Sci. 1980, 63, 64–75. [Google Scholar] [CrossRef]
  39. Jamshidi, K.; Yousefi, A.R.; Oveisi, M. Effect of cowpea (Vigna unguiculata) intercropping on weed biomass and maize (Zea mays) yield. N. Z. J. Crop Hortic. Sci. 2013, 41, 180–188. [Google Scholar] [CrossRef] [Green Version]
  40. Soe Htet, M.N.; Hai, J.-B.; Bo, P.T.; Gong, X.-W.; Liu, C.-J.; Dang, K.; Tian, L.-X.; Soomro, R.N.; Aung, K.L.; Feng, B.-L. Evaluation of nutritive values through comparison of forage yield and silage quality of mono-cropped and intercropped maize-soybean harvested at two maturity stages. Agriculture 2021, 11, 452. [Google Scholar] [CrossRef]
  41. Geren, H.; Avcioglu, R.; Soya, H.; Kir, B. Intercropping of corn with cowpea and bean biomass yield and silage quality. Afr. J. Biotechnol. 2008, 22, 4100–4104. [Google Scholar]
  42. Htet, M.N.S.; Soomro, R.N.; Bo, H.J. Effects of different planting pattern of maize (Zea mays L.) and soybean (Glycine max (L.) Merrill) intercropping in resource consumption on fodder yield, and silage quality. Am. J. Plant. Sci. 2017, 8, 666–679. [Google Scholar] [CrossRef] [Green Version]
  43. Amole, T.A.; Oduguwa, B.O.; Jolaosho, A.O.; Arigbede, M.O.; Olanite, J.A.; Dele, P.A.; Ojo, V.O.A. Nutrient composition and forage yield, nutritive quality of silage produced from maize-lablab mixture. Mal. J. Anim. Sci. 2013, 16, 45–61. [Google Scholar] [CrossRef]
  44. Abera, H.; Mesfin, K.; Adera, S. Maize (Zea mays L.)-common bean (Phaseolus vulgaris L.) Intercropping response to population density of component crop in Wolaita Zone Southern Ethiopia. J. Nat. Sci. Res. 2016, 6, 69–74. [Google Scholar]
  45. Strydhorst, S.M.; King, J.R.; Lopetinsky, K.J.; Harker, K.N. Forage potential of intercropping barley with faba bean, lupin, or field pea. Agron. J. 2008, 100, 182–190. [Google Scholar] [CrossRef]
  46. Schroeder, J.W. Quality Forage AS1250: Forage Nutrition for Ruminants; North Dakota State University, United State of Agriculture Cooperating: Fargo, ND, USA, 2006. [Google Scholar]
  47. Wilkinson, J.M.; Davies, D.R. Review paper: The aerobic stability of silage: Key findings and recent developments. Grass Forage Sci. 2013, 68, 1–19. [Google Scholar] [CrossRef]
  48. Artabandhu, S. Silage for climate resilient small ruminant production. In Ruminants- The Husbandry Economic and Health Aspects; InTech: Rijeka, Croatia, 2018; Available online: http://intechopen.com/silage-for-climate-resilient-small-ruminant-production (accessed on 25 April 2018).
  49. Wang, M.; Gao, R.; Franco, M.; Hannaway, D.B.; Ke, W.; Ding, Z.; Yu, Z.; Guo, X. Effect of mixing alfalfa with whole-plant corn in different proportions on fermentation characteristics and bacterial community of silages. Agriculture 2021, 11, 174. [Google Scholar] [CrossRef]
  50. Fischer, J.; Böhm, H.; Jürgen, H. Maize-bean intercropping yields in Northern Germany are comparable to those of pure silage maize. Eur. J. Agron. 2020, 112, 125947. [Google Scholar] [CrossRef]
  51. Sohail, S.; Ansar, M.; Skalicky, M.; Wasaya, A.; Soufan, W.; Ahmad Yasir, T.; El-Shehawi, A.M.; Brestic, M.; Sohidul Islam, M.; Ali Raza, M.; et al. Influence of Tillage Systems and Cereals–Legume Mixture on Fodder Yield, Quality and Net Returns under Rainfed Conditions. Sustainability 2021, 13, 2172. [Google Scholar] [CrossRef]
  52. Aasen, A.; Baron, V.S.; Clayton, G.W.; Dick, A.C.; McCartney, D.H. Swath grazing potential of spring cereals, field pea and mixtures with other species. Can. J. Plant Sci. 2004, 84, 1051–1058. [Google Scholar]
  53. Nurk, L.; Graβ, R.; Pekrun, C.; Wachendorf, M. Methane yield and feed quality parameters of mixed silages from maize (Zea mays L.) and common bean (Phaseolus vulgaris L.). Bioeng. Res. 2017, 10, 64–73. [Google Scholar] [CrossRef]
  54. Konca, Y.; Beyzi, S.B.; Paffetti, M.A.G.; Ulger, I.; Sohel, M.M.H. Effects of easy soluble carbohydrate and bacterial inoculant supplementations on silage quality of frosted maize. Acta. Sci. Anim. Sci. 2017, 40, 39513. [Google Scholar] [CrossRef] [Green Version]
  55. Gao, R.; Wang, B.; Jia, T.; Luo, Y.; Yu, Z. Effects of different carbohydrate sources on alfalfa silage quality at different ensiling days. Agriculture 2021, 11, 58. [Google Scholar] [CrossRef]
  56. Ferraretto, L.F.; Shaver, R.D.; Luck, B.D. Silage review: Recent advances and future technologies for whole-plant and fractionated corn silage harvesting. J. Dairy Sci. 2018, 101, 3937–3951. [Google Scholar] [CrossRef] [PubMed]
  57. Uher, D.; Svečnjak, Z.; Svečnjak, Z.; Dujmovic-Purgar, D.; Jareš, D.; Horvatic, I. Influence of intercropping maize with climbing bean on forage yield and quality. Agron. Int. J. 2019, 4, 60–67. [Google Scholar] [CrossRef]
  58. Getahun, A.; Abady, S. Effect of maize (Zea may L.) on bean (Phaseolus vulgaris L.) yield and its components in maize-bean intercropping. Int. J. Sci. Res. 2016, 5, 126–133. [Google Scholar]
  59. Tharangani, R.M.H.; Yakun, C.; Zhao, L.S.; Ma, L.; Liu, H.L.; Su, S.L.; Shan, L.; Yang, Z.N.; Kononoff, P.J.; William, P.W.; et al. Corn silage quality index: An index combining milk yield, silage nutritional and fermentation parameters. Anim. Feed Sci. Technol. 2021, 273, 114817. [Google Scholar] [CrossRef]
Figure 1. Monthly precipitations (A) and average temperatures (B) of field experiments during the growing seasons in 2019 and 2020.
Sustainability 14 06022 g001
Figure 2. Fresh fodder yield (A), dry matter yield (B), and crude protein yield (C) as affected by maize (M) and common bean (CB) in mono-and mixed-cropping at different seeding ratios: M:CB at 100:0, 75:25, 50:50, 45:55, 25:75, and 0:100, respectively. Means are averaged over 2 years and four replicates. Vertical bars indicate the standard error. Different letters represent significant differences among cropping treatments at p < 0.05.
Sustainability 14 06022 g002
Figure 3. Land equivalent ratio (LER) as affected by maize (M) and common bean (CB) in mono-and mixed-cropping at different seeding ratios: M:CB at 100:0, 75:25, 50:50, 45:55, 25:75, and 0:100, respectively. Means are averaged over 2 years and four replicates. Vertical bars indicate the standard error. Different letters represent significant differences among cropping treatments at p < 0.05.
Sustainability 14 06022 g003
Figure 4. Pearson correlation between the proximate composition and quality traits of maize–common bean mixed-cropping forages. DM: dry matter, NDF: neutral detergent fiber, ADF: acid detergent fiber, TDN, total digestible nutrients, RFQ: relative forage quality, FP: Fleig’s point, RFV: relative feed value, DDM: digestible dry matter, DMI: dry matter intake. The numbers in each field represent the correlation extent; the color represents significant correlation (p < 0.05); the deeper the color of the field is, the more significant the correlation (p < 0.01). The green color means a positive correlation, and the red color means a negative correlation.
Sustainability 14 06022 g004
Figure 5. Comparison of relative forage quality (RFQ) and relative feed value (RFV) of maize–common bean mixed-cropping forages.
Sustainability 14 06022 g005
Figure 6. Dry matter recovery (A), Water-soluble carbohydrates (B), Buffering capacity (C), and Fermentation coefficient (D) as affected by maize (M) and common bean (CB) in mono-and mixed cropping at different seeding ratios: M:CB at 100:0, 75:25, 50:50, 45:55, 25:75, and 0:100, respectively. Means are averaged over 2 years and four replicates. Vertical bars indicate the standard error. Different letters represent significant differences among cropping treatments at p < 0.05.
Sustainability 14 06022 g006
Figure 7. Pearson correlation between the proximate composition and quality traits of maize–common bean mixed-cropping silages. CP: crude protein, DM: dry matter, DMR: dry matter recovery, NDF: neutral detergent fiber, ADF: acid detergent fiber, WSC: water-soluble carbohydrate, FP: Fleig’s point, RFV: relative feed value, DDM: digestible dry matter, DMI: dry matter intake, BC: buffering capacity, FC: fermentation coefficient. The numbers in each field represent the correlation extent; the color represents significant correlation (p < 0.05), the deeper the color of the field is, the more significant the correlation (p < 0.01). The green color means a positive correlation, and the red color means a negative correlation.
Sustainability 14 06022 g007
Figure 8. Proximate compositions (A,B) and quality indexes (C) as affected by maize (M) and common bean (CB) in mono-and mixed cropping at different seeding ratios. DM: dry matter, CP: crude protein, CFA: crude fat, CA: crude ash, CF: crude fiber, WSC: water-soluble carbohydrate, NDF: neutral detergent fiber, ADF: acid detergent fiber, FP: Fleig’s point, RFV: relative feed value, DDM: digestible dry matter, DMI: dry matter intake. Means are averaged over 2 years and four replicates. Vertical bars indicate the standard error. Different letters represent significant differences among cropping treatments at p < 0.05. Treatment means with same letters under a given proximate compositions and quality indexes are not significantly different from each at a probability level of 0.05.
Sustainability 14 06022 g008
Table 1. Effect of mixture ratio (maize–common bean) on the chemical composition of forages (%DM).
TreatmentsDM (%)CP (%)CFA (%)CA (%)CF (%)WSC (%)NDF (%)ADF (%)ADL (%)
M100:CB029.76d8.29d2.09a6.07a28.80a8.00a43.19a24.20a5.00c
M75:CB2535.20a10.09c2.06a6.09a28.57b7.07b40.09b21.43b5.17b
M50:CB5035.66a10.11c2.09a6.09a28.59b6.80c40.11b21.86b5.17b
M45:CB5533.69b10.16c2.09a6.09a28.55b6.90c32.69c21.21c5.18b
M25:CB7534.20b11.39b2.06a6.10a28.58b7.05b32.89c21.32c5.19b
M0:CB10031.06c12.86a2.09a6.06a25.60c6.17d31.53d20.09d5.28a
SEM0.170.010.040.110.070.060.130.20.02
LOS****nsns*******
M: maize, CB: common bean at 100:0, 75:25, 50:50, 45:55, 25:75, and 0:100 seeding ratios, respectively. DM: dry matter, CP: crude protein, CFA: crude fat, CA: crude ash, CF: crude fiber, WSC: water-soluble carbohydrates, NDF: neutral detergent fiber, ADF: acid detergent fiber, ADL: acid detergent lignin. SEM: standard error of means, LOS: level of significance, ns, not significant. * and **: significant differences at the 0.05 and 0.01 probability levels, respectively. Values followed by different letters are significantly different at the 0.05 probability level.
Table 2. Effect of mixture ratio (maize–common bean) on the quality traits of fresh forage.
TreatmentspHTDNRFQFPRFVDDMDMI
M100:CB03.60d73.13b165.28c121.20a150.94c70.04d2.78c
M75:CB254.01a73.38a177.78b116.40b166.81b72.21c2.98b
M50:CB504.02a73.29a176.97b115.20b165.47b71.87c2.97b
M45:CB553.95b73.26a219.18a114.80b207.45a72.37b3.68a
M25:CB754.00a73.66a223.37a113.92b209.02a72.29c3.73a
M0:CB1003.89c73.11b221.71a111.79c211.80a73.25a3.73a
SEM0.010.020.020.230.130.110.03
LOS*********
M: maize, CB: common bean at 100:0, 75:25, 50:50, 45:55, 25:75, and 0:100 seeding ratios, respectively. TDN: total digestible nutrients, RFQ: relative forage quality, FP: Flieg’s point, RFV: relative feed value, DDM: digestible dry matter, DMI: dry matter intake. SEM: standard error of means, LOS: level of significance. * and **: significant differences at the 0.05 and 0.01 probability levels, respectively. Values followed by different letters are significantly different at the 0.05 probability level.
Table 3. Effect of mixture ratio (maize–common bean) on the organic acid profile of silages (%DM).
TreatmentspH LAAABAPALA:AAAN
M100:CB03.89e4.89e0.29e1.00c0.90c16.86a8.11e
M75:CB254.09d7.23b1.31c1.29b1.21a5.52b9.00d
M50:CB504.12c7.11c1.33b1.31b1.22a5.35c9.02d
M45:CB554.20b6.90d1.30c1.19b1.19a5.30c10.43b
M25:CB754.39a7.33a1.52a2.21a1.18a4.82d10.58a
M0:CB1004.09d6.89d1.29d1.09c0.96b5.34c10.09c
SEM0.30.20.020.10.30.210.23
LOS**********
M: maize, CB: common bean at 100:0, 75:25, 50:50, 45:55, 25:75, and 0:100 seeding ratios, respectively. DM: dry matter, LA: lactic acid, AA: acetic acid, BA: butyric acid, PA: propionic acid, LA:AA: ratio of lactic acid and acetic acid, AN: ammonia-nitrogen. SEM: standard error of means, LOS: level of significance. * and **: significant differences at the 0.05 and 0.01 probability levels, respectively. Values followed by different letters are significantly different at the 0.05 probability level.
Table 4. Effect of mixture ratio (maize–common bean) on the fermentation quality traits of silages (%DM).
TreatmentsFPRFVDDMDMI
M100:CB0107.38b165.42d70.93e2.98d
M75:CB25112.04a176.09c73.71d3.08c
M50:CB50110.79a174.61c73.61d3.07c
M45:CB55100.55d215.02b76.88a3.80b
M25:CB7598.07d230.55a74.18c3.96a
M0:CB100103.33c231.47a74.70b4.03a
SEM1.210.280.130.17
LOS******
M: maize, CB: common bean at 100:0, 75:25, 50:50, 45:55, 25:75, and 0:100 seeding ratios, respectively. DM: dry matter, FP: Flieg’s point, RFV: relative feed value, DDM: digestible dry matter, DMI: dry matter intake. SEM: standard error of means, LOS: level of significance. * and **: significant differences at the 0.05 and 0.01 probability levels, respectively. Values followed by different letters are significantly different at the 0.05 probability level.
Table 5. Effect of mixture ratio (maize–common bean) on the chemical composition of silages (%DM).
TreatmentsDM (%)CP (%)CFA (%)CA (%)CF (%)NDF (%)ADF (%)ADL (%)
M100:CB029.13e8.90d2.20a7.04a28.80a40.20a22.20a3.11c
M75:CB2535.20a11.20c2.20a6.80a28.71c38.65c19.46c3.25b
M50:CB5035.45a11.21c2.20a6.96a28.75b39.21b19.65b3.25b
M45:CB5532.30c12.22c2.19a7.03a28.70c30.93d18.95d3.26b
M25:CB7534.13b12.25b2.19a6.74a28.75b32.09d19.19d3.26b
M0:CB10029.99d14.69a2.20a7.04a28.70c29.81e16.20e3.36a
SEM0.230.010.030.010.430.130.140.02
LOS****nsns*****
M: maize, CB: common bean at 100:0, 75:25, 50:50, 45:55, 25:75, and 0:100 seeding ratios, respectively. DM: dry matter, CP: crude protein, CFA: crude fat, CA: crude ash, CF: crude fiber, NDF: neutral detergent fiber, ADF: acid detergent fiber, ADL: acid detergent lignin. SEM: standard error of means, LOS: level of significance, ns: not significant. * and **: significant differences at the 0.05 and 0.01 probability levels, respectively. Values followed by different letters are significantly different at the 0.05 probability level.
Publisher’s Note: MDPI stays neutral with regard to jurisdictional claims in published maps and institutional affiliations.

